
Planting Cyperus esculentus augments soil microbial biomass and diversity, but not enzymatic activities
- Published
- Accepted
- Received
- Academic Editor
- Zarrin Basharat
- Subject Areas
- Agricultural Science, Ecology, Microbiology, Molecular Biology, Plant Science
- Keywords
- Cyperus esculentus, Soil microorganisms, Soil organic carbon, Semi-arid and arid regions, Soil enzymatic activities
- Copyright
- © 2022 Duan et al.
- Licence
- This is an open access article distributed under the terms of the Creative Commons Attribution License, which permits using, remixing, and building upon the work non-commercially, as long as it is properly attributed. For attribution, the original author(s), title, publication source (PeerJ) and either DOI or URL of the article must be cited.
- Cite this article
- 2022. Planting Cyperus esculentus augments soil microbial biomass and diversity, but not enzymatic activities. PeerJ 10:e14199 https://doi.org/10.7717/peerj.14199
Abstract
The planting of Cyperus esculentus, a member of the grass family Cyperaceae which includes nut sedge weeds, is being increasingly promoted in northern China’s semi-arid and arid regions. Yet the effects of planting C. esculentus upon soil quality and soil microbial characteristics of sandy land remain unclear. This study examined the short-term (1 year) impact of this grass species on soil microbial biomass indices, enzymatic activities, and microbiome characteristics in the Horqin Sandy Land area of China. The results show that planting C. esculentus could increase microbial biomass in the form of carbon (MBC), nitrogen (MBN), and phosphorus (MBP), but it negligibly influenced the enzymatic activities of soil β-1,4-glucosidase (BG), cellobiohydrolase (CBH), leucine aminopeptidase (LAP), and β-1,4-N-acetaminoglycosidase (NAG). Over 1 year, we found that planting C. esculentus significantly increased the soil bacterial richness and diversity of sandy land, yet also altered community composition of soil bacteria and eukaryotes in way that could promote their homogenization. In this respect, the relative abundances of Acidobacteria and Proteobacteria significantly decreased and increased, respectively; hence, they may be considered for use as important indicators of soil nutrient-rich conditions. Overall, the results could be explained by greater soil organic carbon (SOC) and total nitrogen (TN), mainly derived from cumulative plant litter input to soils, which then increased the sandy soil’s C:N ratio. Future research should focus on exploring the long-term effects of planting C. esculentus on soil quality and soil microbial characteristics of sandy lands in China and abroad.
Introduction
Cyperus esculentus, also known as chufa sedge, yellow nut sedge, tiger nut sedge, or earth almond, belongs to the grass family Cyperaceae. This plant species is a perennial weed native to the Mediterranean region, but has since spread globally, in part because of its well-developed root system, strong tillering ability, short growing period, large biomass, high oil content, strong resistance to stress, and a wide range of adaptive traits. Nevertheless, the tubers of C. esculentus are valued for their health and nutritive benefits (Asare et al., 2020; Oderinde & Tairu, 1988), and in recent years, the distribution of introduced C. esculentus has extended considerably in the semi-arid and arid regions of northern China. There, the total cultivated area of C. esculentus reached 6,886 km2 in 2021, mainly in the Inner Mongolia Autonomous Region, Xinjiang Uygur Autonomous Region, Liaoning Province, and Jilin Province, whose coverage is expected to continue expanding (Sha et al., 2022; Zhang & Wu, 2022). In these regions, C. esculentus is generally grown on sandy soil or sandy loam to conveniently harvest its valued tuberous roots, given the typically loose texture of sandy land. Surprisingly, however, the effects of planting C. esculentus on the soil quality of sandy land and its soil microbial characteristic are still poorly understood.
Soil microbes are indispensable components of terrestrial ecosystems and their biological characteristics, including diversity, community composition, biomass, quantity, and enzymatic activity, are highly sensitive to changing environmental conditions (Hu et al., 2019; Lange et al., 2015; Neilson et al., 2012; Yu et al., 2022). A meta-analysis of 81 available studies from 28 countries indicates that plant crops enhance soil microbial diversity and biomass, and altered community structure compared to no plant crop, and the responses of microbial parameters to plant crop varied with soil and climatic conditions (Muhammad et al., 2021). Actually, such soil microbial biological characteristics can more directly engage in feedback with altered soil quality than can physicochemical properties such as soil organic matter (SOC) and soil nutrient content (Bünemann et al., 2018; Caldwell, 2005). Microbial biomass, namely microbial biomass in terms of carbon (MBC), nitrogen (MBN), and phosphorus (MBP) is the main driving force behind the transformation and cycling of soil organic matter and nutrients (N and P); it is also functions as a crucial reserve pool for soil nutrients to provision plants’ growth, and can thus serve as an indicator of soil fertility (Jenkinson & Ladd, 1981; Pan et al., 2018; Powlson, Hirsch & Brookes, 2001; Sparling et al., 1997). Soil extracellular enzymes are special secondary metabolites secreted by microorganisms to obtain energy and nutrients from soil. Accordingly, changed extracellular enzymes activities may reflect the metabolic status of a soil microbe taxon or community as well as the potential for specific soil biochemical reactions (Dirks et al., 2012; Ma et al., 2022). Notably, in response to sudden changes in environmental conditions, soil extracellular enzymes are often expressed and released, such as β-1,4-glucosidase (BG), β-1,4-N-acetylglucosaminidase (NAG) and leucine aminopeptidase (LAP), acid phosphatase (ACP); these have been used to successfully characterize the cycling dynamics of carbon (C), nitrogen (N), and phosphorus (P) in soil, respectively (Allison & Jastrow, 2006; Brunner et al., 2003; Shao et al., 2020). In particular, cellobiohydrolase (CBH) are a class of key enzymes functioning in cellulose hydrolysis and biomass conversion, which may be used to characterize the decomposition capacity of cellulose material (Haan et al., 2013).
The sandy land of semi-arid and arid ecosystems is generally characterized by low microbial biomass indices, enzymatic activities, and α-diversity, these features usually ascribed to its low soil moisture and poor availability of limiting nutrients. Therefore, we hypothesized that planting C. esculentus followed by its growth (cultivation) for 1 year would increase the soil microbial biomass, richness, and diversity. Our study’s findings provide timely scientific data to inform future strategies for planting C. esculentus on sandy soils in the semi-arid areas of northern China.
Materials and Methods
Site description and soil sampling
The two sampling sites were established, one on bare sandy land (BSL) and the other on sandy land in which C. esculentus was planted and cultivated for 1 year (CE) (Fig. S1). Both experimental sites were located in Naiman, Tongliao, of Inner Mongolia, in a semi-arid region of China’s Horqin Sandy Land (42°55′N, 120°42′E; 348 m a.s.l.). This region has a continental semi-arid monsoon temperate climate, with a mean annual temperature of 6.8 °C and a mean annual precipitation of 360 mm, 70% of which occurs from May through September. The dominant native plant species of the sandy land were Caragana microphylla, Setaria viridis and Echinops gmelinii, with a low vegetation cover of 30%. The distance between these two sites is less than 500 m and they were freshly reclaimed in December 2020. The soil type is degraded sandy chestnut soil and aeolian sandy soil, and the topsoil (depth: 0–20 cm) was taken for nutrient determination before reclamation. The soil organic carbon content was 2.61 g kg−1, soil total nitrogen content was 0.20 g kg−1, the available phosphorus content was 0.71 g kg−1. It is characterized by high sand content, low nutrient content and poor water and fertilizer retention.
In this study, C. esculentus were sown by mechanical seeding method in mid-May. To control for the disturbance caused by fertilization and irrigation, both sites received the same fertilization and irrigation application (urea, 675 kg hm−2; (NH4)2 ⋅ HPO4, 300 kg hm−2; K2SO4, 375 kg hm−2; humid acid, 300 kg hm−2; total irrigation volume was 5,800 m3 hm−2). Of these, the base fertilizer applied before planting (urea, 45 kg hm−2; (NH4)2 ⋅ HPO4, 300 kg hm−2; K2SO4, 375 kg hm−2; humid acid 300 kg hm−2 and the irrigation amount before sowing was 2025 m3 hm−2. After that, all treatments adopted the water-fertilizer integration technology for trickle irrigation and fertilization, and the trickle irrigation belt was laid along the planting direction of C. esculentus, with an interval of 30 cm for each trickle irrigation belt. At the initial stage of growth (from May to June), water was dropped four times, each time 187.5 m3 hm−2, each hectare 33.75 kg urea and 15 kg K2SO4. In the middle irrigation period (from June to mid-August), 12 drops were applied, and in the late irrigation period (from mid-August to mid-September), four drops were applied, with the same amount of water and fertilizer per drop as in the initial irrigation period.
A total of 10 plots were set up, evenly split between the BSL and CE sites (i.e., five plots per site), and each plot randomly distributed on the BSL and CE sites (the distance between the plots is ca. 50 m). An auger (2.5-cm diameter) was used to collect topsoil samples (depth: 0–20 cm) on 28 August 2021, this corresponding to the peak of the growing season at CE. Within each plot (1 m ×1 m), five random locations were sampled and mixed together to generate a single composite soil sample; all such samples were then individually packed in sterilized polyethylene bags and taken to the laboratory in coolers (portable car refrigerators) as quickly as possible. Any surface litter in the soil samples was removed by passing them through a 2-mm square-aperture mesh. Each composite soil sample was divided into two subsamples: one was stored at 4 °C to later determine the soil properties, and the other was stored at −80 °C until the DNA extractions.
Measurement of soil microbial biomass carbon nitrogen, and phosphorus contents
A routine fumigation-extraction methodology was employed to measure the microbial biomass carbon (MBC), nitrogen (MBN), and phosphorus (MBP) (Joergensen, 1996). Briefly, triplicate fresh 50-g soil subsamples were placed separately in 100-mL beakers and incubated in the dark for 7 days at 25 °C with a relative humidity (RH) of 70%. The first subsample was set as the control group and the second one fumigated for 24 h with ethanol-free CHCl3; the third one was used to quantify the soil moisture content. The control and fumigated samples were transferred into 250-mL Erlenmeyer flasks, to which 100 mL of 0.5 M K2SO4 (for MBC and MBN) or NaHCO3 (for MBP) was added to each, and the solution shaken for 30 min at 25 °C to obtain the soil extracts. These extracts were filtered through 0.45-µm cellulose filters and stored at −20 °C until their analysis. The MBC, MBN, and MBP contents were all measured using an Elementar Vario TOC (Elementar, Langenselbold, Germany). The MBC, MBN, and MBP were respectively calculated as the difference between the extractable C, N, and P contents of fumigated and control samples, using fixed conversion factors: 0.45 for both the KEC of C and KEN of N, while the KEP for P was 0.40.
Measurement of five types of soil enzymatic activity
For soil enzymes β-1,4-glucosidase (BG), cellobiohydrolase (CBH), leucine aminopeptidase (LAP), β-1, 4-N-acetaminoglycosidase (NAG), and acid phosphatase (ACP), their respective activity was quantified using commercial enzyme kits and following the manufacturer’s protocol (Solarbio, Beijing, China). Briefly, BG decomposes p-nitrobenzene- β-D-glucopyranoside, yielding p-nitrophenol; CBH decomposes nitrobenzene fibrodiglycoside (PNPC), yielding p-nitrophenol; LAP decomposes L-leucine-p-nitroaniline, yielding p-nitroaniline; NAG decomposes p-nitrobenzene β-N-acetylglucosamine, yielding p-nitrophenol; and ACP decomposes disodium phenyl phosphate hydrate to yield phenol and Na2HPO4. The maximum absorption peak for BG, CBH, or NAG occurs at 400 nm, for LAP at 405 nm, and for ACP at 660 nm; to measure absorbance, a UV–VIS spectrophotometer was used (UV-1800; Mapada Instruments Co., Shanghai, China).
Soil DNA extraction and quantitative PCR
Soil total DNA was extracted from a 0.5-g subsample using the PowerSoil kit (Omega Laboratories Inc., Mogadore, OH, USA) according the manufacturer’s instructions. The integrity of DNA was checked by electrophoresis in 1.0% agarose gel, and its purity and concentration measured spectrophotometrically by a NanoDrop ND5000 (Thermo Fisher Scientific Inc., Waltham, MA, USA). Next, PCR was conducted in a Line Gene 9600 Plus Cycler (Thermo Fisher Scientific Inc.) to amplify the hyper-variable 460-bp V3–V4 region of the 16s rRNA, using the primer pair Eub338/806 (338F, 5′-ACTCCTACGGGAGGCAGCAG-3′ (Dennis et al., 2013); 806R, 5′-GGACTACHVGGGTWTCTAAT-3′). Likewise, the 300-bp V5–V7 region of 18 rRNA was amplified using the primer pair SSU0817/1196 (0817F, 5′-TTAGCATGGAATAATRRAATAGGA-3′; 1196R, 5′-TCTGGACCTGGTGAGTTTCC-3′) (Rousk et al., 2010).
Real-time quantitative PCR (q PCR) was carried out with 25 mg of the DNA mixed with 12.5 mL of ChamQ SYBR color q PCR Master Mix (2x) (Vazyme Biotech Co., Ltd, Nanjing, China), 0.5 mL of a buffer solution (10 mM) of the primer pair, and 9.5 mL of dd H2O. Standard and environmental DNA samples were added at 2.0 mL per reaction. Every reaction was run on an ABI7300 unit (Applied Biosystems, Waltham, MA, USA) with this cycling program: initial denaturation at 95 °C for 3 min, followed by 40 cycles of 94 °C for 30 s, 53 °C for 30 s, and 72 °C for 45 s, with a final extension at 72 °C for 5 min (Niu et al., 2021). Melting curve and gel electrophoresis analyses were used to confirm that the amplified products were of the appropriate size. Bacterial and fungal gene copy numbers were generated using a regression equation for each assay that related the cycle threshold (CT) value to a known number of copies in a given standard. All q PCR reactions were run in triplicate for each soil sample. The average bacterial PCR efficiency was 101.00%, with an R 2 of 0.9992 for the standard curves; the fungal PCR efficiency was 105.56% with an R 2 of 0.9999 for the standard curves.
High-throughput amplicon sequencing bioinformatics analysis
Each PCR was carried out in triplicate, in a 20-µL reaction volume that contained 4 µL of a 5 × reaction buffer, 4 µL of dNTPs (2.5 mM), 0.8 µL of each primer (5 µM), 1 µL of template DNA (ca. 10 ng), and 0.4 µL of Pfu DNA Polymerase (TransStart-FastPfu DNA Polymerase; TransGen Biotech, Beijing, China), topped up with double-distilled H2O. The PCR program consisted of an initial denaturation phase at 95 °C for 3 min; followed by 35 cycles at 94 °C for 30 s, annealing at 55 °C for 30 s, and an extension at 70 °C for 45 s; a final extension was done at 72 °C for 10 min. The PCR was performed in an ABI GeneAmp 9700 Cycler (Thermo Fisher Scientific, Inc.).
Unique barcode sequences were added at the 5′ end of the forward primer, to separate corresponding reads from the data pool generated in a single sequencing run. The ensuing amplicons were extracted by electrophoresis in 2.0% agarose gel and purified with a Gel Extraction Kit (Axygen Co., Hangzhou, China), according to the manufacturer’s instructions, then quantified with a QuantiFluor-ST fluorimeter (Promega, Madison, WI, USA). The purified amplicons were pooled in an equimolar way and paired-end sequenced (2 × 300 bp) by Majorbio Co. Ltd. (Shanghai, China), according to recognized protocols.
Raw FASTQ files were de-multiplexed and quality-filtered, by using the ‘fastp’ tool (v.0.20.0) (Chen et al., 2018) according to these criteria: (i) The 300-bp reads were truncated at any site that had an average quality score <20 over a 50-bp sliding window, discarding any truncated reads shorter than 50-bp; (ii) extracted matching barcodes were removed, and as well as any two-nucleotide mismatches vis-à-vis the primer, or reads that contained ambiguous characters; (iii) overlapping sequences >10 bp in length were assembled according to their overlapping sequence. Reads that could not be assembled were discarded.
The resulting quality-checked sequences were aligned as per the SILVA alignment database (https://www.arb-silva.de) (Quast et al., 2013), and clustered into operational taxonomic units (OTUs) by USEARCH software (v. 7.1) (https://www.drive5.com/usearch/) (Edgar, 2013). Only those OTUs with at least a 97% similarity level were used to draw the rarefaction curves, and the α-diversity indices—Chao, ACE, Shannon, and Simpson indices (http://www.mothur.org/wiki/Calculators), and their performed coverage analysis—were calculated using Mothur software (v1.30.2) (https://www.mothur.org) (Schloss et al., 2009). The taxonomic assignment of OTUs at a 97% similarity cut-off was conducted by Mothur, with a 70% confidence interval, in accordance with the SILVA (138) or Unite (8.0) database (http://unite.ut.ee/index.php) for bacteria and eukaryota, respectively.
All sequencing data associated with this study can be found in the NCBI Sequence Read Archive (https://www.ncbi.nlm.nih.gov/sra), under project accession number PRJNA836307.
Statistical analysis
Significant differences in the means of soil microbial biomass indices, enzyme activity, quantity, and α-diversity between two sites (BSL vs. CE) were determined by one-way analysis of variance (ANOVA). All analyses were implemented in SPSS statistical software (v. 19.0) (https://www.ibm.com/analytics/spss-statistics-software). Unless otherwise noted, a difference between means was consider statistically significant at P < 0.05. Principal co-ordinates analysis (PCoA) was used to uncover differences in β-diversity between samples of the two sites (BSL vs. CE). Mantel tests were used to evaluate the relationships of the bacterial or eukaryotic community composition to measure site-level soil variables. Pearson correlation coefficient (r) were used to indicating a positive correlation (r>0) or a negative correlation (r < 0). Both PCoA and Mantel tests were carried out in the R platform (v3.2.1) (http://www.r-project.org) with its ‘vegan’ package. This package was also used to build the matrices for the pairwise taxonomic distances between the bacterial or eukaryotic communities (Bray–Curtis’s dissimilarity) and environmental variables (Euclidean distance). Pearson correlation analysis was carried out in the R platform (v3.2.1) (R Core Team, 2015) with its function cor().
Results
Comparative analysis of soil microbial biomass indices and enzymatic activities
The soil biomass microbial indices for the two sites are shown in Fig. 1A. Evidently, the mean values for MBC, MBN, and MBP were one-third to three times greater at CE than BSL. (P < 0.05) (Table S1, Table S3). For the soil MBC:MBN ratio, its mean (± SD) was 18.293 ± 6.868 at BSL, which was significantly higher than the 8.324 ± 4.700 at CE (P < 0.05) (Table S1, Table S3). In Fig. 1B are the soil enzymatic activities (BG, CBH, LAP, NAG, and ACP) for the two sites. In this respect, only ACP differed significantly between BSL and CE, being almost 20% lower in the latter (P < 0.05) (Tables S2, S3).
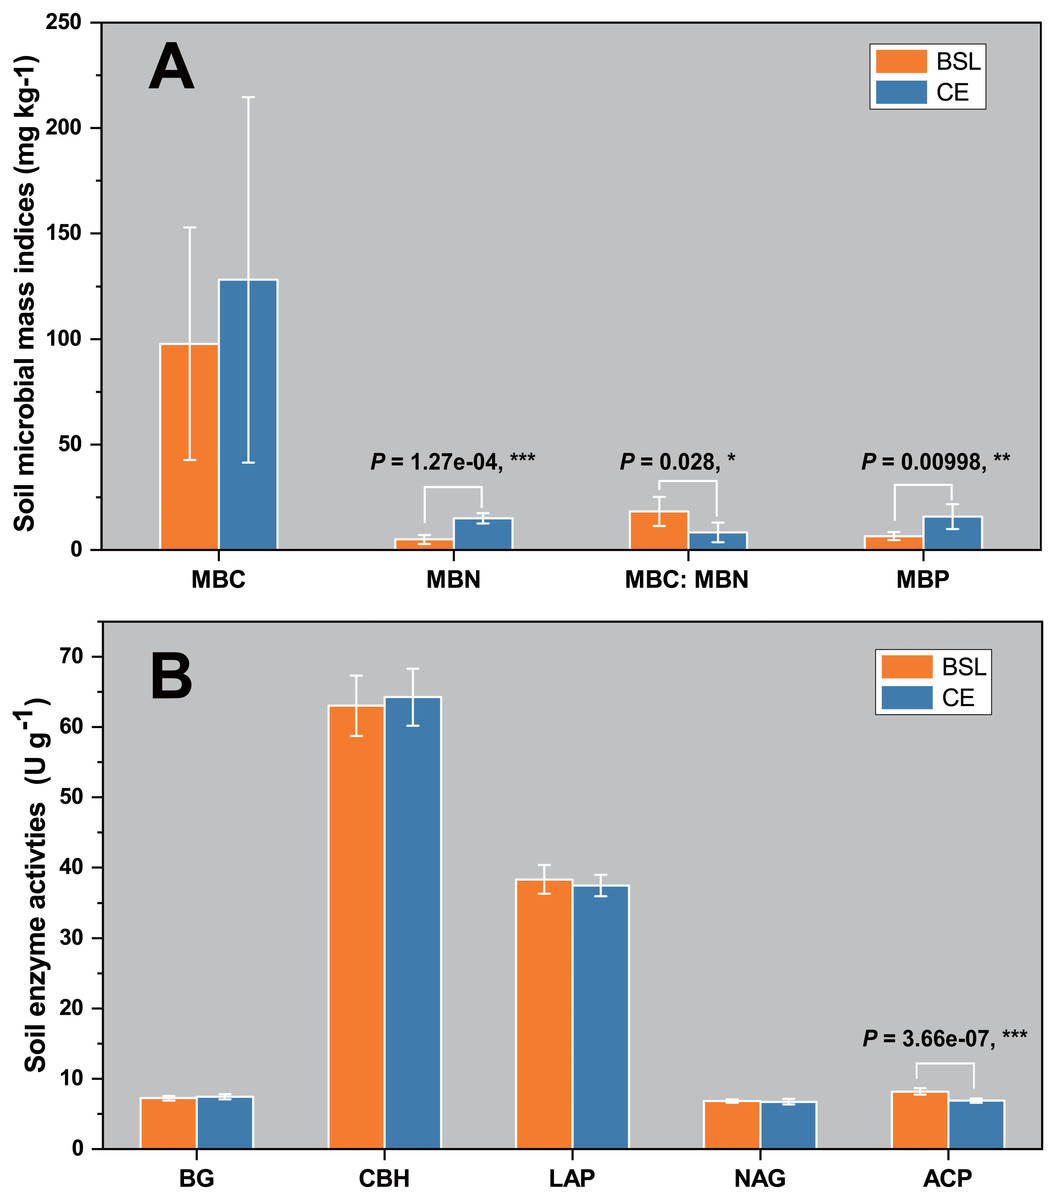
Figure 1: Soil microbial biomass indices (MBC, MBN, MBC/MBN ratio, and MBP) (A) and soil enzyme activities (BG, CBH, LAP, NAG, and ACP) (B) in the topsoil (to a depth of 20 cm) at the two sampling sites.
BSL, bare sandy land; CE, sandy land where Cyperus esculentus was cultivated for 1 year. Bars are the mean ±SD, n = 5. MBC, microbial biomass carbon; MBN, microbial biomass nitrogen; MBP, microbial biomass phosphorus; BG, 1,4-glucosidase; CBH, cellobiohydrolase; LAP, leucine aminopeptidase; NAG, β-1, 4-N-acetaminoglycosidase; ACP, acid phosphatase. Significant levels (ANOVA followed by LSD test): ∗ P < 0.05; ∗∗P < 0.01; ∗∗∗P < 0.001.
Microbial diversity characterization and community composition of the two sites
Gene copy numbers for total bacteria (16S RNA) and eukaryota (18S RNA) species at the two sampling sites are presented in Fig. 2. For bacteria, copy abundance was nearly two times higher in the CE than BSL soil (P < 0.05), while the eukaryota were similarly abundant between the two sites (P < 0.05). Figure 3 shows the two α-diversity indexes, community species richness (Chao 1 index) and community diversity (Shannon index), at the two sites. For bacteria, the Chao1 index ranged from 2,329.50 to 2,677.07 and 2,690.12 to 2,799.07 at BSL and CE, with means of ca. 2,500 and 2,700, respectively (Table S4), while the Shannon index ranged from 5.76 to 6.45 and 6.33 to 6.42 respectively at BSL and CE, also with similar means (Table S4). For eukaryota, the Chao1 index ranged from 73.00 to 110.5 and 83.88 to 117.6 at BSL and CE, with means of ca. 90 and 97, respectively (Table S5); corresponding values for the Shannon index were.10 to 2.73 and 2.16 to 2.55, with nearly identical means (Table S5). The plot-level ACE and Simpson indices for the diversity of bacteria and eukaryota are summarized in Tables S4 and S5, respectively.
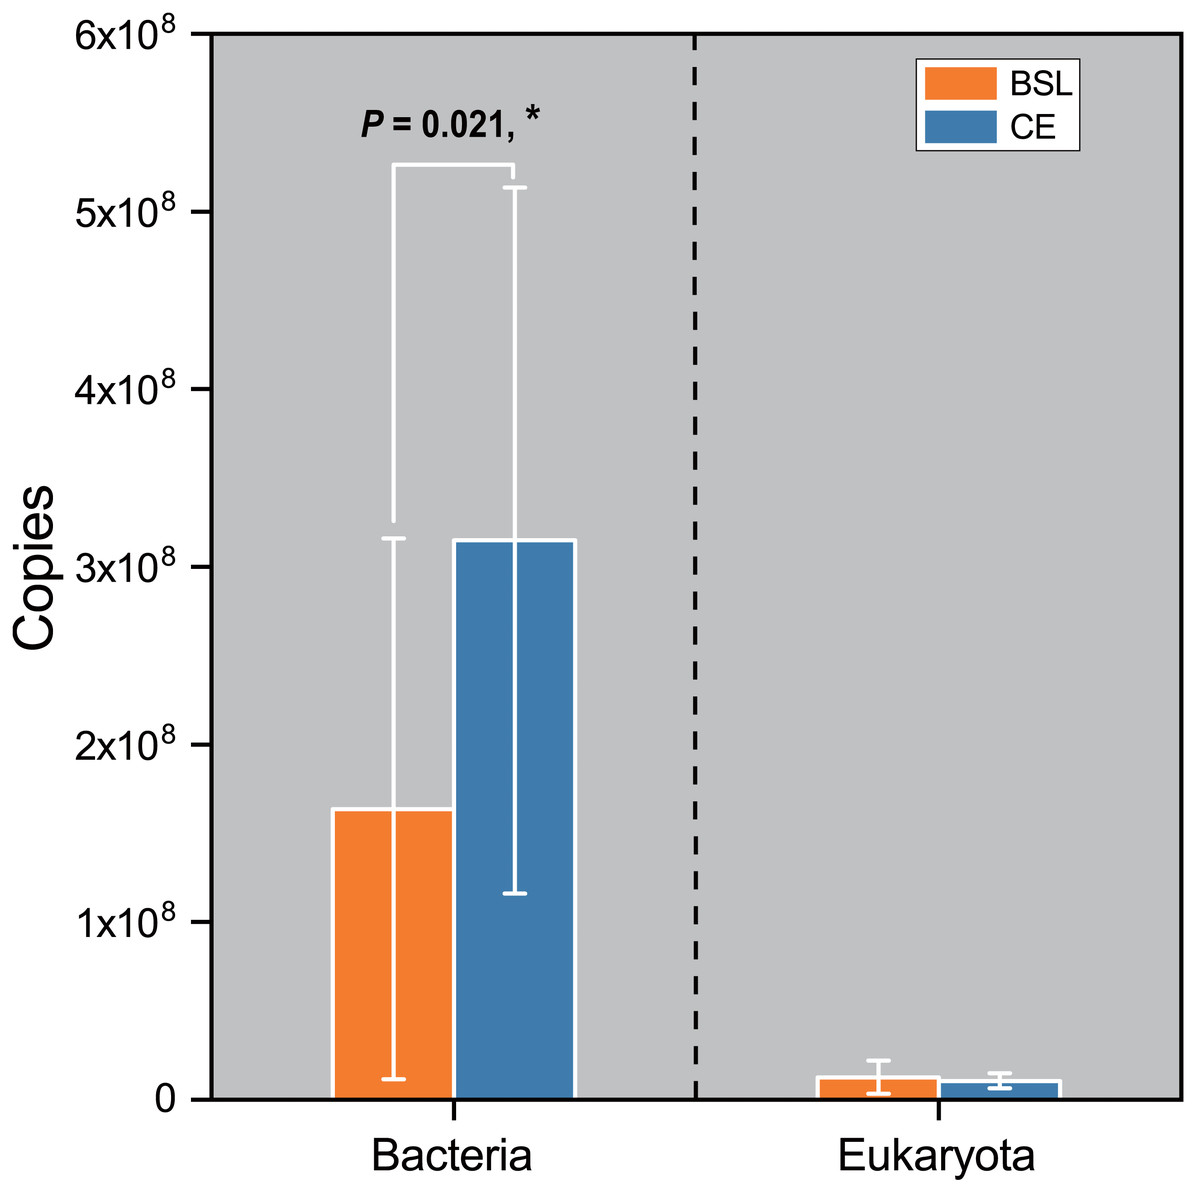
Figure 2: Comparison of the 16S rRNA gene (for bacteria) and 18 rRNA gene (for eukaryota) copy numbers from the soils at the two sampling sites as determined by q PCR.
BSL, bare sandy land; CE, sandy land where Cyperus esculentus was cultivated for 1 year. Bars are the mean ±SD, n = 5. Significant levels (ANOVA followed by LSD test): ∗P < 0.05.
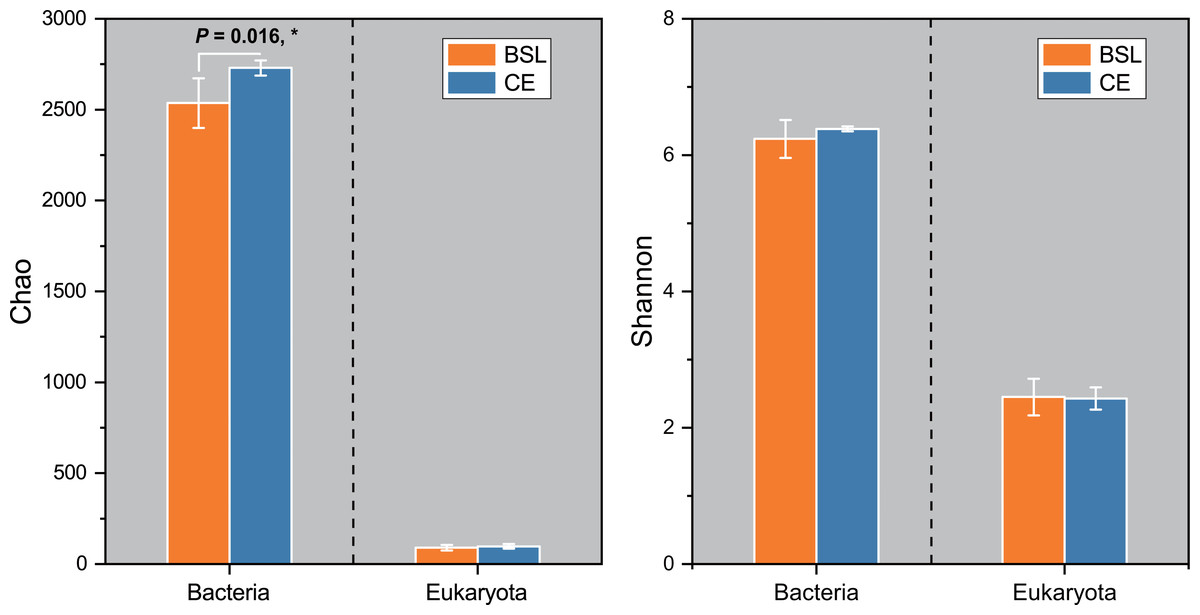
Figure 3: The α-diversity (Chao and Shannon indices) of the microbial community between the two sites.
BSL, bare sandy land; CE, sandy land where Cyperus esculentus was cultivated for 1 year. Bars are the mean ±SD, n = 5. Significant levels (ANOVA followed by LSD test): ∗P < 0.05.
Across all 10 soil samples, a total of 272,464 valid sequences and 4,379 OTUs were obtained. All sequences could be assigned to one of 36 bacterial phyla. Of these, the 19 most dominant bacterial phyla across all samples were Actinobacteria (8.01%–12.64%), Acidobacteria (5.90%–17.92%), Proteobacteria (7.21%–14.38%), Chloroflexi (6.55%–12.26%), Gemmatimonadota (6.05%–13.09%), Firmicutes (6.96%–12.07%), Bacteriodetes (7.17%–12.39%), Myxococcota (7.46%–13.81%), Cyanobacteria (0.69%–32.44%), Methylomirabilota (2.84%–18.56%), Nitrospirae (5.88%–16.48%), Bacteria_unclassified or norank (4.46%–15.02%), Patescibacteria (3.01%–15.39%), Planctomycetota (6.45%–14.72%), Verrucomicrobiota (3.77%–14.87%), Bdellovibrionota (6.34%–16.28%), Armatimonadota (4.52%–16.96%), RCP2-54 (2.35%–22.15%), and Entotheonellaeota (4.27%–21.35%), which together accounted for ca. 99.55% of all bacterial sequences (Fig. 4; Table S6). The remaining phyla only comprising <1% of the total bacterial library.
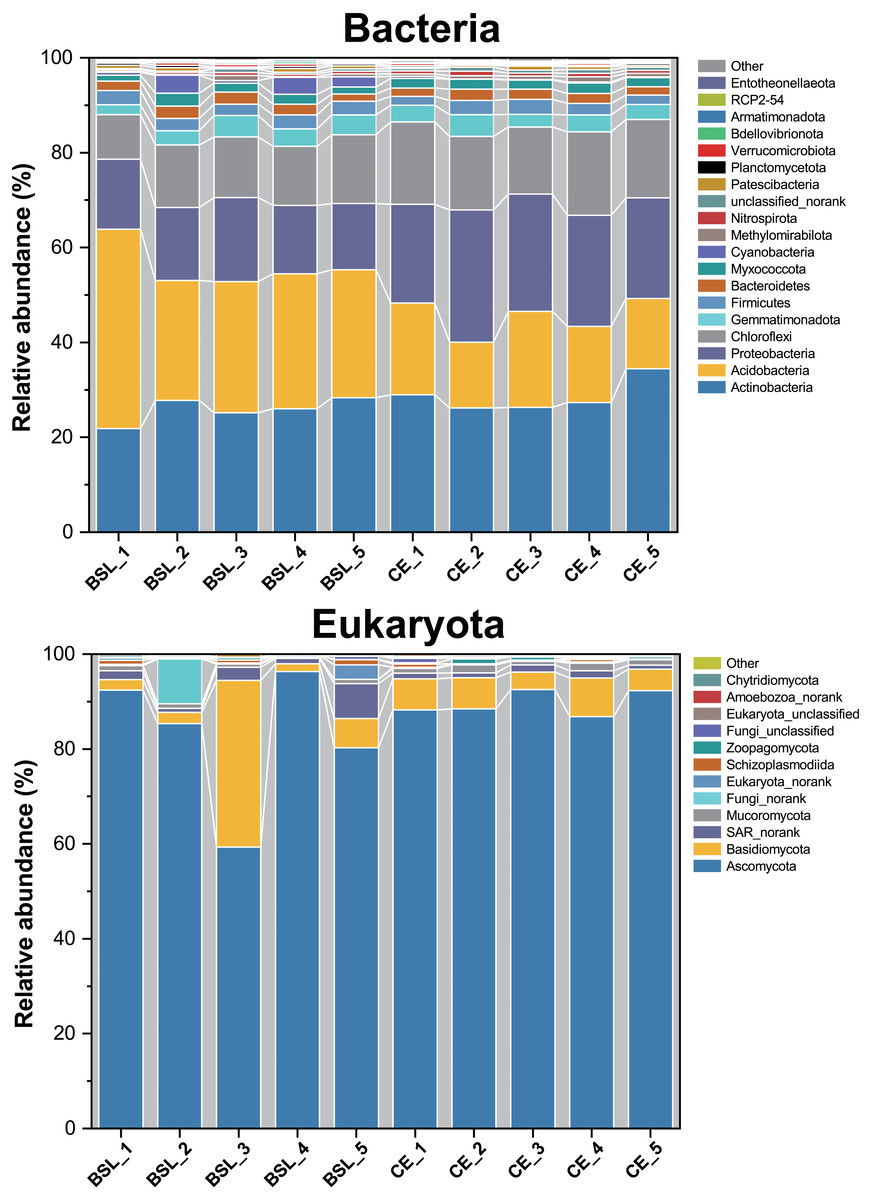
Figure 4: Relative abundances of the bacterial and eukaryota community members at the phylum level across all 10 soil samples.
BSL, bare sandy land; CE, sandy land in which Cyperus esculentus was cultivated for 1 year.
For eukaryota, 350,670 valid sequences and 202 OTUs were obtained. All sequences could be assigned to one of 22 eukaryota phyla. Of these, the 12 most dominant eukaryota phyla across all samples were Ascomycota (59.31%–96.30%), Basidiomycota (1.68%–35.14%), SAR_norank (0.81%-−7.38%), Mucoromycota (0.29%-−1.71%), Fungi_norank (0.01%-−9.50%), Eukaryota_norank (0.08%-−3.04%), Schizoplasmodiida (0.03%-−1.10%), Zoopagomycota (0%-−1.01%), Fungi_unclassified (0.03%-−0.90%), Eukaryota_unclassified (0.03%-−0.25%), Amoebozoa_norank (0%-−0.36%), and Chytridiomycota (0%-−0.46%). Among them, Ascomycota, Basidiomycota, Mucoromycota, Fungi_norank, Zoopagomycota, Fungi_unclassified, and Chytridiomycota belonged to the fungi and constituted 88.44%–98.71% of the total eukaryota library.
Bacterial and eukaryota community composition at the two sites
The PCoA done at the OTU level was used to infer the β-diversity patterning of soil bacterial and eukaryotic community composition (Fig. 5). Bacterial communities of the CE samples strongly clustered at the far right of the PC1 axis (explaining 52.96% of the total variation), unlike the BSL samples which were well scattered along the entire PC2 axis (accounting 11.32% of the total variation). Likewise, for eukaryota communities, those of the CE samples were clumped along the right of PC1 axis (accounting for 34.49% of the total variation), whereas those of the BSL samples were interspersed along the length of the PC2 axis (accounting for 11.32% of the total variation).
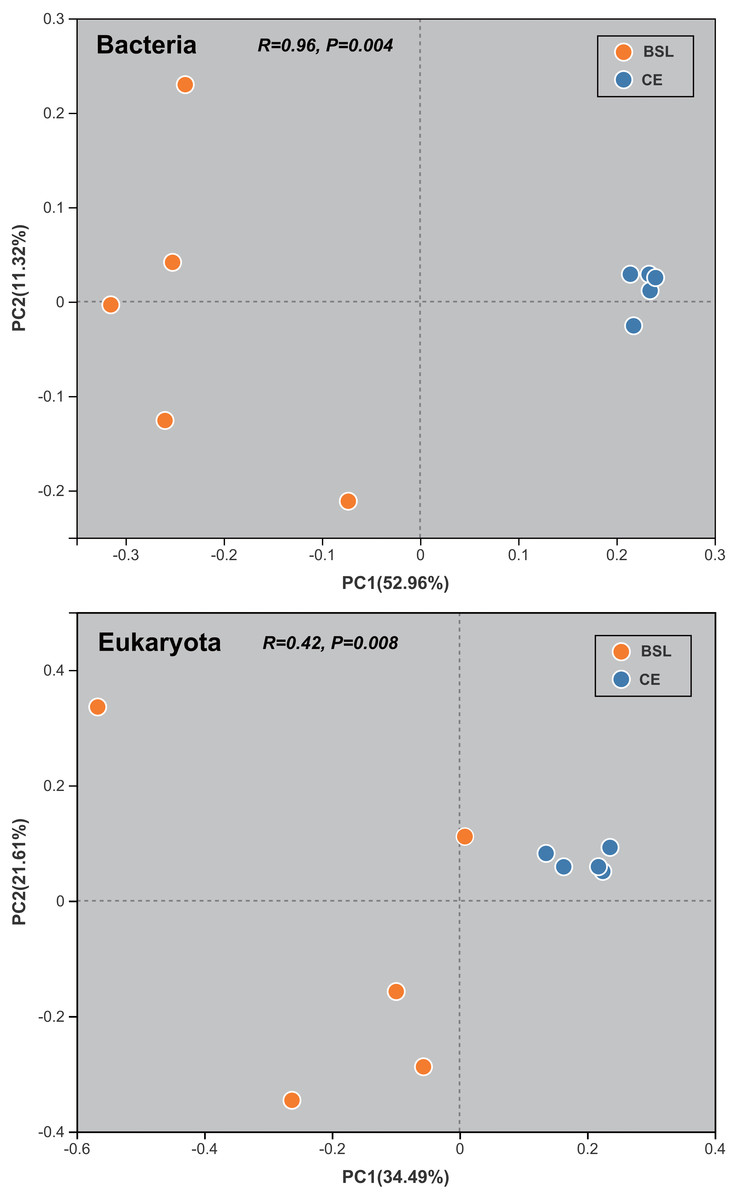
Figure 5: Results of the principal co-ordinates analysis (PC1 and PC2) for the soil bacterial and eukaryotic communities at the two sampling sites.
BSL, bare sandy land; CE, sandy land in which Cyperus esculentus was cultivated for 1 year.
The student’s t-test bar plots indicated differences between the two sites (BSL vs. CE below, respectively) in their bacterial and eukaryotic communities at the phylum level (Fig. 6). A total of 13 bacterial phyla, namely Acidobacteria (30.06% vs. 16.96%), Proteobacteria (15.23% vs. 23.6%), Chloroflexi (12.50% vs. 6.21%), Cyanobacteria (2.13% vs. 0.20%), Nitrospirota (0.48% vs. 0.73%), Bacteria_unclassified (0.43% vs. 0.69%), Planctomycetota (0.43% vs. 0.29%), Deinococcota (0.03% vs. 0.07%), NB1-j (0.008% vs. 0.087%), WS2 (0.064% vs. 0.0194%), GAL15 (0.0055% vs. 0.048% at CE), SAR324_cladeMarine_group_B (0.00526% vs. 0.02216%), and Dadabacteria (0% vs. 0.023%) differed significantly in their relative abundance between the BSL and CE sites (Fig. 6; Table S8). For eukaryota, only Eukaryota_unclassified (0.075% vs. 0.183%), Amoebozoa_norank (0.018% vs. 0.232%), and Aphelidea (0% vs. 0.060%), occurred in significantly different proportions between the two sites (Fig. 6; Table S9).
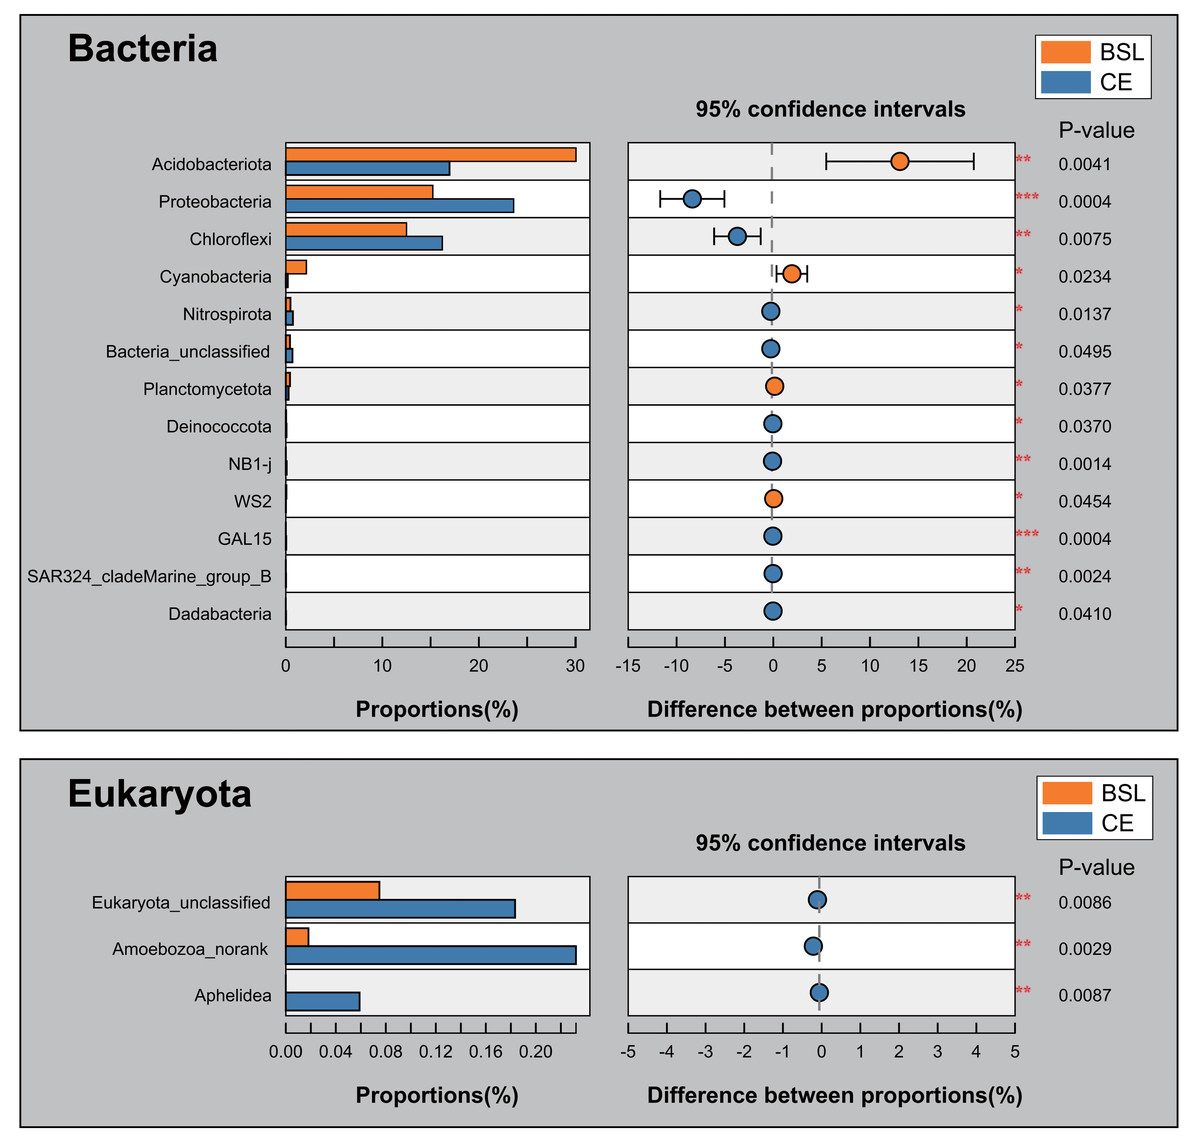
Figure 6: Proportions at the phylum level for the two groups and tests for their significant differences.
BSL, bare sandy land; CE, sandy land in which C. esculentus was cultivated for 1 year.
Mantel tests were used to discern the several environmental factors that shaped the soil bacterial and eukaryota community composition across all 10 samples (Fig. 7). For bacteria, SOC (R = 0.808, P = 0.008) was the most critical environmental factor that individually explained the variation in soil bacterial community composition, followed by soil pH (R = 0.808, P = 0.008), soil TN (R = 0.769, P = 0.005), soil EC (R = 0.710, P = 0.006), soil C:N ratio (R = 0.605, P = 0.004), and MBN (R = 0.624, P = 0.009) (Fig. 7; Table S10). The soil eukaryota community composition was most associated with SOC (R = 0.397, P = 0.003), soil pH (R = 0.341, P = 0.015), soil TN (R = 0.298, P = 0.013), MBN (R = 0.271, P = 0.031), and soil EC (R = 0.236, P = 0.041) (Fig. 7; Table S10).
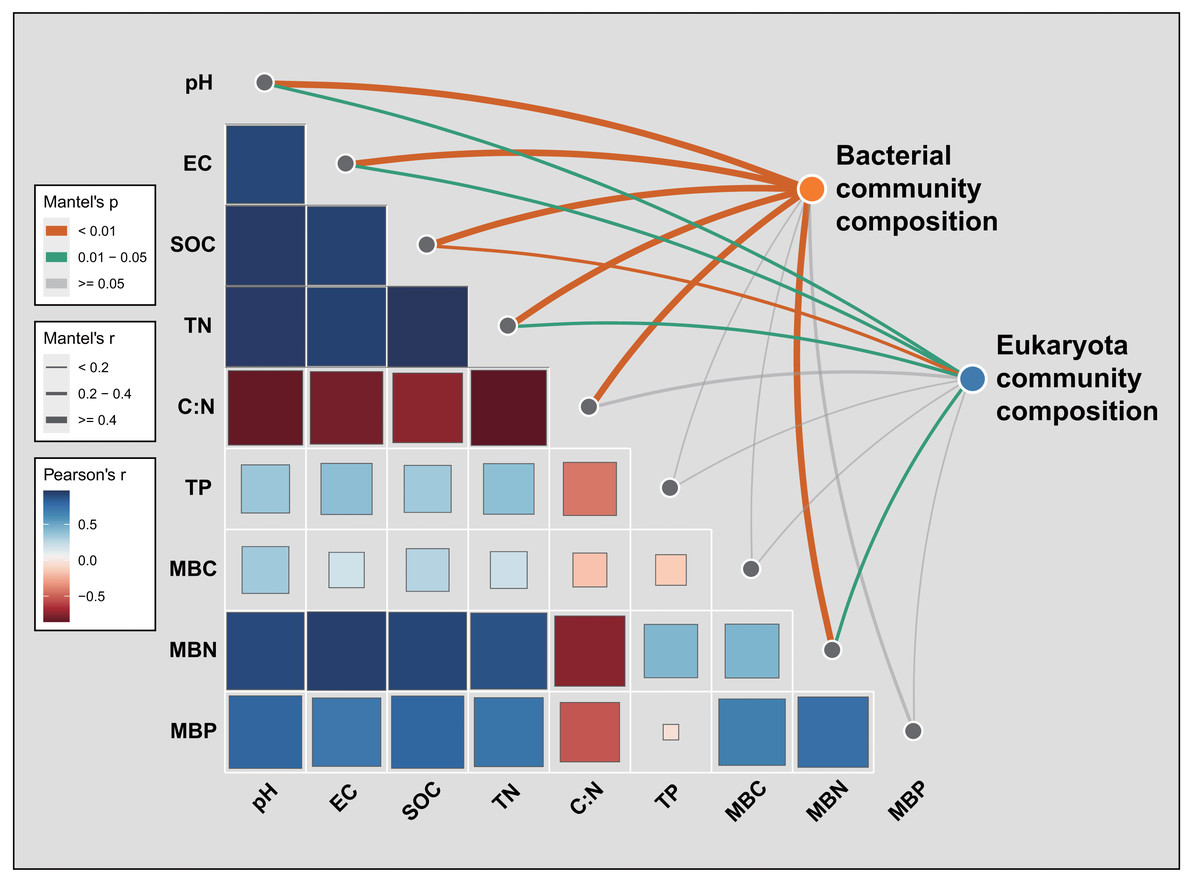
Figure 7: Pairwise comparisons of environmental factors with soil bacterial or eukaryota community composition, for which a color gradient denotes Pearson’s correlation coefficient.
SOC, soil organic carbon; TN, total nitrogen; TP, total phosphorus; EC, electric conductivity; MBC, microbial biomass carbon; MBN, microbial biomass nitrogen; MBP, microbial biomass phosphorus. Pearson’s r > 0 indicates a positive correlation and r < 0 indicates a negative correlation. The boxed-edge width corresponds to the distance dependence of Mantel’s R statistic, whose statistical significance was based on n = 9,999 permutations. An inner square’s size is proportional to the strength of Mantel’s R correlation. The color of the curved lines indicates the correlation strength between bacterial or eukaryota community composition and the environmental factors.
Discussion
Effects of planting C. esculentus on soil microbial biomass indices and enzymatic activities
Our results showed that the soil MBC, MBN, and MBP values of planted C. esculentus cultivated for 1 year were all higher than those of the control site (BSL), and significantly so for MBC and MBN (Fig. 1A; Table S3). This result is probably due to the significantly greater soil nutrient contents, especially for SOC and TN, that arose in the presence of C. esculentus over 1 year (Table S3), likely driven by accumulating organic matter derived from litter decomposition and root exudates. Generally, the with poor nutrient status. (Zhao et al., 2016). Although there are some exogenous sandy soil in semi-arid and arid ecosystems are considered oligotrophic environments nutrient inputs, the sandy soil still cannot accumulate nutrients effectively because of its loosened soil texture that is also prone to leaching. Evidently, planting and then cultivating C. esculentus for 1 year could improve soil nutrient conditions of sandy land. An earlier study in arid and semi-arid grassland of China showed that the total biomass of soil microorganisms, as well as bacterial or fungal biomass, were significantly positively correlated with the SOC content (Hu et al., 2014). In other work, soil bacterial diversity was also positively correlated with the TN content (Wang et al., 2015). Generally, the main factor responsible was larger concentrations of key soil nutrients, especially organic matter and nitrogen, which was beneficial for the growth of soil microbial populations and microbial biomass (Ralte et al., 2005).
Compared with the control site, the four soil enzymatic activities (BG, CBH, LAP, and NAG) under planting with C. esculentus were hardly changed, in that only ACP was significantly decreased (P < 0.05) (Fig. 1B; Table S1). Soil enzymes have been considered as indicators of soil quality, indicating soil fertility quality and soil health quality. Nonetheless, distinct enzymes have different molecular compositions and structures, and catalyze different reactions, which are affected by multiple environmental factors, such as soil temperature, moisture, pH, fertilization, vegetation type, plant diversity, and community structure (Fu et al., 2012; Pan et al., 2018). Although the soil nutrient status of the sandy land was upgraded after the planting with C. esculentus, the change was not sufficient to cause significant changes in soil enzymatic activities (BG, CBH, LAP, and NAG), because the treatment time was only one year. By comparison, ACP are mainly produced by plant roots and microorganisms and play a key role in the P cycling, an often-limiting element in terrestrial ecosystems, and its activities were commonly positively correlated with soil organic matter, total nitrogen and organic phosphorus contents (Margalef et al., 2021). Therefore, our results are different from conventional studies, and the specific reason still needs to be confirmed through long-term positioning tests.
Effects of planting C. esculentus on soil microbial diversity and community composition
To compare the soil microbial characteristics of bare sandy land (BSL, the control) and sandy land in which C. esculentus was cultivated for 1 year (CE), real-time PCR and MiSeq high-throughput sequencing were used in tandem to reveal differences in the soil microbial abundance, α-diversity, and community composition between the two sampling sites.
The q PCR and sequencing results detected high bacterial abundance and diversity but a relatively low eukaryotic abundance and diversity at the two sampling sites. For microbial abundance, twice as many bacterial 16S rRNA gene copies were found in soil at CE than the control whereas the number of eukaryota 18S rRNA gene copies was quite similar between sites (Fig. 2). The great variation in bacterial 16S rRNA and eukaryota 18S rRNA gene copies and their site-level disparity are probably attributable to different feedback processes between bacteria and eukaryota and the soil C:N ratio, with a lower C:N ratio likely benefiting more the reproduction of bacteria than fungi (Hu et al., 2001).
Soil bacterial phyla were dominated by Actinobacteria, Acidobacteria, Proteobacteria, and Chloroflexi, while eukaryota phyla were dominated by Ascomycota, Basidiomycota, and SAR_norank (Fig. 4). These phyla are widely distributed in various terrestrial ecosystems, especially in arid and semi-arid regions (Baubin et al., 2019; Crits-Christoph et al., 2013; Sun et al., 2018; Zhang et al., 2019). The PCoA results uncovered stark differences in soil bacterial or eukaryotic community composition of bare sandy land across all its samples (Fig. 5), whereas either composition was very similar among samples where planted C. esculentus grew for 1 year. This pattern strongly implied that the short-term presence of C. esculentus could markedly promote the homogenization of soil bacterial and eukaryotic communities. Of these, the relative abundances of several bacterial and eukaryotic phyla distinctly changed: for bacteria, compared with the control, the relative abundance of Acidobacteria in response to C. esculentus planting fell sharply from 30.06% to 16.96%, and that of Proteobacteria and Chloroflexi increased sharply from 15.23% to 23.6% and from 12.50% to 16.21%, respectively (Fig. 6). Previous studies have shown that Acidobacteria are oligotrophic bacteria, being typically more abundant in low-nutrient soils, while Proteobacteria are copiotrophic bacteria usually found in nutrient-rich habitats (Fierer, Bradford & Jackson, 2007; Wang et al., 2017; Zeng et al., 2019). Accordingly, from our results, we may infer that the planted C. esculentus probably enriched the soil fertility of bare sandy soil. For eukaryota, compared with the control, the relative abundance of Eukaryota_unclassified in response to C. esculentus planting increased from 0.075% to 0.18%; likewise, the relative abundances of Amoebozoa_norank and Aphelidea respectively increased from 0.018% to 0.232% and from 0% to 0.060%.
Mantel tests indicated that soil microbial community composition was associated with multiple edaphic drivers whose roles differed marginally between the two microbial groups (Fig. 7; Table S10). For bacteria, SOC was the most fundamental environmental driver shaping the bacterial community composition across all soil samples, followed by the soil pH, TN, EC, C:N ratio, and MBN. Similarly, soil eukaryota community composition was mainly related to the SOC, pH, TN, MBN, and EC (Fig. 7, Table S10). A predominant role for soil pH in shaping bacterial community composition has been widely demonstrated at different scales and in different ecosystems (Jiao & Lu, 2020; Shen et al., 2013; Tian et al., 2018; Yu et al., 2021). Furthermore, soil nutrients’ content is also a limiting factor of microbial activity and can pivotally impact soil microbial community distribution patterns in arid and semi-arid regions (Chen et al., 2015). In our study, SOC strongly altered the community composition of both soil bacteria and eukaryota, which is consistent with other studies’ findings (Hu et al., 2001; Tian et al., 2018).
Conclusion
In this study, we evaluated the short-term (1 year) effects of planted C. esculentus on the soil microbial biomass indices, enzymatic activities, and microbiome characteristics in the Horqin Sandy Land, China. The presence of C. esculentus for 1 year is capable of inducing the differential accumulation of SOC and TN, thereby increasing the soil C:N ratio. Furthermore, C. esculentus can promote three microbial biomass indices (MBC, MBN, and MBP) but it has very little impact on four enzymes’ (BG, CBH, LAP, and NAG) activities. Moreover, planting with C. esculentus significantly increases the richness and diversity of soil bacteria rather than eukaryota in sandy land, while reducing and augmenting the relative abundance of Acidobacteria and Proteobacteria, respectively, suggesting their potential use as bioindicators of soil nutrient-rich conditions. Overall, our findings demonstrate that cultivating C. esculentus for just 1 year could improve the nutrient status and microbial characteristics of sandy soils in a semi-arid region.
Supplemental Information
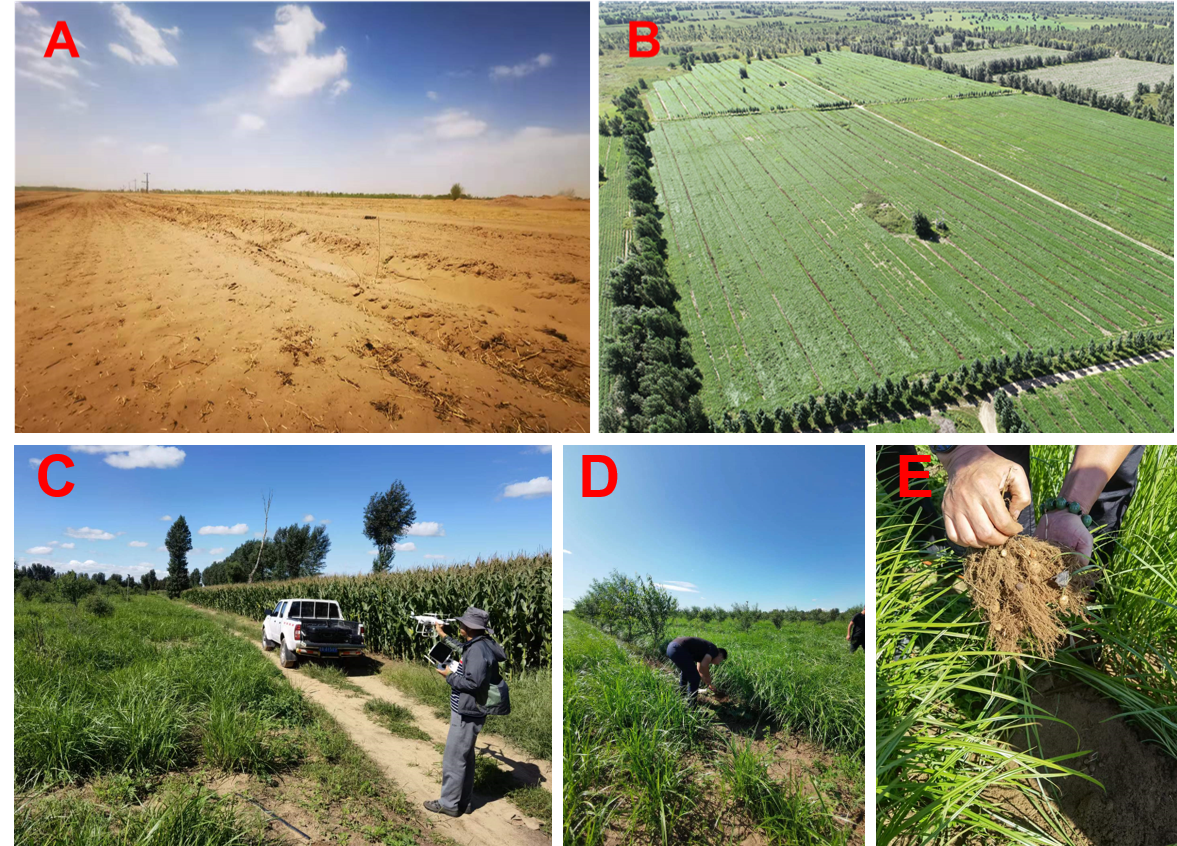
The photographs of the sampling sites of the bare sandy land (A) and a sandy land which cultivated Cyperus esculentus for a year (B)
C, D and E were field investigation in a sandy land which cultivated Cyperus esculentus.