
Drug resistant Mycobacterium tuberculosis in Oman: resistance-conferring mutations and lineage diversity
- Published
- Accepted
- Received
- Academic Editor
- Siouxsie Wiles
- Subject Areas
- Genetics, Microbiology, Molecular Biology, Infectious Diseases
- Keywords
- Mycobacterium tuberculosis, Drug resistance genes, Spoligotypes, Oman
- Copyright
- © 2022 Al Mahrouqi et al.
- Licence
- This is an open access article distributed under the terms of the Creative Commons Attribution License, which permits unrestricted use, distribution, reproduction and adaptation in any medium and for any purpose provided that it is properly attributed. For attribution, the original author(s), title, publication source (PeerJ) and either DOI or URL of the article must be cited.
- Cite this article
- 2022. Drug resistant Mycobacterium tuberculosis in Oman: resistance-conferring mutations and lineage diversity. PeerJ 10:e13645 https://doi.org/10.7717/peerj.13645
Abstract
Background
The Sultanate of Oman is country a low TB-incidence, with less than seven cases per 105 population detected in 2020. Recent years have witnessed a persistence in TB cases, with sustained incidence rate among expatriates and limited reduction among Omanis. This pattern suggests transmission from the migrant population. The present study examined the genetic profile and drug resistance-conferring mutations in Mycobacterium tuberculosis collected from Omanis and expatriates to recognise possible causes of disease transmission.
Methods
We examined M. tuberculosis cultured positive samples, collected from Omanis (n = 1,344) and expatriates (n = 1,203) between 2009 and 2018. These isolates had a known in vitro susceptibility profile to first line anti-TB, Streptomycin (SM), Isoniazid (INH), Rifampicin (RIF), Ethambutol (EMB) and Pyrazinamide (PZA). The diversity of the isolates was assessed by spacer oligo-typing (spoligotyping). Drug resistance-conferring mutations resulted from full-length sequence of nine genes (katG, inhA, ahpc, rpoB, rpsL, rrs, embB, embC, pncA) and their phenotypic relationship were analysed.
Results
In total, 341/2192 (13.4%), M. tuberculosis strains showed resistance to any drug, comprising mono-resistance (MR) (242, 71%), poly-resistance (PR) (40, 11.7%) and multi-drug resistance (MDR) (59, 17.3%). The overall rate of resistance among Omanis and expatriates was similar; however, MDR and PZAR were significantly higher among Omanis, while INHR was greater among expatriates. Mutations rpsL K43R and rpoB S450L were linked to Streptomycin (SMR) and Rifampicin resistance (RIFR) respectively. Whereas, katG S315T and inhA –C15T/G–17T were associated with Isoniazid resistance (INHR). The resistance patterns (mono-resistant, poly-resistant and MDR) and drug resistance-conferring mutations were found in different spoligo-lineages. rpsL K43R, katG S315T and rpoB S450L mutations were significantly higher in Beijing strains.
Conclusions
Diverse drug resistant M. tuberculosis strains exist in Oman, with drug resistance-conferring mutations widespread in multiple spoligo-lineages, indicative of a large resistance reservoir. Beijing’s M. tuberculosis lineage was associated with MDR, and multiple drug resistance-conferring mutations, favouring the hypothesis of migration as a possible source of resistant lineages in Oman.
Introduction
Oman is a low burden tuberculosis (TB) country with an incident rate of seven per 100,000 population in 2020 (WHO, 2021). The disease is widespread, with equal risk among nationals and expatriates (Al Abri et al., 2020a; Al Abri et al., 2020b; Hegazy et al., 2021), who represent a 45% of the population, with the vast majority from the Indian subcontinent (NCSI, 2020). The initial phase of the national control program resulted in a substantial reduction in TB cases (73%) between 1981 and 1992, with an average reduction of 9% per year (Al-Maniri et al., 2010; Al Awaidy, 2018). However, recently the TB reduction rates have slowed to 4.6% per year, with a large proportion of new TB cases seen among expatriates (Al Abri et al., 2020a; Al Abri et al., 2020b; Al Awaidy, 2018). For example, 8.1, 7.7, 6.3, 4.7 and 3.3 new TB cases were seen among Omanis compared to 9.8, 8.1, 7.7, 7.1 and 7.3 per 100,000 population in expatriates in 2014, 2015, 2016, 2017 and 2018, respectively. The vast majority of infected expatriates were from high TB burden countries in the Indian subcontinent, including India (721 (76%)), Bangladesh (103 (11%)) and Pakistan (25 (3%)) (Al Awaidy, 2018).
The increasing pattern of TB cases among expatriates in Oman (Al Abri et al., 2020a; Al Abri et al., 2020b) may reflect M. tuberculosis transmission of reactivated latent TB (LTB) (Aldridge et al., 2018), or transmission due to poor social conditions (e.g., overcrowding and poor living conditions). This can be exacerbated by the fact that some expatriates seek medical advice at an advanced stage of the disease (Al Mayahi et al., 2020). Consequently, TB incidence rates among expatriates based on case notification may be lower than anticipated (Pandey et al., 2017; Romanowski et al., 2019; Snow et al., 2018). Thus, TB control targets in Oman for 2035 and the elimination threshold of 1 per million population (Lönnroth et al., 2015) may not be met without a clear information on the impact of expatriates and whether they serve as a transmission reservoir of drug resistant strains. A significant proportion of drug resistant cases, particularly multi-drug resistant (MDR), in migrants from high burden countries to Europe had resulted from reactivation of LTB (Hargreaves et al., 2017). Therefore, the high influx of expatriates from TB endemic areas poses a great risk for the spread of drug resistance in Oman.
The present study investigated the characteristics and diversity of drug resistant M. tuberculosis strains in Oman. We examined nine genes implicated in resistance to first-line anti-TB therapy (isoniazid (INH), rifampicin (RIF), ethambutol (EMB), streptomycin (SM) and pyrazinamide (PZA)). Known mutations in these genes are associated with resistance of M. tuberculosis to drugs such as SM, INH and RIF (Iacobino, Fattorini & Giannoni, 2020). However, due to the global geographical diversity of M. tuberculosis, and the high proportion of expatriates in Oman, there is a possibility of varying efficacy of these mutations, which could influence their diagnostic value. Thus, it is important to validate the role of these mutations in Oman and examine their spatiotemporal distribution among Omanis and expatriates. This information can lead to optimization of current management and control strategies to limit the evolution of drug resistance.
Materials and Method
Study population and characteristic of M. tuberculosis isolates
A total of 2,547 unique M. tuberculosis isolates were obtained from pulmonary and extra-pulmonary TB diagnosed Omanis (n = 1, 344) and expatriates (n = 1, 203), between 2009 and 2018 at the Central Public Health Laboratories (CPHL), Ministry of Health, Oman. The laboratory provides TB diagnosis, and in vitro drug susceptibility testing (DST) for the first line anti-TB drugs, to the population of Oman (4.4 million people comprising 2.8 nationals and 1.6 expatriates). The largest proportion of expatriates in Oman are from high TB burden countries such as India, Pakistan and Bangladesh (NCSI, 2020).
Microbiology methods
Standard microbiological assays were carried out by staff at CPHL, for the identification of members of the M. tuberculosis complex. DST was performed on 2,539 isolates (SM, 1.0 µg/ml; INH, 0.1 µg/ml; RIF, 1.0 µg/ml; EMB, 5.0 µg/ml; PZA, 100.0 µg/ml) using the BACTEC MGIT 960 system (Ardito et al., 2001). A sensitive response refers to susceptibility to all first line drugs (SM, INH, RIF, EMB, and PZA), whereas resistance to any drugs refers to growth at or above the lowest drug concentration that inhibits the wild type (susceptible) strain. Different drug resistance profiles were identified including: resistance to a single drug (mono-resistant (MonoR)), resistance to more than one drug but not to both INH and RIF (poly-resistant (PolyR)), resistance to at least INH plus RIF (multi-drug resistant (MDR)),) and MDR plus resistance to a second line anti-TB treatment, fluoroquinolone, and least one of the injectable second-line drugs (extensively-drug resistant (XDR)) (Song et al., 2019).
Ethical approval (SQU-EC/075/18) for the study was granted by the Ethics Committee of The College of Medicine and Health Sciences, Sultan Qaboos University, Oman. Patients’ consent was not obtained as this study examined archived heat killed DNA samples obtained from material cultured as part of the routine diagnosis process by staff of the Central Public Health Laboratories, Ministry of Health, Oman.
Detection of drug resistance-conferring mutations
DNA was extracted from Mycobacterium tuberculosis isolates using the heat-killing method (Warren et al., 2006). PCR and targeted sequencing were used to detect mutations in nine genes implicated in resistance to SM (rpsL and rrs), INH (katG, ahpc, InhA/InhA promoter), RIF (rpoB), PZA (pncA) and EMB (embB and emb C). Primer sequences and PCR conditions are described in Table S1.
Spoligotyping
Spacer oligonucleotide typing (spoligotyping) was successfully completed on 1,295 isolates (629 Omanis and 666 expatriates), as described elsewhere (Al-Mahrouqi et al., 2022; Kamerbeek et al., 1997). Briefly, the direct repeat (DR) region of M. tuberculosis was amplified using a pair of PCR primers. The PCR products were hybridized to a set of 43 oligonucleotide probes corresponding to spacers on the DR region and covalently bound to the membrane. Obtained spoligo-patterns were then compared to the SITVIT-Web database (http://www.pasteur-guadeloupe.fr:8081/SITVIT_ONLINE, http://www.pasteur-guadeloupe.fr:8081/SITVIT2/files/SITVIT-KBBN_report_310313.xls) for identification of spoligo families and spoligotype international types (SIT) (Demay et al., 2012).
Data analysis
Associations between categorical variables were tested using Chi-squared and/or Fisher’s exact tests and was applied to the association of DST among isolates from Omanis and expatriates, as well as the association of drug resistance-conferring mutations with their corresponding DST. In addition, chi-squared/Fisher’s exact tests were used to examine the distribution of different resistance profiles (MonoR, PolyR and MDR) and drug resistance-conferring mutations in different M. tuberculosis lineages. Fisher’s exact test was used to compare variables when the observed count was <5 in 20% or more of the cells in 2 × 2 chi-squared table. Logistic regression models were used to estimate the effect of demographic variables (Omanis vs expatriates) on the probability of detecting DST. Odds ratio (OR) and 95% confidence intervals (CI), with their associated log likelihood chi-squared test were presented for logistic regression models. Analyses was conducted in SPSS, version 23 and R program, version 1.4.1717.
Results
Characteristics of study subjects
We examined 2,539 of 2,547 M. tuberculosis strains obtained from Omanis (1,341, 52.8%) and expatriates (1,203, 47.2%). The age of patients ranged between 3 and 100 years, with a mean of 44.2 (20.2 ± SD) among Omanis and 33.7 (10.2 ± SD) for expatriates. Most of the patients were male (n = 1, 549, (61.0%)) with a slightly higher percentage of males among expatriates (51.8%) compared to Omanis (48.2%) (P = 0.218).
Drug susceptibility profile of M. tuberculosis isolates
Of the 2,539 M. tuberculosis isolates examined, 2,198 (86.6%) were sensitive to the first line therapy (INH, RIF, SM, EMB and PZA) (Fig. S1). The remaining 341 (13.4%) isolates fell into four drug resistance profiles: 242 (71%) were MonoR, 40 (11.7%) were PolyR, 49 (14.4%) were MDR, and 9 (2.6%) wereXDR. Of the MonoR strains, 92 (38%) were INHR, 76 (31.4%) were PZAR, 65 (26.9%) were SMR and 9 (3.7%) were RIFR (Table 1).
| Expatriates 1,198 (47.2%) | Omanis 1,341 (52.8%) | P-value | |
|---|---|---|---|
| Sensitive | 1022 (85.3%) | 1176 (87.6%) | 0.637* |
| Any drug resistance | 176 (14.7%) | 165 (12.3% ) | |
| SMR | 35 (53.8%) | 30 (46.2%) | 0.689a |
| INHR | 60 (65.2%) | 32 (34.8%) | 0.002a |
| RIFR | 4 (44.4%) | 5 (55.6%) | 0.663a |
| PZAR | 31 (40.8%) | 45 (59.2%) | 0.032a |
| PolyR | 25 (62.5%) | 15 (37.5%) | 0.143a |
| MDR | 21 (35.6%) | 38 (64.4%) | 0.007a |
Similar rate of resistance to any drug was seen among M. tuberculosis isolated from Omanis and expatriates (P = 0.637). However, variations were noted in INHR (Log Likelihood ratio = −194.30; χ2, 9.66; P = 0.002), PZAR (Likelihood ratio = −179.9; χ2,5.01; P = 0.025) and MDR (Log Likelihood ratio = −140.16; χ2,4.275; P = 0.039). INHR was lower among Omanis (OR = 0.46; 95% CI [0.28–0.75]), contrasting the elevated rates of PZAR-TB (OR = 1.79; 95% CI [1.07–3.02]) and MDR (OR = 1.90; 95% CI [1.03–3.56]) (Table 2).
Spatial distribution of drug susceptibility in M. tuberculosis
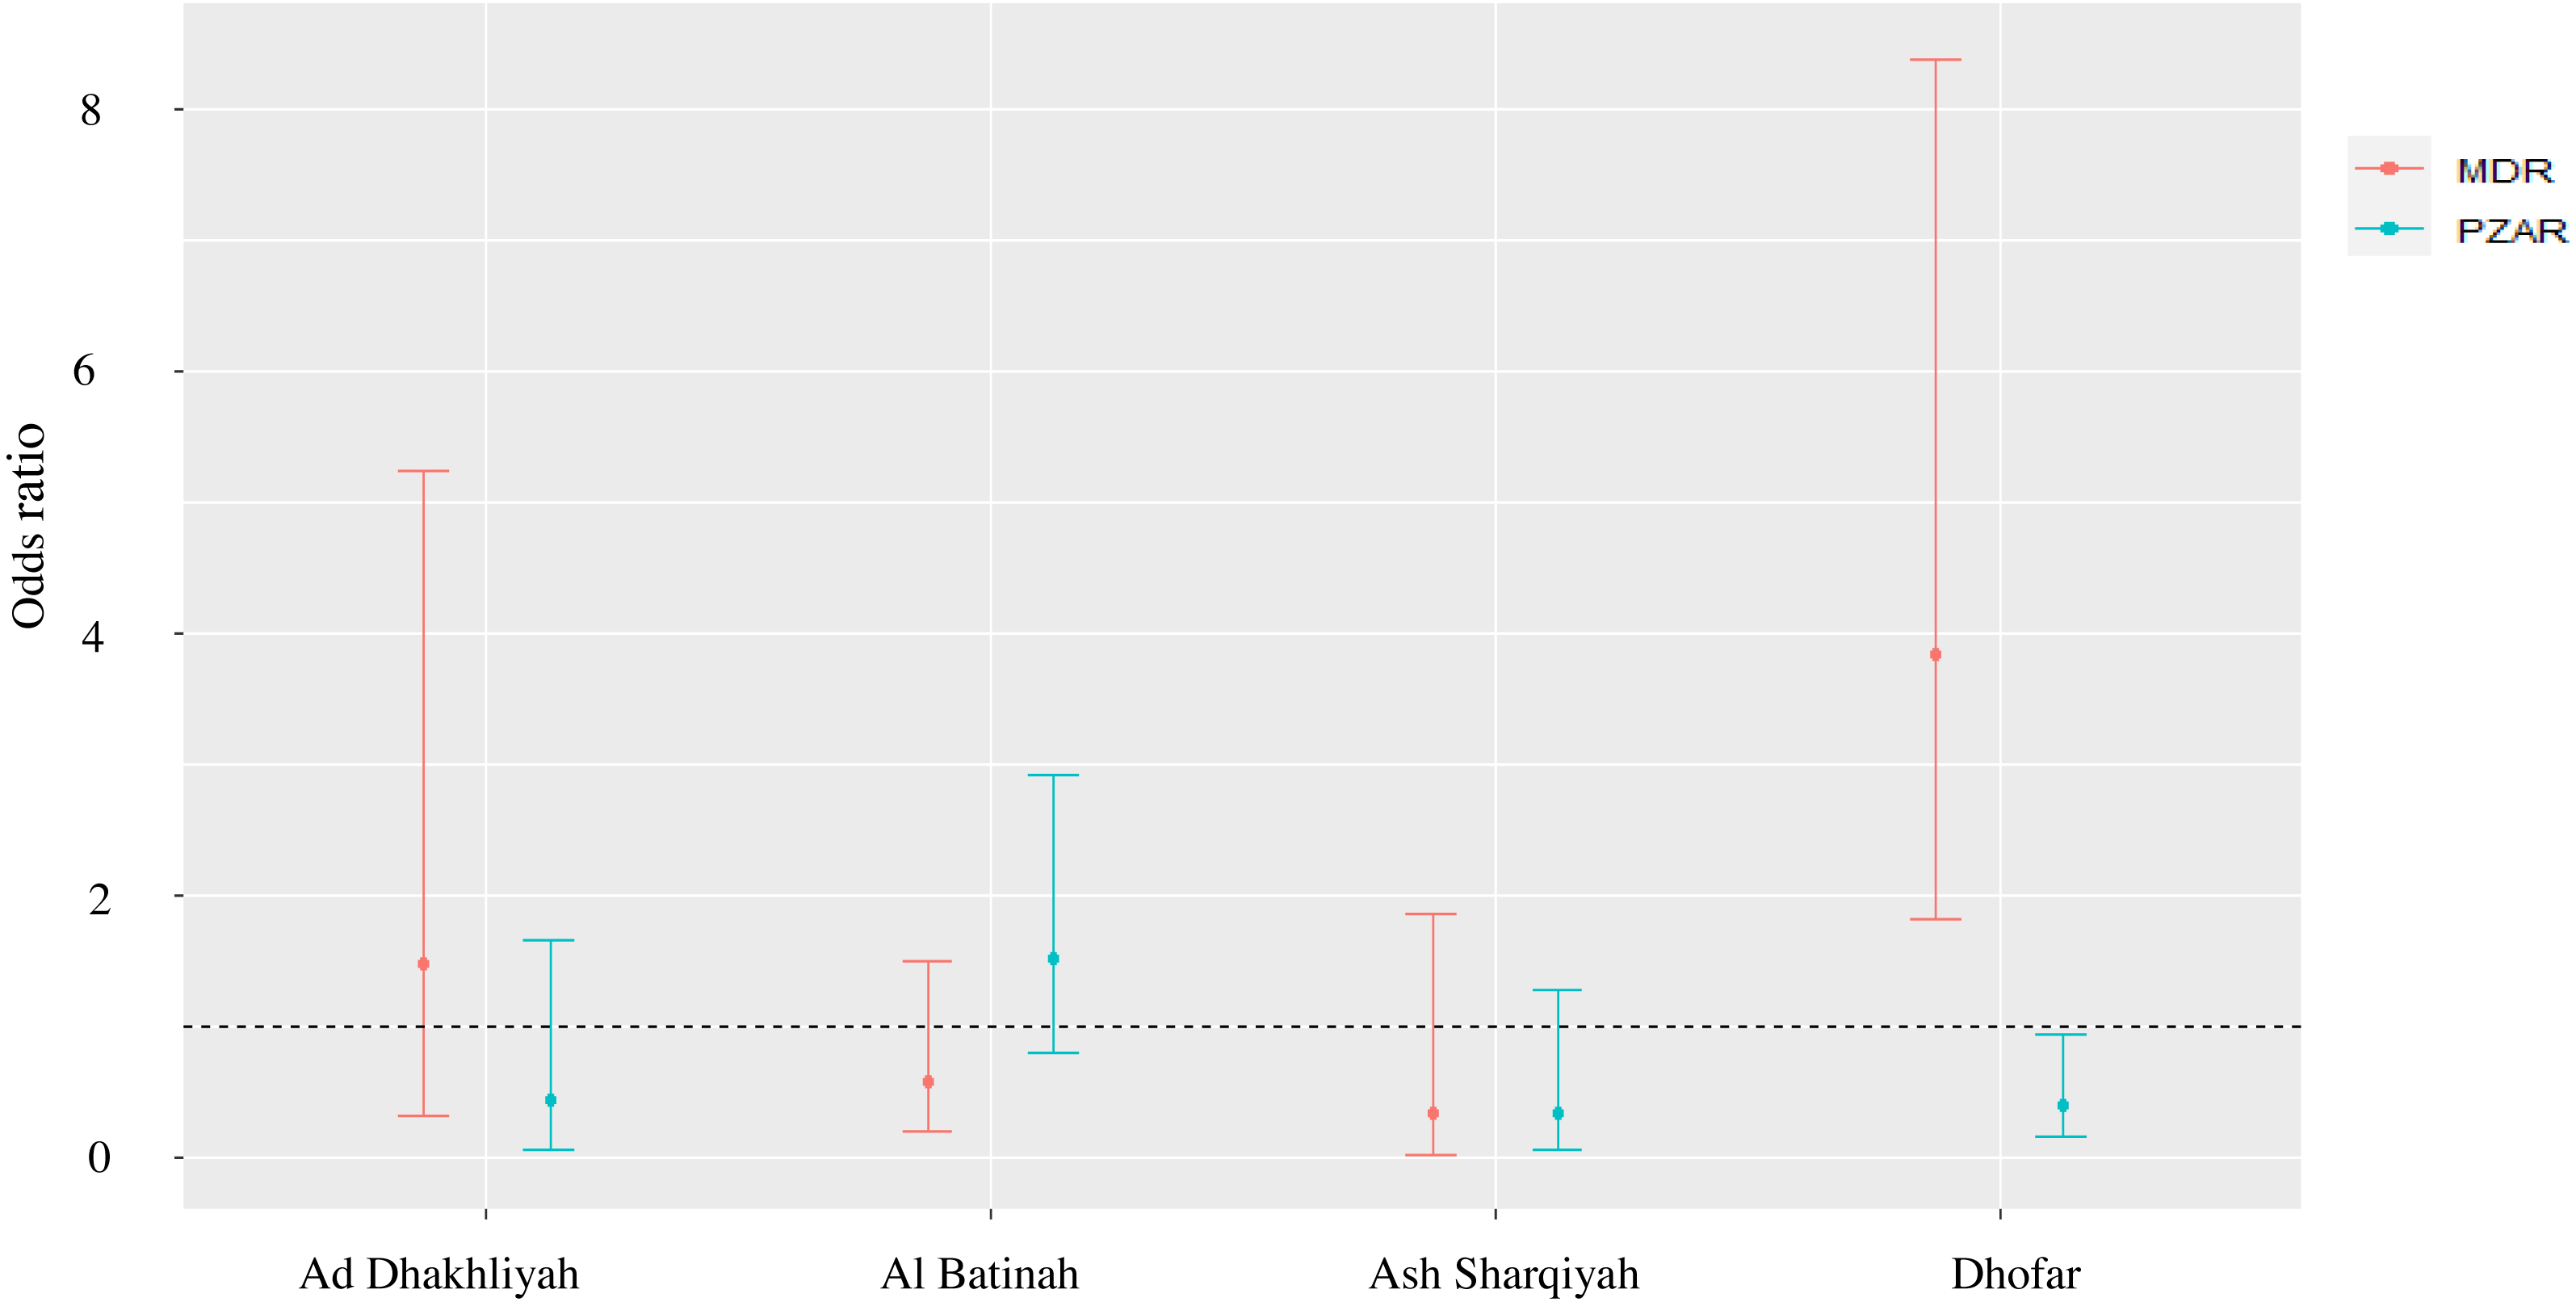
The MonoR forms, SMR (Log Likelihood ratio = −131.77; χ2,6.19; P = 0.186), INHR (Log Likelihood ratio = −172.04; χ2,8.51; P = 0.074) and the PolyR cases (Log Likelihood ratio = −104.82; χ2,7.92; P = 0.095) were stable in different regions in Oman. However, variation was seen in RIFR (Log Likelihood ratio = −31.17; χ2,10.88; P = 0.028), PZAR (Log Likelihood ratio = −143.94; χ2,13.11; P = 0.011) and MDR (Log Likelihood ratio = −116.82; χ2,23.35; P = 0.000). For example, RIFR was 14 and 11 times higher in Ad Dakhliyah (OR = 14.53; 95% CI [1.32–324.20]) and Ash Sharqiyah (OR = 11.47; 95% CI [1.05–254.22]), respectively, compared to Muscat. Likewise, in Dhofar, MDR was four time higher (OR = 3.84; 95% CI [1.82–8.38]) and PZAR was significantly lower compared to Muscat (OR = 0.40; 95% CI [0.15–0.93]) (Fig. 1).
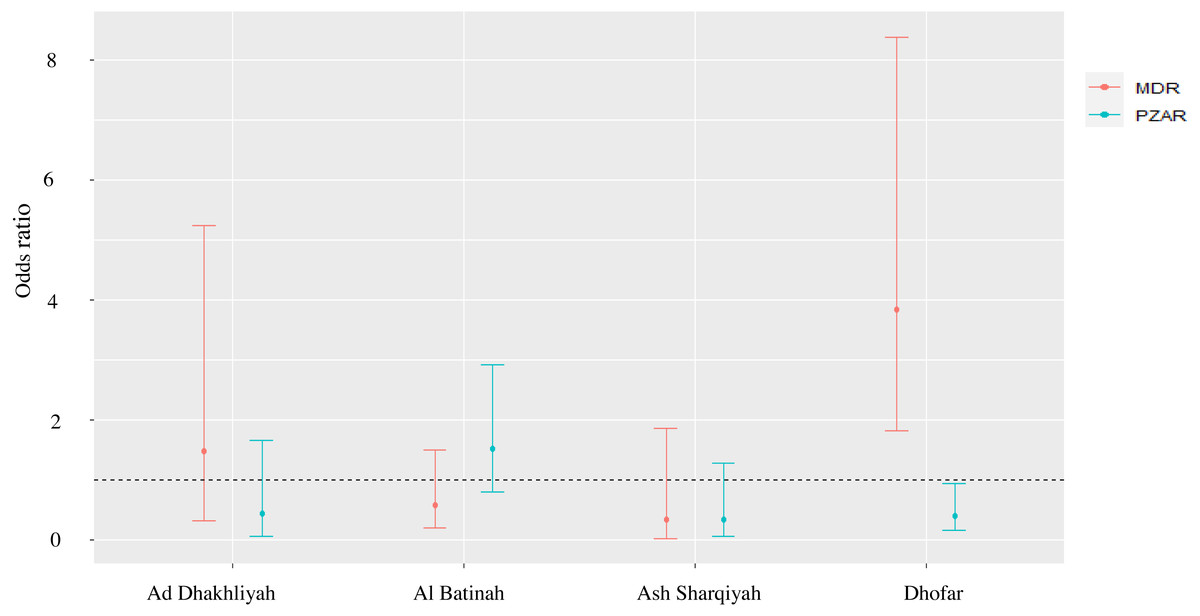
Figure 1: Odds ratio and 95% confidence interval of PZAR-TB and MDR-TB to evaluate the strength of association between DST profiles and provinces with > 10 reported TB cases.
Temporal distribution of drug susceptibility in M. tuberculosis
Overall, resistant M. tuberculosis isolates remained stable over the study period, with the exception of INHR (Table S2). The PolyR and MDR M. tuberculosis strains remained stable over the study period (P = 0.158 and 0.248 respectively) (Figs. 2A & 2B). However, the MonoR strains increased steadily, with 2 times higher prevalence in 2018 compared to 2009 (Log Likelihood = −791.78; χ2,19.98; P = 0.025) (OR 2.1; 95% CI [1.13–3.76]) (Fig. 2C), driven by PZAR (Log Likelihood = −161.4; χ2,42.00; P = 0.000) (Fig. 2D). In contrast, INHR decreased steadily (Log Likelihood = −189.7; χ2,19.00; P = 0.025) (Fig. 2E) while SMR (P = 0.113) and RIFR (P = 0.210) remained unchanged (Figs. 2F & 2G).
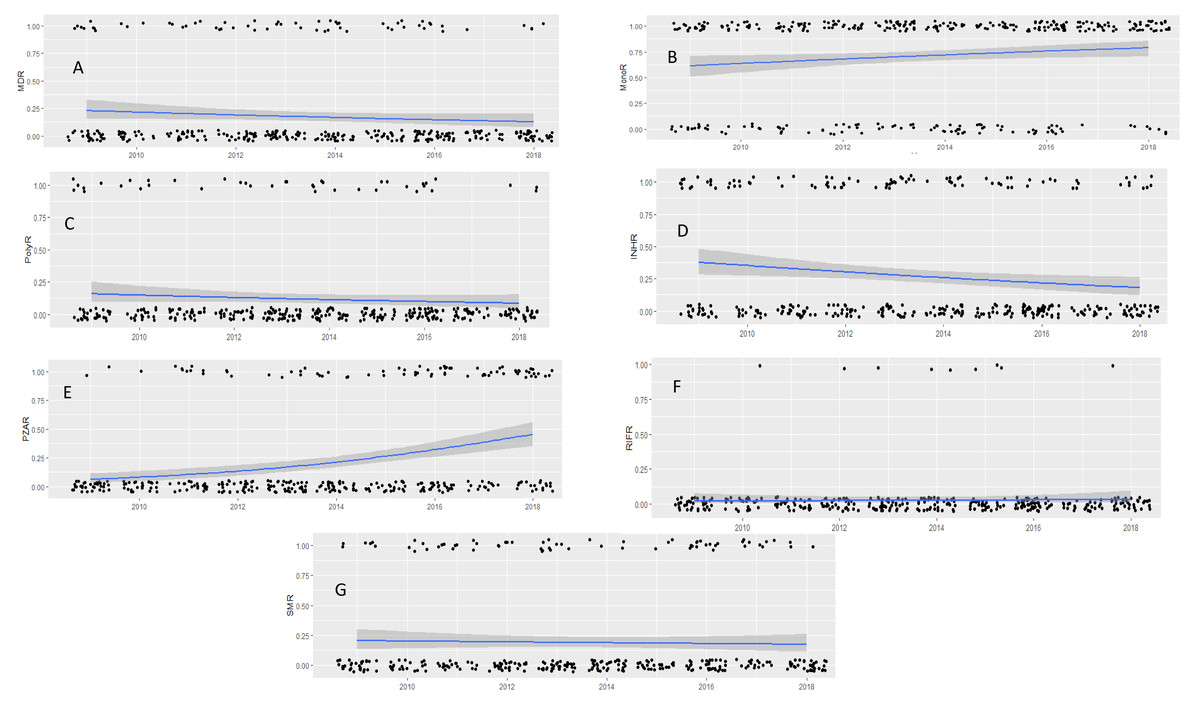
Figure 2: Drug susceptibility test (DST) profiles of M. tuberculosis isolates collected between 2009 and 2018.
MDR pattern (A), mono-resistance (B), poly-resistance (C) and pattern of INHR (D), PZAR (E), RIFR (F) SMR (G). Black dots are the observed data with 0 being negative and 1 being positive for drug resistance response. Lines represent estimated prevalence overtime based on logistic regression models, gray shade around the line is the 95% confidence intervals. P and logistic regression model and odd ratio (OR) correspond to time of significant change in prevalence compared to the reference year (2009).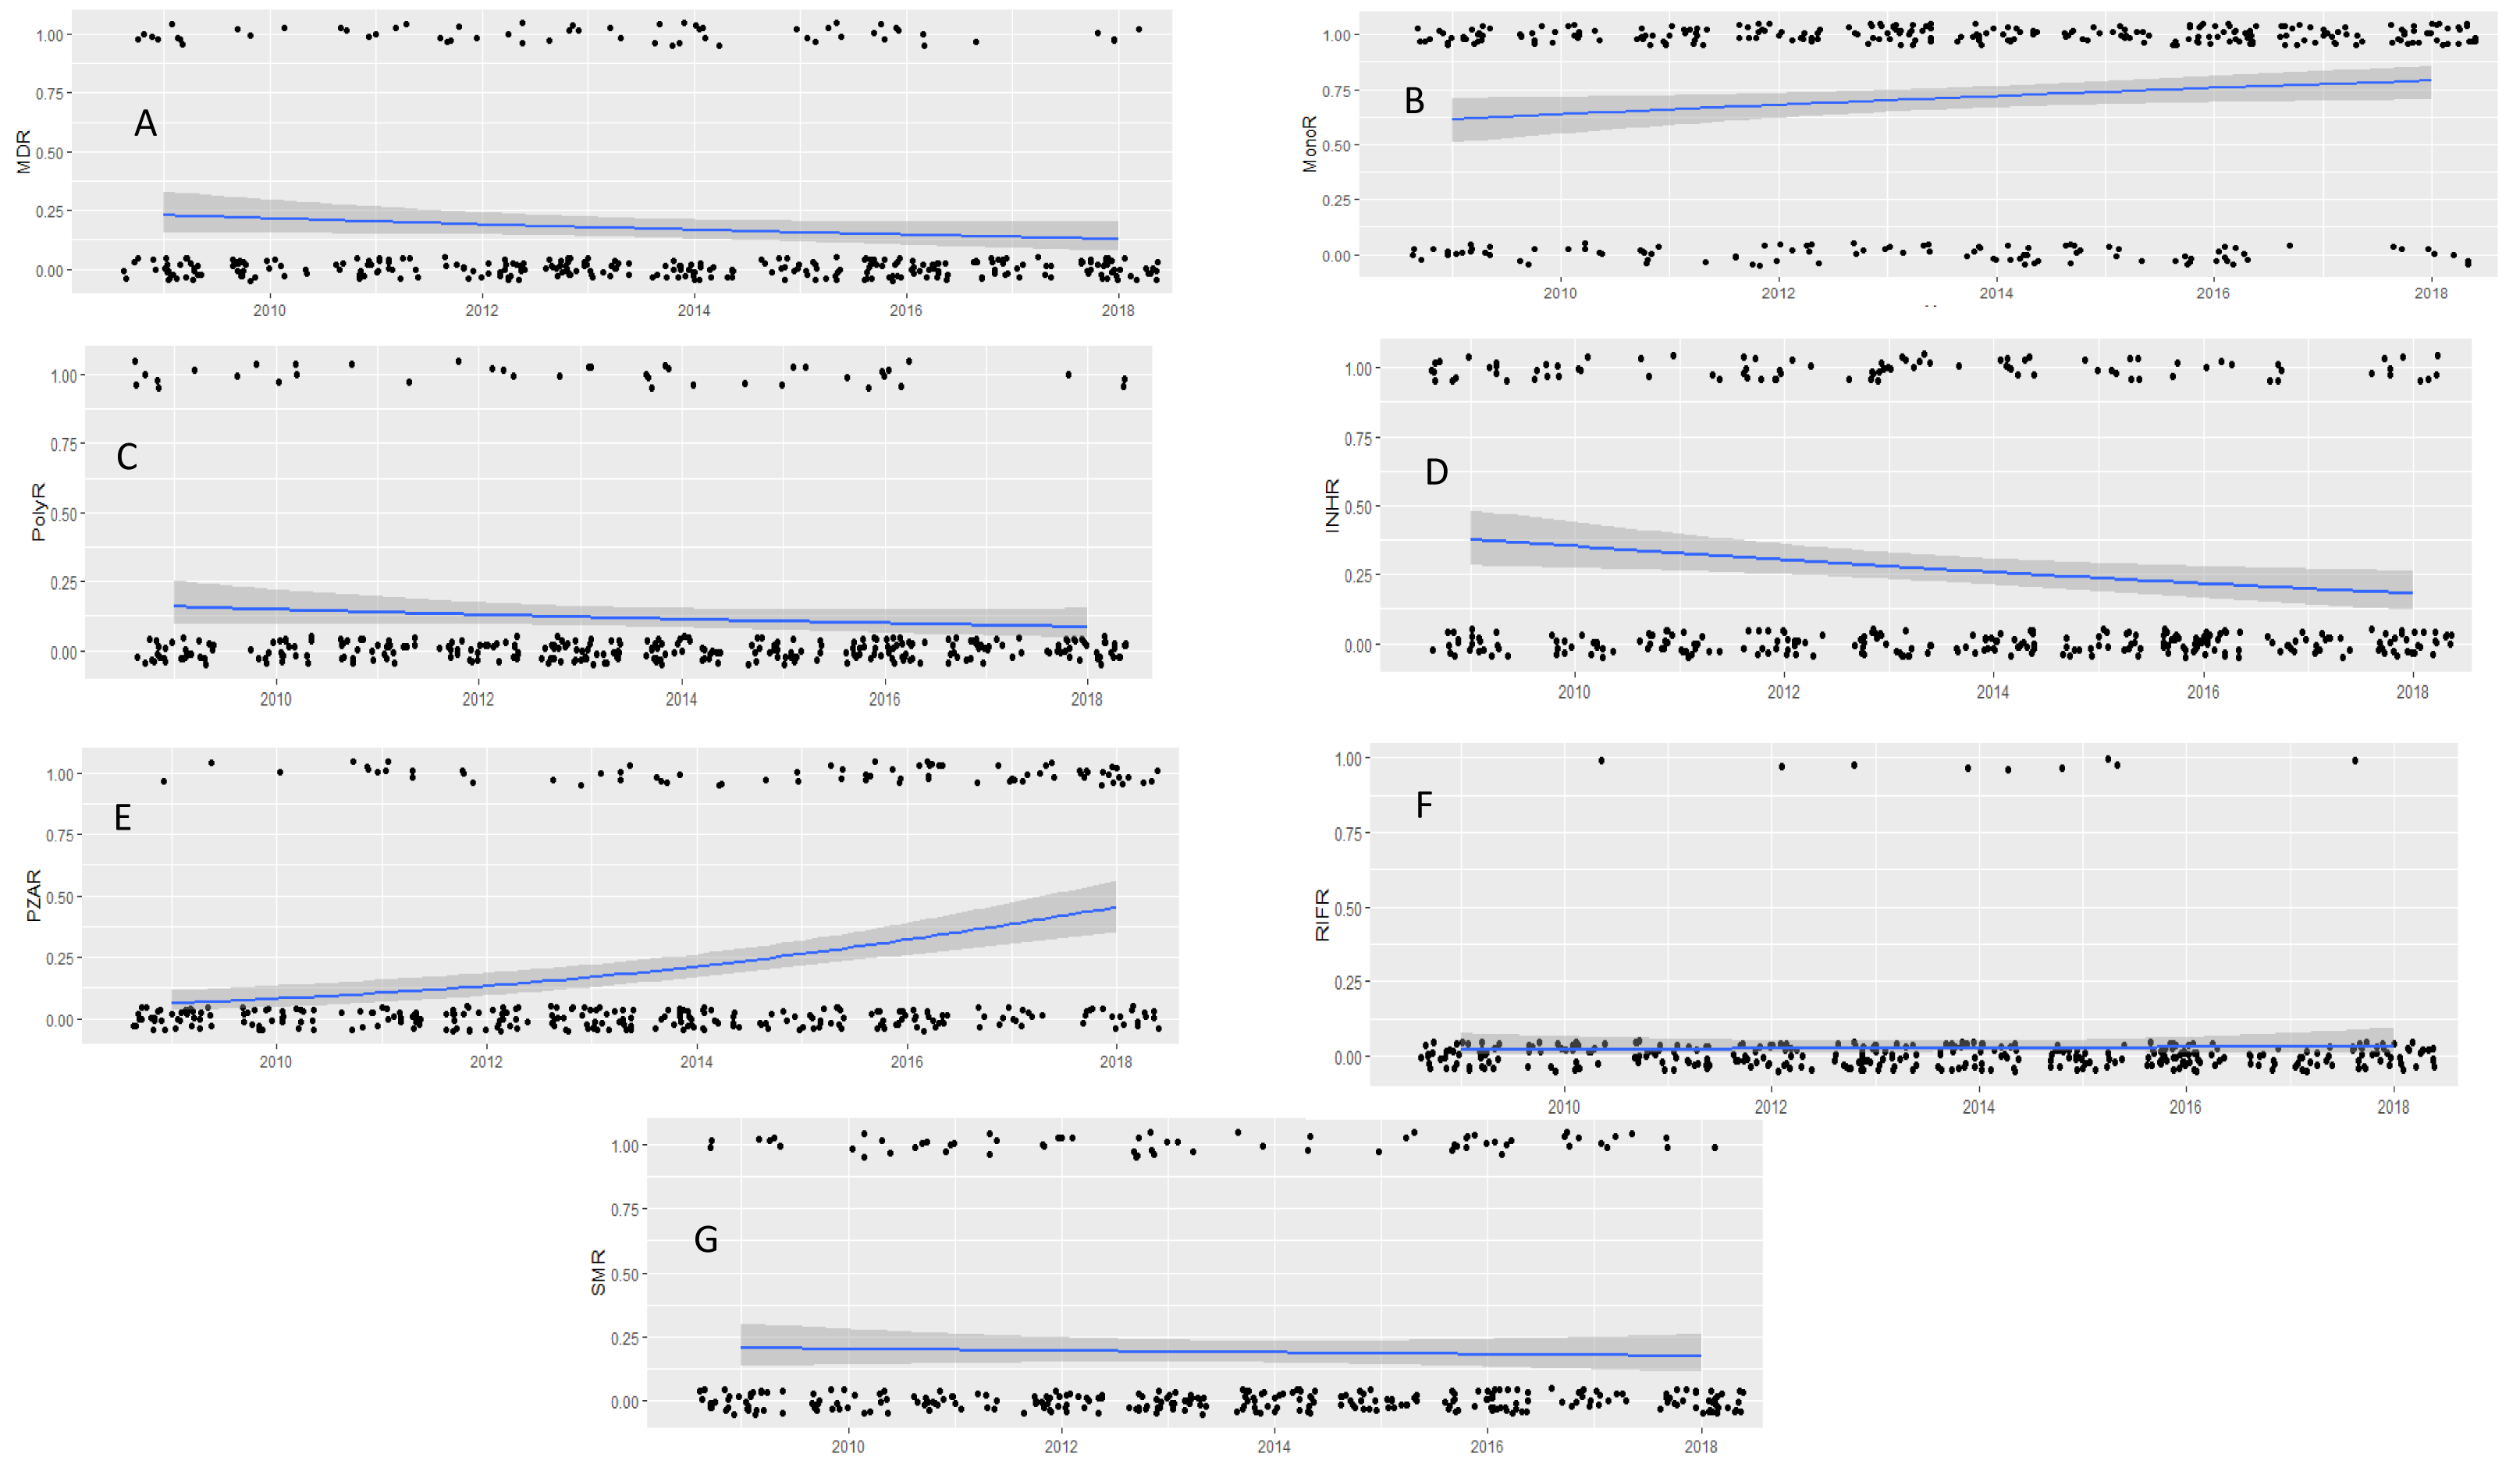
Diversity of drug resistant M. tuberculosis isolates
Spoligotyping was completed for 242/341 (70.9%) drug-resistant M. tuberculosis isolates (106 Omanis and 136 expatriates) (Fig. S1). Of these, 187 (76.4%) exhibited known spoligotype patterns (SIT), while 55 (22.7%) were ‘orphans’. The isolates with known spoligotypes comprised 8 lineages, EAI (66, 35.3%), CAS (50, 26.7%), Beijing (28, 15.0%), T (21, 11.2%), LAM (10, 5.3%), H (5, 2.7%), X (2, 0.5%), Ural-1 (2, 0.5%), Cameroon (2, 0.5%) and UK (1, 0.5%). Of these, 137 (73.26%) isolates existed in clusters of 33 spoligo-profiles (with 2 to 28 isolates), and 50 (26.74%) were singletons, each with a distinct profile. Of the above clusters, 16/33 (48.48%) included M. tuberculosis isolates from both Omanis and expatriates (Table 3), suggesting close genetic relatedness and possible transmission of drug-resistant lineages between the two groups.
| Clade | SIT | Expatriate n(%) |
Omani n(%) |
Total n(%) |
P-value |
|---|---|---|---|---|---|
| Beijing | 1 | 17 (36.2) | 11 (22.0) | 28 (28.9) | 0.124 |
| CAS1-Delhi | 25 | 2 (4.2) | 6 (12.0) | 8 (8.2) | 0.526 |
| 26 | 12 (25.5) | 12 (24.0) | 24 (24.7) | ||
| 309 | 1 (2.1) | 2 (4.0) | 3 (3.1) | ||
| EAI1-SOM | 48 | 2 (4.2) | 1 (2.0) | 3 (3.1) | 0.758 |
| 72 | 1 (2.1) | 3 (6.0) | 4 (4.1) | ||
| EAI3-IND | 11 | 3 (6.4) | 1 (2.0) | 4 (4.1) | 0.918 |
| 298 | 1 (2.1) | 1 (2.0) | 2 (2.1) | ||
| 3803 | 1 (2.1) | 3 (6.0) | 4 (4.1) | ||
| EAI5 | 126 | 1 (2.1) | 1 (2.0) | 2 (2.1) | ND* |
| 2921 | 1 (2.1) | 2 (4.0) | 3 (3.1) | ||
| LAM11-ZWE | 59 | 1 (2.1) | 2 (4.0) | 3 (3.1) | ND |
| T1 | 393 | 1 (2.1) | 1 (2.0) | 2 (2.1) | ND |
| T2 | 52 | 1 (2.1) | 1 (2.0) | 2 (2.1) | ND |
| T3-ETH | 149 | 1 (2.1) | 2 (4.0) | 3 (3.1) | ND |
| X3 | 92 | 1 (2.1) | 1 (2.0) | 2 (2.1) | ND |
| Total | 47 | 50 | 97 | ||
Notes:
The patterns of resistance (MonoR, PolyR and MDR) were found in most of the spoligotype-defined lineages (Table 4). However, MonoR and MDR were significantly associated with strain lineage (p = 0.000) for both types of resistance patterns (Table 3). MonoR was disproportionately higher in the EAI and CAS lineages, whereas MDR was over-represented in the Beijing, CAS, and T lineages. The variation in MonoR seen in the different linages was linked to SMR (p > 0.001) and PZAR (p > 0.001) (Table 4).
| Clade | Total | Any drug resistance | Total | Resistance to one drug | |||||
|---|---|---|---|---|---|---|---|---|---|
| n = 242 | n=181 | ||||||||
| MonoRb | PolyRc | MDRd | SMRe | INHRf | RIFRg | PZARh | |||
| EAI | 100 | 90(37.2%) | 8(3.3%) | 2(0.8%) | 90 | 13(7.2%) | 23(12.7%) | 1(0.6%) | 53(29.3%) |
| BEIJING | 28 | 12(5.0%) | 4(1.7%) | 12(5.0%) | 12 | 8(4.4%) | 3(1.7%) | – | 1(0.6%) |
| CAS | 60 | 41(16.9%) | 9(3.7%) | 10(4.1%) | 41 | 15(8.3%) | 19(10.5% | 4(2.2%) | 3(1.7%) |
| T | 25 | 13(5.4%) | 2(0.8%) | 10(4.1%) | 13 | 2(1.1%) | 7(3.9%) | 2(1.1%) | 2(1.1%) |
| LAM | 11 | 8(3.3%) | 3(1.2%) | – | 1(0.6%) | 6(3.3%) | – | 1(0.6%) | |
| H | 10 | 10(4.1) | – | – | 10 | 3(1.7%) | 6(3.3%) | – | 1(0.6%) |
| Othersa | 8 | 25(10.3%) | 3(1.2%) | 1(0.4%) | 25 | 6(3.3%) | 12(6.6%) | 1(0.6%) | 6(3.3%) |
| P- value | 0.000 | 0.154 | 0.000 | 0.028 | 0.632 | 0.329 | 0.000 | ||
Mutations in M. tuberculosis drug resistance genes
Full length sequences for nine genes implicated in resistance to SM (rpsL and rrs), INH (katG, ahpc, InhA/InhA promoter), RIF (rpoB), PZA (pnc A) and EMB (emb B and emb C) were obtained for 356 of the M. tuberculosis isolates (211 (58.8%) sensitive and 154 (42.2%) resistant to any drug) (Fig. S1). The resistant isolates were obtained from 58 (37.7%) Omanis and 96 (62.3%) expatriates (Table 5).
| Drug | Gene | Allele | Overall mutation prevalence | Sensitive isolates mutation (%) |
Resistant isolates mutation (%) | p- value |
|---|---|---|---|---|---|---|
| Streptomycin | rpsL | K43R | 20/282(7.1%) | 1/240 (0.4%) | 19/42 (45.2%) | 0.000 |
| R86W | 1/282(0.4%) | 0.00 (0.00%) | 1/42 (2.4%) | ND* | ||
| V19F | 1/282(0.4%) | 1/240 (0.4%) | 0(0%) | ND | ||
| rrs | Q302E | 2/190(1.1%) | 1/168 (0.6%) | 1/22 (4.5%) | ND | |
| L341F | 3/190(1.6%) | 3/168 (1.8%) | (0%) | ND | ||
| A409G | 1/190(0.5%) | 1/168 (0.6%) | (0%) | ND | ||
| Isoniazid | inhA, (Pro) | C-15T | 14/299(4.7%) | 1/233 (0.4%) | 13/66 (19.7%) | 0.000 |
| G-17T | 7/299(2.3%) | (0%) | 7/66 (10.6%) | 0.000 | ||
| G-47A | 1/299(0.3%) | 1/233 (0.4%) | (0%) | ND | ||
| inhA, (OF) | I95L | 1/313(0.3%) | (0%) | 1/71 (1.4%) | ND | |
| I194T | 1/313(0.3%) | (0%) | 1/71 (1.4%) | ND | ||
| katG | S315T | 34/309(11%) | 1/239 (0.4%) | 33/70 (47.1%) | 0.000 | |
| P364S | 2/298(0.7%) | 1/239 (0.4%) | 1/70 (1.4%) | ND | ||
| A379D | 1/298(0.3%) | (0%) | 1 (0.3%) | 0.228 | ||
| S383A | 1/298(0.3%) | 1/239 (0.4%) | (0%) | ND | ||
| R463L | 166/298(55.7%) | 129/239 (54.0%) | 37/70 (52.9%) | 0.457 | ||
| L472I | 1/298(0.3%) | 1/239 (0.4%) | (0%) | ND | ||
| T475I | 1/298(0.3%) | 1/239 (0.4%) | (0%) | ND | ||
| V503A | 2/298(0.7%) | 2/239 (0.8%) | (0%) | ND | ||
| L526H | 1/298(0.3%) | (0%) | 1/70 (1.4%) | ND | ||
| D735A | 1/298(0.3%) | (0%) | 1/70 (1.4%) | ND | ||
| ahpC | F77V | 1/250(0.4%) | 1/194 (0.5%) | (0%) | ND | |
| Rifampicin | rpoB | H343Q | 1/306(0.3%) | 1/276 (0.4%) | (0%) | ND |
| V359A | 1/306(0.3%) | 1/276 (0.4%) | (0%) | ND | ||
| M390T | 1/306(0.3%) | 1/276 (0.4%) | (0%) | ND | ||
| S441L | 1/306(0.3%) | (0%) | 1/30 (3.3%) | ND | ||
| H445L | 1/306(0.3%) | (0%) | 1/30 (3.3%) | ND | ||
| H445D | 1/306(0.3%) | (0%) | 1/30 (3.3%) | ND | ||
| S450L | 16/306(9.8%) | (0%) | 16/30 (53.3%) | 0.000 | ||
| K512R | 8/306(2.6%) | 7/276 (2.5%) | 1/30 (3.3%) | ND | ||
| P541L | 1/306(0.3%) | 1/276 (0.4%) | (0%) | ND | ||
| V575I | 2/306(0.7%) | 2/276 (0.8%) | (0%) | ND | ||
| Ethambutol | embB | M306V | 4/287(1.4%) | 3/281 (1.1%) | 1/6 (16.7%) | ND |
| M306I | 2/287(0.7%) | 2/281 (0.7%) | (0%) | ND | ||
| A313V | 1/287(0.3%) | 1/281 (0.4%) | (0%) | ND | ||
| S347R | 1/287(0.3%) | 1/281 (0.4%) | (0%) | ND | ||
| E378A | 111/287(38.7%) | 111/287 | (0%) | ND | ||
| G406D | 2/287(0.7%) | 2/281 (0.7%) | (0%) | ND | ||
| embC | T270I | 41/101(40.6%) | 41/98 (41.8%) | (0%) | ND | |
| N394D | 40/101(39.6%) | 40/98 (40.8%) | (0%) | ND | ||
| Pyrazinamide | pncA | I6L | 1/287(0.3%) | (0%) | 1/54 (1.9%) | ND |
| Q10* | 1/287(0.3%) | (0%) | 1/54 (1.9%) | ND | ||
| D12A | 2/287(0.7%) | (0%) | 2/54 (3.7%) | ND | ||
| D12E | 1/287(0.3%) | (0%) | 1/54 (1.9%) | ND | ||
| P54Q | 2/287(0.7%) | 1/233 (0.4%) | 1/54 (1.9%) | ND | ||
| H71R | 1/287(0.3%) | (0%) | 1/54 (1.9%) | ND | ||
| F106L | 1/287(0.3%) | 1/233 (0.4%) | (0%) | ND | ||
| G132D | 1/287(0.3%) | (0%) | 1/54 (1.9%) | ND |
Notes:
Streptomycin related mutations
Three mutations were detected in the rpsL sequences from 282 isolates. Of these, mutations V19F and R86W were rare, and seen among both streptomycin sensitive (SMS) and streptomycin resistant (SMR) isolates. However, mutation K43R was frequent, found in 45% of SMR isolates compared to 0.4% SMS isolates (p > 0.001) (Table 5). However, the rrs sequences (n = 190 isolates) showed three infrequent mutations (Q302E (1.1%), L341F (1.6%), A409G (0.5%)), seen among both SMS and SMR isolates (Table 5).
INH related mutations
katG, ahpC, inhA and its promoter region were screened for mutations conferring isoniazid resistance (INHR). Out of 298 isolates, 209 (70.1%) carried 10 mutations in katG, all at a low prevalence (<2%), with the exception of katG S315T (11%) and katG R463L (55.7%). The katG S315T mutation occurred in 47.1% of INHR compared to 0.4% isoniazid sensitive (INHS) isolates (p > 0.001), whereas R463L was similar in INHS (54.0%) and INHR (52.9%) isolates (P = 0.457) (Table 5).
Mutations inhA promoter C-15T and G-17T were found in 19.7% (p > 0.001) and 10.6% (p > 0.001) of INHR isolates compared to 0.4% and 0.00% of INHS isolates, respectively. Additional rare mutations (I95L (1.4%) and I194T (1.4%)) were seen in the coding region of inhA,whereas no mutations were found in the ahpC gene (Table 5).
Rifampicin related mutations
rpoB held 10 mutations. Of these, S450L was linked to rifampicin resistance (RIFR) in 16/30 (53%) isolates (p > 0.001) (Table 3). This mutation plus a further 3 (S441L, H4445l, H445D) existed exclusively in RIFR isolates, in the 81-bp rifampicin-resistance-determining region (RRDR) (codons 426–452), which is associated with high-level RIF resistance (Hirani et al., 2020). The remaining six mutations were rare, located outside the RRDR region, and seen only in rifampicin sensitive (RIFS) isolates, (Table 5).
Ethambutol related mutations
emb B (n = 287) and emb C (n = 101) harboured six and two mutations, respectively. With the exception of one mutation (emb B M306V/I), other mutations on both genes existed exclusively in ethambutol sensitive (EMBS) isolates. The emb B M306V/I mutation occurred at a substantially higher frequency among ethambutol resistant (EMBR) isolates (16.7%) compared to EMBS isolates (1.1%) (Table 5). This mutation has been found to be associated with two- and ten-fold higher EMB MIC when the wild type was replaced with M306I and M306V, respectively (Starks et al., 2009). However, mutations embB E 378A (38.7%), emb C T270I (40.6%) and emb C N394D (39.6%), were common in EMBS, and are suggested to be ancestral M. tuberculosis markers (Brossier et al., 2015).
Pyrazinamide related mutations
Eight mutations detected in pncA occurred at low frequency (0.3 to 0.7%). These mutations were seen in 8/54 (14.8%) pyrazinamide resistant (PZAR) isolates compared to 2/287 (0.7%) of pyrazinamide sensitive (PZAS) isolates (p > 0.05) (Table 5).
Drug resistance-conferring mutations among Omanis and expatriates
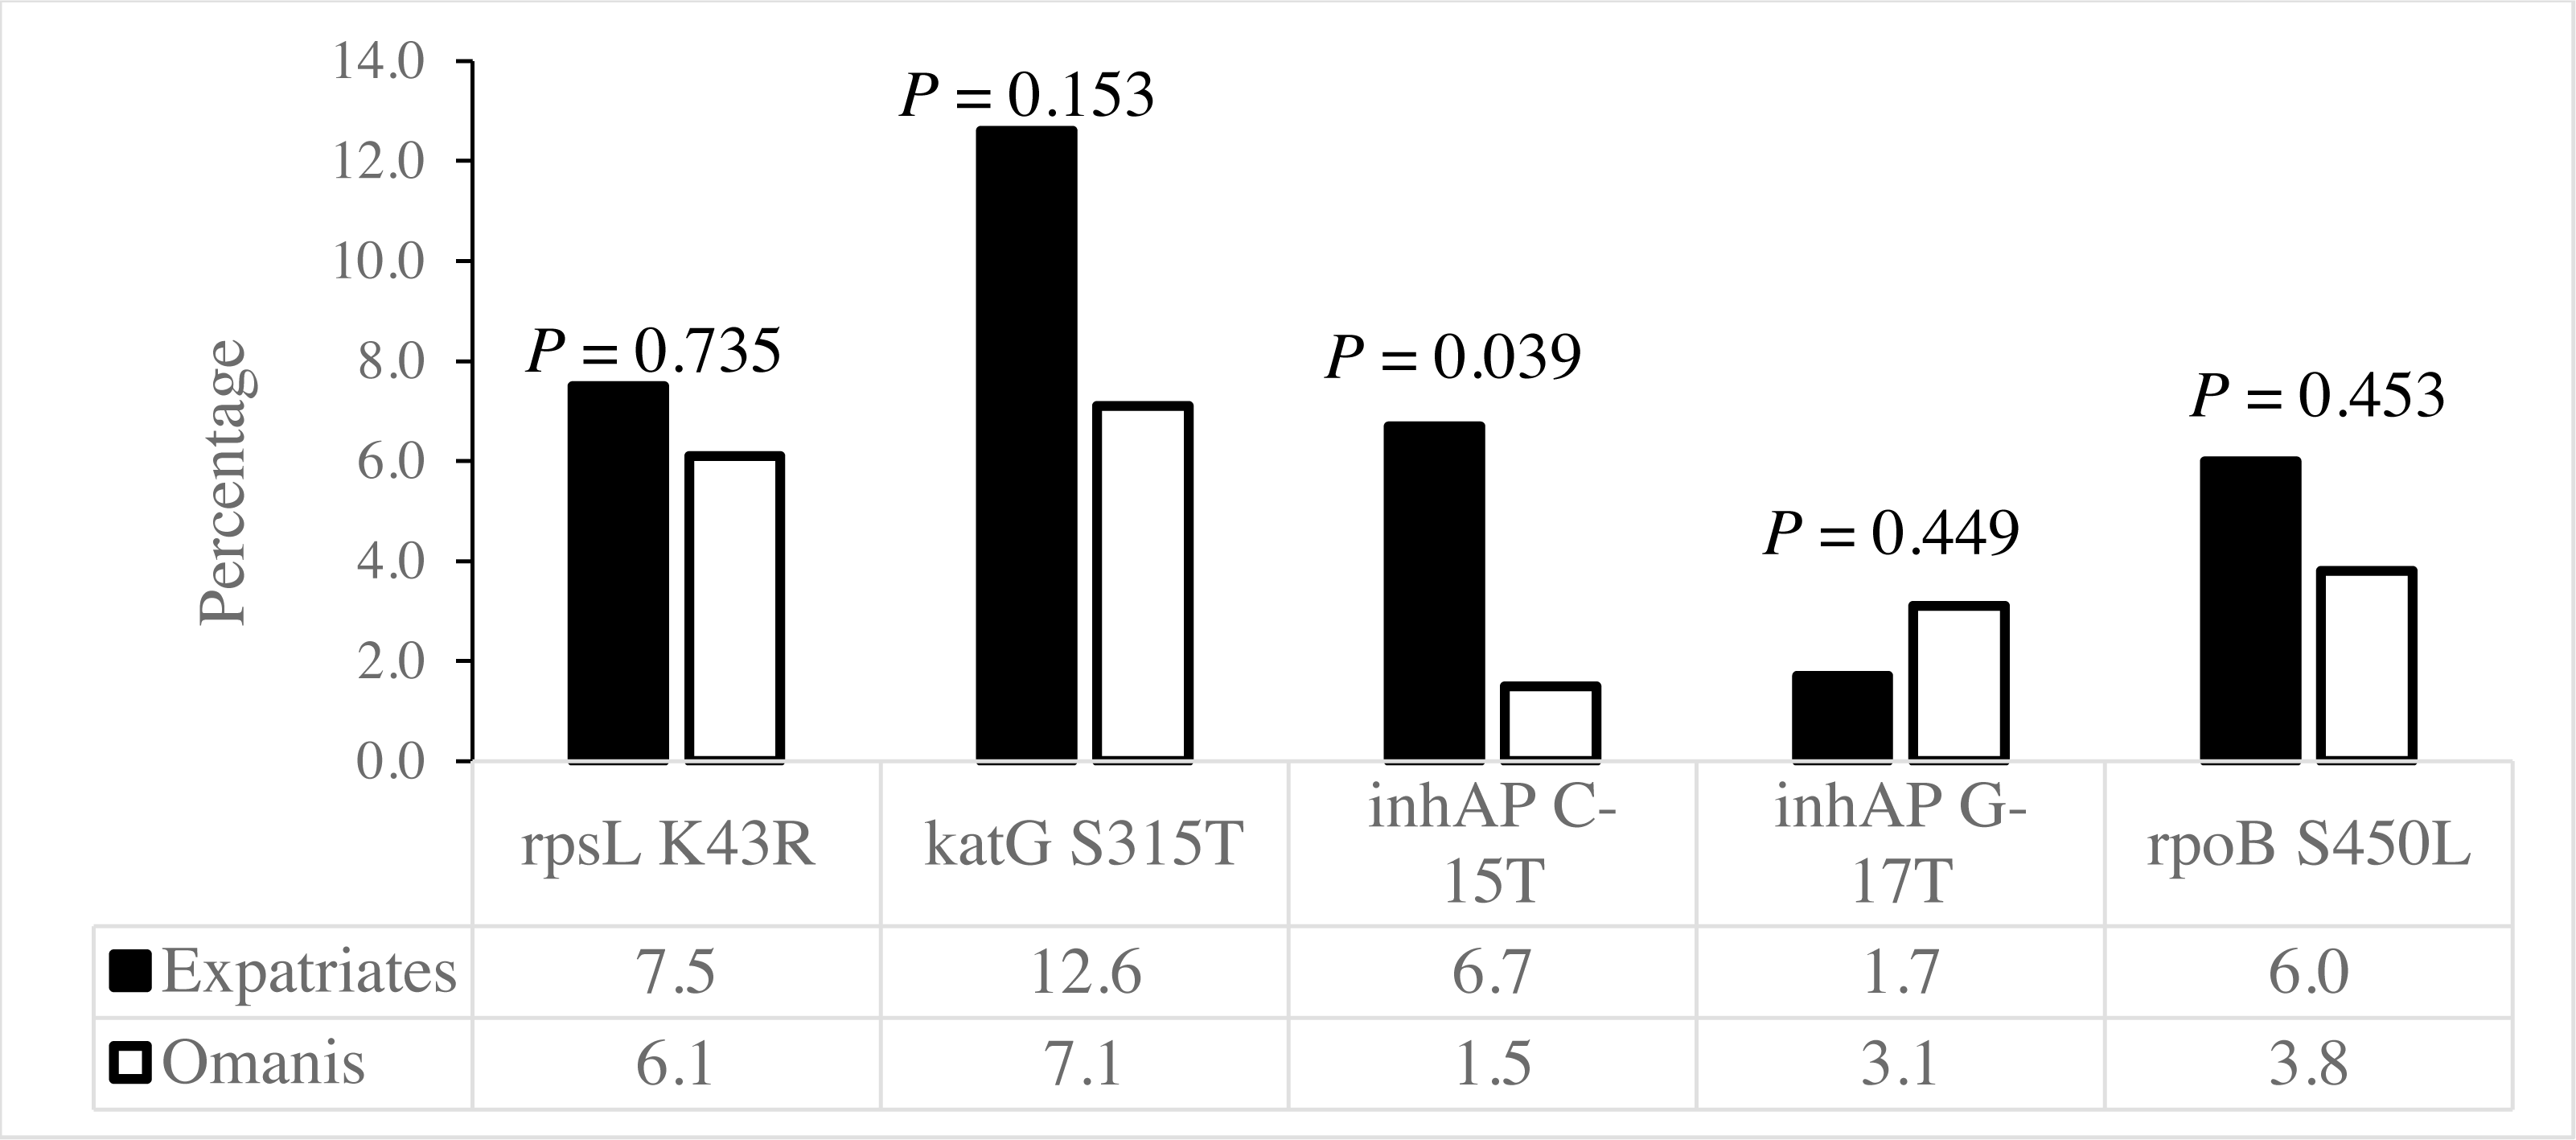
The rpsL K43R, katG S315T and rpoB S450L mutations associated with SMR, INHR and RIFR, respectively, existed at similar frequencies among Omanis and expatriates (Fig. 3). However, the C-15T mutation in the inhA promoter linked to INHR existed at a significantly higher prevalence among expatriates compared to Omanis (Fig. 3).
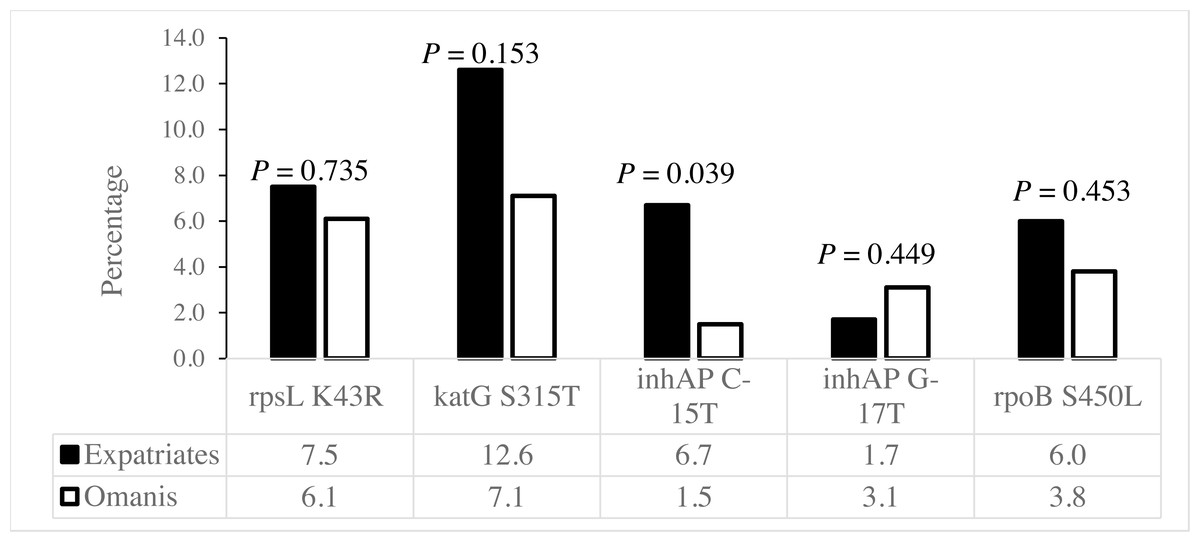
Figure 3: Distribution of drug resistance-conferring mutations among M. tuberculosis obtained from Omanis and expatriates.
Drug resistance-conferring mutations in different M. tuberculosis lineages
We examined whether the distribution of the drug resistance-conferring mutations were influenced by M. tuberculosis genetic background. The rpsL K43R, katG S 315T and rpoB S450L mutations associated with SMR, INHR and RIFR, respectively (Table 6), existed at different frequencies in different lineages (Table 6). The rpsL K43R, katG S315T and ropB S450L mutations were disproportionately higher in isolates of the Beijing lineage, whereas katG S315T and inhA C-15T mutations were over-represented in the EAI lineage. In contrast, isolates from the CAS lineage harboured all of the above mutations (Table 6). Interestingly, the orphan isolates which most likely represent locally evolved strains, had high rates of the evolutionary mutations, embB E378A, embC T270I, embC N394D and katG R463L (Table 6).
| Mutation |
Clades | P-valuea | |||||||
|---|---|---|---|---|---|---|---|---|---|
| EAI | Beijing | CAS | T | LAM | H | Othersb | Orphan | ||
| rpsL K43R | – | 10(55.6%) | 1(5.6%) | 2(11.1%) | – | 1(5.6%) | 1(5.6%) | 3(16.7%) | 0.000 |
| katG-S315T | 4(12.5%) | 9(28.1%) | 9(28.1%) | 8(25.0%) | 1(3.1%) | – | 1(3.1%) | – | 0.001 |
| inhA-15 | 4(57.1%) | – | 1(14.3%) | – | – | – | – | 2(28.6%) | 0.846 |
| inhA-17 | – | – | 3(100.0%) | – | – | – | – | – | 0.000 |
| rpoB S450L | – | 6(40.0%) | 2(13.3%) | 6(40.0%) | – | – | 1(6.7%) | – | 0.000 |
| katG R463L | 49(31.6%) | 20(12.9%) | 35(22.6%) | 2(1.3%) | – | – | 3(1.9%) | 48(29.7%) | 0.000 |
|
embB E378A |
36(63.2%) | – | – | – | – | – | – | 21(36.8%) | 0.000 |
|
embC T270I |
15(68.2%) | – | – | – | – | – | – | 7(31.8%) | 0.000 |
|
embC N394D |
15(68.2%) | – | – | – | – | – | – | 7(31.8%) | 0.000 |
Discussion
This study has revealed widespread resistance to anti-TB drugs in Oman, comprising MonoR, PolyR and MDR. These variable phenotypic responses were consistent between 2009 and 2018, and spatially, across different provinces of Oman (Table S2 ). The drug resistant M. tuberculosis strains were linked to mutations implicated in SMR, INHR and RIFR and MDR (rpsL K43R, katG S315T, InhA -15/-17, rpoB S450L) in other endemic sites (Ghosh, N. & Saha, 2020).
The variable drug resistance patterns we observed in Oman were distributed across 83 M. tuberculosis spoligotype-defined lineages, highlighting a highly diverse reservoir of resistant strains. However, some patterns were overrepresented in certain strain lineages (Table 4). For example, MonoR was disproportionately higher in the EAI and CAS lineages, while MDR was higher in isolates from the Beijing lineage (Table 4). These findings are in line with reports that identified a higher proportion of MonoR (RIFR and SMR) among CAS and T lineages in India and other countries of origin of expatriates (Siva Kumar et al., 2020). The over-representation of MDR in isolates of the Beijing lineage is consistent with many studies that associated this family with any resistance and MDR (Ding et al., 2017). Lineage 2 strains, which includes the Beijing lineage, are most often isolated in Southeast Asia, India and East Africa (Couvin, Reynaud & Rastogi, 2019; Panwalkar, Chauhan & Desikan, 2017). Therefore, the high prevalence of the Beijing lineage in Oman (15.1%), can probably be attributed to the large influx of imported TB cases from Southeast Asia, India and East Africa (Al Abri et al., 2020a; Al Abri et al., 2020b), in line with the high frequency of shared spoligotype-defined lineages between Omanis and expatriates (Table 3) (Al-Mahrouqi et al., 2022). Thus, the diversity of drug resistant M. tuberculosis strains in Oman can, in part, be attributed to regular influx of novel drug resistant lineages via expatriates. Therefore, control strategies that can limit transmission as well as drug pressure and thereby positive selection of drug resistant strains should be considered. Drug pressure may not only select resistant strains, but also may enhance transmission (Leung et al., 2013), as several studies have shown that drug resistant TB is dominated by a few highly transmissible closely related clades (Koch & Cox, 2020).
The present study reinforces the association of mutations rpsL K43R and ropB S450L with SMR and RIFR, respectively, as well as katG S315T and inhA promoter -15/-17 with INHR. Our findings confirm the role of these mutations in the phenotypic response of M. tuberculosis to these drugs, as reported in other geographical regions (Singh et al., 2020). The frequency of these mutations varies in different geographical regions. Consequently, their diagnostic value can differ in different countries. This necessitates analysis of local frequencies of these mutations to estimate the predictive diagnostic accuracy of drug resistance and their efficacy in epidemiological surveillance. These markers rpsL K43R (45.2% SMR), kat G S315T (47.1% INHR), inhA -15/-17 (30.3% INHR) and rpoB S450L (53.3% RIFR) detected a large proportion of drug resistant M. tuberculosis isolates in Oman. This accords with the worldwide reported figures observed for phenotypic resistance associated with the above mutations to streptomycin, isoniazid and rifampicin (Hazbo et al., 2006; Torres et al., 2015).
In addition, combinations of mutations implicated in resistance to one drug, can enhance the detectability of resistance. In the current study, inhA promoter mutations -15/-17 in the absence of any katG mutation detected 21.9% of INHR isolates, while katG 315T alone identified 46% of INHR isolates, which increased to 68% when both katG S315T and inhA -15/-17 were taken together. Thus, these mutations can provide valuable diagnostic tools to mitigate the risk of treatment failure and evolution of drug resistance. Nonetheless, we identified a number of rare mutations in the above genes (Table 5), as seen in other geographical regions (Hazbo et al., 2006; Torres et al., 2015). Regular monitoring of these mutations is important as is watching for the emergence of new mutations given drug pressure is expected to be a major determinant in the selection and spread of drug resistance genes. Some evidence suggests that acquired drug resistance results in stepwise acquisition and consistent increase in mutations can lead to a gradual increase in resistance (Prasad, Gupta & Banka, 2018).
Similar to the drug response profiles, the drug resistance-conferring mutations were spread in all M. tuberculosis lineages (Table 6), demonstrating the diversity and multiple origins of drug resistant strains in Oman. We found that MDR strains are more likely to harbour mutations rpsL K43 R, katG S315T and ropB S450L linked to SMR, INHR and RIFR, respectively, and that these mutations existed at a significantly higher prevalence among isolates of the Beijing and CAS genotypes (Table 6). Mutations katG S315T and ropB S450L are known to be low-cost mutations, associated with high-level RIFR and INHR (Ding et al., 2017). This association has been explained by possible positive epistasis between the Beijing genetic background and drug-resistance-conferring mutations (Borrell & Gagneux, 2009), making it favourable for drug selection and dissemination of MDR. Therefore, the high prevalence of CAS (25.4%) and Beijing (15.1%) lineages among drug resistant M. tuberculosis strains in Oman, emphasises the epidemiologically importance of these lineages, and the spread of drug resistance via imported TB cases form the Indian Sub-continent, East Africa and Southeast Asia, where these lineages predominate (Cain et al., 2015).
An important limitation of the present study was the absence of a more sensitive in vitro drug test for the M. tuberculosis isolates. The phenotypic drug response was based on DST and not MIC, and therefore, it was not possible to relate mutations to different levels of drug resistance, as it has been suggested that different combination of mutations in katG and inhA can result in different MIC for INH (Lempens et al., 2018). Accurate phenotypic data is critical for the identification of highly sensitive and specific drug resistance markers.
The absence of discriminatory genotypic data impeded proper interpretation of genetic relatedness of INH M. tuberculosis haplotypes shared between Omanis and expatriates. Many mutant haplotypes belong to M. tuberculosis strains shared between Omanis and expatriates. In addition, further study using a more discriminatory technique such as MIRU-VNTR or whole genome sequencing can identify transmission routes of the selective drug resistant strains with shared spoligotypes.
In summary, the spread of drug resistant M. tuberculosis in Oman is linked to known drug resistance conferring mutations, supporting the value of these mutations as diagnostic and surveillance tools to limit the spread of drug resistance. The occurrence of these mutations in different spoligotype-defined lineages, is an indicative of a large reservoir of resistant strains in Oman. The most critical drug resistance mutations are over-represented in isolates of the Beijing lineage, reinforcing their value to predict MDR. The similar frequencies of drug resistance mutations among M. tuberculosis obtained from Omanis and expatriates highlights the need to bolster molecular surveillance of TB infection.