
An investigation of the genus Mesacanthus (Chordata: Acanthodii) from the Orcadian Basin and Midland Valley areas of Northern and Central Scotland using traditional morphometrics
- Published
- Accepted
- Received
- Academic Editor
- Graciela Piñeiro
- Subject Areas
- Paleontology, Taxonomy
- Keywords
- Acanthodii, Morphometrics, Mesacanthus , Orcadian, Scotland
- Copyright
- © 2015 Baron
- Licence
- This is an open access article distributed under the terms of the Creative Commons Attribution License, which permits unrestricted use, distribution, reproduction and adaptation in any medium and for any purpose provided that it is properly attributed. For attribution, the original author(s), title, publication source (PeerJ) and either DOI or URL of the article must be cited.
- Cite this article
- 2015. An investigation of the genus Mesacanthus (Chordata: Acanthodii) from the Orcadian Basin and Midland Valley areas of Northern and Central Scotland using traditional morphometrics. PeerJ 3:e1331 https://doi.org/10.7717/peerj.1331
Abstract
Mesacanthus is a common and speciose genus of acanthodian fish from Lower Old Red Sandstone and Middle Old Red Sandstone assemblages (representing the Lower Devonian and Middle Devonian respectively) and is well represented in many palaeoichthyology collections in the UK. Based upon descriptions given during the 19th century, specimens of the genus Mesacanthus from the Orcadian Basin and Midland Valley areas of Northern and Central Scotland have historically been referred to a number of different species; of these, the most frequently discussed in the literature are M. mitchelli, M. peachi and M. pusillus. In order to test the validity of these three species, traditional morphometric analyses were carried out on over 100 specimens of Mesacanthus, from both the Lower Devonian and the Middle Devonian, that cover the full range of known localities for these taxa in Northern and Central Scotland. Based upon morphological and morphometric comparisons, this investigation has found that at least two species of Mesacanthus are valid (M. mitchelli and M. pusillus) as specimens from the Lower Devonian and Middle Devonian have been shown to differ significantly in a number of important ways. However, no evidence has been found for the validity of the second and distinct Middle Devonian species, M. peachi.
Introduction
Acanthodians (‘spiny sharks’) are important early representatives of Gnathostomata (Gegenbaur, 1874) and have been central in the debate on the origin of modern gnathostomes (Davis, Finarelli & Coates, 2012; Zhu et al., 2013). The most recent analyses have recovered acanthodians as a paraphyletic assemblage within the chondrichthyan total group (Dupret et al., 2014; Brazeau & Friedman, 2015; Giles, Friedman & Brazeau, 2015). Acanthodians have a global distribution and are generally characterised by the presence of long fin spines along the length of their body (Agassiz, 1833–1843; Agassiz, 1844–1845; Traquair, 1898; Miles, 1966; Denison, 1979). The genus Mesacanthus (Traquair, 1888) is found in the sedimentary rocks of the Orcadian Basin and Midland Valley areas of Northern and Central Scotland, in both the Lower Old Red Sandstone and the Middle Old Red Sandstone, which correspond to the Lower Devonian and Middle Devonian respectively. The sedimentary systems that they are found in are interpreted as being the remnants of extensive lake environments, which, despite fluctuations in their size and shape through time, remained a relatively permanent feature of the landscape of this region for millions of years (Trewin & Davidson, 1995; Trewin & Davidson, 1999; Newman & Trewin, 2008). The faunal composition markedly changed between the Lower and Middle Devonian, but the genus Mesacanthus is present in both of these stages and is quite common, representing up to 48 percent of the total number of specimens found in early Devonian formations (Trewin & Davidson, 1995).
Traquair (1888) erected the genus Mesacanthus having recognised that some of the species of Acanthodes (Agassiz, 1833–1843) that had been previously described by Agassiz (1844–1845) and Egerton (1861) were distinct enough from other species of Acanthodes to warrant their placement in a separate genus. He went on to state that Mesacanthus could be diagnosed and differentiated from other genera of acanthodians by the presence of a pair of prepelvics (intermediate spines between the pectoral and pelvic spines). These spines are small and delicate structures and are not always well preserved, making this particular character a difficult one to use on its own in diagnosing specimens. Prior to this work, Agassiz (1844–1845) had given a more detailed description of Mesacanthus pusillus (Agassiz, 1844–1845: Acanthodes pusillus) in which he stated that the species is extremely small, has short anal spines, triangular scales with raised keels on their top edge and a distinct tail in which the upper lobe extends to a sharp point and the lower lobe forms a small triangle. Using this description for comparison, other authors erected new species of Mesacanthus, but often without providing any new information on the overall anatomy of the genus (Egerton, 1861; Gagnier & Goujet, 1997). Miles (1966) gave M. pusillus as the type species for the genus and this was followed by Denison (1979), who also gave a more complete description of the genus overall.
Despite existing for a relatively long amount of time, the genus Mesacanthus seems to have changed very little in terms of its overall morphology. Figure 1 shows the general body plan for the genus Mesacanthus, which is consistent with the descriptions given by Agassiz (1844–1845), Egerton (1861) and Denison (1979) and can be observed in specimens from both the Lower Old Red Sandstone and the Middle Old Red Sandstone. There have been a number of species proposed for Mesacanthus and the most common of these, in both palaeoicthyology collections and in the literature, are Mesacanthus mitchelli (Egerton, 1861), Mesacanthus pusillus and Mesacanthus peachi (Egerton, 1861). These three species were also the only species of Mesacanthus recognised by Woodward (1891) after he had formally synonymised M. peachi and M. coriaceus (Egerton, 1861). In terms of provenance, M. mitchelli is found exclusively in the Lower Old Red Sandstone whereas M. pusillus and M. peachi are found exclusively in the Middle Old Red Sandstone. The oldest of these species stratigraphically, M. mitchelli, was described by Egerton (1861) who stated that it was less robust than the Middle Devonian species, M. peachi; less robust is interpreted as meaning having a longer, thinner body. A second Middle Devonian species, M. pusillus, is also described as being less robust than M. peachi, making this species more akin to the Lower Devonian species M. mitchelli in this regard. Other than the supposed difference in ‘robustness’ there is little other information in the original descriptions of these species, nor in any of the subsequent literature, that allows for easy differentiation between them in terms of their anatomy. Based upon general morphology alone, it is not possible to easily distinguish between the different species of Mesacanthus, especially between those species that are found in the Middle Old Red Sandstone. Whether or not there exist enough anatomical differences between the many known specimens of Mesacanthus to justify the assignment of those specimens to three different species is unclear and is the subject of this investigation.
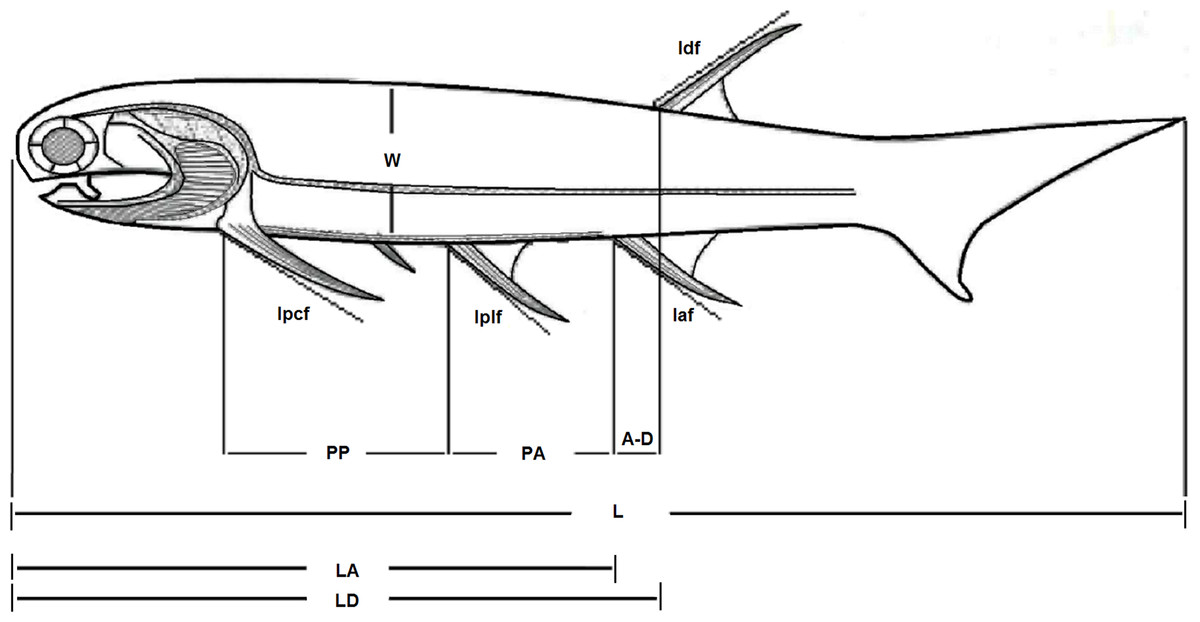
Figure 1: Body plan of the genus Mesacanthus.
The figure shows the general body plan for all species of the genus Mesacanthus and the measurements that were taken and used during this study. Key: L, length; W, width; PP, distance between pectoral to pelvic fin spines; PA, distance between pelvic to anal fin spines; LD, length from front to dorsal fin spine; LA, length from front to anal fin spine; A–D, distance between anal and dorsal fin spines; lPCF, length of the pectoral fin spine; lPLF, length of the pelvic fin spine; lDF, length of the dorsal fin spine; lAF, length of anal fin spine. Adapted from Watson (1937), Fig. 8.
This is the first time that multivariate morphometric analysis has been used to investigate species and genus level taxonomy of acanthodians.
Material & Methods
The specimens used in this study were taken from a number of collections in the UK including the collections of the University of Aberdeen (ABDUG), the National Museum of Scotland (NMS), the Natural History Museum, London (NHMUK) and the Hunterian Museum (GLAHM). Images of specimens housed in the Elgin Museum (ELGNM), the collections of the British Geological Survey (GMS) and the Royal Ontario Museum, Canada (ROM) were also looked at during the course of this investigation. The specimens include representatives from all three of those species that are most commonly discussed in the literature and cover all of the known localities for Mesacanthus. Table 1 shows the number of specimens from each locality, the current specific assignments of those specimens (where specific assignment has been given) and the age (Lower Old Red Sandstone or Middle Old Red Sandstone) of those localities.
| Locality | Group | Species | Number of specimens |
|---|---|---|---|
| Achanarras | Middle Old Red Sandstone | M. peachi | 34 |
| M. pusillus | 6 | ||
| Cheiracanthus sp. | 1 | ||
| Tynet Burn | Middle Old Red Sandstone | M. peachi | 1 |
| M. pusillus | 9 | ||
| Cheiracanthus sp. | 5 | ||
| Orkney | Middle Old Red Sandstone | M. pusillus | 1 |
| Holburn Head | Middle Old Red Sandstone | M. peachi | 2 |
| Caithness | Middle Old Red Sandstone | M. peachi | 1 |
| Thurso | Middle Old Red Sandstone | M. peachi | 2 |
| Cairnfield | Middle Old Red Sandstone | M. peachi | 1 |
| Tillywhandland | Lower Old Red Sandstone | M. mitchelli | 21 |
| Duntrune | Lower Old Red Sandstone | M. mitchelli | 5 |
| Farnell | Lower Old Red Sandstone | M. mitchelli | 8 |
| Turin hill | Lower Old Red Sandstone | M. mitchelli | 14 |
| Total M. peachi | 41 | ||
| Total M. pusillus | 16 | ||
| Total M. mitchelli | 48 | ||
| Total Cheircanthus sp. | 6 | ||
| Total Mesacanthus | Middle Old Red Sandstone | 57 | |
| Lower Old Red Sandstone | 48 | ||
| Total Cheiracanthus | Middle Old Red Sandstone | 6 |
All of the specimens used in the analyses were studied first hand by the author. A number of key measurements were taken from each of the specimens and these measurements are laid out in Fig. 1, which has been adapted from Watson (1937). Every specimen was also photographed alongside an appropriate scale bar for future reference and comparison. Specimens that were incomplete or showed a large degree of post-mortem deformation, in particular those which had been folded and twisted, but also those in which the borders of the main body were obscured, were discounted from this study on the grounds that the measurements of such things as length and width would not be reliable. In specimens that showed a smaller degree of post-mortem bending, measurements of length and inter-spinal distance were taken along a curved line that was superimposed over the specimen, marked at key points and then straightened. To try and ensure consistency, this curved line was always placed at a distance from the dorsal margin of the body that was equivalent to one third of the width of the specimen at the respective sections along the body (the width of each section was calculated from an average of 3 measurements). This line was placed onto the specimens using a fine thread and the relevant distances were marked on to it at the points of intercept between the thread and lines that ran perpendicular to the dorsal/ventral margins from the locations of the relevant features (e.g. the point of articulation between the pectoral spine and the body). The widths of the specimens (W) that were used in the multivariate analysis and XY scatters were calculated by taking the average of 3 measurements from the middle third of the body. All of the measurements were recorded in a table, along with information on current taxonomic status, locality, preservational status and any other relevant information that could be taken from the specimens and from relevant literature.
The data set was subjected to a series of statistical analyses that included multivariate analysis of variance (MANOVA) canonical variate analysis (CVA) and principle component analysis (PCA), as well as a number of other simple comparisons (Darlington, Weinberg & Walberg, 1973; Jolliffe, 2002). These analyses were carried out using the software PAST (Hammer, Harper & Ryan, 2001) in order to determine whether or not it is possible to separate out the specimens into multiple species using the measurements that were taken.
A simple comparison of the relative lengths and widths of the specimens of each species of Mesacanthus was carried out as part of this investigation. This was done because one of the few distinctions between M. mitchelli, M. pusillus and M. peachi that can be found in the current literature is a supposed difference in ‘robustness,’ with M. peachi purportedly being ‘more robust’ i.e., having a smaller length to width ratio than M. pusillus and M. mitchelli (Egerton, 1861). Comparisons between the separation of pectoral, pelvic, anal and dorsal fin spines, as well as the overall shape and absolute lengths of the spines were also carried out to see if any significant differences could be found between the species in terms of those individual measurements as well.
All specimens were considered in this study to belong to the species to which they had been previously assigned. However, a set of tests were also carried out in which previous identifications were disregarded and, following Egerton (1861) and his proposed character of robustness, all specimens were grouped based upon age and length to width (L/W) ratio. This produced three groups: Lower Old Red Sandstone specimens, ‘more robust’ Middle Old Red Sandstone specimens and ‘less robust’ Middle Old Red Sandstone specimens. The Middle Old Red Sandstone specimens of Mesacanthus were ordered by length to width ratio and exactly one half were placed into the less robust group and the other half into the ‘more robust’ group. These groups were then subjected to the same MANOVA/CVA and PCA analyses as the rest of the data.
As well as the various analyses in PAST, physical comparisons of the shape and sizes of the pectoral, pelvic, anal and dorsal fin spines of the specimens of Mesacanthus were made, as were comparisons of the shape and structure of their scales. Close inspection of these features were carried out using a light microscope and with high resolution photographs to determine if any specific differences could be observed among the specimens in terms of the morphology of these important features.
Data from another acanthodian genus from Scotland, Cheiracanthus, was also collected and incorporated into additional analyses in order to test the strength of this method and to test to what degree different groups can be separated using these particular measurements.
Results
The bivariate plots produced for length and width (Fig. 2) show that these measurements have a simple linear relationship for all species of Mesacanthus (R2 = 0.7862, 0.7831 and 0.8196 for M peachi, M. pusillus and M. mitchelli respectively). Specimens of M. mitchelli, M. peachi and M. pusillus do not appear to differ to drastically in these plots, although the 95% confidence ellipses for specimens from the Lower Old Red Sandstone plot marginally higher, meaning that these specimens have on average slightly greater length to width ratios. This difference was investigated further through the application of a t-test (Two Sample Assuming Unequal Variance). Table 2 shows the results of t-tests that were carried out on the length to width ratios of the three species, as well as on a number of other anatomical ratios that were calculated from the raw measurements (L/LA, L/LD, (PP + PA)/L—see Fig. 1 for abbreviations). The difference in length to width ratios (L/W) of the specimens of M. peachi and M. pusillus were found not to be significant (p-value = 0.08230). On the other hand, the length to width ratios of the specimens of M. mitchelli did show a significant difference to the length to width ratios of the specimens of M. peachi, and also of the specimens of M. pusillus (p-values = 5.55E−08 and 0.000528 respectively: see Table 2). Combining all of the Middle Old Red Sandstone specimens into one category (i.e., treating M. peachi and M pusillus as synonymous) and comparing their length to width ratios with those of M. mitchelli also recovered a significant difference between these two groups (p-value = 8.07E−09). It is also worth noting that, of the other combinations of measurements that were subjected to t-tests, the sum of the distance between the pectoral and pelvic fin spines divided by the overall length of the specimen ((PP + PA)/L) was found to be significantly different between M. mitchelli and M peachi (p-value = 0.0204) and M. mitchelli and M. pusillus (p-value = 0.0436), but, importantly, not significant between M. peachi and M. pusillus (p-value = 0.755). Again, a significant difference was found between groups of Middle Devonian and Lower Devonian specimens (p-value = 8.07E−09). A significant difference was also recovered between the length to anal fin spine and overall length ratio between specimens from the Lower Old Red Sandstone and Middle Old Red Sandstone (p-value = 0.0286).
| Group 1 | Group 2 | |t Stat| | |t Critical two-tail| | Significant difference | |
|---|---|---|---|---|---|
| L/W | M. peachi | M. pusillus | 1.774141 | 2.015367574 | no |
| M. mitchelli | M. peachi | 6.028662 | 1.99167261 | yes | |
| M. mitchelli | M. pusillus | 3.840591 | 2.034515297 | yes | |
| Lower Devonian | Middle Devonian | 6.277312 | 1.983037526 | yes | |
| (PP + PA)/L | M. peachi | M. pusillus | 0.316376 | 2.06865761 | no |
| M. mitchelli | M. peachi | 2.437029 | 2.034515297 | yes | |
| M. mitchelli | M. pusillus | 2.179869 | 2.109815578 | yes | |
| Lower Devonian | Middle Devonian | 2.821561 | 2.001717484 | yes | |
| L/LA | M. peachi | M. pusillus | 0.943376 | 2.063898562 | no |
| M. mitchelli | M. peachi | 1.584967 | 2.008559112 | no | |
| M. mitchelli | M. pusillus | 2.425574 | 2.109815578 | yes | |
| Lower Devonian | Middle Devonian | 2.233208 | 1.992997126 | yes | |
| L/LD | M. peachi | M. pusillus | 0.709707 | 2.051830516 | no |
| M. mitchelli | M. peachi | 1.83961 | 2.004879288 | no | |
| M. mitchelli | M. pusillus | 0.920984 | 2.093024054 | no | |
| Lower Devonian | Middle Devonian | 1.867433 | 1.99167261 | no |
Results of the MANOVA/CVA, in which M. mitchelli, M. pusillus and M. peachi were treated as separate groups, a priori, show that M. peachi and M. pusillus cannot be distinguished from one another based upon the measurements taken, but specimens of M. mitchelli can be distinguished from both M. peachi and M. pusillus. Figures 3A and 3B shows the CVA scatter plot produced and, although there is some overlap between the morphometric profiles of all 3 species, the Lower Devonian species (M. mitchelli) does appear to be more separated from the two Middle Devonian species, which overlap with one another to a greater degree; the Middle Devonian specimens plot more along the negative half of Axis 2 whereas the Lower Devonian specimens plot predominantly in the positive half. While this plot may not be completely clear in showing how these groups separate, the numerical results obtained in these analyses show to a much greater degree the amount of overlap and separation between the groups and, crucially, whether or not this type of multivariate analysis recovered any significant differences between the groups based upon the measurements taken. The confusion matrix from this MANOVA test demonstrates the high level of overlap between specimens of M. peachi and M. pusillus and the relatively low levels of overlap between specimens of these taxa and specimens of M. mitchelli (see Table 3). The analyses predicted that 14 of those specimens that are currently identified as M. peachi were actually M. pusillus and that 7 of those specimens currently identified as M. pusillus were M. peachi (50% of those analysed in total). This shows a high degree of similarity between specimens of M. peachi and M. pusillus. Conversely 37 out of 48 of those specimens currently identified as M. mitchelli were recovered as such by this analysis (77%). The results of uncorrected and Bonferonni corrected pairwise comparisons between these specimens show that a significant difference exists between specimens of M. mitchelli and specimens of both M. peachi and M. pusillus (Uncorrected p-values = 1.03E−12 and 2.24E−05 respectively; Bonferonni corrected p-values = 3.10E−12 and 6.73E−05 respectively), but show no that significant difference exists between specimens of M. peachi and M. pusillus (Uncorrected p-values = 0.367; Bonferonni corrected p-values = 1: see Table 3).
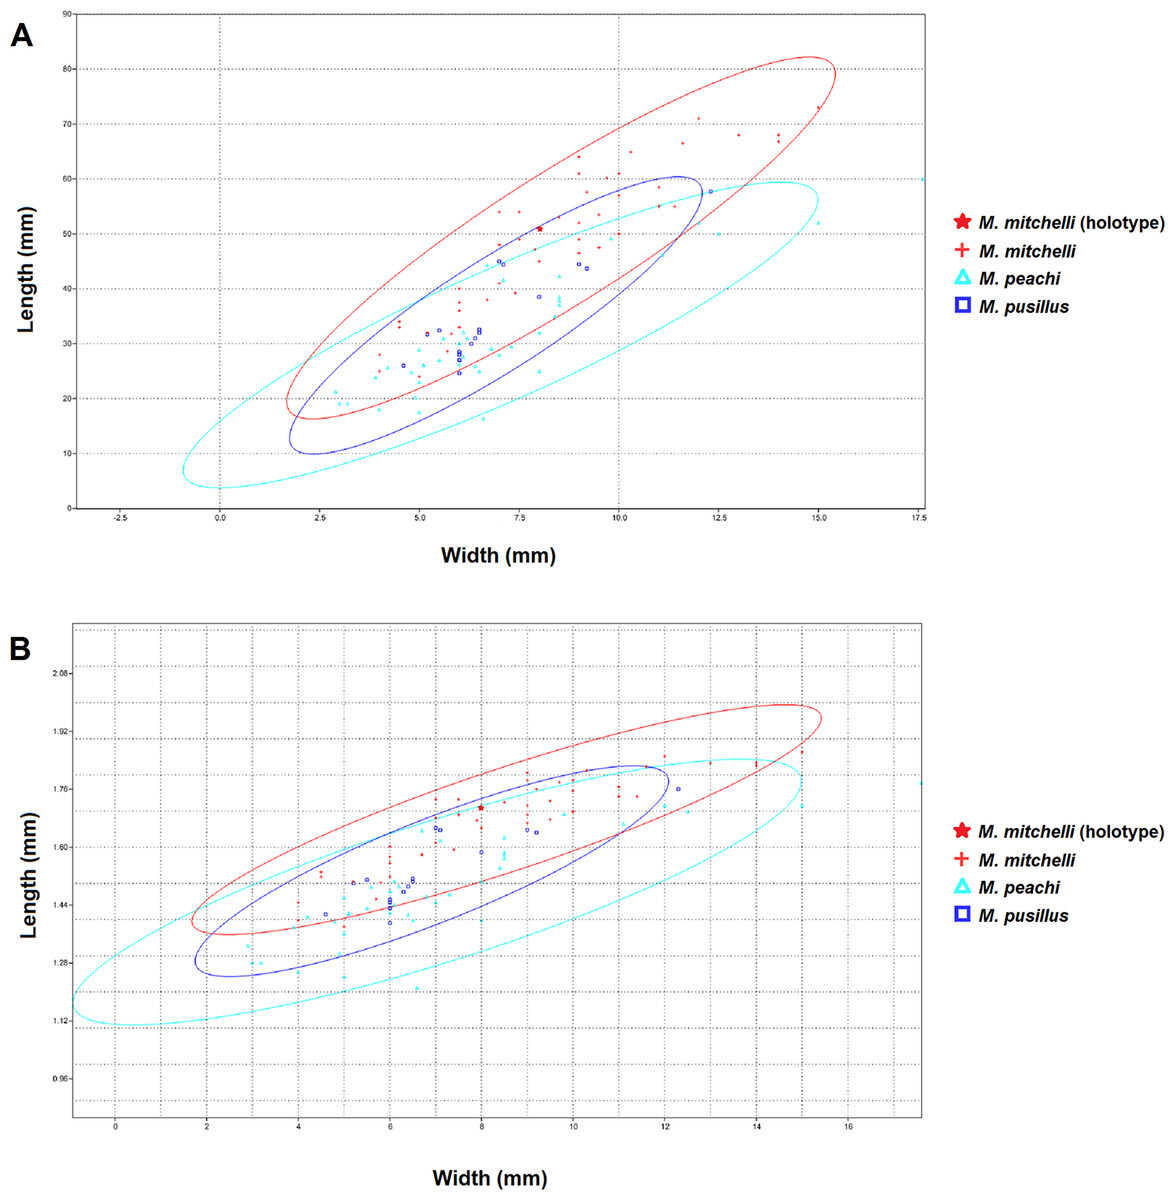
Figure 2: XY scatters of width and length and logtransformed width and length for all 3 species of Mesacanthus.
The XY scatters for width and length (A) and for log transformed width and length (B) for the three species of Mesacanthus show how the specimens from the Lower Devonian (M. mitchelli—red crosses) have a slightly higher length to width ratio than the two species from the Middle Devonian (M. peachi and M. pusillus—light blue triangles and dark blue squares respectively). This demonstrates how the proposed difference in ‘robustness’ between species, as first proposed by Egerton (1861) is at least recovered between specimens from the Lower and Middle Devonian. No difference in robustness is observed between the species from the Middle Devonian.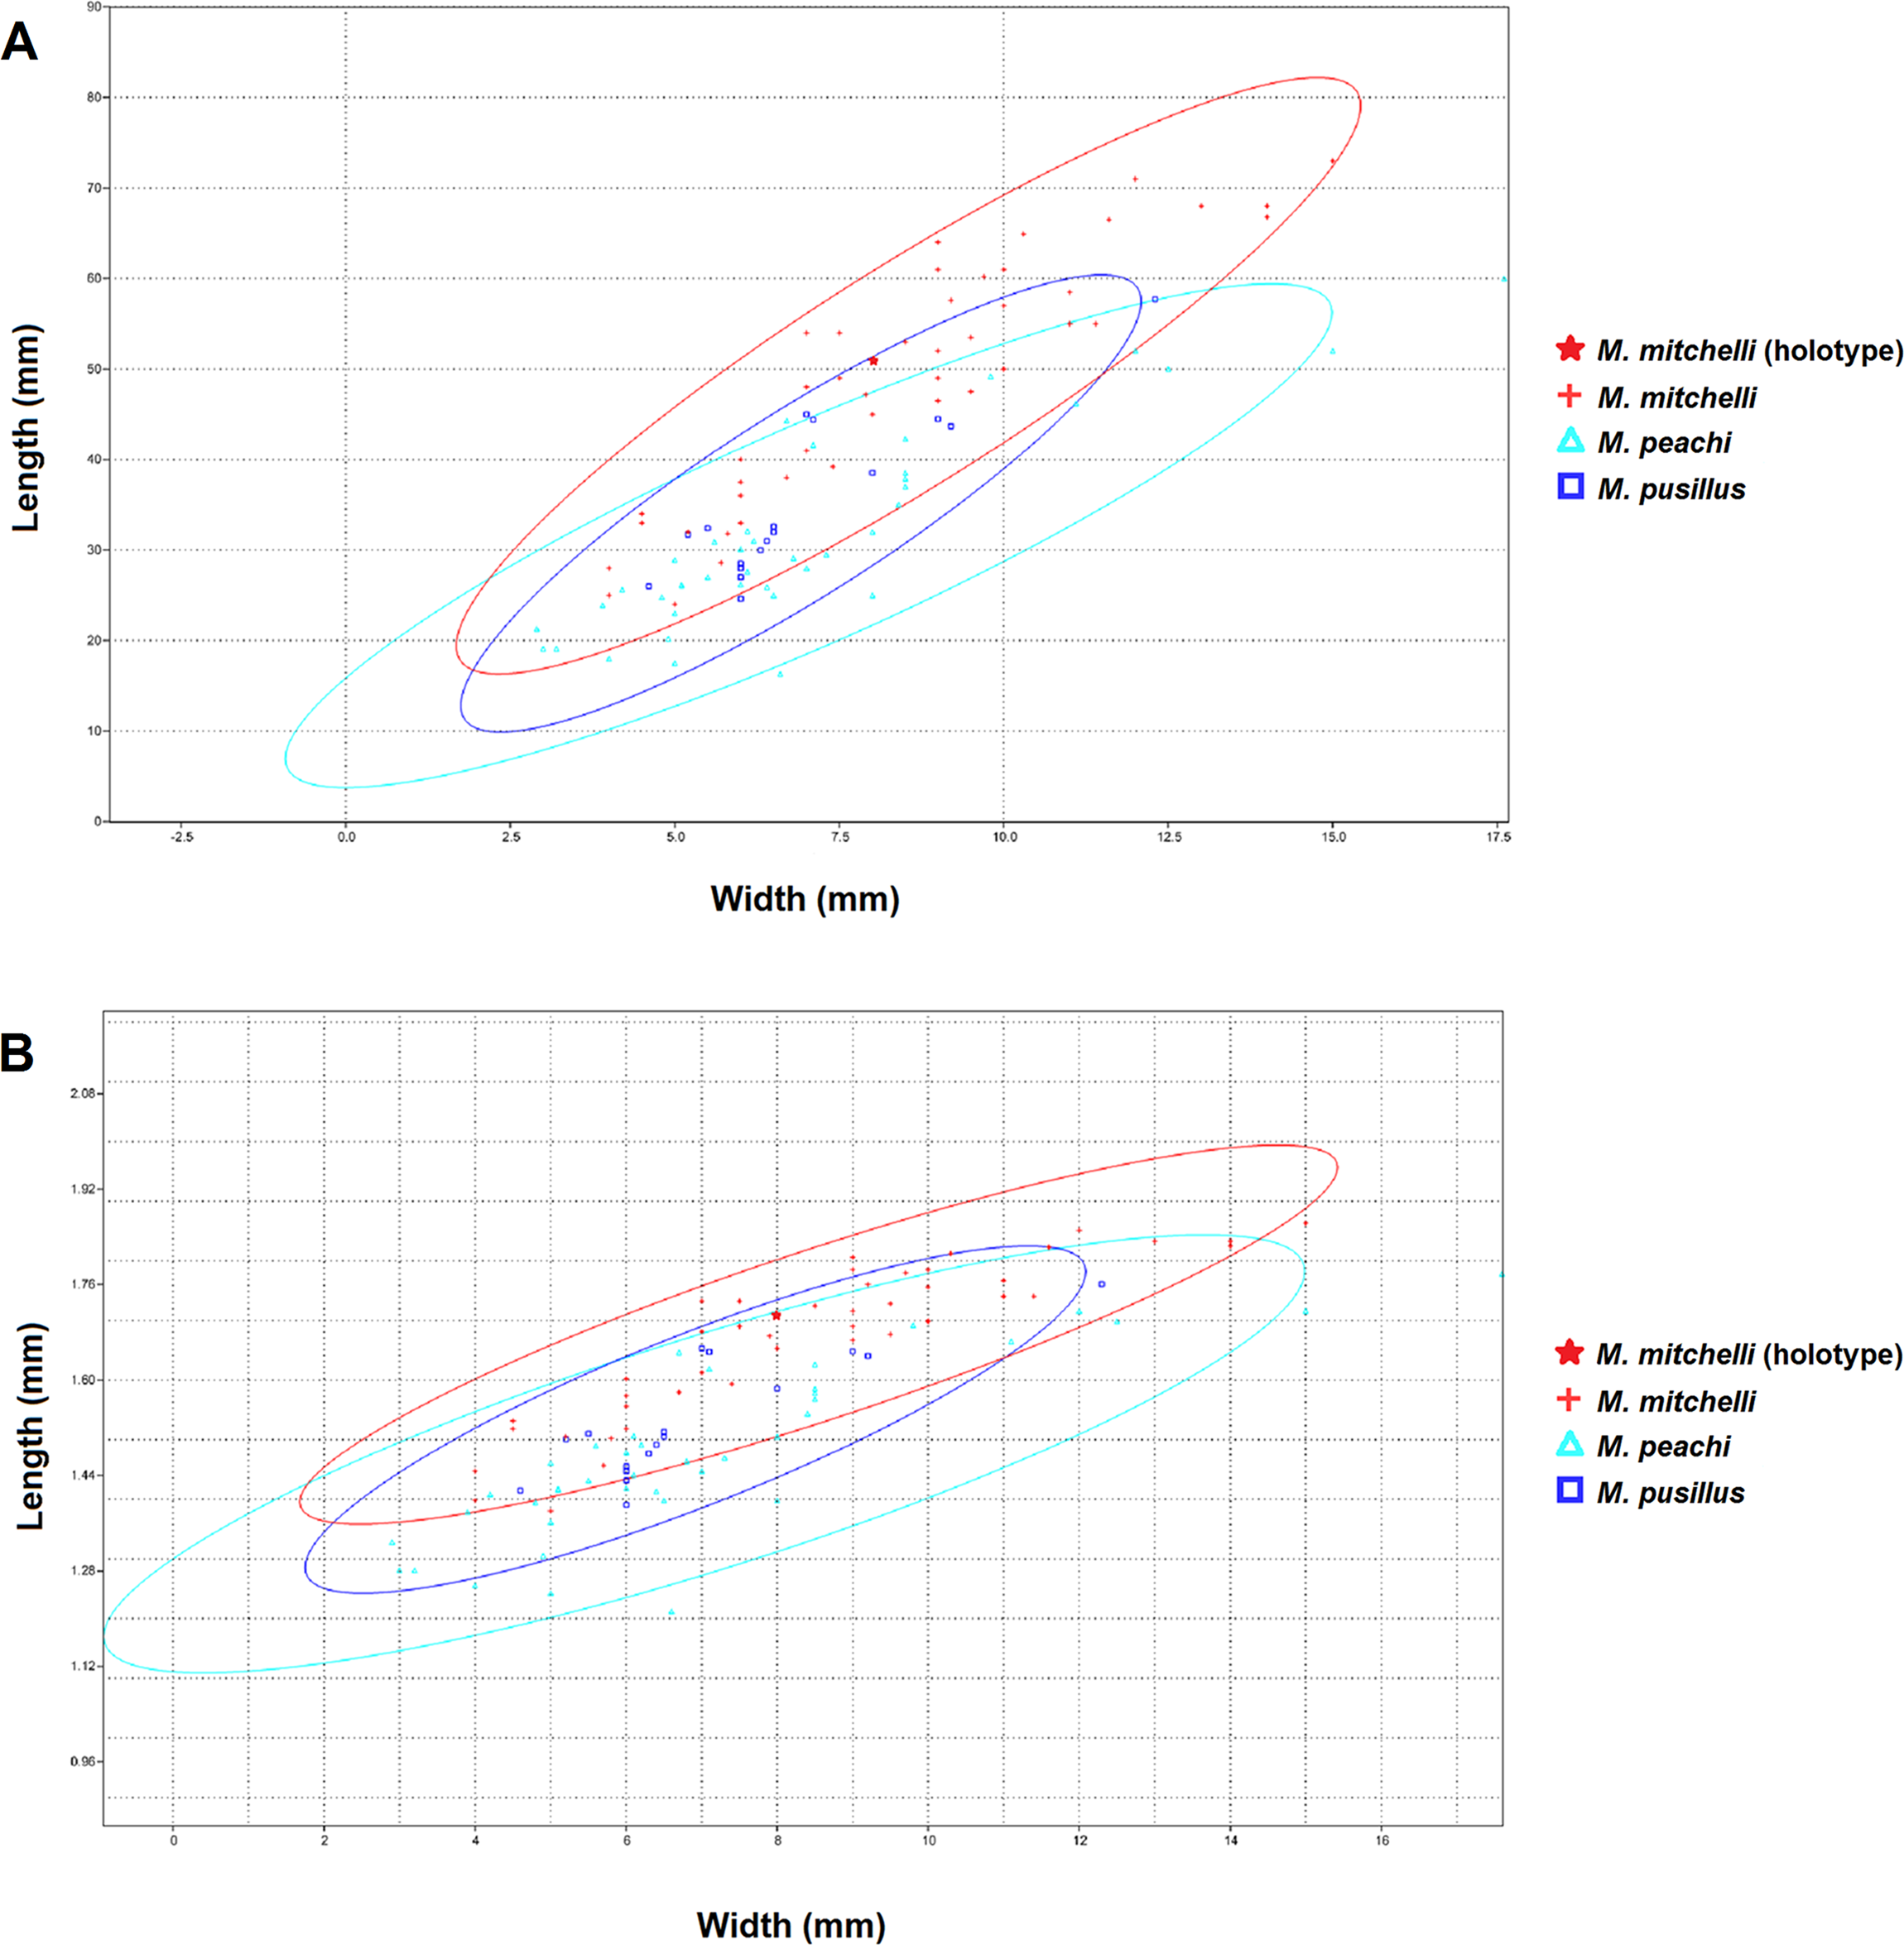
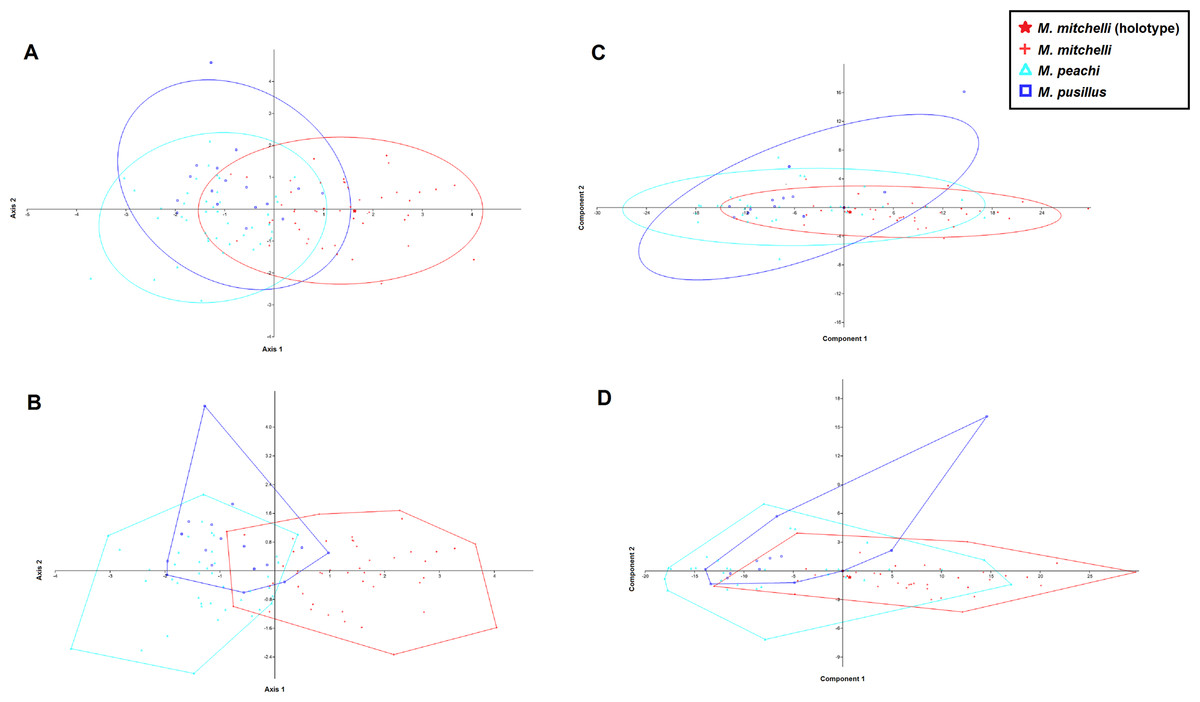
Figure 3: CVA and PCA scatters for all 3 species of Mesacanthus with 95% confidence ellipses (A and C) and convex hulls (B and D).
CVA scatters (A and B) were produced from the data and show the relative ammounts of overlap between the species of Mesacanthus. The Lower Devonian specimens (red crosses) plot predominantly on the positive portion of Axis 2 whereas the the Middle Devonian specimens plot predominantly on the negative postion of Axis 2. The two species from the Middle Devonian (M. peachi and M. pusillus) show a greater degree of overlap with one another than they do with the Lower Devonian species (M. mitchelli). The confusion matrix produced in this analysis is shown in Table 3 along with uncorrected and Bonferonni corrected Hotelling’s p-values from pairwise comparions between the groups.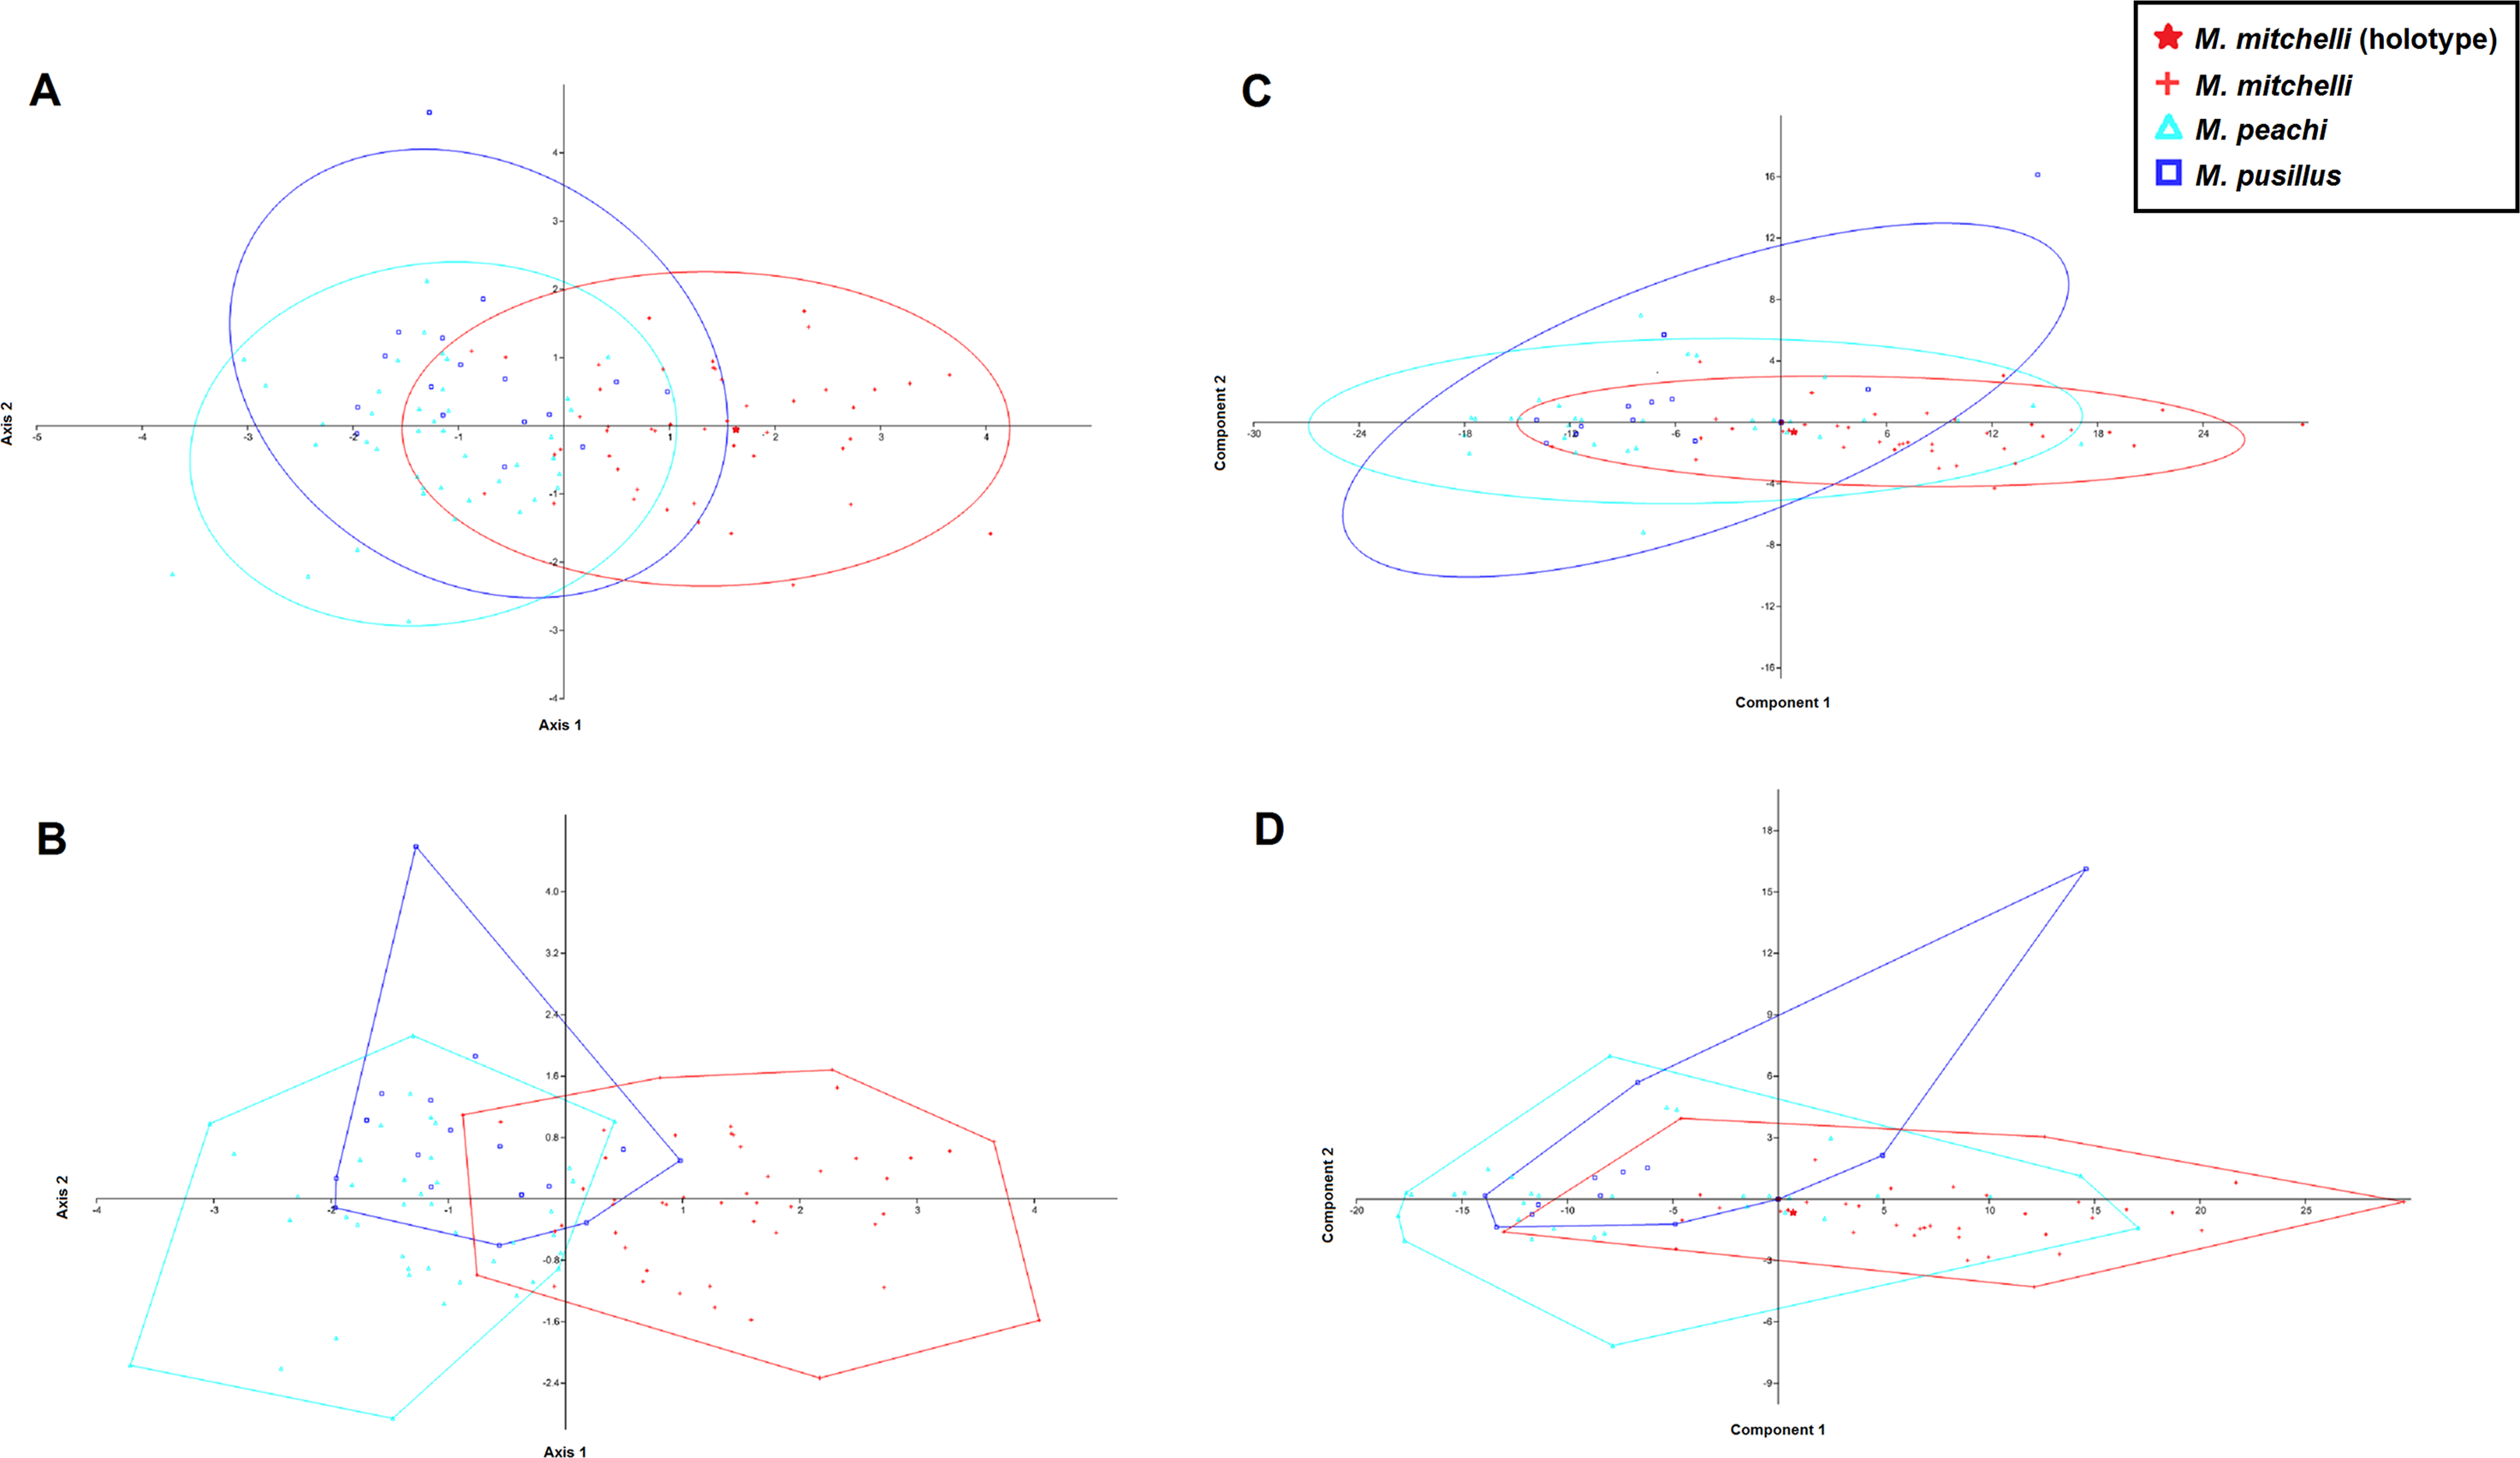
| M. peachi | M. pusillus | M. mitchelli | Total | ||
|---|---|---|---|---|---|
| Confusion matrix | M. peachi | 25 | 14 | 2 | 41 |
| M. pusillus | 7 | 7 | 3 | 17 | |
| M. mitchelli | 4 | 7 | 37 | 48 | |
| Total | 36 | 28 | 42 | 106 | |
| Uncorrected | M. peachi | – | |||
| M. pusillus | 0.367081b | – | |||
| M. mitchelli | 1.03E−12a | 2.24E−05a | – | ||
| Bonferonni corrected | M. peachi | – | |||
| M. pusillus | 1b | – | |||
| M. mitchelli | 3.10E−12a | 6.73E−05a | – |
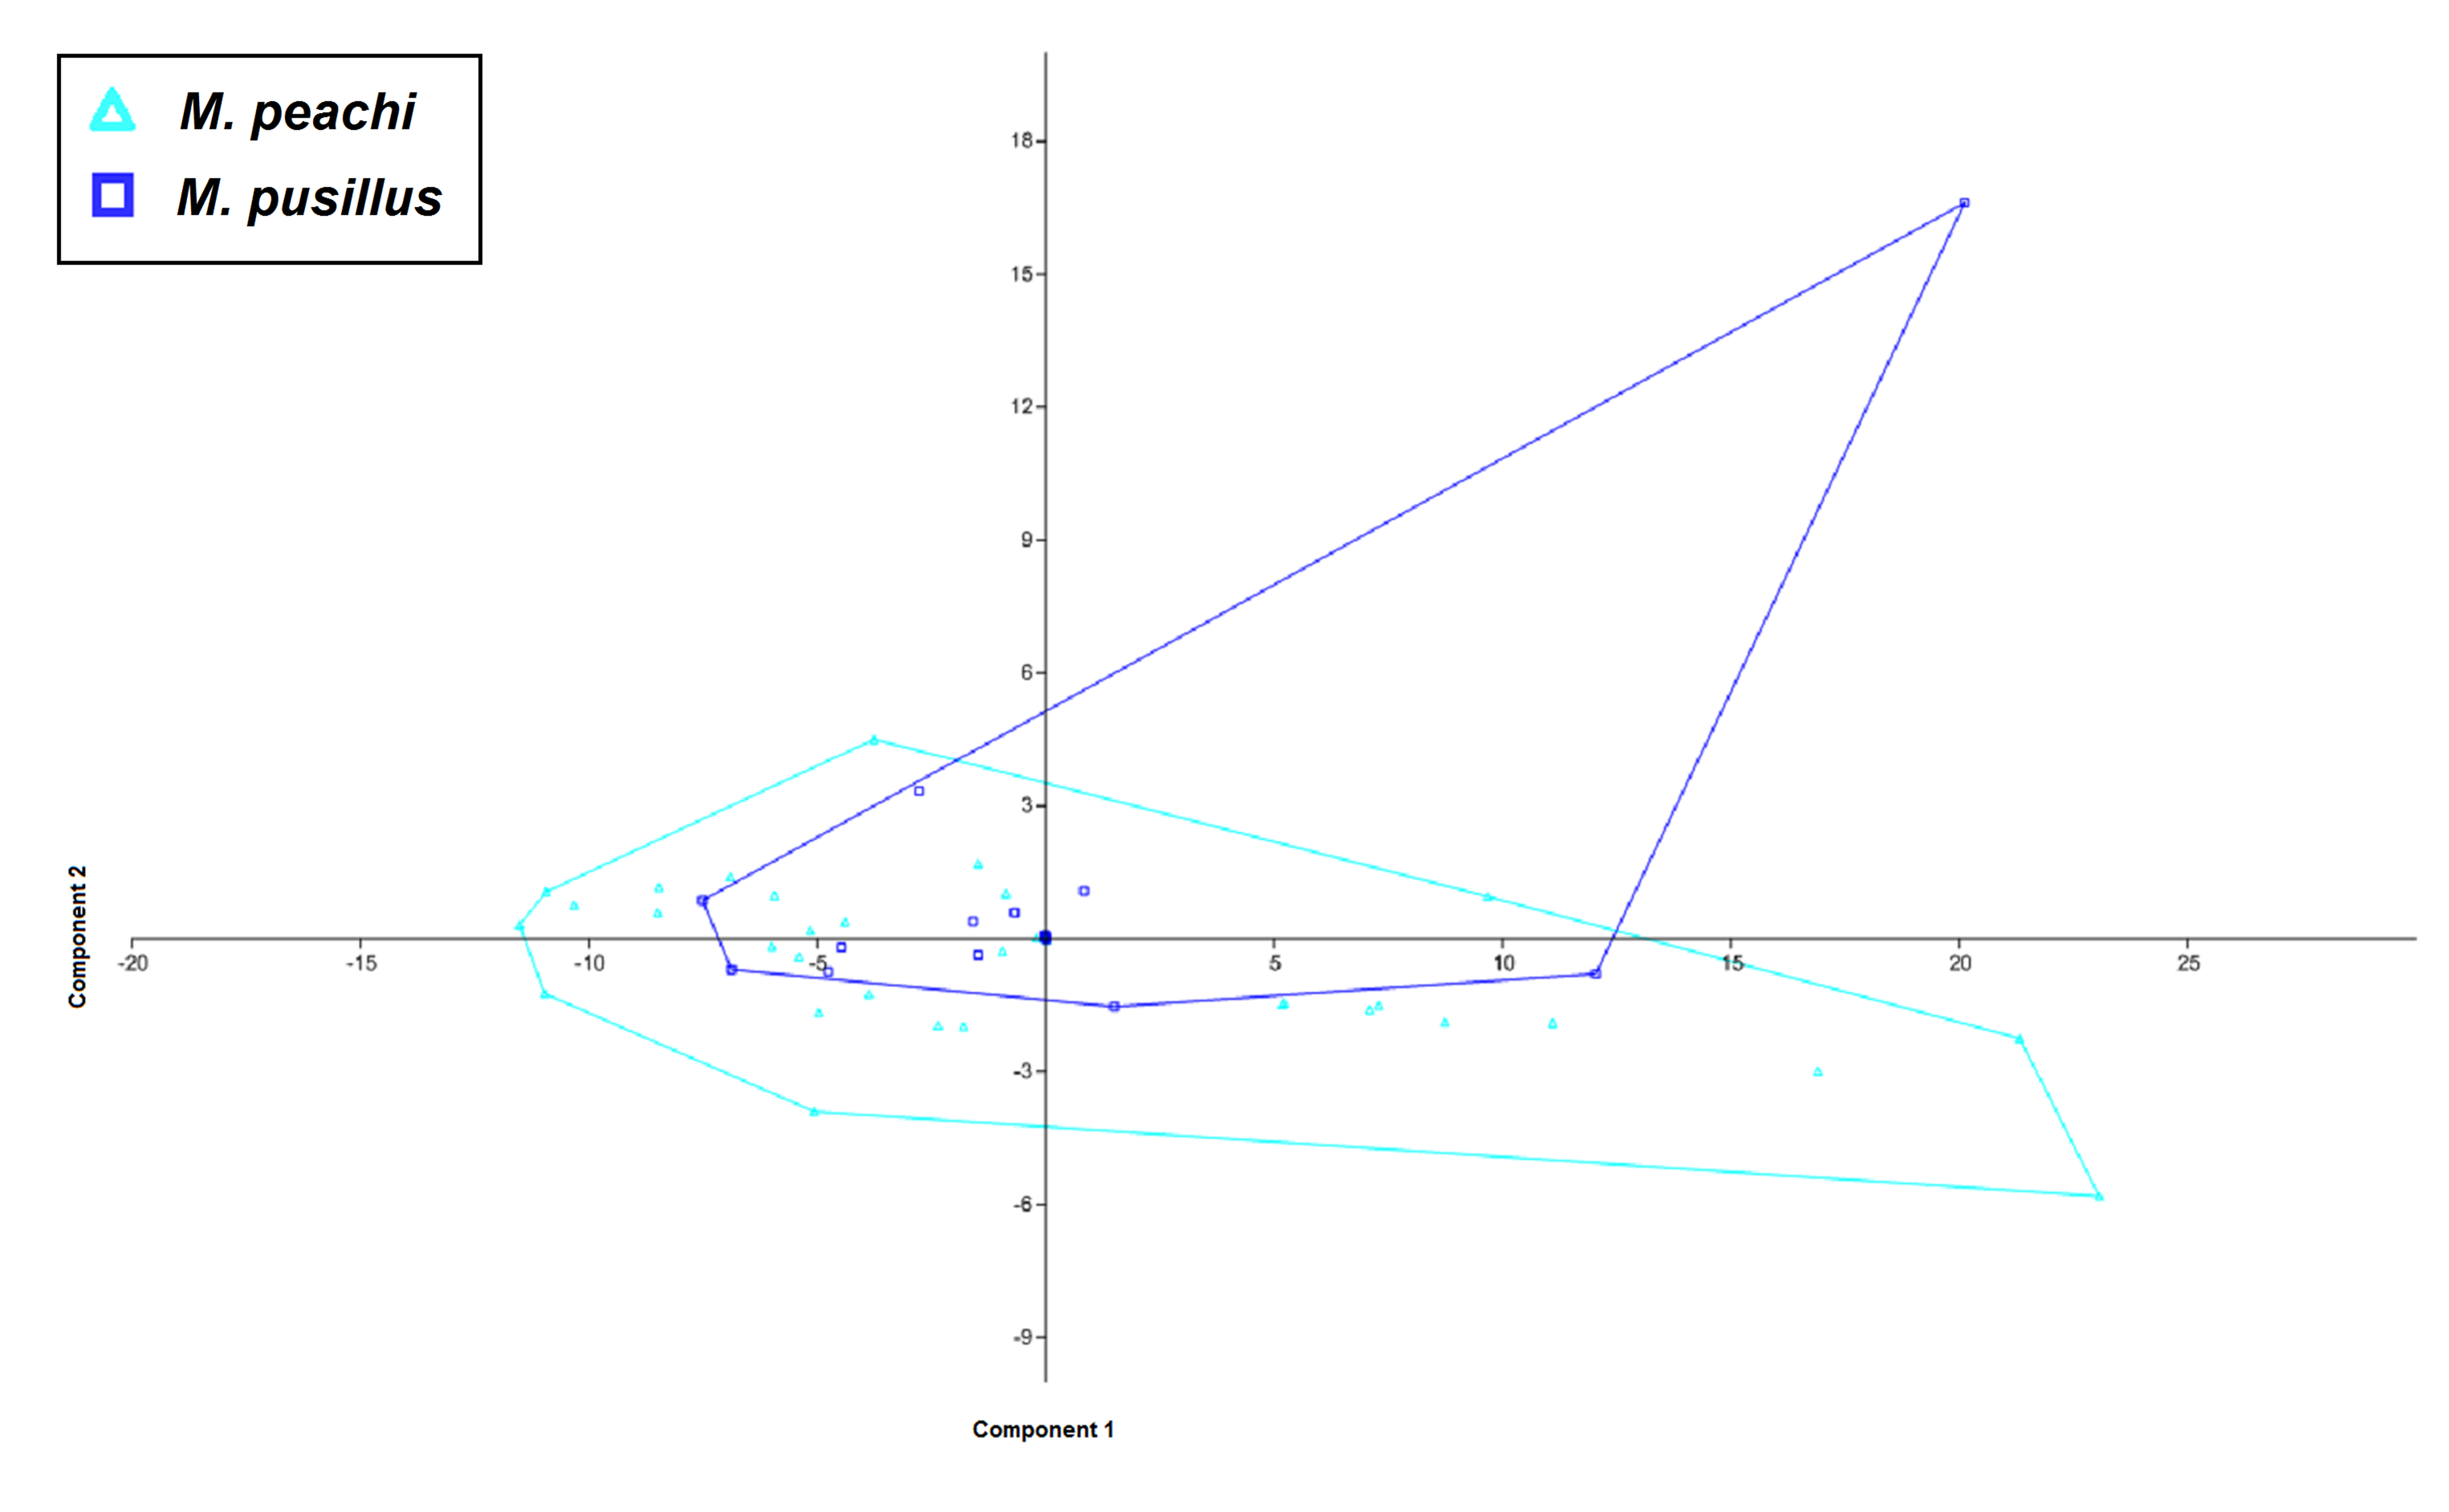
The results of the PCA show less of a distinction between the specimens of Mesacanthus. Figures 3C and 3D shows PCA plots from analyses that were carried out with M. mitchelli, M. pusillus and M. peachi grouped separately, a priori. In this analysis all three species show a great deal of overlap with the other two. Treating Middle Old Red Sandstone and Lower Old Red Sandstone specimens as the only two groups, the PCA again provided only a small amount evidence for a distinction based upon the measurements (see SOM S1). A PCA of just the specimens from the Middle Old Red Sandstone, where M. peachi and M. pusillus were again grouped separately, also showed a large amount of overlap between the specimens (see SOM S2).
The results of the analyses on the artificially created groups (where Middle Devonian specimens were regrouped based upon ‘robustness’) also showed that, based upon the measurements in this study other than length and width, no significant difference exists between the two groups from the Middle Old Red Sandstone i.e., those that appear ‘more robust’ and ‘less robust’ (Uncorrected p-value = 0.994; Bonferonni corrected p-value = 1). Importantly, the difference between each of these groups (‘more robust’ and ‘less robust’) and the Lower Old Red Sandstone specimens was found to be significant (Uncorrected p-values = 0.000241 and 1.14E−05; Bonferonni corrected p-value = 0.000722 and 3.42E−05: see Table 5). This result shows that, regardless of how Middle Old Red Sandstone specimens are grouped, the measurements used in this study do not produce significant differences and therefor do not allow for differentiation between them. In addition to this it shows how Middle and Lower Old Red Sandstone specimens can be differentiated even if current taxonomic identifications are discarded (see Table 5 and Fig. 9).
| M. peachi | M. pusillus | M. mitchelli | Cheiracanthus sp. | Total | ||
|---|---|---|---|---|---|---|
| Confusion matrix | M. peachi | 19 | 15 | 7 | 0 | 41 |
| M. pusillus | 9 | 5 | 3 | 0 | 17 | |
| M. mitchelli | 7 | 4 | 37 | 0 | 48 | |
| Cheiracanthus sp. | 0 | 2 | 0 | 4 | 6 | |
| Total | 35 | 26 | 47 | 4 | 112 | |
| Uncorrected | M. peachi | – | ||||
| M. pusillus | 0.657332b | – | ||||
| M. mitchelli | 1.83E−07a | 0.00462002a | – | |||
| Cheiracanthus sp. | 6.93E−15a | 1.79E−05a | 1.01E−17a | – | ||
| Bonferonni corrected | M. peachi | – | ||||
| M. pusillus | 1b | – | ||||
| M. mitchelli | 1.10E−06a | 0.0277201a | – | |||
| Cheiracanthus sp. | 4.16E−14a | 0.000107343a | 6.05E−17a | – |
Comparison of the morphologies of the various fin spines of Mesacanthus showed that some difference did exist between certain specimens in terms of the curvature of these features; some specimens had curved fin spines while other had very straight fin spines. However, further investigation of this potential character found that fin spine curvature was actually randomly distributed throughout the various species and no pattern could be seen between fin spine curvature and specific identification. Further to this, investigation of the closely related acanthodian genus Cheircanthus also revealed how fin spine curvature was something that did not directly correlate with any of the data gathered as part of this study (size, specific identity, locality etc.). This suggests that these differences in fin spine curvature are not specific differences, but are more likely to be a result of intraspecific variation or even preservation.
Close examination of the scales of Mesacanthus under a light microscope and using high resolution photographs also showed that there were no differences between specimens of different species. The scales in all specimens had a similar morphology; small, tightly packed and unornamented and diamond shaped (contra Agassiz, 1844–1845: see Fig. 7). This morphology was homologous along the length of the body, with only small changes in size being observed in the scales of anterior end. Figure 7 shows this scale morphology and arrangement as observed in numerous specimens, including representatives of all three species of Mesacanthus looked at in this study. Given the lack of ornamentation, or any other small morphologies, as has been observed in the scales and spines of the specimens of Mesacanthus, as well as a lack of variation in shape along the length of the body, this study did not take the study of the scale and spine micro-structure to any greater degree of sophistication than what is described. Because the scales all appear to lack ornamentation it seems unlikely that any further information would be gained from using greater degrees of magnification that would be of relevance to this particular investigation. Future work on acanthodian scales using SEM imaging may reveal previously undescribed micro-structures in specimens of Mesacanthus not visible using only a light microscope and these may prove to be useful in subsequent taxonomic discussions if clear groups can be created on the presence/absence of these micro-structures. However, given there is no mention of differences in scale and spine morphology in the original diagnosis of any of the species other than M. pusillus, or in any of the subsequent literature, and that the overall spine and scale morphology has been observed not to differ among any of the specimens looked at in the study, this investigation finds that no morphological differences exist between the scales and spines of M. mitchelli, M. peachi and M. pusillus.

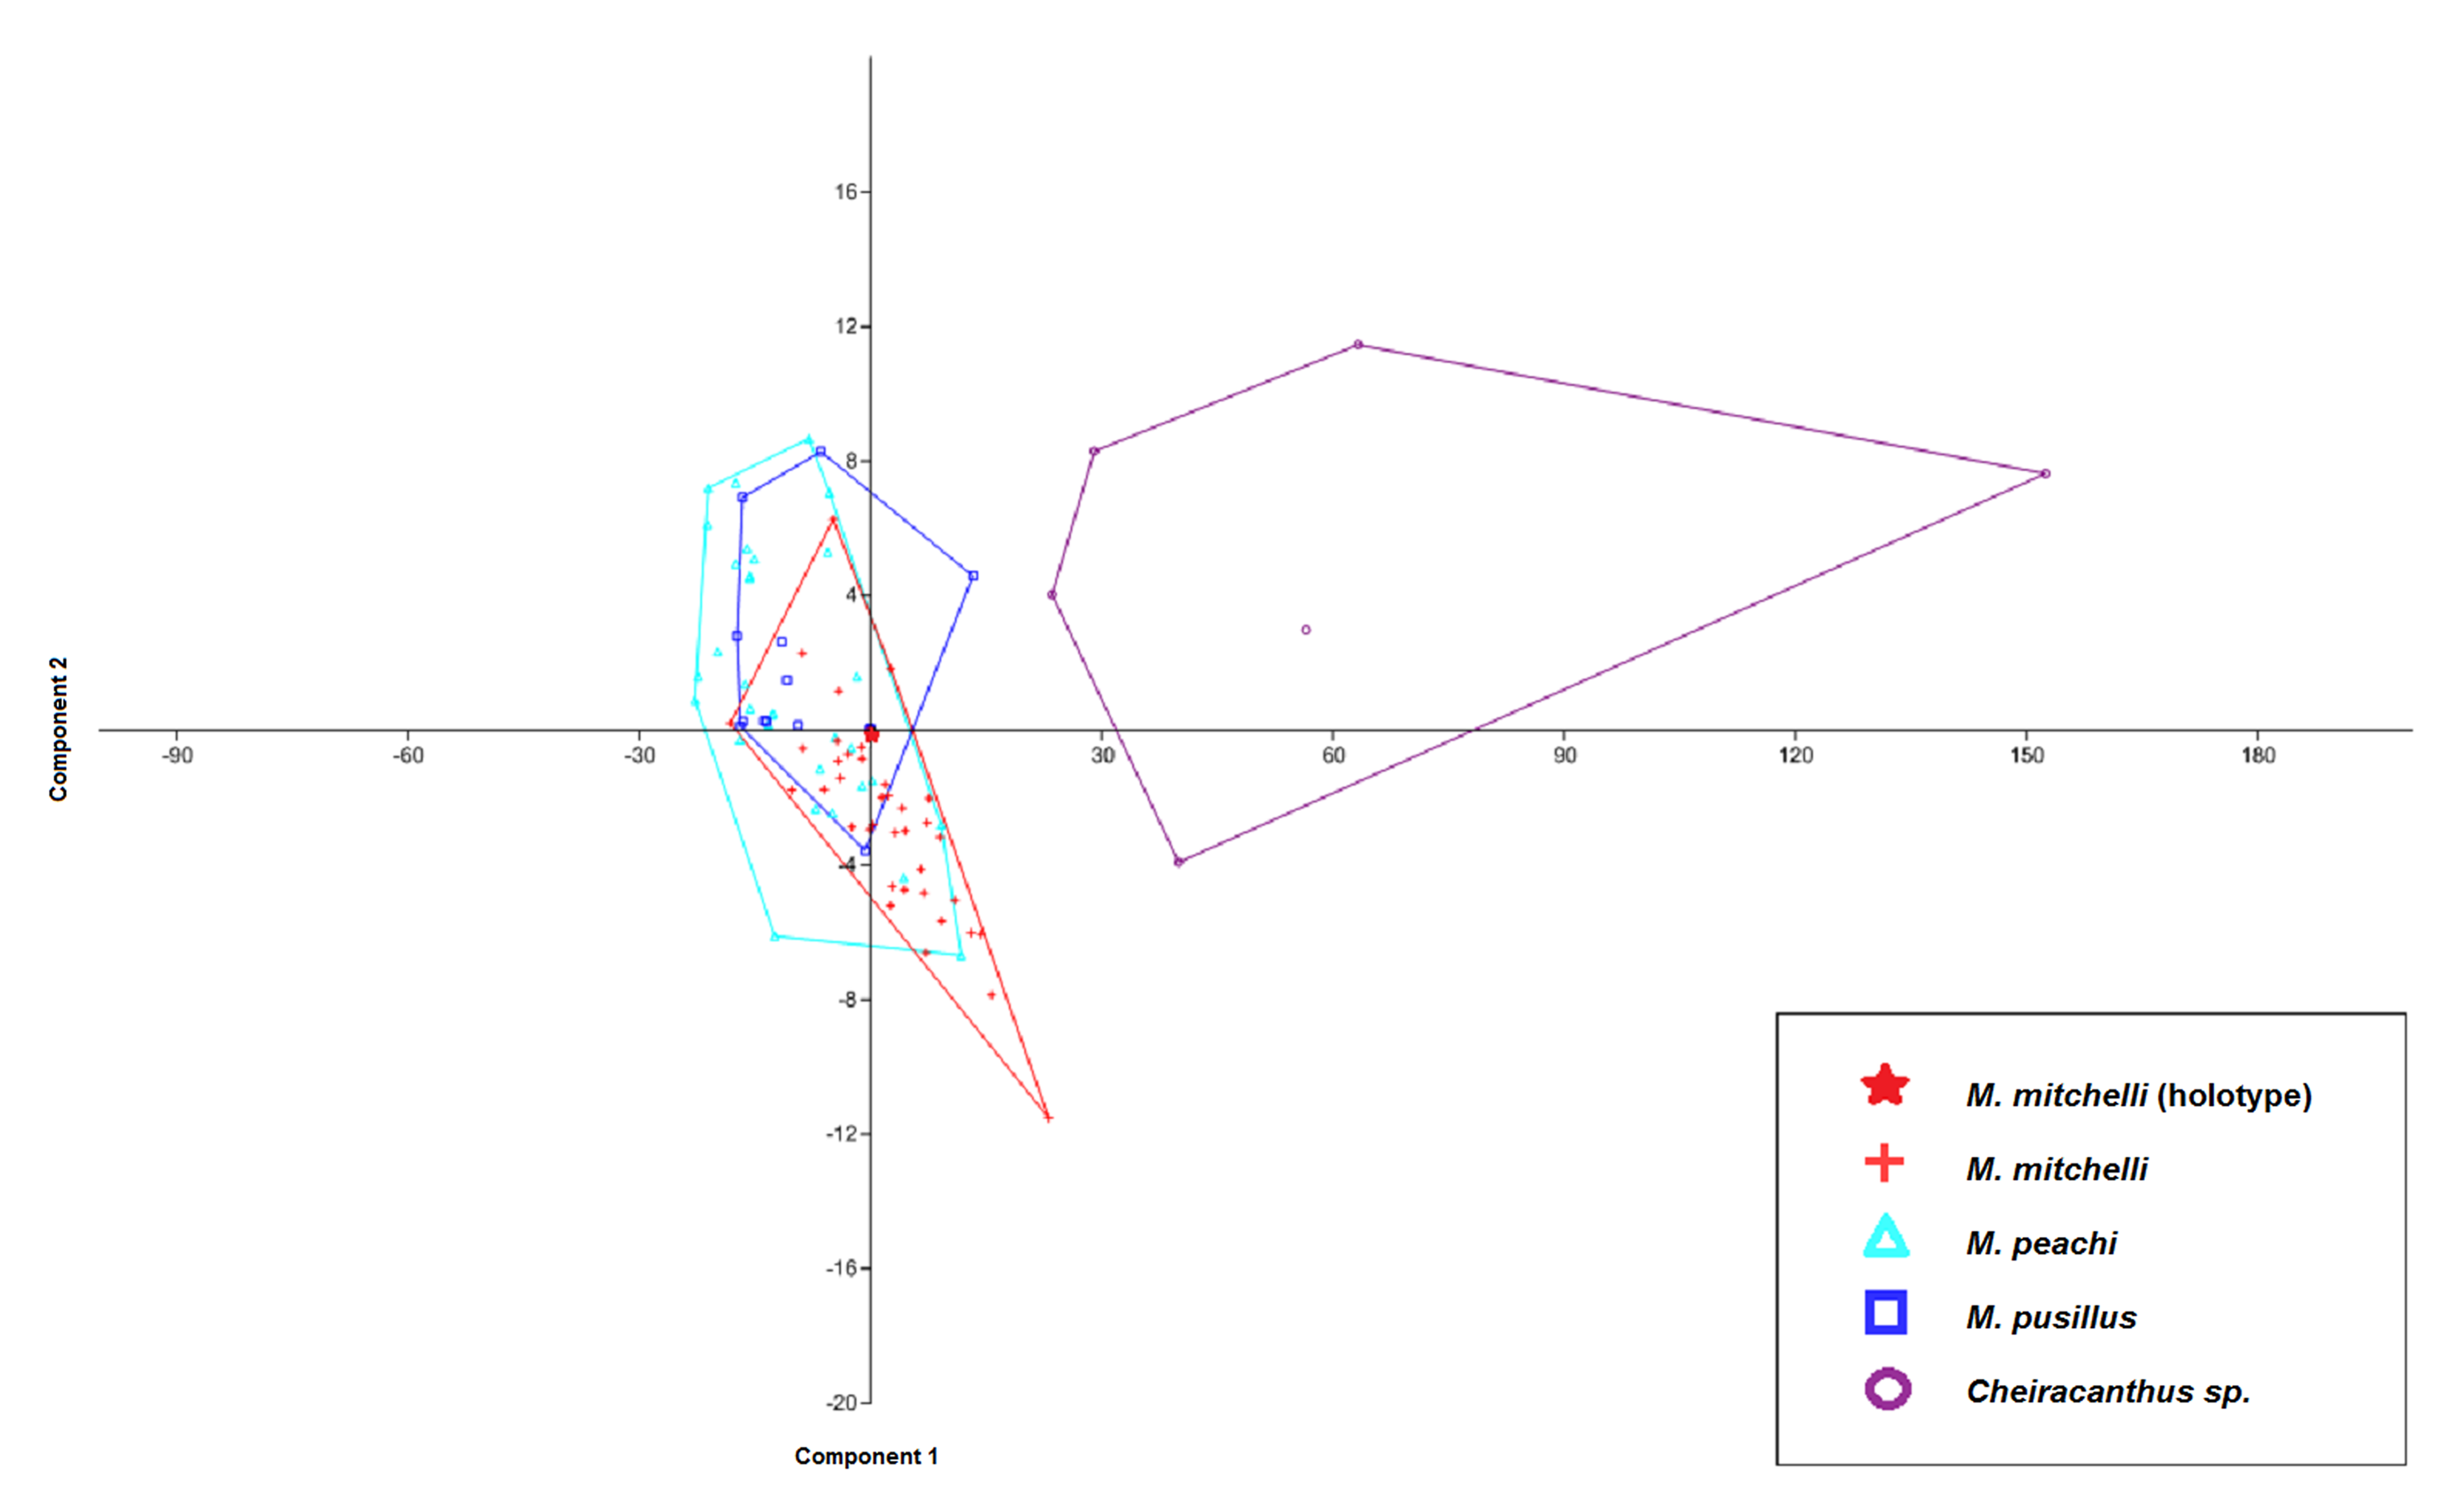
Figure 4: CVA scatter for specimens of Mesacanthus and Cheiracanthus with convex hulls.
The figure shows the high degree of separation between specimens of Cheiracanthus and Mesacanthus that is produced using this method with the measurements laid out in Fig. 1. Given how anatomically similar these two genera are, this analysis lends evidence to the strength of this method in helping to distinguish between similar and relatively conservative taxa such as acanthodians. As in Fig. 3, the speciemens of Mesacanthus from the Middle Devonian plot more closely to one another than they do to the speicmens from the Lower Devonian. The numerical results of these analyses are shown in Table 4.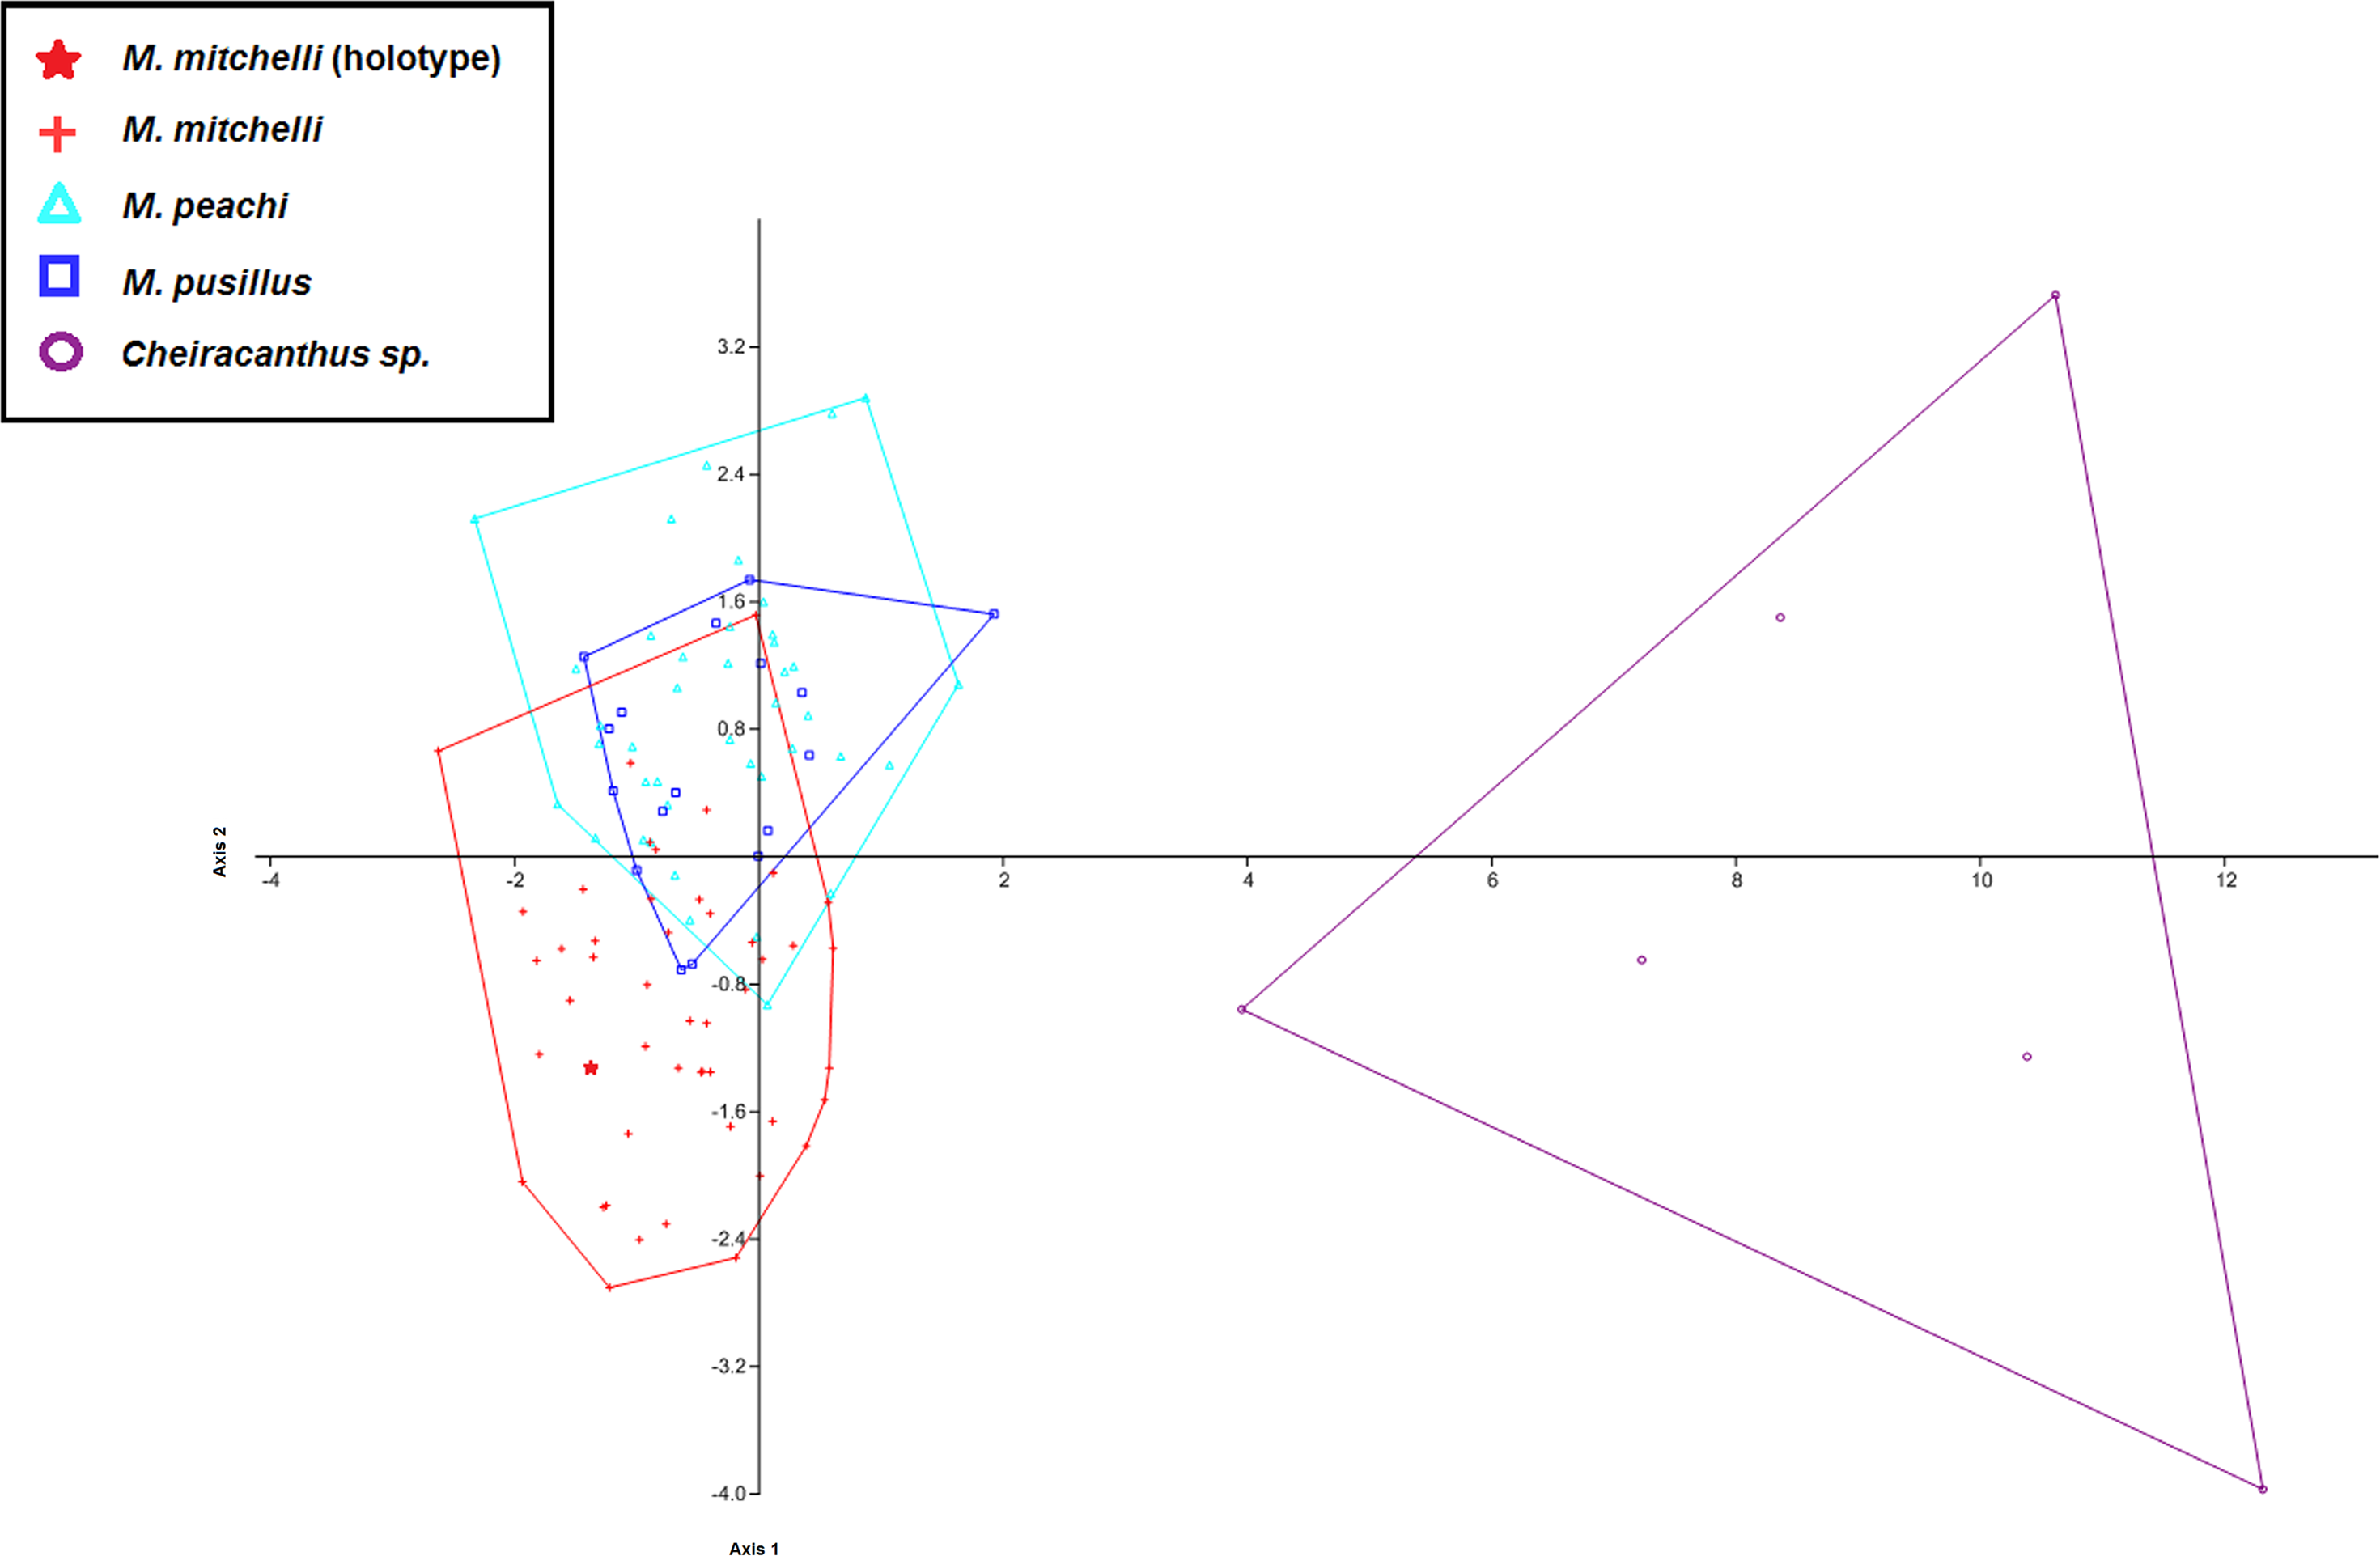
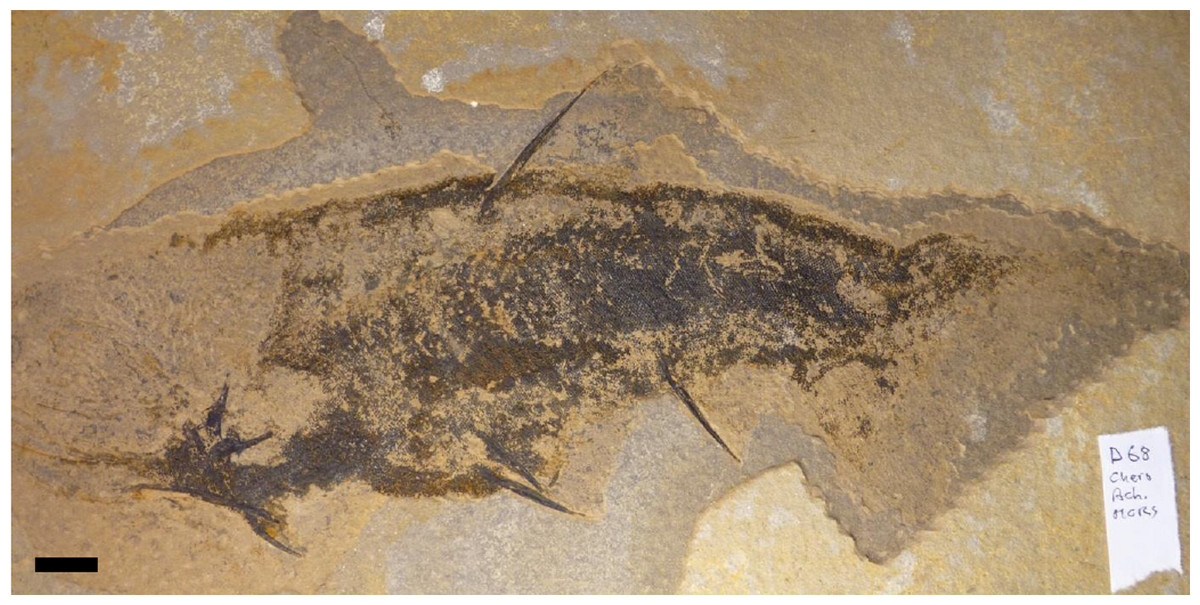
Figure 5: Specimen of Cheiracanthus sp.
Specimen ABDUG Pal.D68, from the Middle Old Red Sandstone at Achanarras quarry.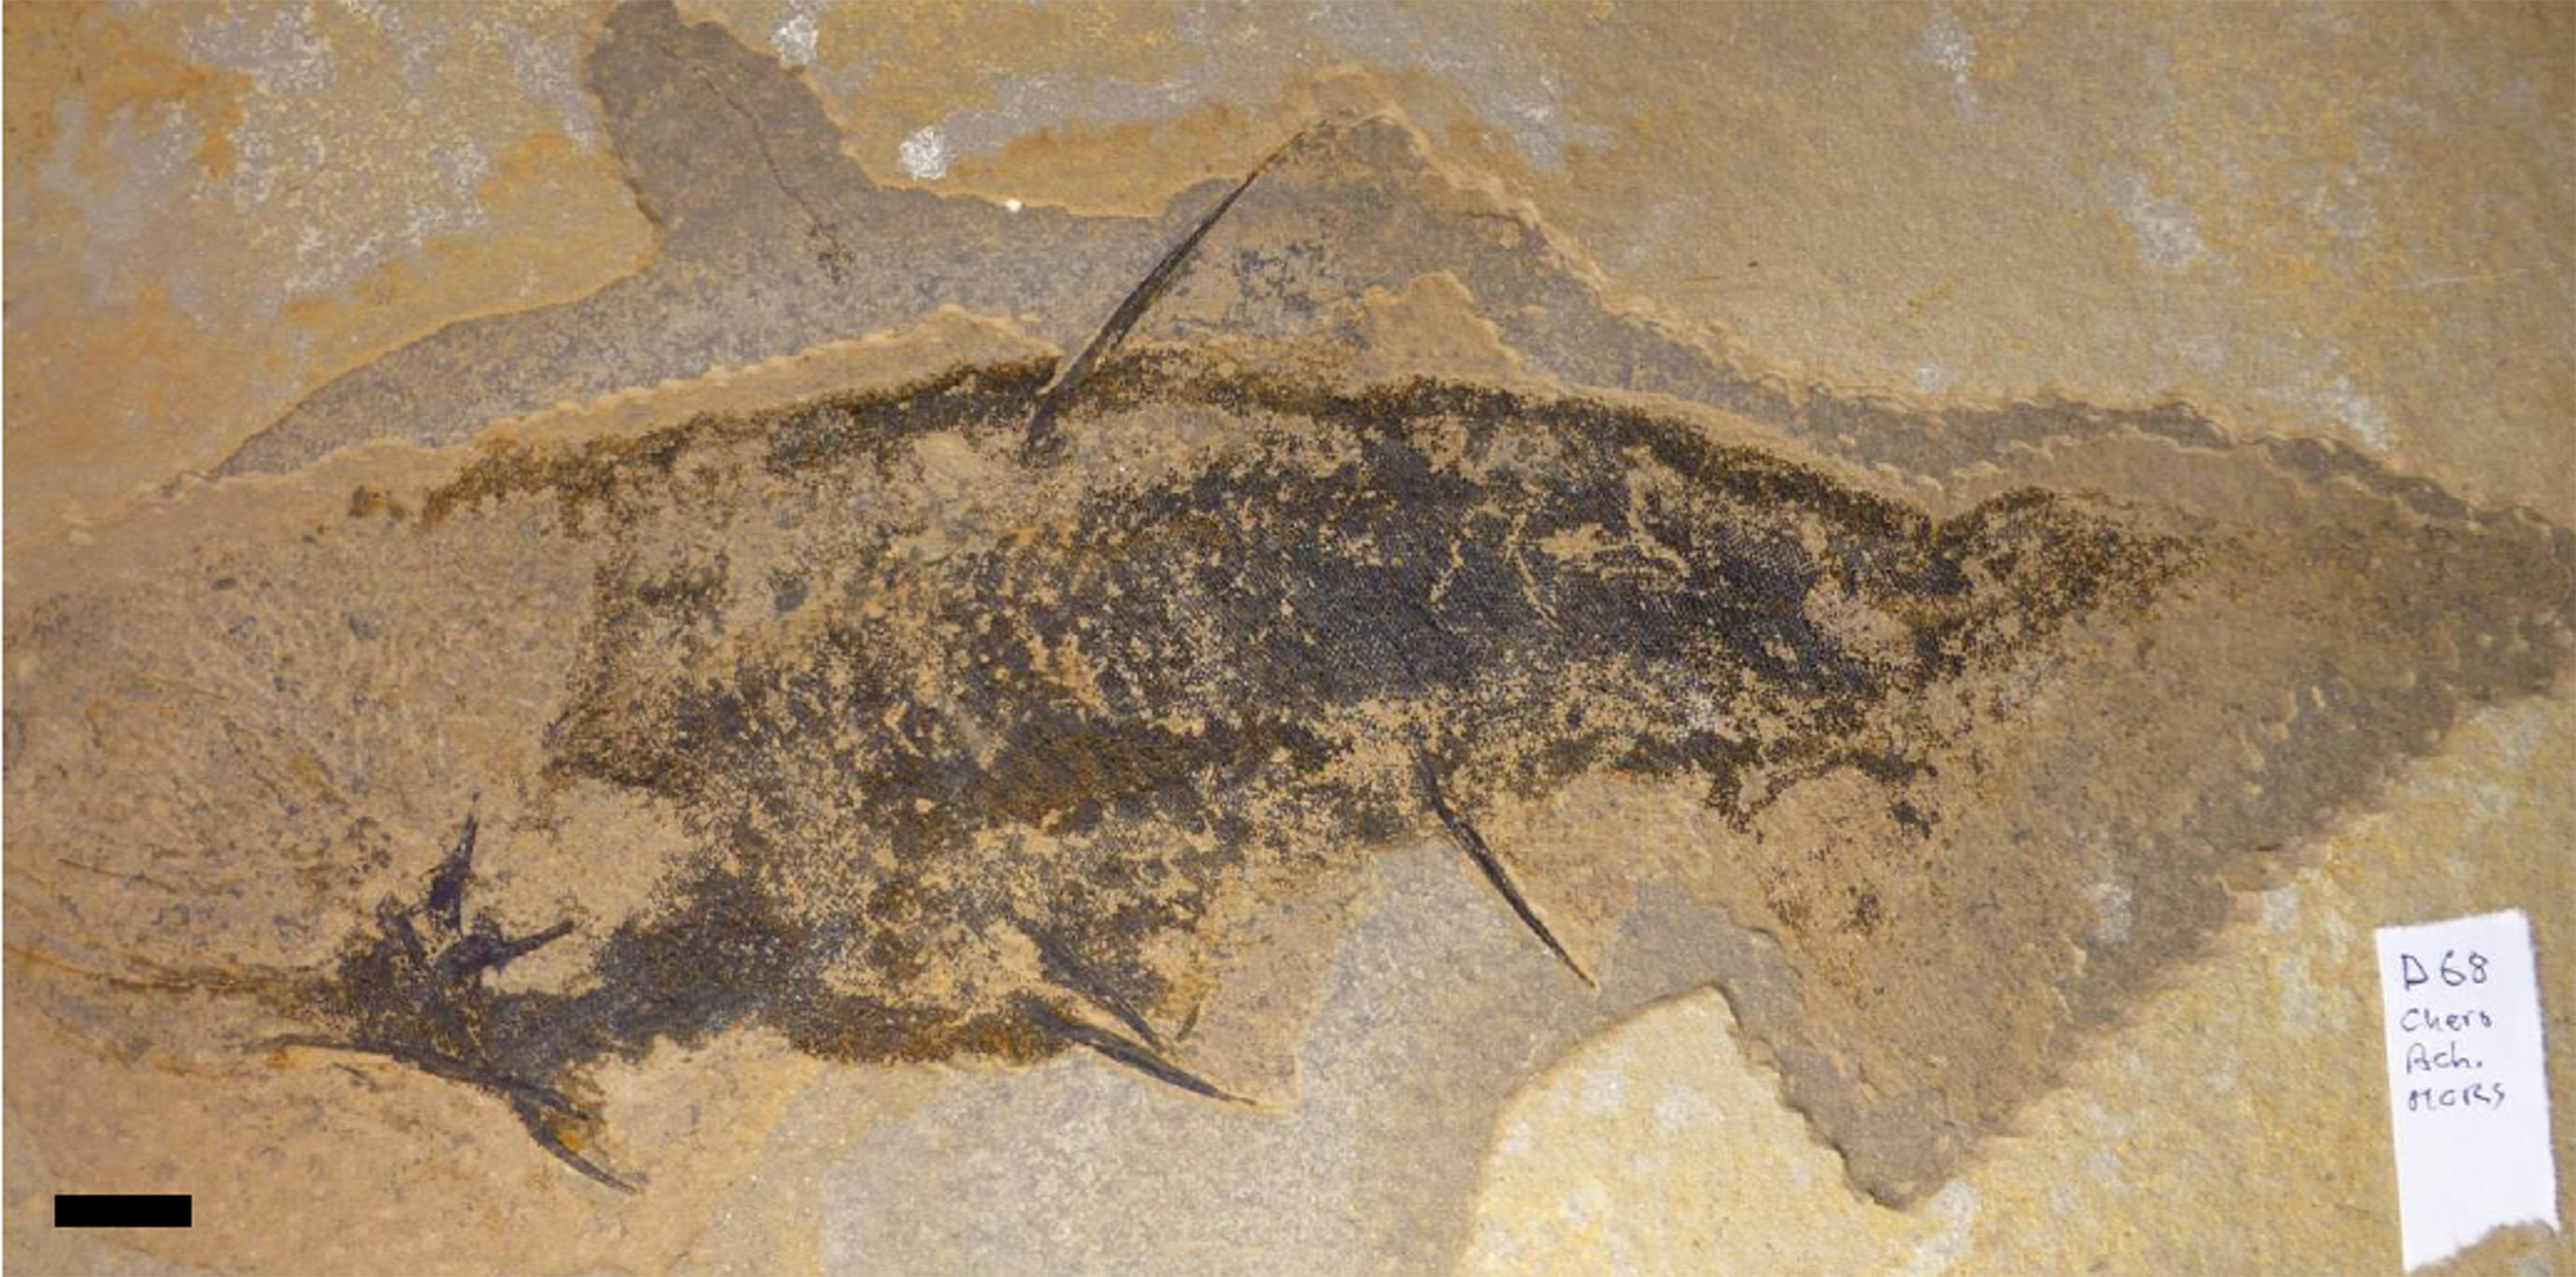

Figure 6: Specimen previously identified as Mesacanthuspusillus.
Specimen ABDUG Pal.D90 from the Middle Old Red Sandstone of Achanarras quarry showing th e standard body plan for Mesacanthus as outlined in Fig. 1. This body plan is the same in all specimens of Mesacanthus with no observed differences between the 3 species looked at in this study. Scale bar = 20 mm.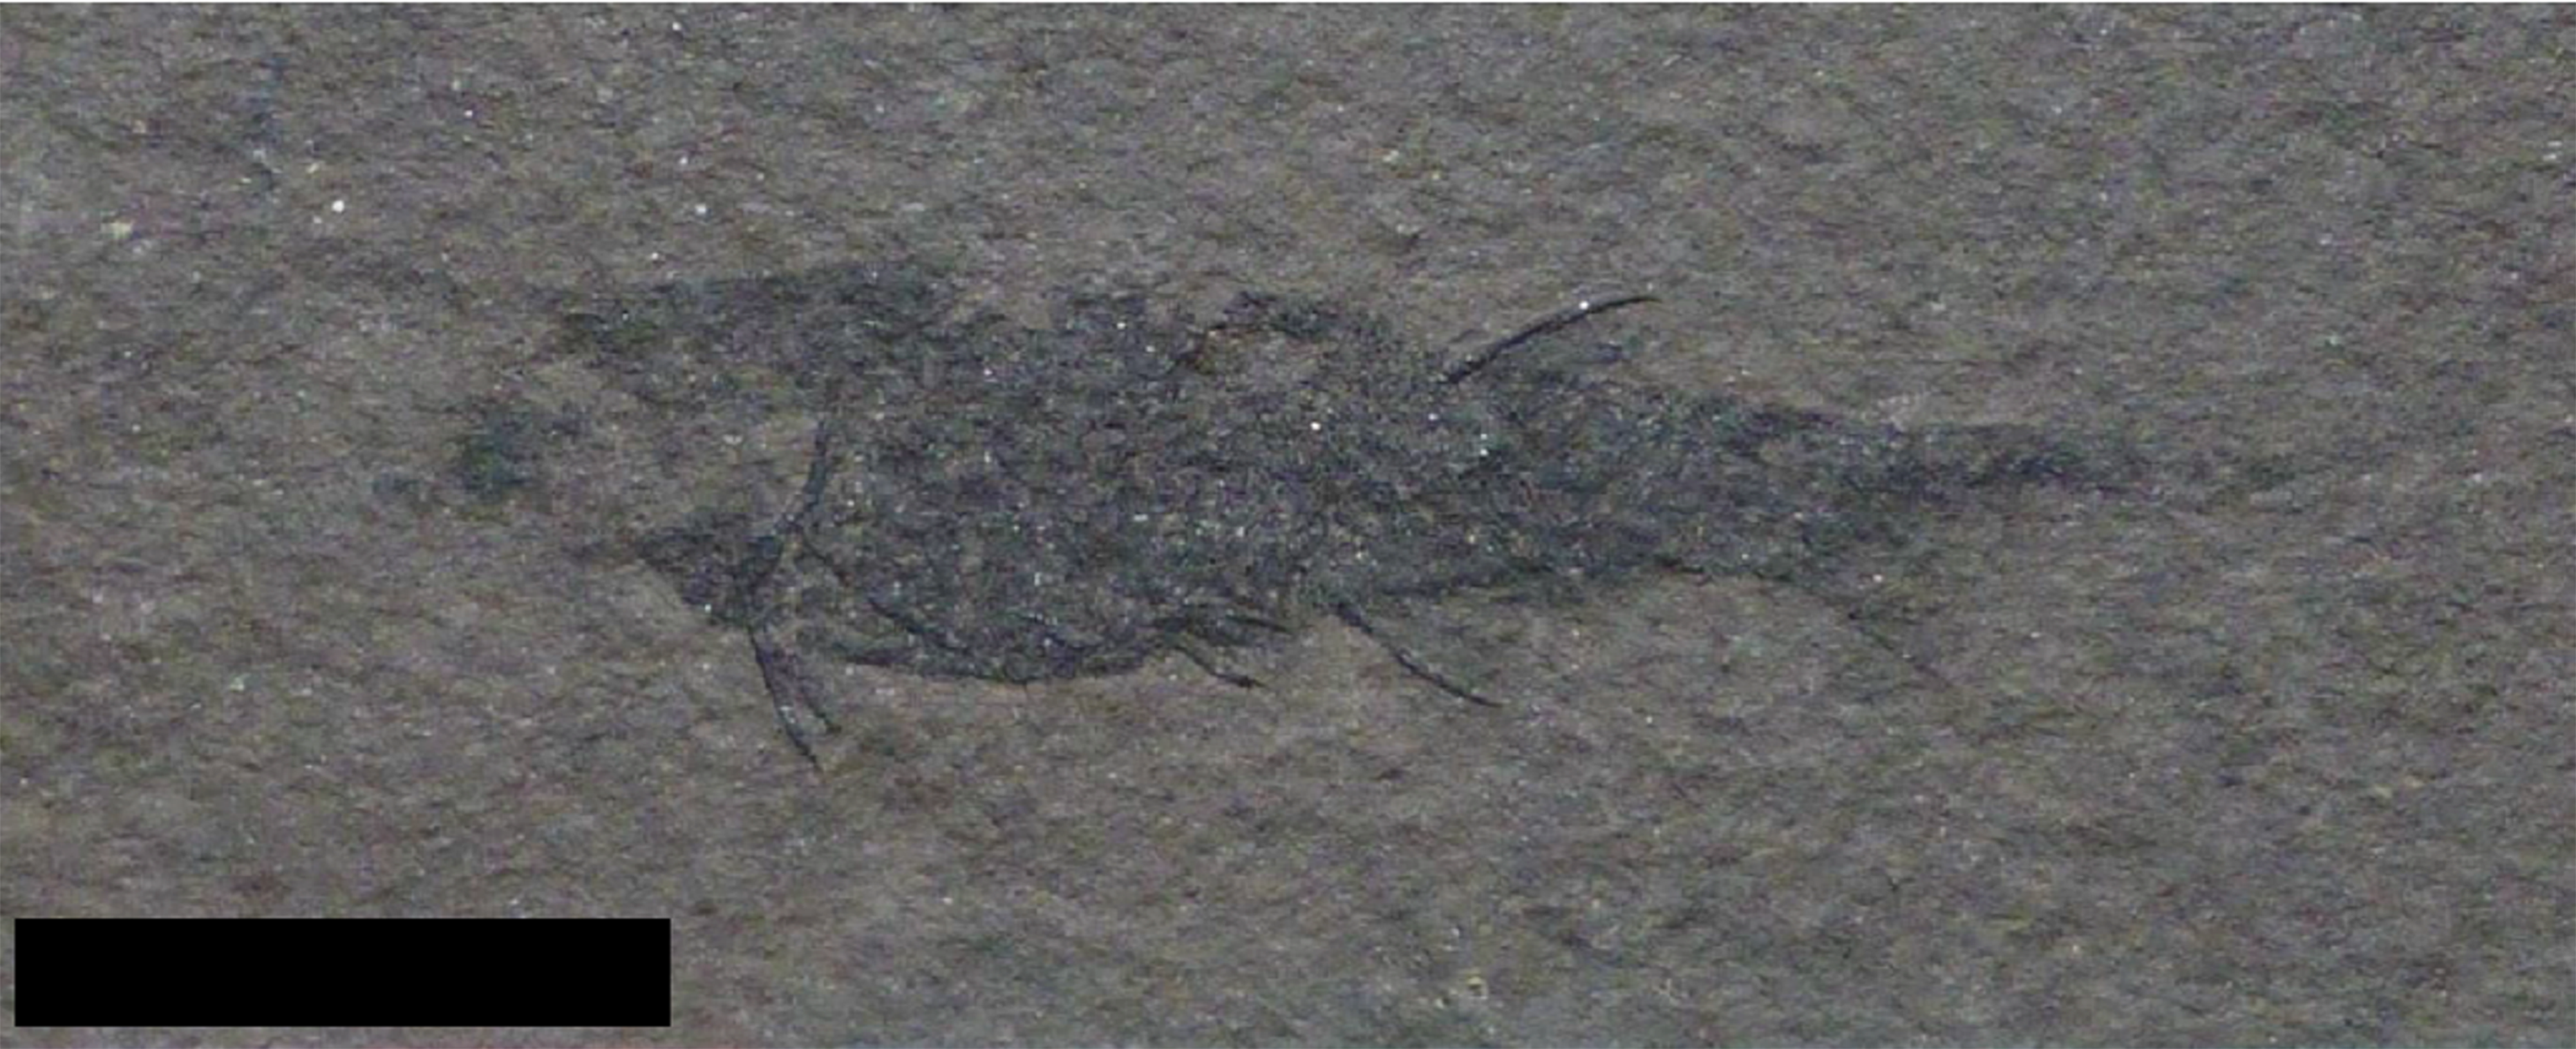
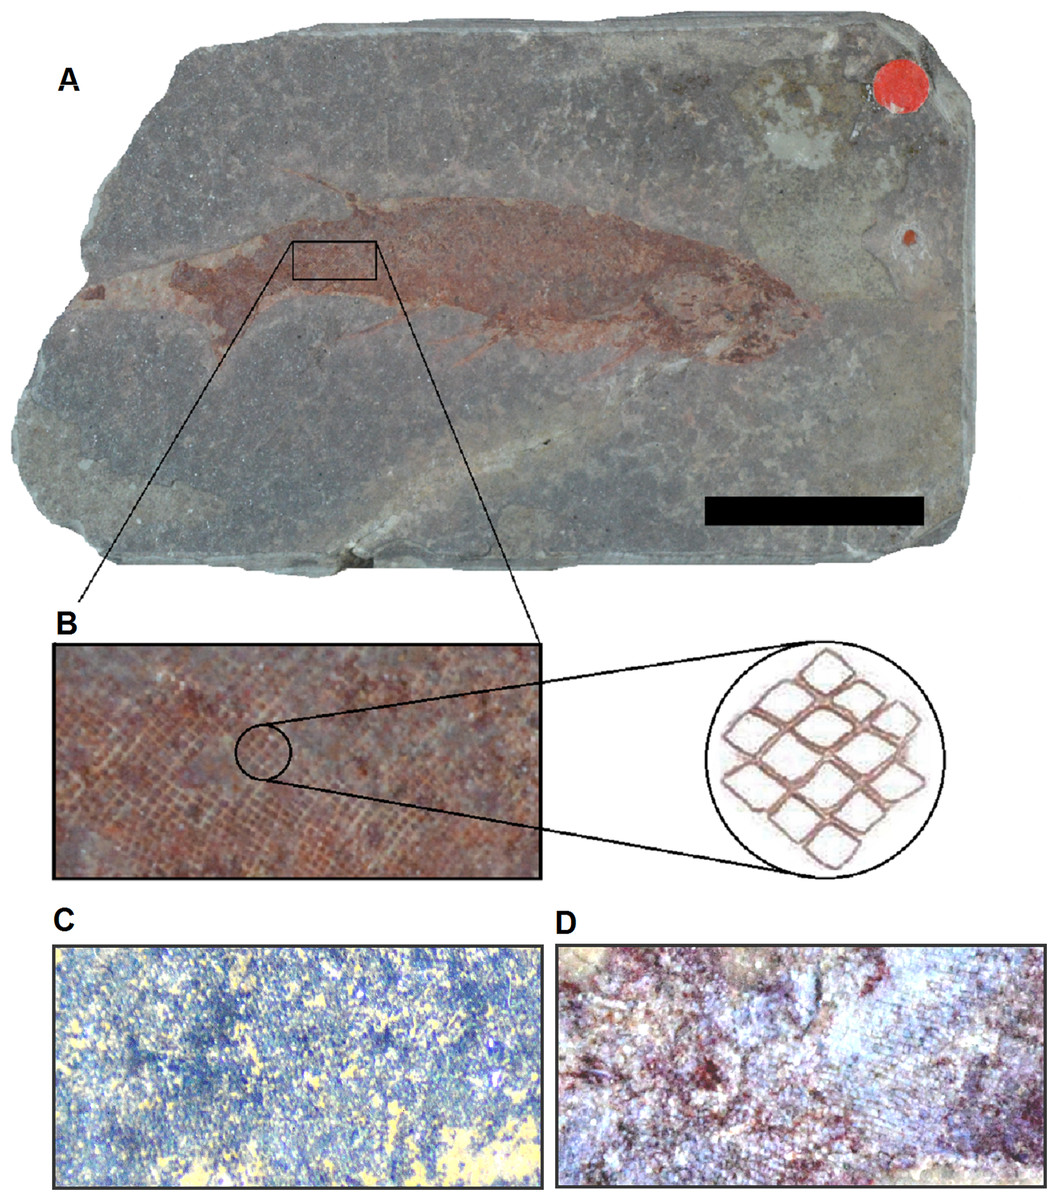
Figure 7: Scale morphology and arrangement in Mesacanthus.
(A) Specimen NHMUK PV P1331 from the Lower Old Red Sandstone of Turin hill. This specimen is identified as Mesacanthus mitchelli. (B) Close up of scales from the posterior third of NHMUK PV P1331. When looked observed under a light microscope, these scales appear to be diamond shaped rather than triangular, and this is true of the scales at every point along the length of the body. Overall the morphology and arrangement is relatively homogenous around the different regions of the body. This same arrangement and scale morphology has been observed in specimens of all 3 species looked at in this study. None of the specimens showed ornamentation on the scales of the main body, head or tail and no other shapes or arrangments could be found that might help distinguish between the species. (C) Close up of scales from specimen NHMUK PV P61697 (M. peachi). These scales are unornamented and have been observed to share the same diamond shape and tight packing as the scales in NHMUk PV P1311. (D) Close up of the scales of NHMUK PV P35786 (M. pusillus).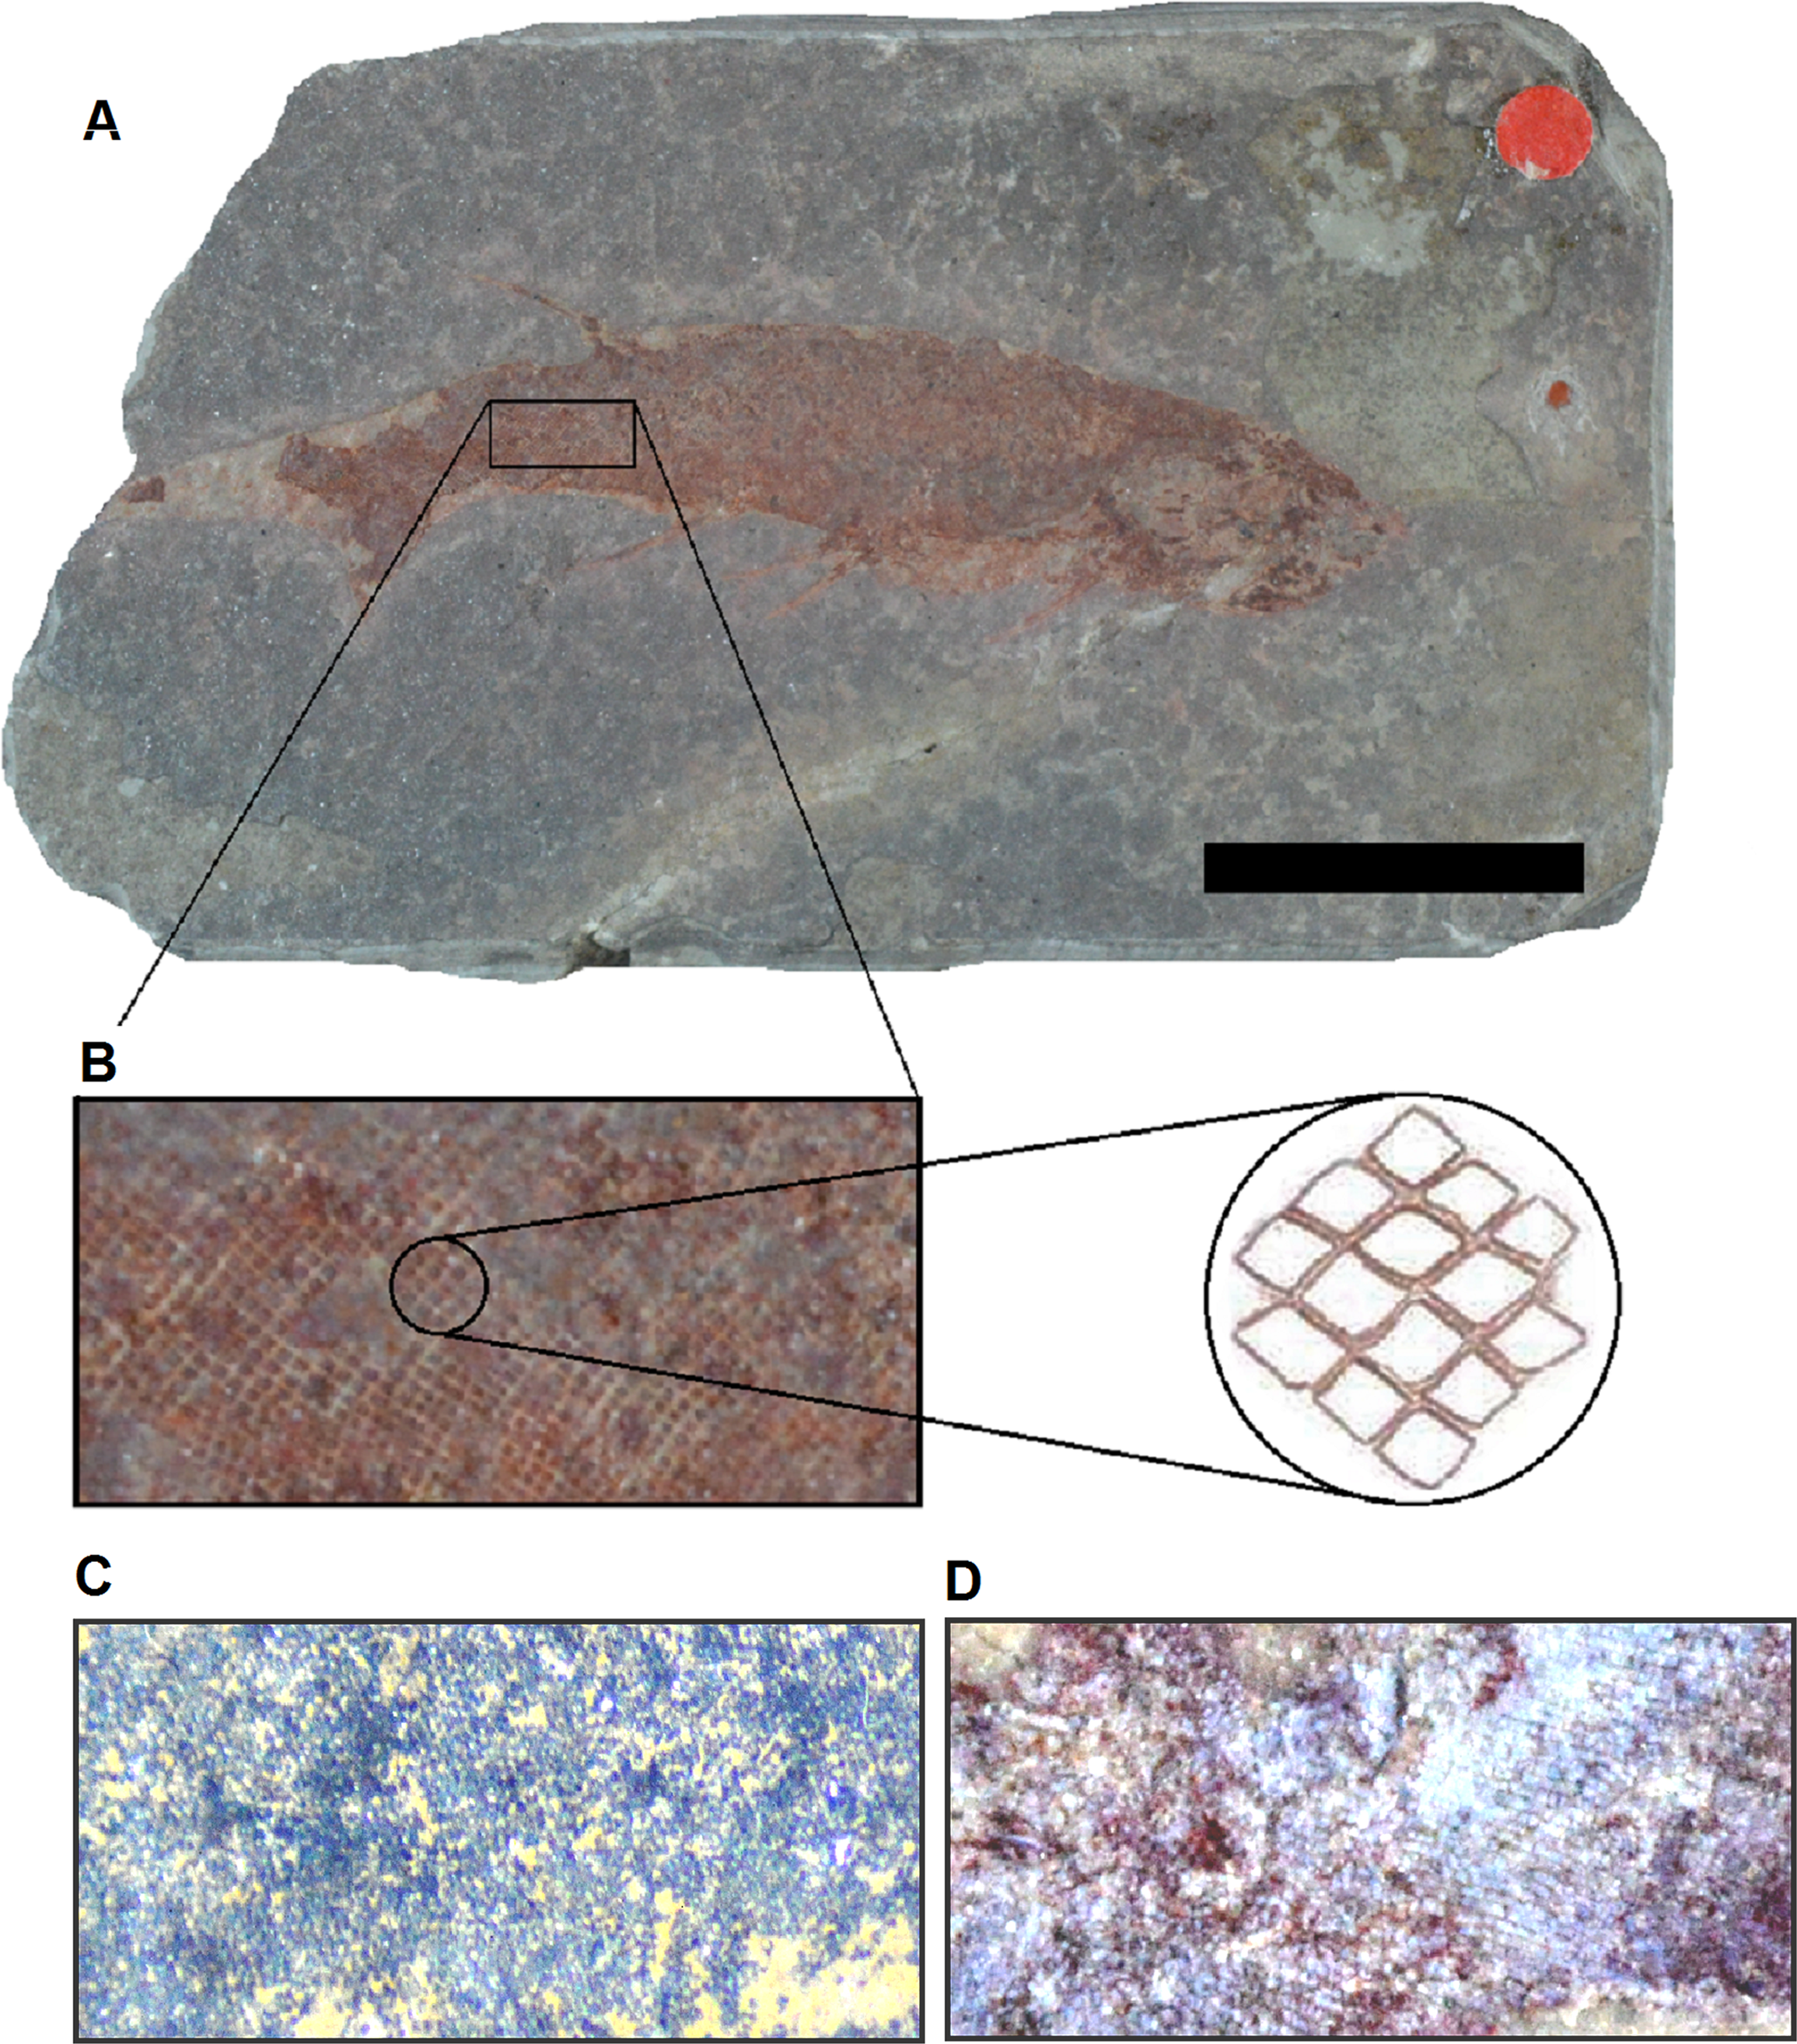
To investigate whether or not this method can be effective in differentiating between morphologically similar taxa a second set of MANOVA/CVA tests were carried out that also incorporated data from the genus Cheiracanthus, another acanthodian from the Devonian of Scotland (see Fig. 5). This analysis showed how clearly specimens of Cheiracanthus can be distinguished from specimens of Mesacanthus using the same set of measurements (see Fig. 4). Table 4 shows the confusion matrix produced in this analysis of Cheiracanthus and Mesacanthus as well as the Uncorrected and Bonferonni corrected Hotelling’s p-values that were recovered. Given the similarity between these two genera these results highlight just how effective the measurements used in this study can be in discriminating between different taxonomic groups. Further to this, a PCA was carried out in which specimens of the genus Cheiracanthus were also included. Just as with the CVA results, the PCA results show a great deal of separation between the specimens of Cheiracanthus and the specimens of Mesacanthus (see SOM S3) lending further evidence to the high potential of this method as a tool for discriminating between similar, anatomically conservative taxa.
In all of the analyses, the holotype of M. mitchelli (NHMUK PV P560) plotted well within the standard range for the species; it did not plot close to specimens of M. peachi and M. pusillus (see Figs. 2, 3A–3D, 4 and 8).
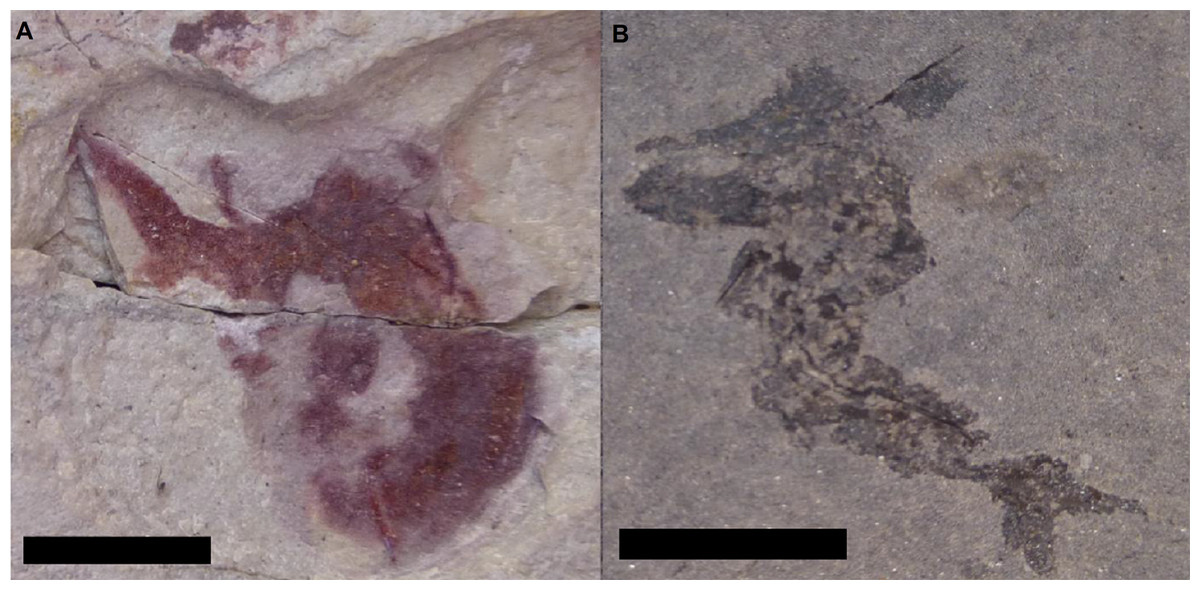
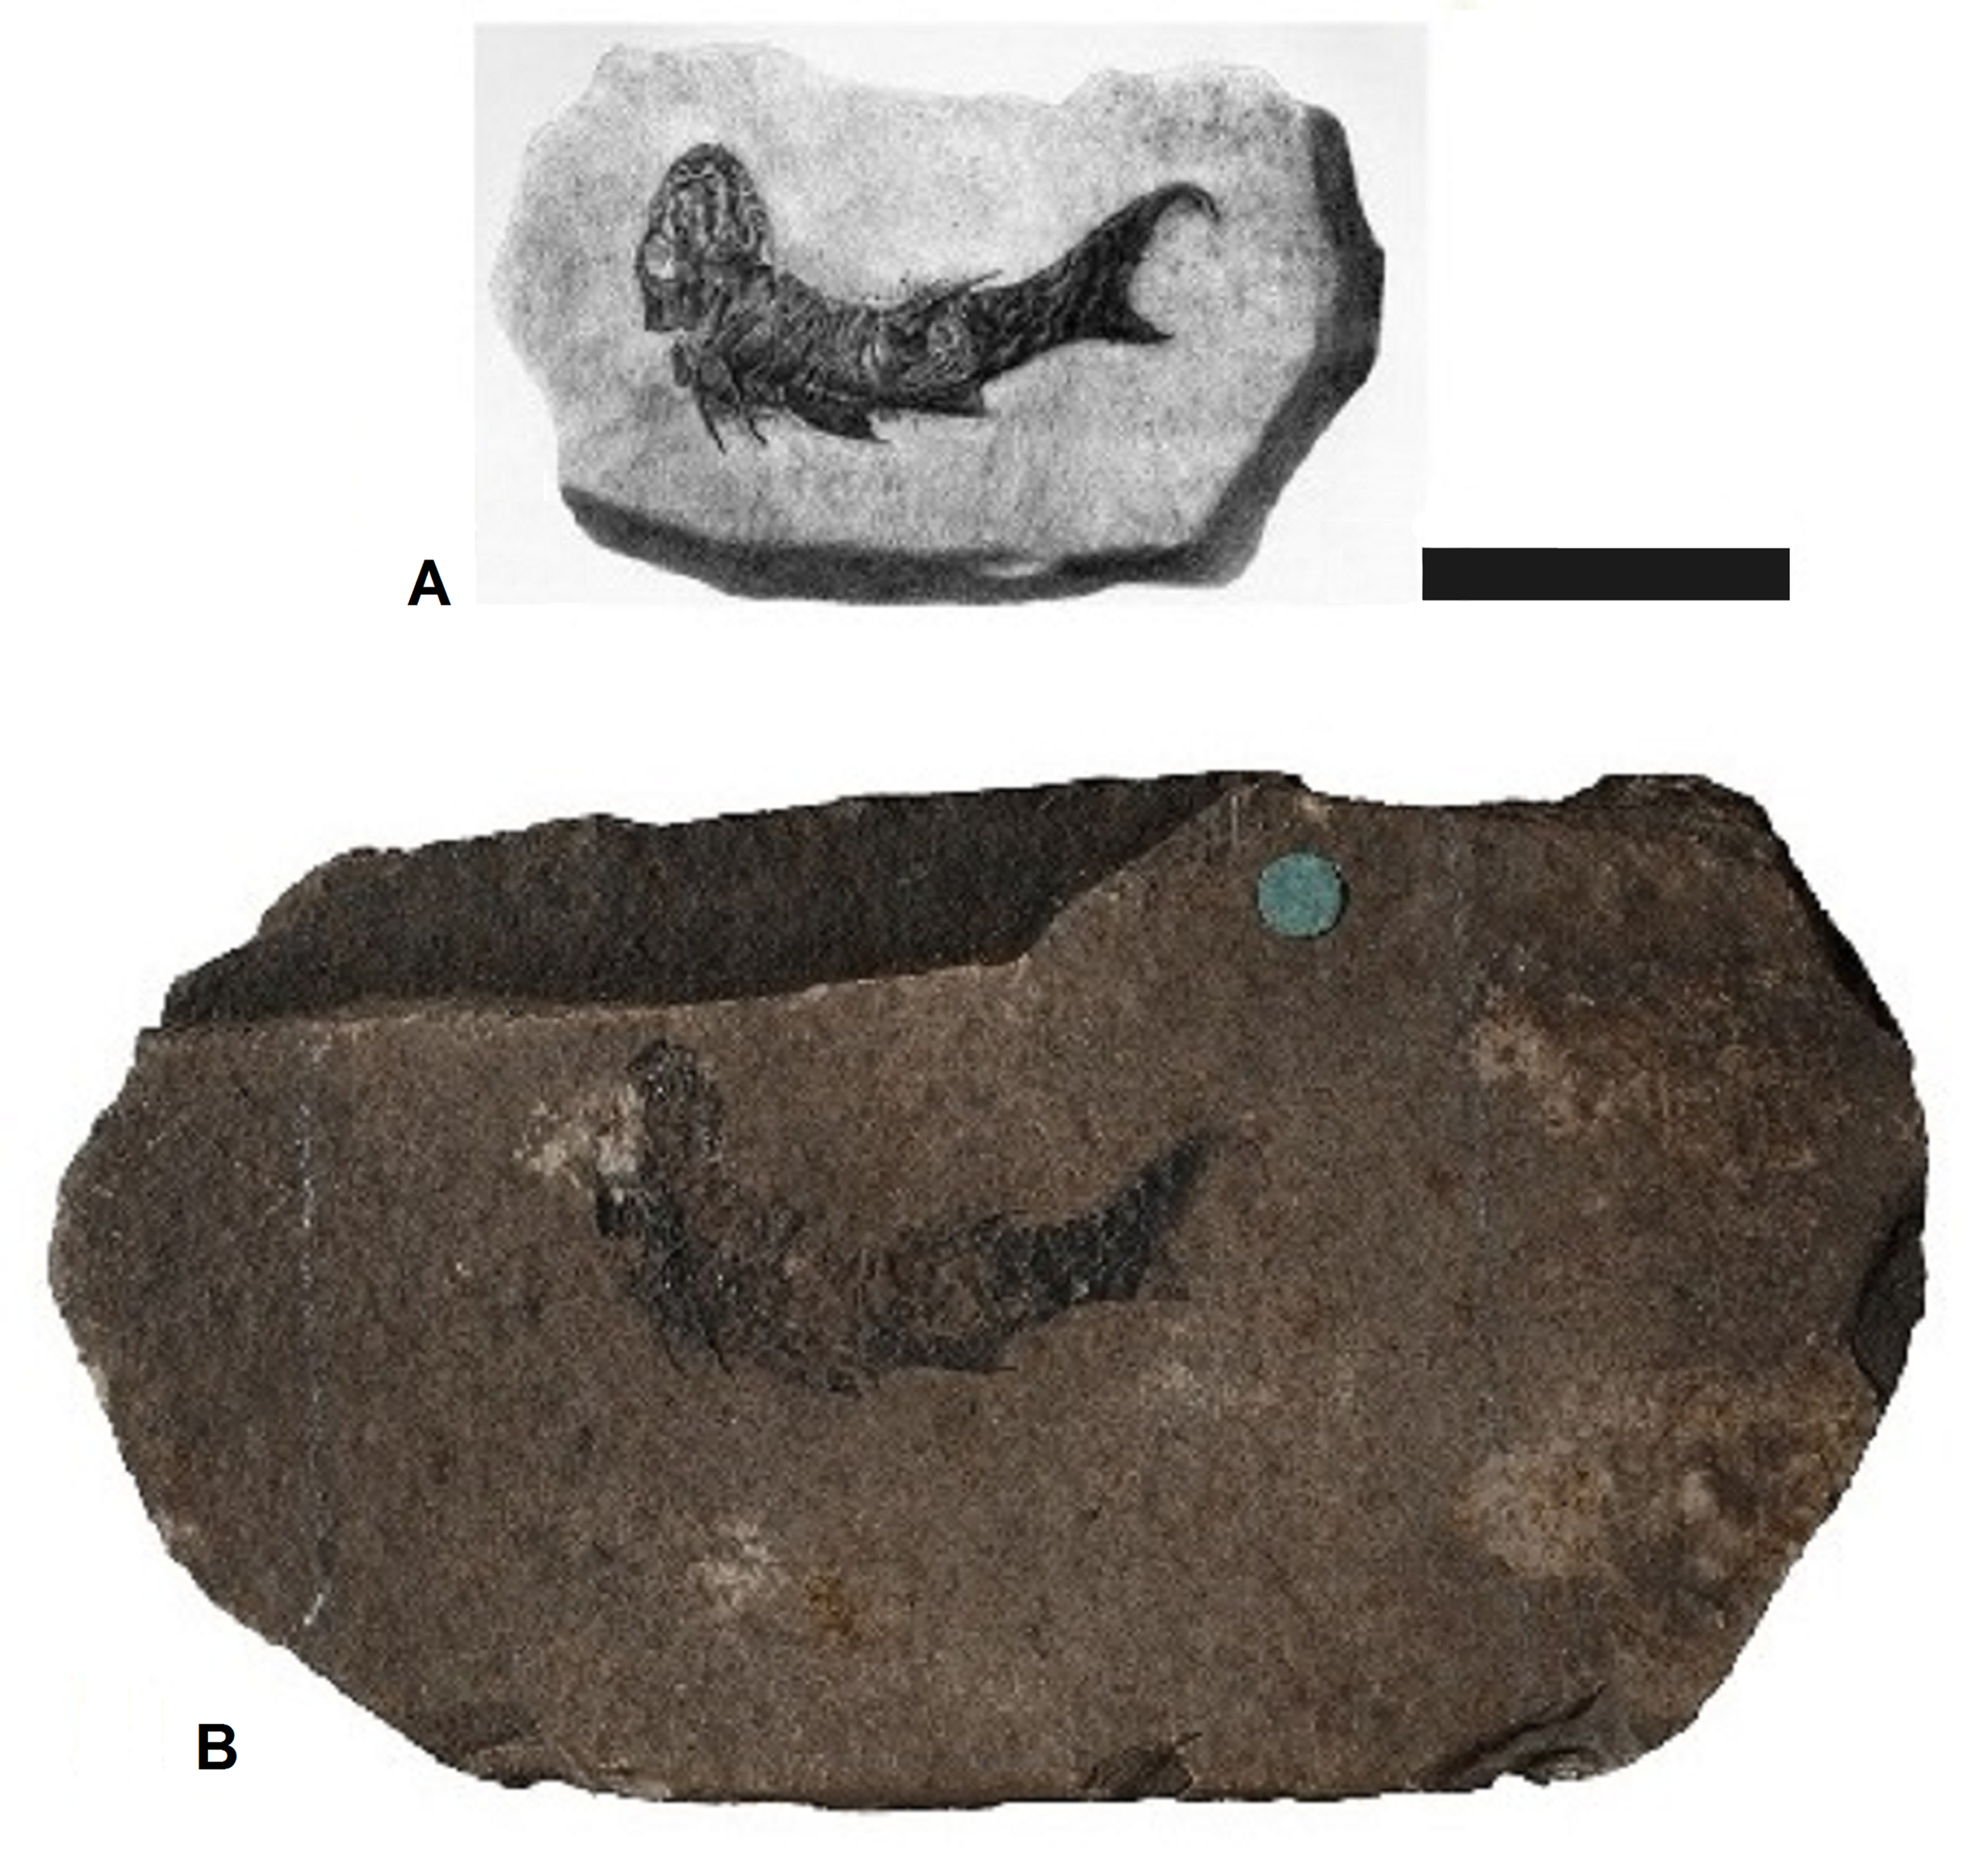
Figure 8: Preservational differences between localities that have produced specimens of Mesacanthus peachi.
Specimens of M. peachi from Tynet Burn (A) and Achanarras (B) showing the differences in preservation between the areas. Both specimens show a high degree of post mortem damage (folding and twisting) and so neither was suitable for use in this study. Scale bar = 20 mm.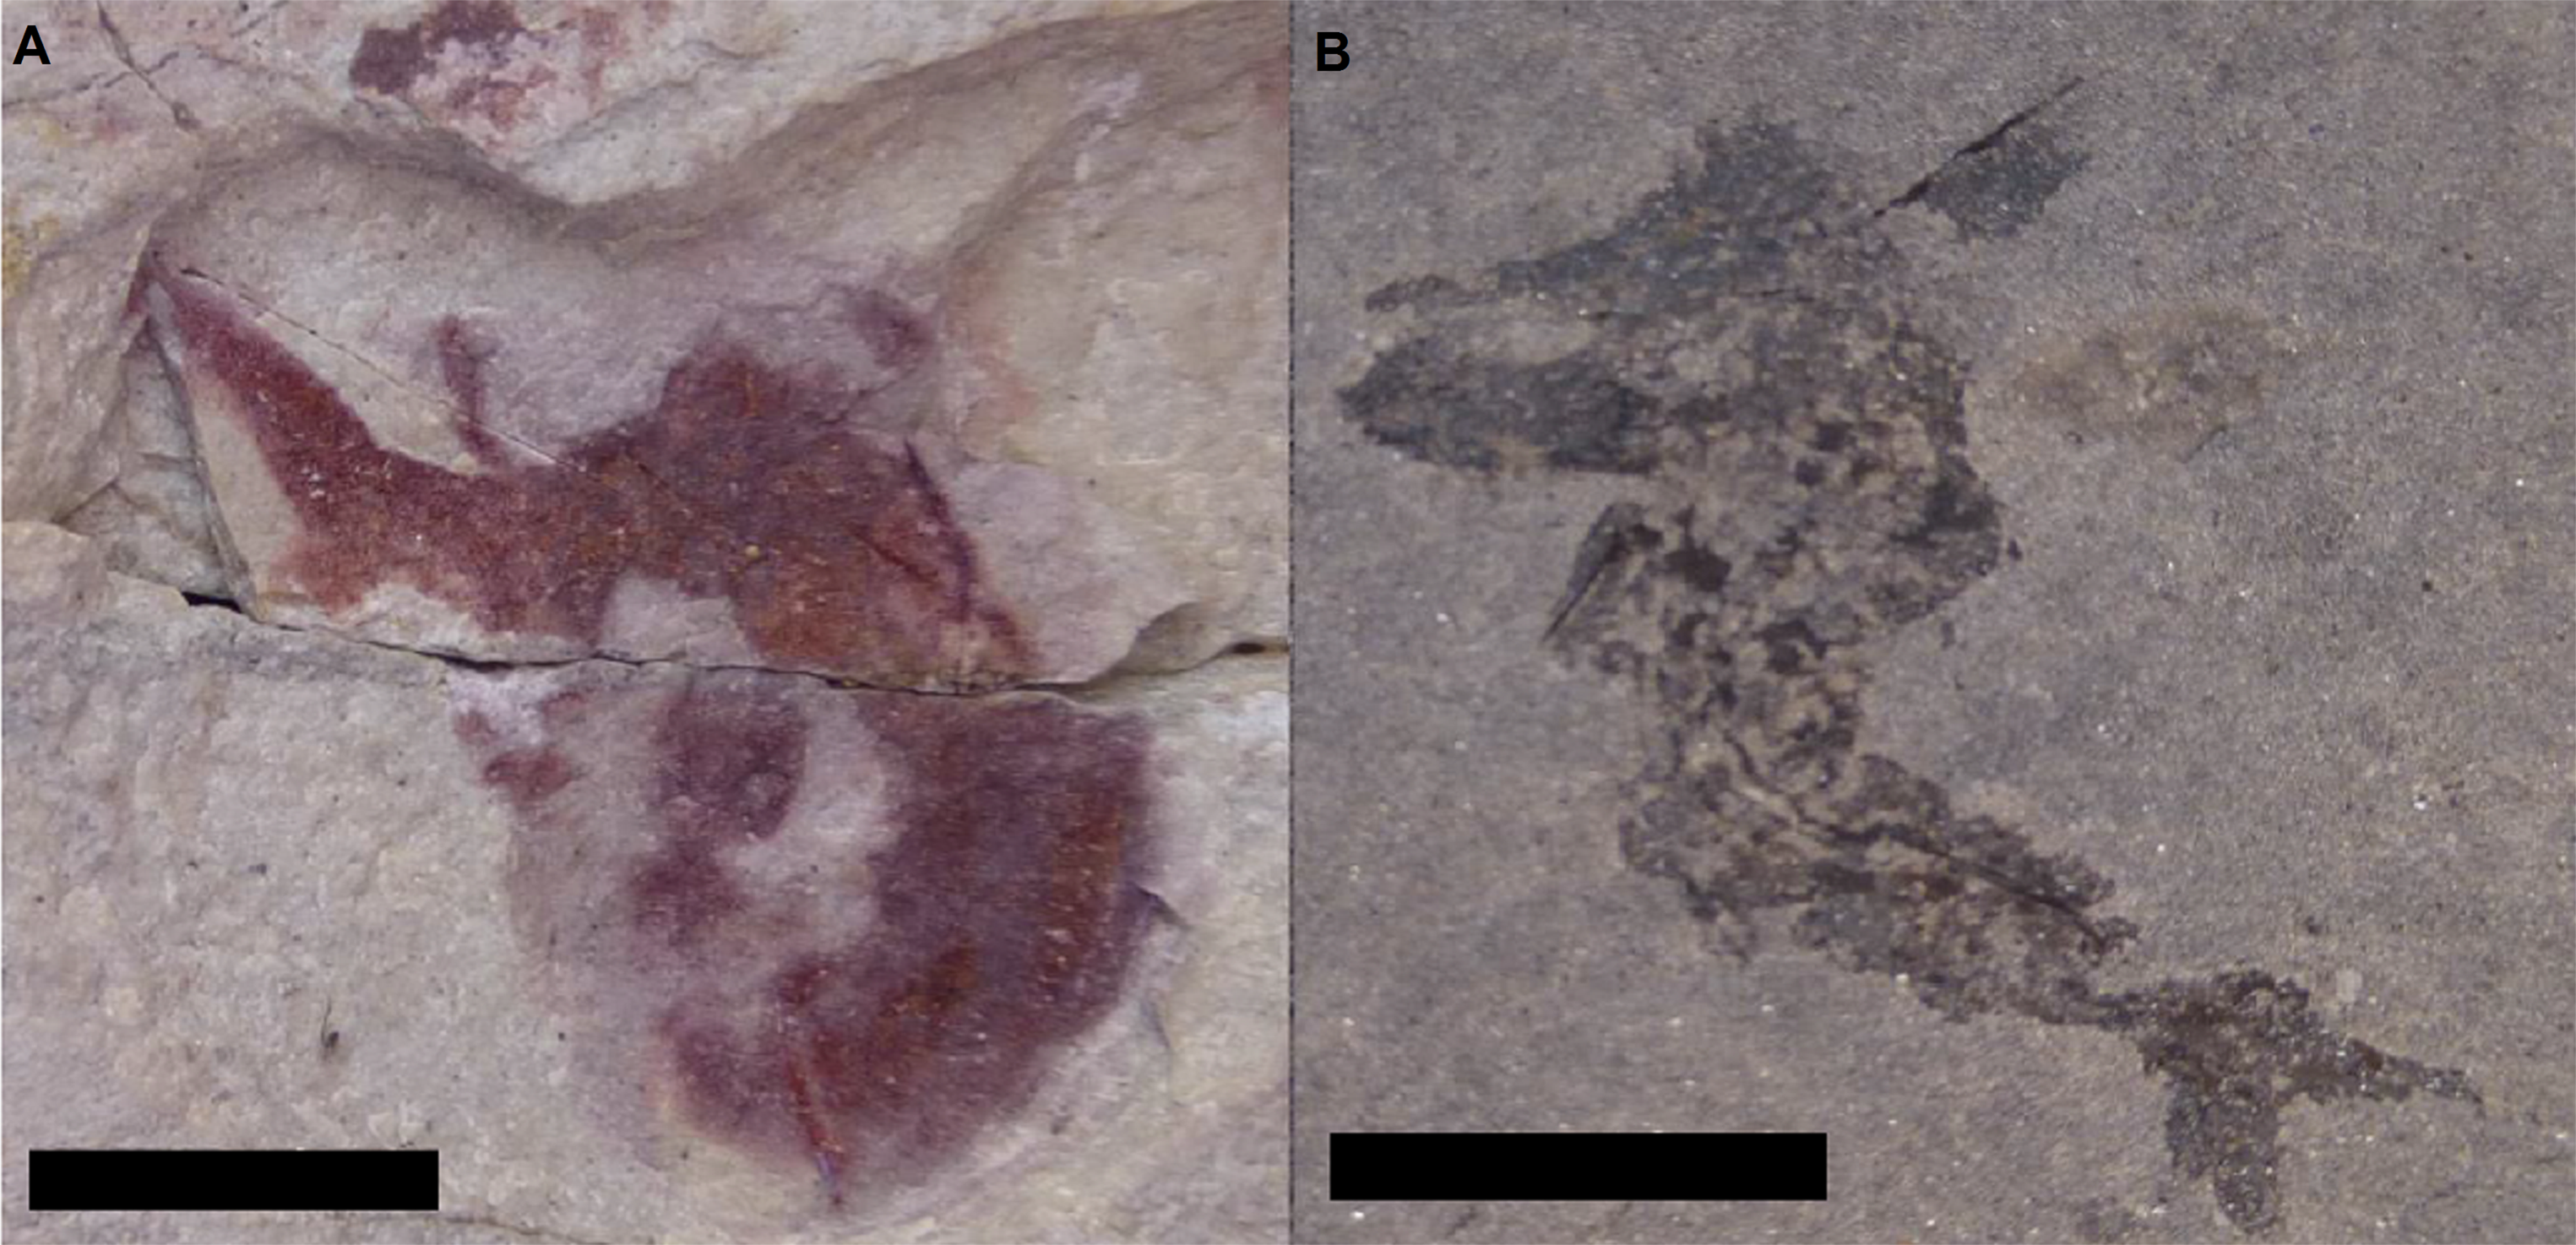
Discussion
Multivariate morphometric analyses have been widely used in the fields of botany, zoology and palaeontology for the purposes of taxonomic investigation and species discrimination (LaFlamme, Narbonne & Anderson, 2004; Henderson, 2006; Wang et al., 2011; Mayo & Andrade, 2013; Zylinska, Kin & Nowicki, 2013; Jagersbacher-Baumann, 2014). This study utilised PCA and MANOVA/CVA to investigate the amount variation among multiple species within a genus, which has previously been done for genera from a very broad range of organisms, from flowering plants (Mayo & Andrade, 2013) to mites (Baker & Schwarz, 1997; Jagersbacher-Baumann, 2014; Navia et al., 2015). This method has also been used in numerous taxonomic investigations into genera of extant fish (e.g. Maderbacher et al., 2008; Cooper et al., 2014).
The strength of these methods in discriminating between anatomically similar acanthodians, using the measurements outlined in Fig. 1, was tested through the addition of the genus Cheiracanthus into the data set. Mesacanthus and Cheiracanthus differ in a number of morphological ways (scale morphology, presence/absence of prepelvics) but in terms of the measurements used in this study the only observed differences are in the total body length and width (specimens of Mesacanthus are on average approximately 35% the average length of specimens of Cheiracanthusand only 25% the average width) and the relative positions of the attachments for the dorsal and anal fin spines. In terms of the latter character, specimens of Cheiracanthus differ in the fact that the attachment of their dorsal fin spine is located anterior to the attachment of their anal fin spine, and not the other way around, as is the case in all species of Mesacanthus (i.e., LD:LA for Cheiracanthus <1.0 and LD:LA for Mesacanthus >1.0). Given how similar these genera are overall, the results of the various bivariate and multivariate analyses that included specimens of Cheiracanthus showed a clear distinction between the two taxa. Because of the results of these additional analyses the author feels that this method does have potential when it comes to being used for discrimination between similar and morphologically conservative taxa such as acanthodians.
Given that M. mitchelli is currently said to be distinguishable from M. peachi on the basis of how ‘robust’ the two species are (M. peachi being supposedly more ‘robust’ than M. mitchelli) then a difference in the XY scatters of length and width between specimens of M. mitchelli and M. peachi should be expected. Simple comparison of these features shows that such a difference does exist and that it is significant (see Table 2). Given that M. peachi is also described as being more robust than M. pusillus, we would expect specimens of M. pusillus to plot separately from the specimens of M. peachi, somewhere closer to specimens of M. mitchelli, on the same XY scatter. However, we do not see this in Fig. 2. In addition to this, no significant difference in the lengths and widths between specimens of these two Middle Old Red Sandstone species was found (see Table 2). From this we must conclude that, among the specimens from the Middle Old Red Sandstone, there is no significant difference in the length to width ratios, and therefore no difference in ‘robustness.’ Given that a difference in ‘robustness’ is currently the only character described that can be used to separate specimens of Mesacanthus from the Middle Old Red Sandstone into two species, M. pusillus and M. peachi, this result strongly suggests that the specimens of Mesacanthus from the Middle Old Red Sandstone probably represent only a single species and not two distinct species, as has previously been thought. Combining this result with the results of the MANOVA/CVA and PCA, it seems apparent that there is not enough evidence to justify the separation of Middle Old Red Sandstone specimens into two distinct species based purely upon the overall shape and size of the specimens.
The MANOVA/CVA that were carried out in which the Middle Devonian specimens were grouped based solely on L/W and not by previous taxonomic assignments also produced no significant differences between the two groups (i.e., the ‘more robust’ group and the ‘less robust’ could not be discriminated based upon any of the other measurements: see Table 5). Importantly, both groups still showed a significant difference with M. mitchelli. This demonstrates how, regardless of how the Middle Devonian specimens are grouped, the Lower and Middle Devonian specimens are significantly different from one another based upon the measurements taken and used in these multivariate analyses.
Additionally, multivariate analyses which grouped all of the Middle Devonian specimens into a single group (i.e., treated M. peachi and M. pusillus as synonymous) found a significant differences between this group and the specimens of M. mitchelli (see SOM S1, S4 and S5). This Middle Devonian group also differed significantly from specimens of Cheiracanthus (Uncorrected p-value = 7.96E−20; Bonferonni corrected p-value = 2.65E−20).
The bivariate and multivariate analysis were carried out following a more general study of the anatomical features of the specimens that included investigation of the morphology of the scales and fin spines. These anatomical investigations yielded no clear distinguishing characters as all three species of Mesacanthus were found to share the same scale and spine morphology. The scales were found to be tightly packed and diamond shaped along the full length of the body with only subtle change in dimensions occurring between various sections. Investigations with a light microscope revealed no ornamentation was present on the scales of any specimens of Mesacanthus and thus this type of acanthodian character cannot be used here to make any further discrimination between specimens. However, in the future, more sophisticated techniques such as SEM imaging may yield new information the scale and spine structure that may help better split or group together different taxa within Acanthodii, including Mesacanthus species.
However, as this study found no anatomical differences between specimens other than those which were recovered from the bivariate analyses of bodily dimensions, the results of the multivariate analysis must also be taken into consideration when discussing the validity of the taxa looked at in this study. Given that no evidence was found in any of the studies (morphological and morphometric) for the existence of two distinct Middle Devonian groups within the specimens, the current taxonomic distinctions within Mesacanthus should be reviewed.
Seeing as the name M. pusillus was in use first (Agassiz, 1844–1845) it must take priority over M. peachi. Egerton (1861) gave the only description which tried to diagnose and differentiate between the two species from the Middle Old Red Sandstone, and this was primarily focused around a perceived level of ‘robustness’. Given that this is currently the only proposed discriminating character, and that no evidence has been found to support such a distinction, the species M. peachi must be provisionally regarded as invalid, on the grounds that the taxa was erected after M. pusillus. This makes M. peachi a junior subjective synonym of M. pusillus. On the other hand, evidence was found for the Lower Old Red Sandstone species, M. mitchelli, being less robust than specimens from the Middle Old Red Sandstone. The subsequent multivariate analyses also recovered a significant difference between the specimens from the Lower Old Red Sandstone and the Middle Old Red Sandstone. This partially supports the claim made by Egerton (1861) that some Middle Old Red Sandstone specimens (those that he called M. peachi) were ‘more robust’ than M. mitchelli. Despite the fact that Egerton (1861) was describing M. peachi and not M. pusillus when he gave that diagnosis, and also went on the try and discriminate between the two Middle Old Red Sandstone taxa using the same character, the fact that the chosen discriminating character has been shown to not be sufficient and that no other differences could be found between the specimens from the Middle Old Red Sandstone either, it must be concluded that all specimens from the Middle Old Red Sandstone should be regarded as belonging to one species, M. pusillus. From this evidence, it seems reasonable to retain the names M. mitchelli and M. pusillus for specimens from the Lower Old Red Sandstone and Middle Old Red Sandstone respectively. Further investigation of these taxa may yield more differences in their anatomy but provisionally this study diagnosis them using the same character as Egerton (1861), that is, M. mitchelli has a greater length to width ratio than M. pusillus.
The holotype of M. mitchelli (NHMUK PV P560) was studied first hand by the author and data taken from it was used in the analyses of this investigation. The current whereabouts of the holotype specimens of M. peachi and M. pusillus, however, remain uncertain, despite an exhaustive search of the literature and collections. Andrews (1982) regarded the syntypes of M. pusillus lost but also went on to state that certain specimens in the collections of the Royal Ontario Museum and in the Elgin Museum could possibly be the counterparts to the syntype material. This investigation and has identified two specimens in the collection of the Royal Ontario Museum and one specimens in the Elgin Museum that could be the missing syntype material (or the counterpart of it) of M. pusillus. Agassiz (1844–1845, pl. 28, Figs. 8–10) figured three specimens when describing Acanthodes pusillus and two of these figured specimens, although the figures are not very clear, closely resemble specimens ROM 25872, ROM 25846 and ELGNM 1978.191.1 (see SOM S7). It could be possible that ELGNM 1978.191.1 represents the counterpart to the holotype, as was also proposed by Andrews (1982). However, due to a lack of clarity on which specimen is which, as well as the high level of deformation in the specimens, these were not used in the analyses carried out in this study. The holotype of M. peachi is also not currently accounted for Egerton (1861) provided a figure with his original description of the species (although he did not state explicitly that the figured specimen is the holotype) and this figure has been used to try and identify the holotype specimen in this study (Egerton, 1861, pl. 6, Fig. 1). The figure SOM S6 shows specimen GSM 21448 from the collections of the British Geological Survey, which appears to be the specimen that Egerton (1861) figured in his original description. However, Egerton (1861) did not state explicitly that the specimen figured in the original description was the holotype and so it is impossible to say from the current information available whether or not GSM 21448 is the holotype or not. In the future it may prove to be necessary to designate a neotype from the current material. However, this study will not designate a neotype at this time in order to avoid future taxonomic confusion should the holotype ever remerge.
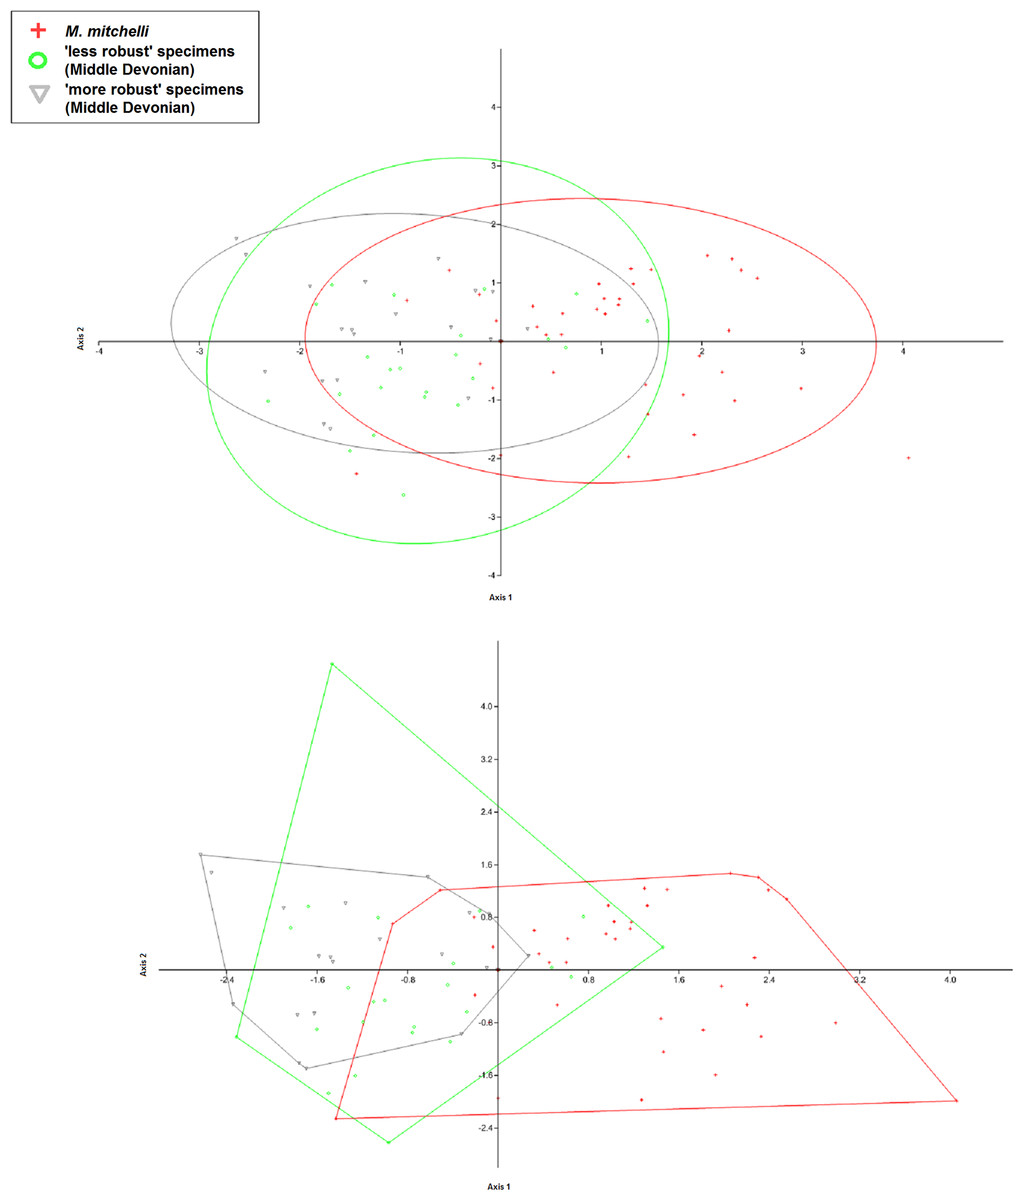
Figure 9: CVA scatter produced when previous specific identifications are disregarded and the specimens regrouped based upon L/W ratio and age only.
The figure shows the CVA scatter produced when the specimens were grouped using age and ‘robustness’ only. This was done in order to determine if the chracter of ‘robustness’ as first described by Egerton (1861) could be used to group the specimens, especially those from the Middle Devonian, that then could be shown to differ significant from one another in terms of the other measurments taken in this study using multivariate analyses. As in Figs. 3A and 3B, there is a greater amount of overlap between the 2 different groups from the Middle Devonian than there is between those groups and the group from the Lower Devonian, with Middle Devonian specimens again plotting in the negative portion of Axis 2 and the Lower Devonian specimens plotting predominantly in the positive portion of Axis 2. As only 1 species is reported fom the Lower Devonian, these specimens are still listed here as M. mitchelli. The fact that even Middle Devonian groups that are artificially created using the only specifically differentiating character currently given in the literature do not appear differ significantly from another shows that there is not enough evidence for 2 distinct species of Mesacanthus in the Middle Old Red Sandstone. The confusion matrix produced in this analysis as well as the uncorrected and Bonferonni corrected Hotelling’s p-values are shown in Table 5.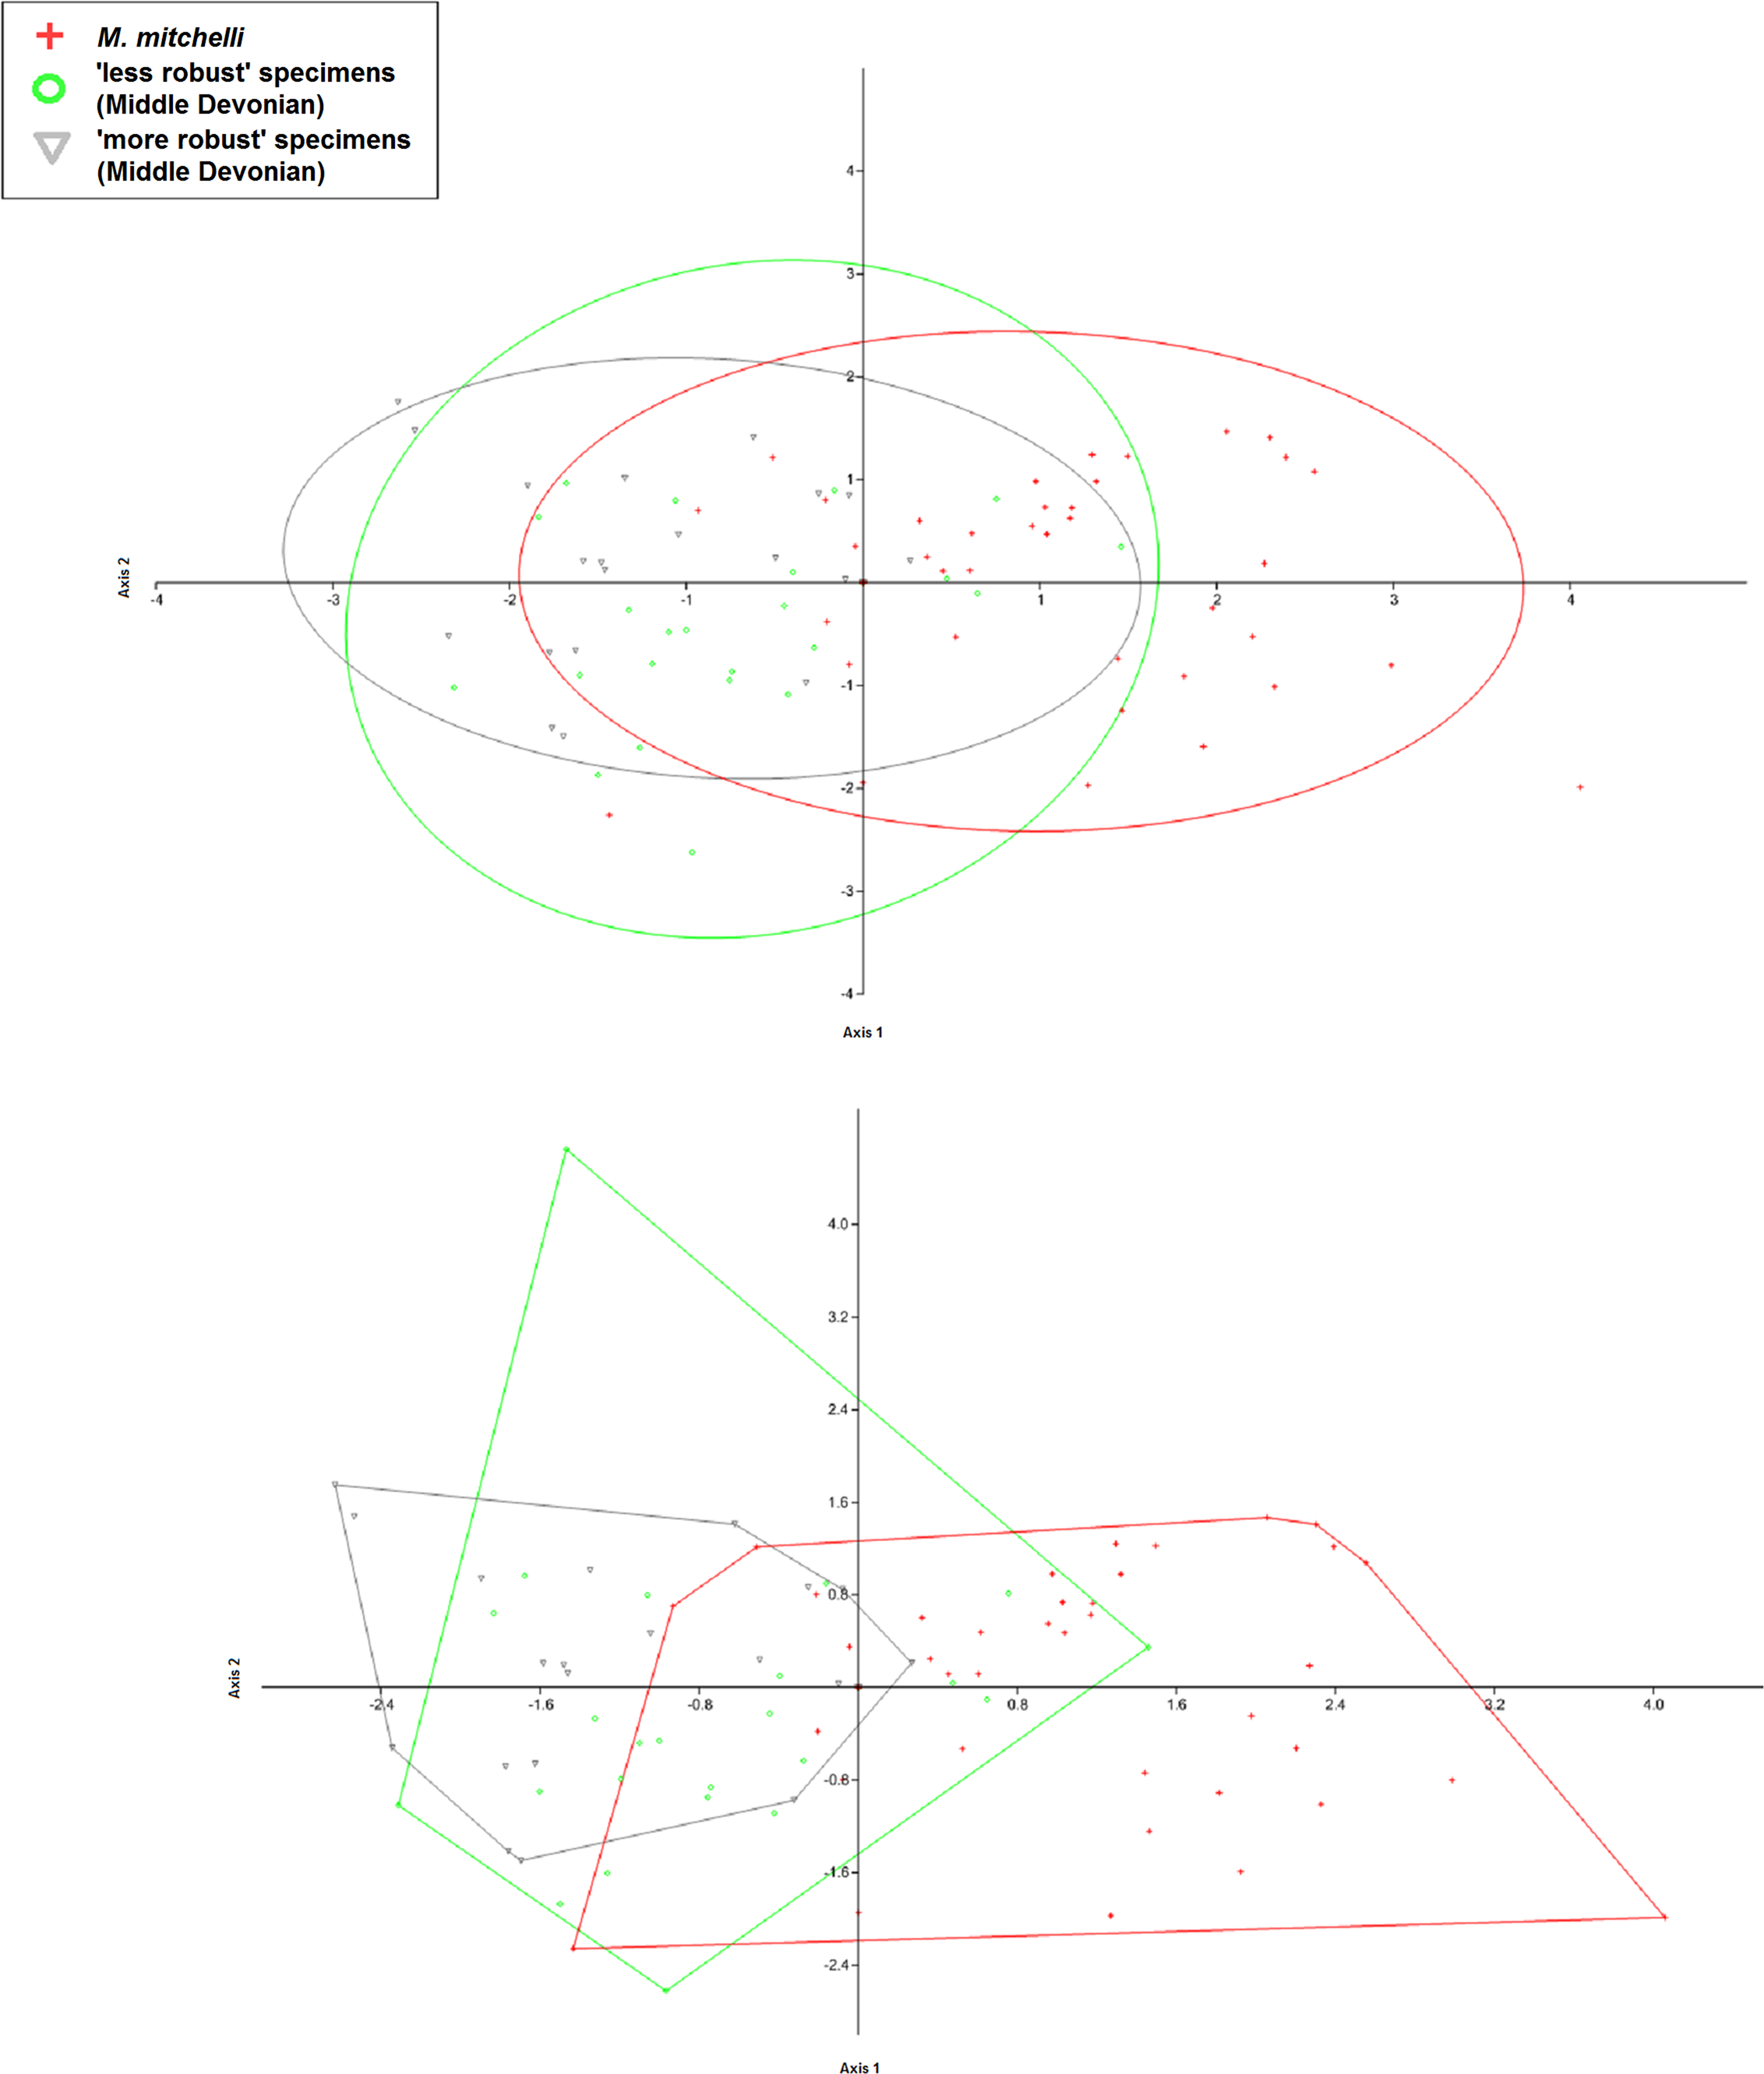
Conclusions
We conclude that the genus Mesacanthus contains 2 valid species from in the Orcadian Basin and Midland Valley areas of Scotland and that those species are M. mitchelli and M. pusillus. The two distinct species come from different times in the region’s history, one from the Lower Devonian and one from the Middle Devonian. This study has found that Mesacanthus mitchelli, from the Lower Devonian, has a lower width to length ratio (is less robust) than Mesacanthus pusillus, from the Middle Devonian. This study has also concludes that M. pusillus should provisionally be considered the only valid species name for specimens from the Middle Devonian, as no evidence was found for a second, distinct Middle Devonian species, M. peachi, as was originally stated by Egerton (1861).
Supplemental Information
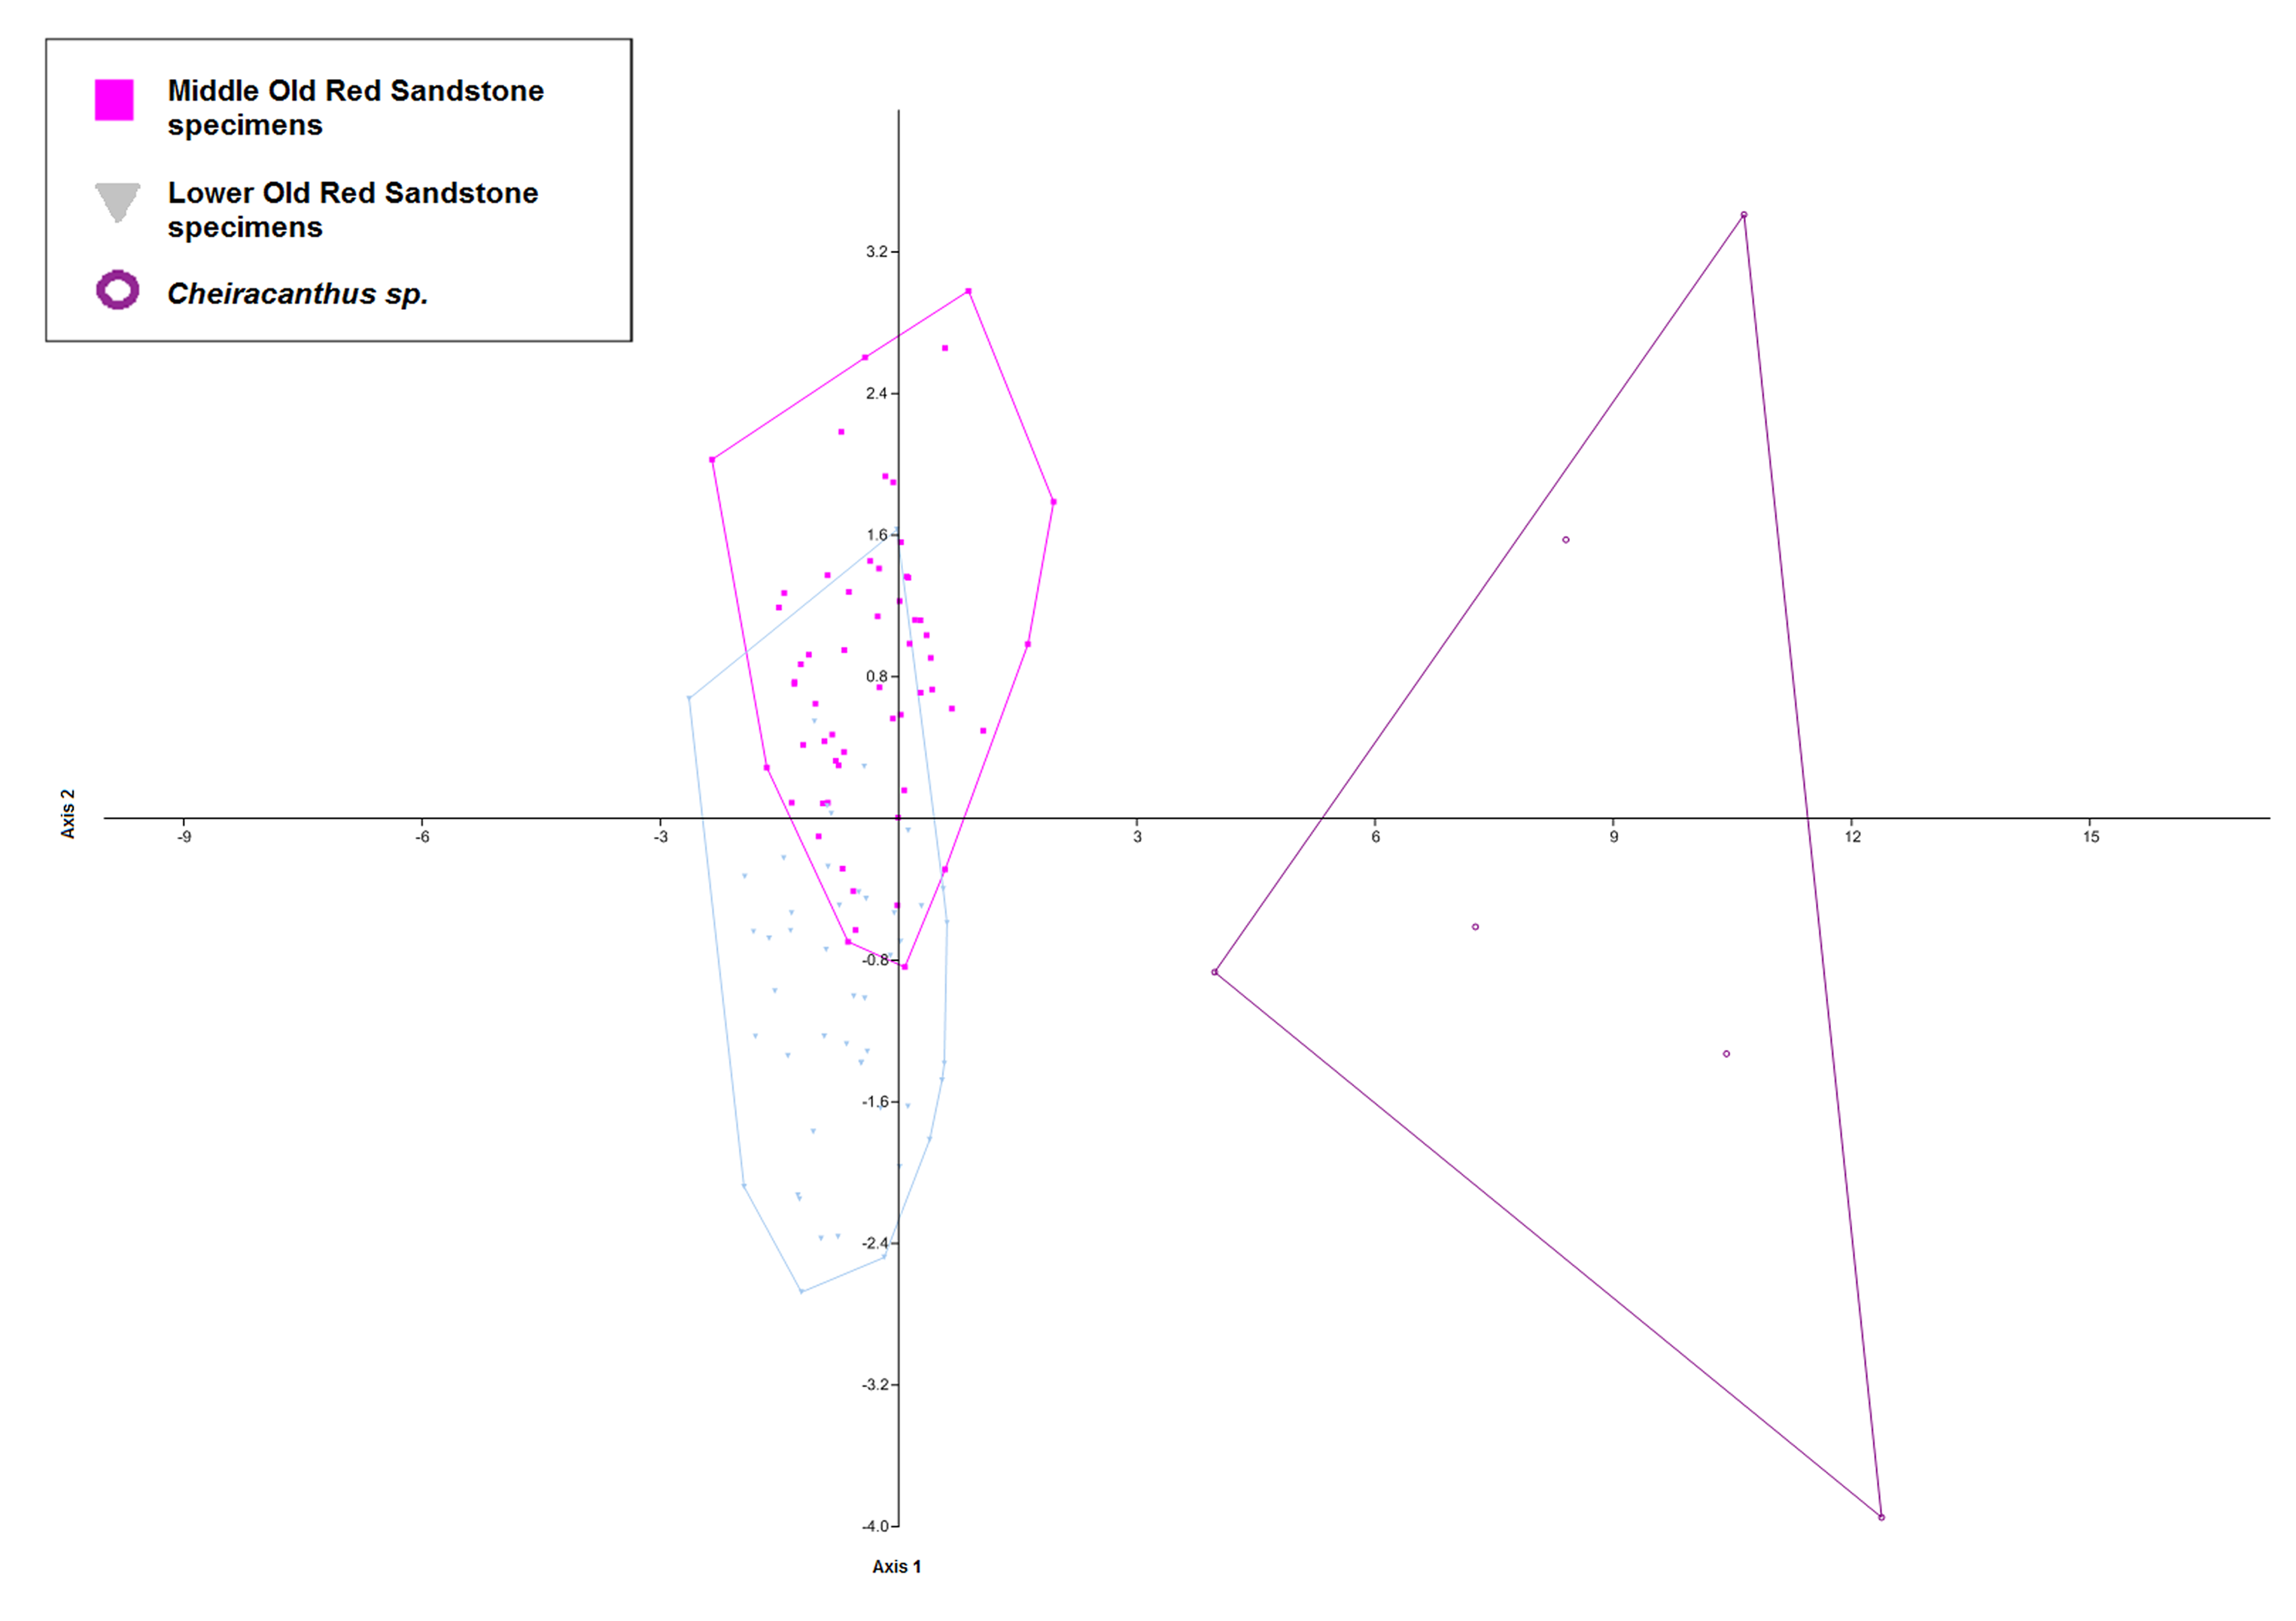
PCA scatters for specimens from the Lower Old Red Sandstone and Middle Old Red Sandstone with convex hulls (above) and 95% confidence ellipses (below)
The figure shows the large amount of ovelap between specimens from the Middle Devonian (pink squares) and Lower Devonian (grey inverted triangles) recovered by the PCA. Specimens from the Middle Devonian occupy a greater range of positions within the morphospace but oveall do not differ drastically from the specimens from the Lower Devonian in this analysis.
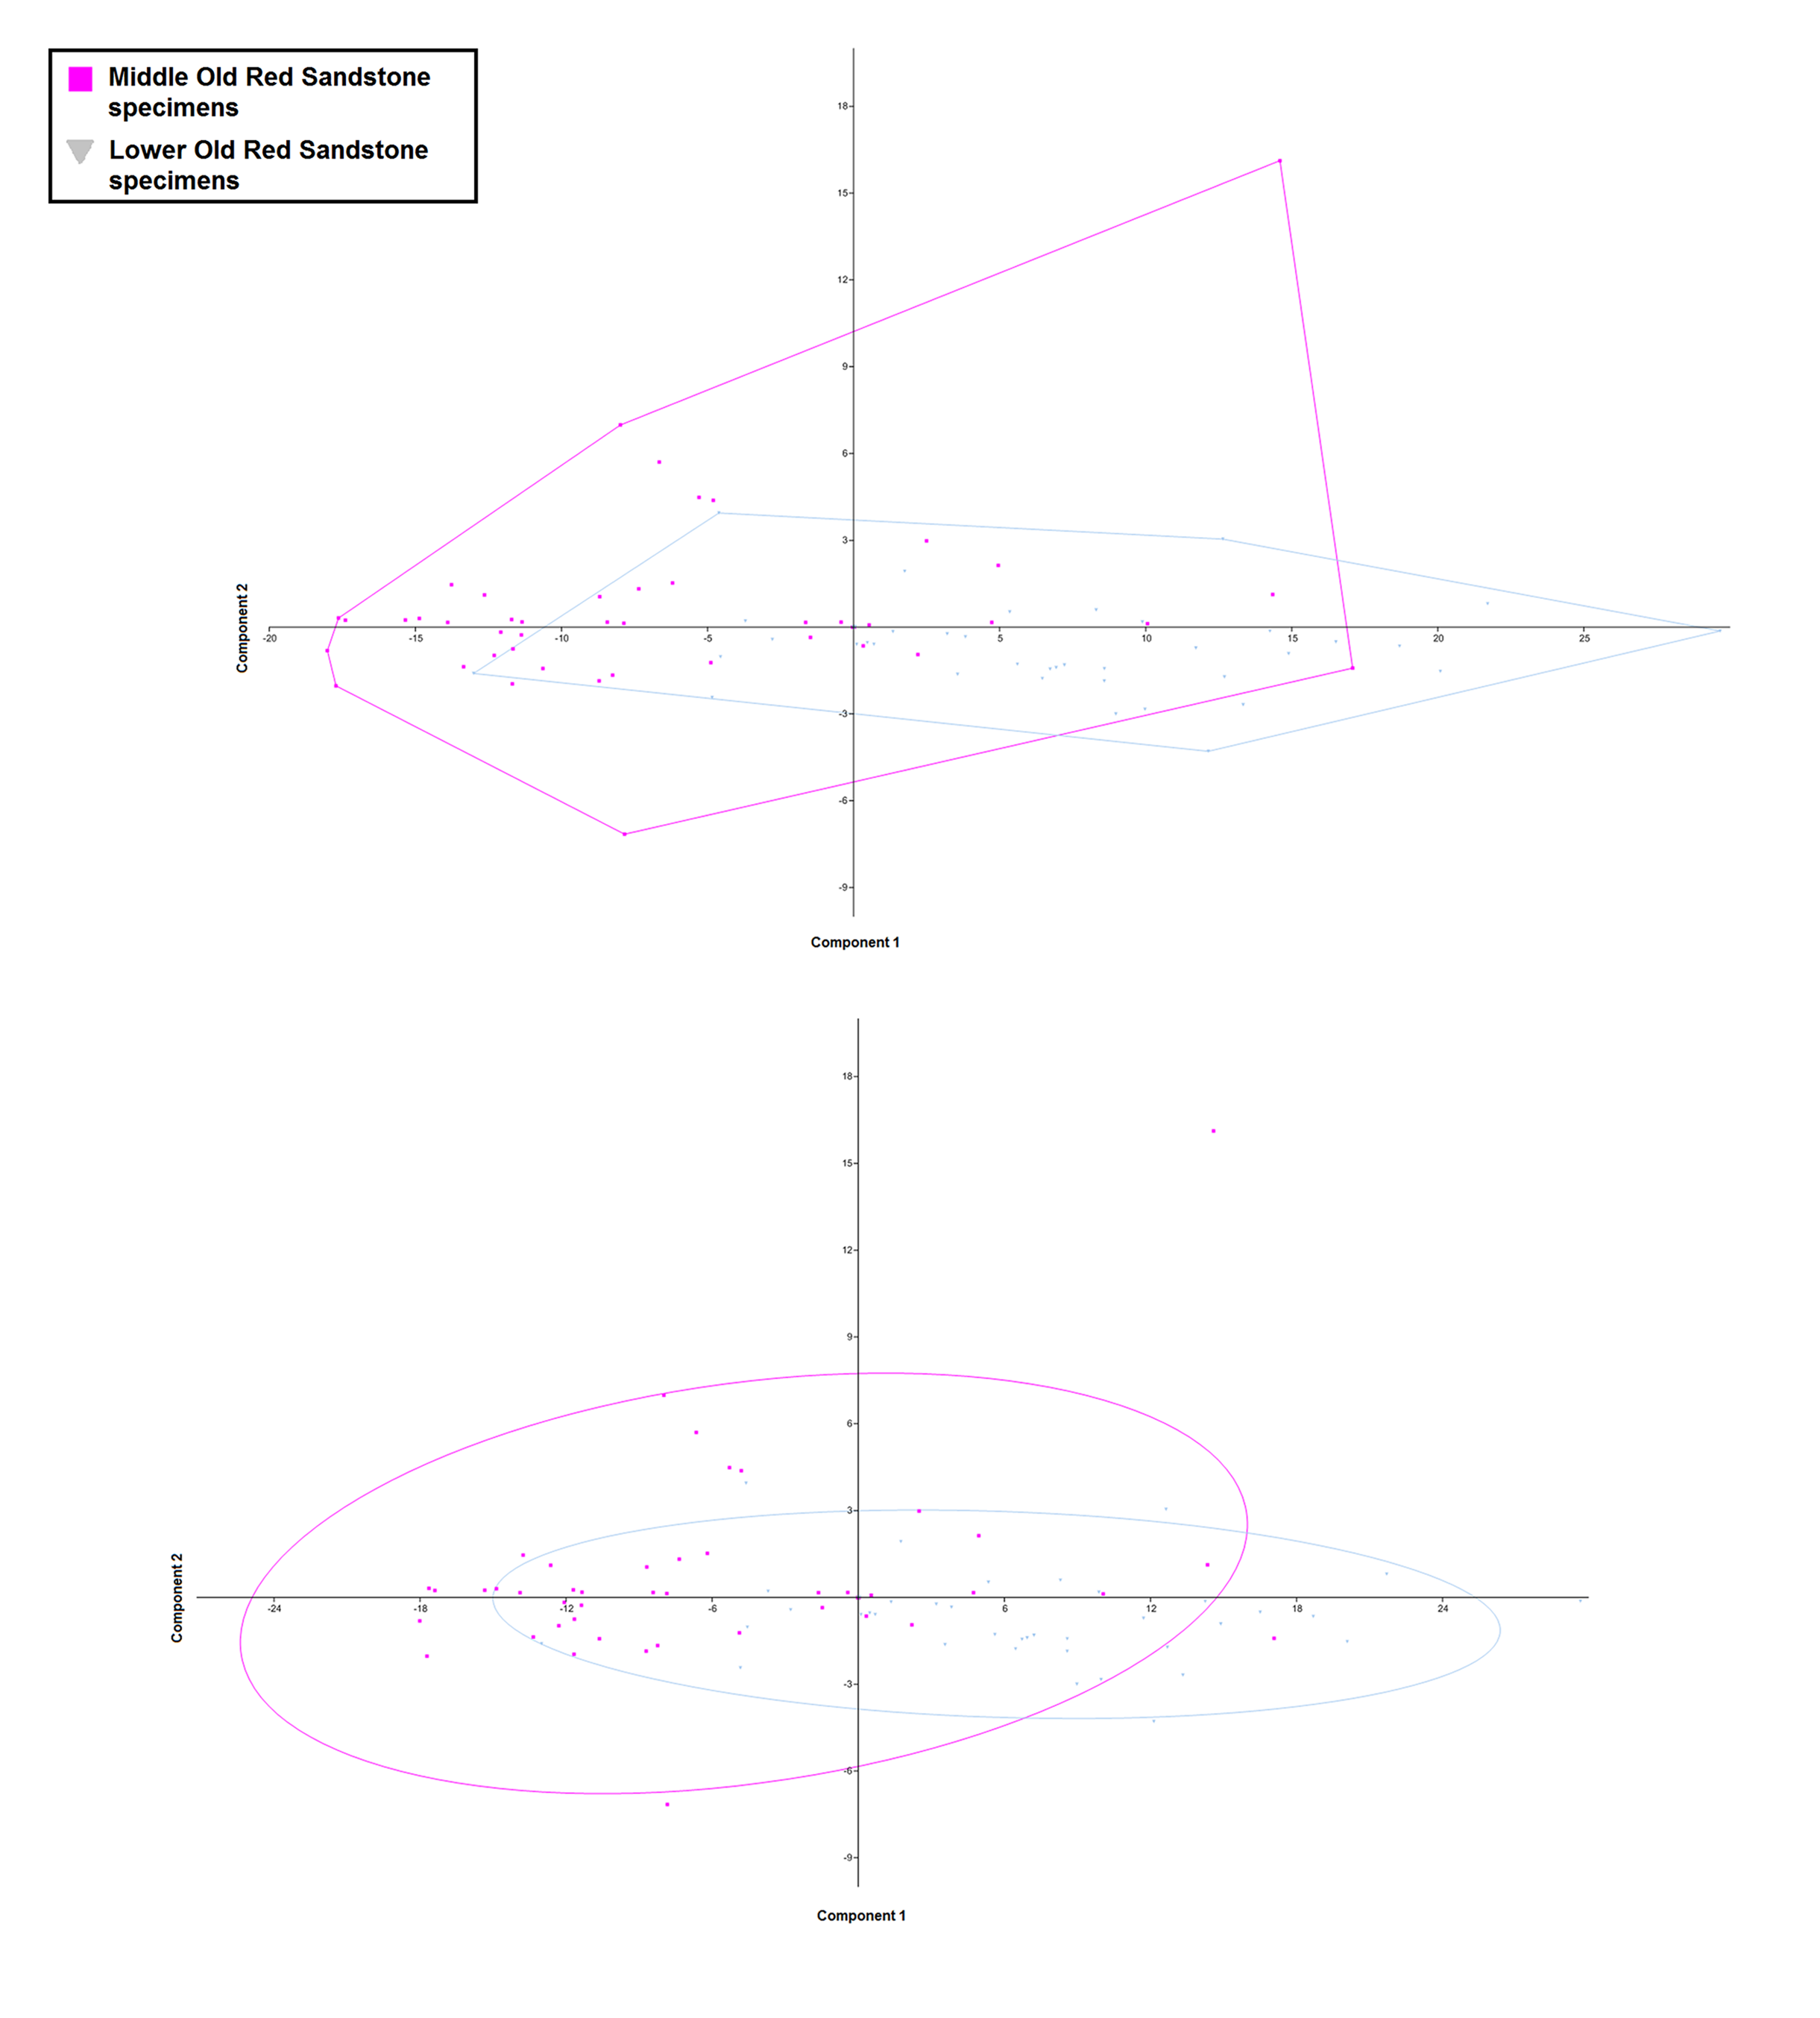
PCA scatter for Middle Old Red Sandstone species of Mesacanthus with convex hulls
The PCA scatter shows the morphospace occupied by the 2 Middle Devonian species M. peachi and M. pusillus. As in Fig. 6, there is a large amount of overlap beween the 2 groups in this particular analysis with all but one specimen (NHMUK PV P3578b) of M. pusillus falling within the same space as the specimens of M. peachi.
PCA scatter for Mesacanthus and Cheiracanthus
As in Fig. 4, this figure shows how this analysis produced a great degree of sepeartionbetween specimens of Mesacanthus and Cheiracanthus. Again, this lends evidence to thestrength of this method and its potential for use in future studies of other similar taxa.
CVA scatter for Cheiracanthus and Middle Old Red Sandstone and Lower Old Red Sandstone specimens of Mesacanthus with convex hulls
The figure shows the CVA scatter that is produced when the specimens of Mesacanthus are divided into 2 groups (Middle Devonian specimens and Lower Devonian specimens) and analysed alongside specimens ofCheiracanthus. The confusion matrix produced in this analysis and the uncorrected and Bonferonni corrected Hotelling’s p-values are shown in Table 6.
Confusion matrix and uncorrected and Bonferonni corrected p-values for analyses between specimens of Cheiracanthus and Middle Devonian and Lower Devonian Mesacanthus specimens
The confusion matrix shows the relatively low amount of confusion between specimens from the 3 groups in this particular analysis. The uncorrected and Bonferroni corrected Hotelling’s p-values show how each of these groups was found to be significantly different from the others. This is important because this shows that when M. peachi and M. pusillus are synonymised the single taxon is found to still be significantly different from other acanthodian taxa. Red = not significant; Green = significant.
Possible holotype specimen for Mesacanthus peachi
(A) Figure from Egerton (1861, pl. 6 Fig. 1) which is the only figure given with the original description of M. peachi. (B) Specimen GSM 21448, which is very likely the specimen figured by Egerton (1861) despite the disparity in the size of the slab it appears on and of the slab depicted in the illustration. Scale bar = 20 mm.
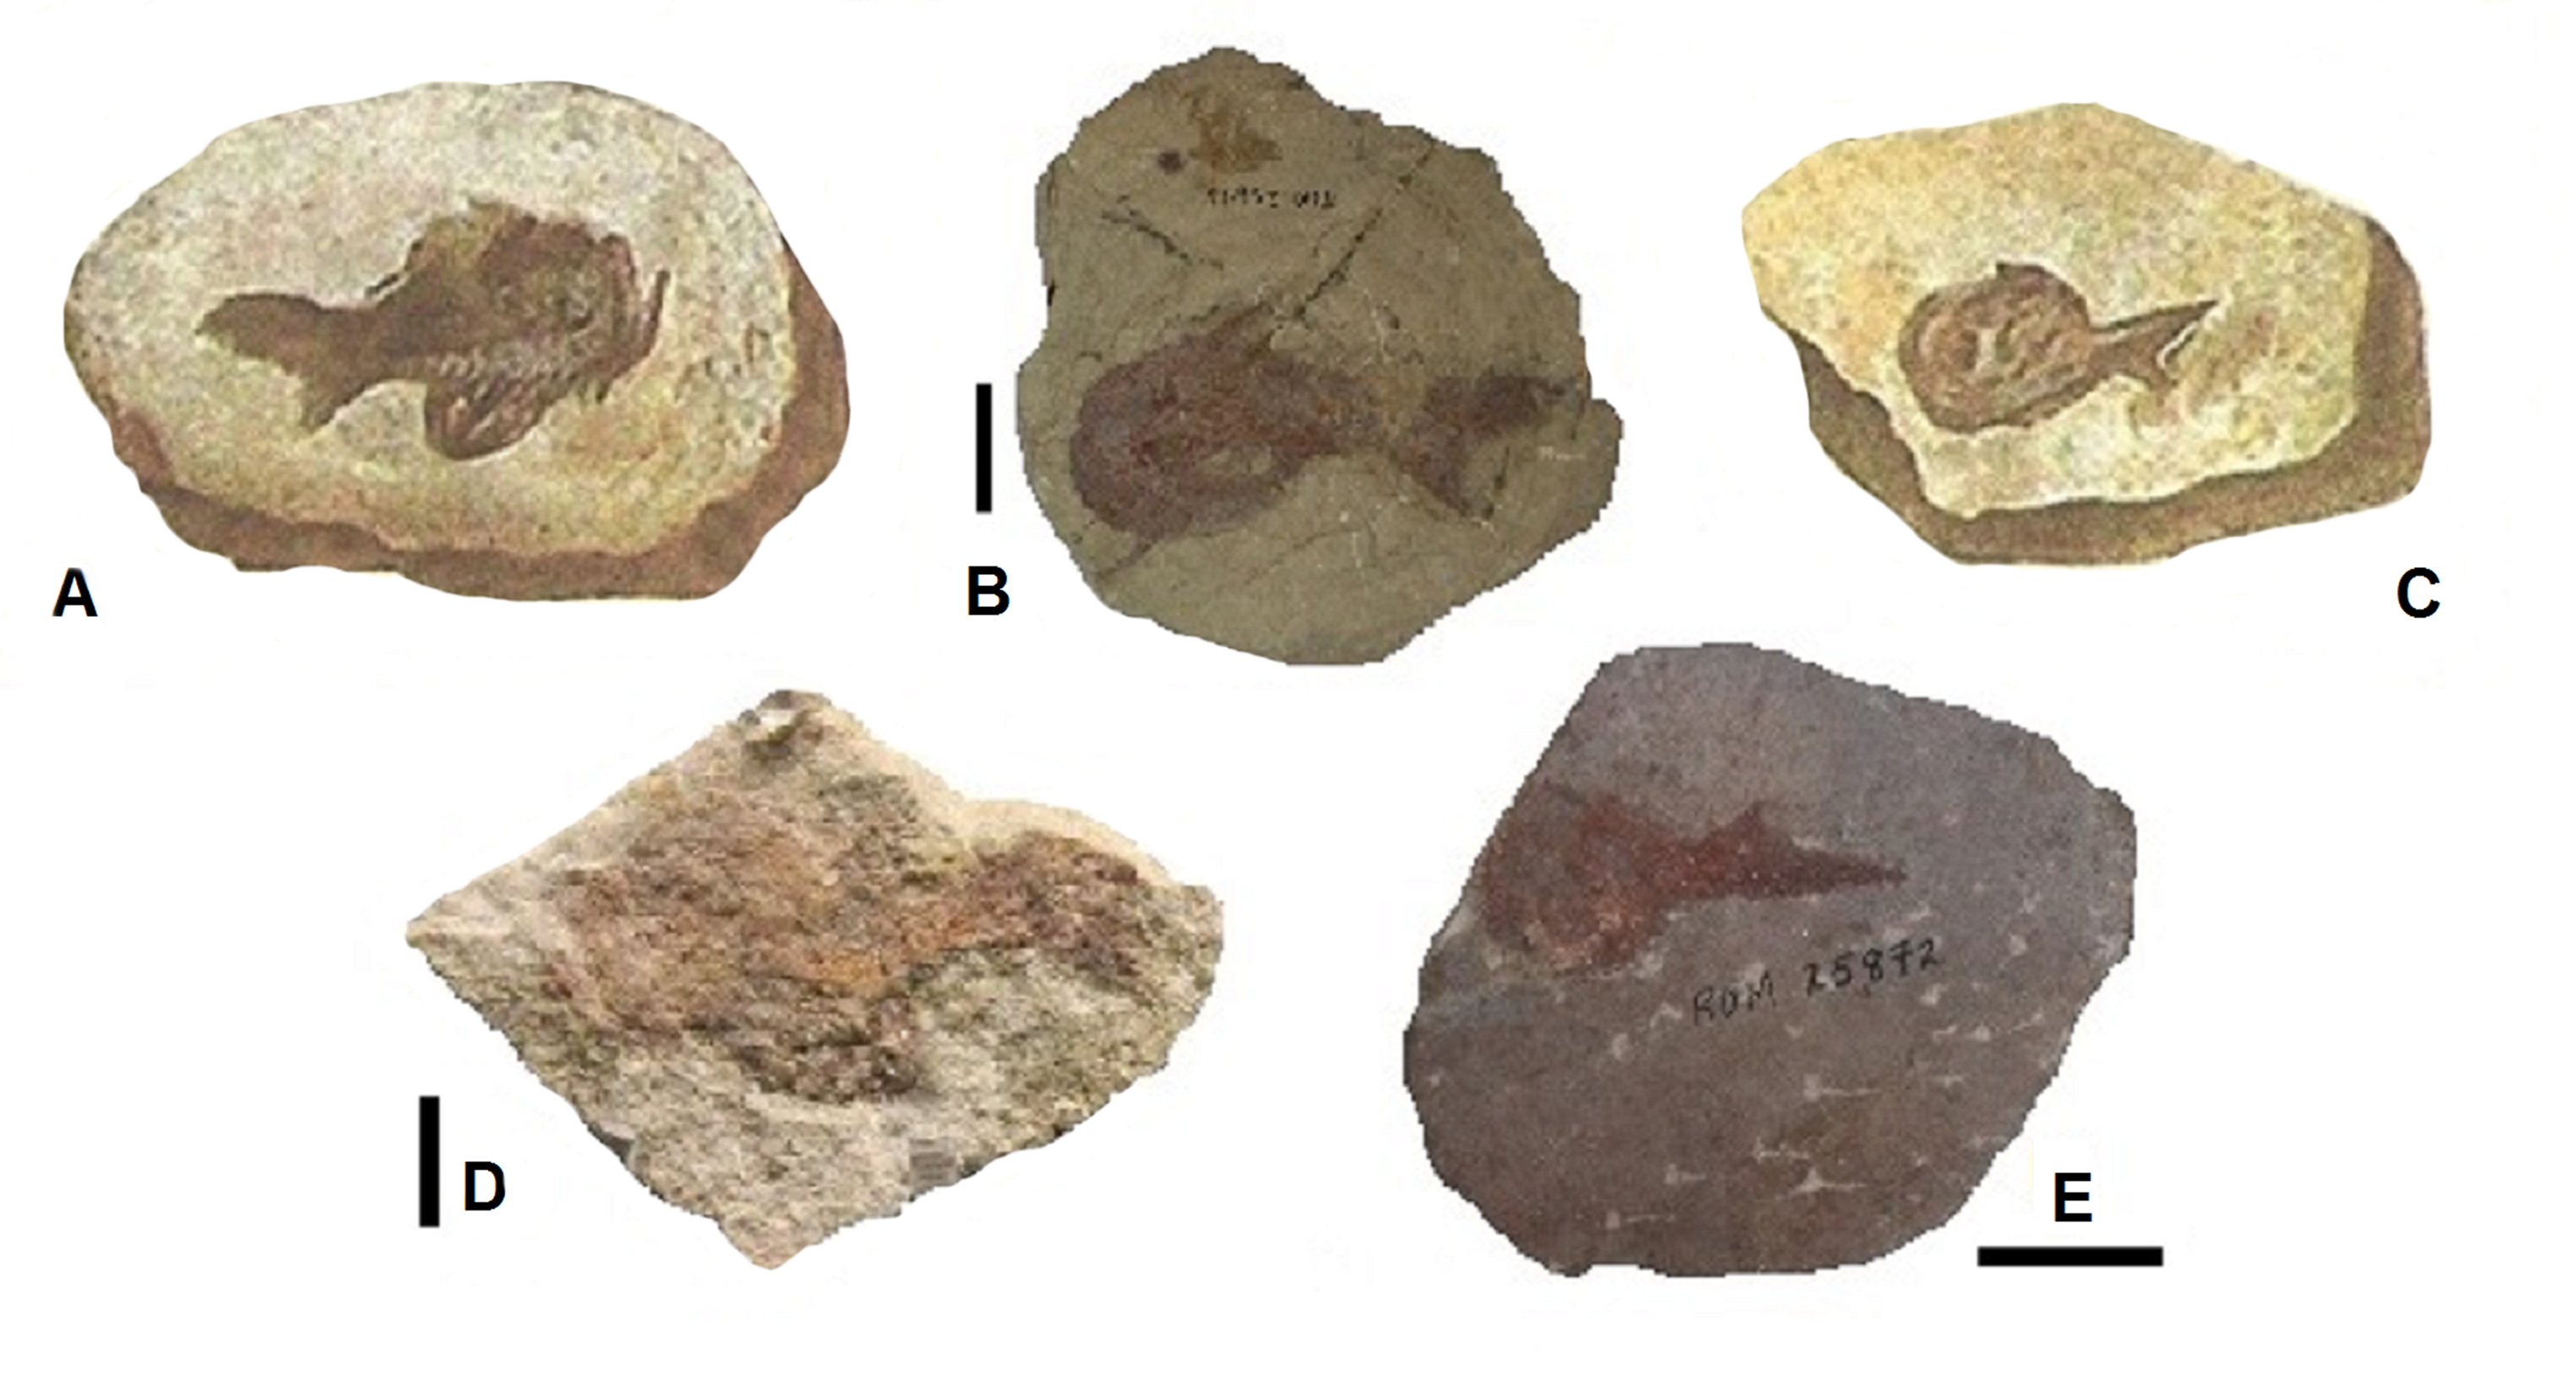
Possible holotype material for Mesacanthus pusillus
(A) One of three figures given by Agassiz (1844–1845, pl. 28, Figs. 8–10) with the original description of M. pusillus. (B) Specimen ROM 25846, which is possibly one of the specimens (or counterpart to) that was figured by Agassiz (1844–1845). (C) Another of the three figuresgiven by Agassiz (1844–1845). (D) Specimen ELGNM 1978.191.1, which could also be one of the specimens (or counter part to) that was figured by Agassiz (1844–1845). (E) Specimen ROM 25872, which could also be one of the specimens (or counter part to) that was figured by Agassiz (1844–1845). Scale bar = 20mm.
Raw Data
The table records all of the measurements taken for each specimen looked at in this study.