
Screening and identification of differentially expressed long non-coding RNAs in multidrug-resistant tuberculosis
- Published
- Accepted
- Received
- Academic Editor
- Mario Alberto Flores-Valdez
- Subject Areas
- Biochemistry, Bioinformatics, Molecular Biology, Tuberculosis
- Keywords
- Long non-coding RNAs, Multidrug-resistant tuberculosis, Biomarkers, n335659, Serum
- Copyright
- © 2022 Zhao et al.
- Licence
- This is an open access article distributed under the terms of the Creative Commons Attribution License, which permits using, remixing, and building upon the work non-commercially, as long as it is properly attributed. For attribution, the original author(s), title, publication source (PeerJ) and either DOI or URL of the article must be cited.
- Cite this article
- 2022. Screening and identification of differentially expressed long non-coding RNAs in multidrug-resistant tuberculosis. PeerJ 10:e12776 https://doi.org/10.7717/peerj.12776
Abstract
Background
Efforts to eradicate tuberculosis are largely threatened by drug-resistant tuberculosis, particularly, multidrug-resistant tuberculosis (MDR-TB). Screening and identification potential biomarkers for MDR-TB is crucial to diagnose early and reduce the incidence of MDR-TB.
Methods
To screen the differentially expressed long non-coding RNAs in MDR-TB, the lncRNA and mRNA expression profiles in serum derived from healthy controls (HCs), individuals with MDR-TB and drug-sensitive tuberculosis (DS-TB) were analyzed by microarray assay and 10 lncRNAs were randomly selected for further validation by reverse transcription-quantitative real-time PCR(RT-qPCR). The biological functions of differentially expressed mRNAs as well as relationships between genes and signaling pathways were investigated using Gene Ontology (GO) and the Kyoto Encyclopedia of Genes and Genomes (KEGG), respectively.
Results
A total of 353 differentially expressed lncRNAs (312 upregulated) and 202 mRNAs (99 upregulated) were found in the MDR-TB group compared to HCs. And compared with the DS-TB group, 442 differentially expressed lncRNAs (115 upregulated) and 190 mRNAs (87 upregulated) were found in the MDR-TB group. The expression levels of lncRNA n335659 were found to differ significantly between each group by RT-qPCR. Compared with DS-TB group, the GO analysis showed that the differential mRNAs were mainly enriched in the processes associated with the detection of the chemical stimulus, the regulation of mRNA metabolic process and neutrophil activation in the MDR-TB group; the KEGG analysis indicated that the differential mRNAs between DS-TB and MDR-TB were mainly enriched in proteasome and Notch signaling pathway, which might reveal a fraction of the mechanism of MDR-TB. The discovery of the serum lncRNA n335659 might serve as a potential biomarker for MDR-TB and Notch signaling pathway provided a new clue for the investigation of the pathological mechanism of MDR-TB.
Introduction
Tuberculosis (TB) caused by infection with Mycobacterium tuberculosis (Mtb) remains a destructive disease. Despite its overwhelming toll on global health, yet to date, accessible approaches to prevent, diagnosis and treat are still insufficient. Efforts to eradicate TB are largely threatened by drug-resistant tuberculosis, particularly multidrug-resistant tuberculosis (MDR-TB). In the past five years, the number of confirmed cases of MDR-TB has almost doubled (Dheda et al., 2019). Ninety-five percent or more of MDR-TB did not result from secondary resistance which develops during therapy, but primary resistance that was due to infection with a drug-resistant strain (Dheda et al., 2017). Naturally, it is imperative to find one or more specific biomarkers and available technical means for diagnosing MDR-TB earlier and declining the incidence.
The most common diagnosis of MDR-TB relied on the detection of resistance to first-line antibacterial drugs in the causative agent which usually comes from the sample of sputum. However, accessing samples in children or sputum-scared patients can be a struggle, and drug susceptibility testing is the phenotypic culture-based approach, which is a time-consuming process. For over decades, the Xpert MTB/RIF based on genotypic testing can detect the resistance to rifampicin within two hours, but high costs and potential for false-negative results restrict its usage (Millard, Ugarte-Gil & Moore, 2015). To seek non-sputum-based tests and rapid tests for drug resistance is on the top list of tuberculosis diagnostics development (Walzl et al., 2018).
Long non-coding RNA (lncRNA) is longer than 200 nucleotides and does not translate into functional proteins. It is regulated differentially at different points of their biogenesis, maturation and degradation. Many lncRNAs are very similar to mRNAs, however, mRNAs localize very specifically to ribosomes in the cytoplasm, while lncRNA localization is much more varied like the chromatin, subnuclear domains, the nucleoplasm or the cytoplasm and the function of lncRNAs is associated with their unique subcellular localization patterns (Quinn & Chang, 2016; Chen, 2016). The majority of lncRNAs may not have appreciable functions, but some have been proven to act as scaffolds, decoys or signals and can act through genomic targeting, regulation in cis or trans, and antisense interference (Geisler & Coller, 2013). There is growing evidence that lncRNAs are widely expressed and take part in the genesis and development of many diseases (Statello et al., 2021), including tuberculosis (Wang et al., 2015). Here, the present study aimed to investigate the differential expression profiles of lncRNAs in serum among patients with MDR-TB (MDR-TBs), drug-sensitive TB(DS-TBs) and healthy controls (HCs) using lncRNA microarray, and some differently expressed genes (DEGs) that might exert a crucial effect in the pathological progression of MDR-TB were further verified by reverse transcription-quantitative real-time PCR(RT-qPCR).
Materials & Methods
Study participants
From Jun 2020 to Feb 2021, hospitalized patients who were diagnosed with tuberculosis were enrolled in the Henan Provincial Infectious Disease Hospital (Zhengzhou, China). All of them were HIV-negative adults (≥18 years old) and had no TB history. DS-TB patients were diagnosed based on positive bacterial culture with drug-sensitive strains. MDR-TB patients were diagnosed with a positive sputum culture and resistance to at least two drugs, isoniazid and rifampicin. Healthy control subjects came from physical examination donors with normal laboratory results and normal computed tomography chest films. The written consent was obtained from all participants.
Blood samples from 11 DS-TB patients, eight MDR-TB patients and 10 healthy control subjects were collected and serum were harvested by centrifugation at 400 g, 10 min and the supernatant were transferred and stored at –80 °C until use. Ethical approval was obtained from the ethics review board of the First Affiliated Hospital of Zhengzhou University (approval number:2020-KY-300).
lncRNA microarray profiling.
LncRNA profiling (four samples from each group) was detected using Affymetrix human transcriptome array 2.0 chips based on a standard protocol (Wang et al., 2014). In brief, total RNA in serum was extracted using a miRNeasy Mini Kit (Qiagen, Hilden, Germany) according to the manufacturer’s instructions and biotinylated cRNA were prepared according to the standard Affymetrix protocol (Expression Analysis Technical Manual, 2001, Affymetrix). Following fragmentation, cRNA were hybridized for 16 h at 48° C on GeneChip Hybridization Oven 645. GeneChips were washed and stained in the Affymetrix Fluidics Station 450. Then, GeneChips were scanned using the Hewlett-Packard GeneArray Scanner G3000 7G. Finally, raw data were normalized using the robust multiarray average expression measure algorithm. Differentially expressed lncRNAs and mRNAs with p values of < 0.05 and fold changes of > 1.2 using empirical Bayes-moderated t statistics were identified and presented by hierarchical clustering and a volcano plot (Tang et al., 2018).
RNA isolation and cDNA preparation
Total RNA from serum was extracted using TRIzol LS reagent (Invitrogen, USA). RNA concentration and purity were measured by NanoDrop Spectrophotometer ND-1000 (NanoDrop Technologies Wilmington, DE, USA). Only samples of high quality that OD260/OD280 ratios between 1.8 and 2.1 were accepted. Then, contaminating genomic DNA was removed and cDNA was synthesized using PrimeScript RT reagent kit with gDNA Eraser (TaKaRa, Japan). All the kits were used according to the manufacturers’ instructions.
RT-qPCR quantification
The selected lncRNAs were amplified according to the manufacturers’ instructions (TaKaRa, Japan). The primers were shown in Table 1 and U6 was used as house-keeping gene to normalized the data (Primer-F 5′-CGCTTCGGCAGCACATATAC-3′; Primer-R 5′-CGAATTTGCGTGTCATCCTT-3′). RT-qPCR amplification was carried out in the LightCycler® 480 Real-Time PCR System (Roche Diagnostics, Switzerland). All lncRNAs were measured in a blinded fashion. RNase-free water was used as a no-cDNA template control in each RT-qPCR run to ensure there were no any contamination. Each sample was run in triplicate, and the average Cq was calculated. The relative expression of each lncRNA was calculated using the 2-ΔΔCq method and normalized against internal controls (Hu et al., 2020).
| Accession number | Database source | Chromosome | Primer-F | Primer-R |
|---|---|---|---|---|
| ENST00000423194 | ENSEMBL | chr7 | 5′-GGAGGTCTCGGCTCCTCAT-3′ | 5′-AATGACGAGCTGGTCAAGGTG-3′ |
| ENST00000433071 | ENSEMBL | chr21 | 5′-GCTGCCTGTCATCTCGCATA-3′ | 5′-CGCGTTCTCCACAACCTCC-3′ |
| ENST00000522292 | ENSEMBL | chr5 | 5′-AAATTGAGATTCGGAGACAGGA-3′ | 5′-TCACAGGCCATCCGTTGAG-3′ |
| ENST00000410137 | ENSEMBL | chr1 | 5′-CTGGCTAACTAGCTGGGTTCC-3′ | 5′-GCAAGGGAGCACTGCTACAC-3′ |
| n335659 | NONCODE | chr17 | 5′-GACAGCGGCATGAACATGAC-3′ | 5′-GCACCACGACAAGGCATTA-3′ |
| n339260 | NONCODE | chr16 | 5′-TAGCTAGAGGCCAGGCTGTGT-3′ | 5′-AAGCCTTCCATGCCAGTGTG-3′ |
| n335632 | NONCODE | chr1 | 5′-AGGAACTAGAGTGCCGTATCATC-3′ | 5′-AGGAAAATTCCAGTCTGCTTGT-3′ |
| n332362 | NONCODE | chr2 | 5′-CACGGCCTTCGTCTGGTTC-3′ | 5′-ACATGAGCAGCCCCAACAG-3′ |
| n338679 | NONCODE | chr2 | 5′-CAGGTTTGTGGGGAGTAGGA-3′ | 5′-AATGTGGCCAGAGATGGAGA-3′ |
| ENST00000453111 | ENSEMBL | chr1 | 5′-TCCTCCAGAATGGCAACAGC-3′ | 5′-TGGCTCTCTCAGAGGGTTGC-3′ |
GO and KEGG analysis
Gene Ontology (GO) knowledgebase (http://www.geneontology.org/) allows for the annotation in the terms of biological process (BP), cellular component (CC) and molecular function (MF). The enriched functions and pathways of differentially expressed mRNAs were analyzed by GO and the Kyoto Encyclopedia of Genes and Genomes (KEGG).
Statistics analysis
Continuous variables were expressed as mean ± SD and categorical variables were reported as numbers. Student’s t-test was used to reveal the differential expression of the lncRNAs in the RT-qPCR analysis. All statistical tests were two-sided, and p < 0.05 was considered significantly. SPSS v20.0 and GraphPad Prism v5.0 were used to analyze and graph the results, respectively.
Results
Differentially expressed lncRNAs and mRNAs
Expression profiling studies were performed on the RNA from four independent serum samples in each group. The hierarchical cluster and volcano plot of differentially expressed lncRNAs and mRNAs among three groups were shown in Figs. 1A–1B, 1C–1D, respectively. Microarray analysis exhibited the differences of lncRNA and mRNA expression between chips.
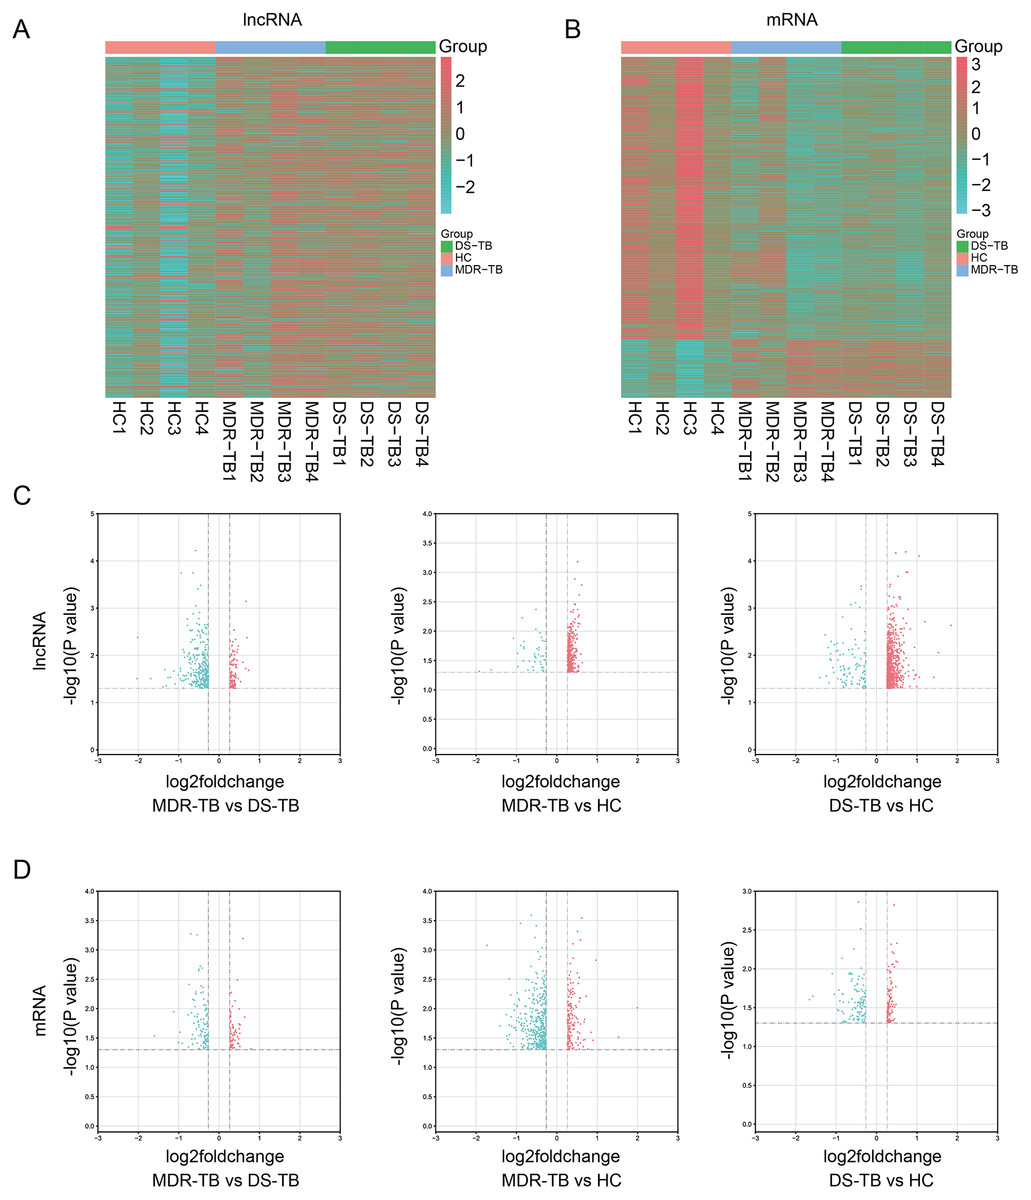
Figure 1: Heat maps and volcano maps of differentially expressed lncRNAs and mRNAs between the three groups.
Heat maps of differentially expressed lncRNAs (A) and mRNAs (B) among the three groups; volcano maps of differentially expressed lncRNAs (C) and mRNAs (D) between each group.
A total of 19,371 mRNAs and 20,474 lncRNAs were detected in the array. The results showed that there were 353 lncRNAs (312 upregulated) and 202 mRNAs (99 upregulated) in MDR-TB group and 904 lncRNAs (806 upregulated) and 563 mRNAs (164 upregulated) in DS-TB group were identified to be imbalanced compared to the HC groups. Coincidentally, compared with the HC group, there were 421 lncRNAs (351 upregulated) and 417 mRNAs (71 upregulated) that were found to be differentially expressed both in the MDR-TB group and DS-TB group. In addition, compared with the DS-TB group, 442 lncRNAs (115 upregulated) and 190 mRNAs (87 upregulated) were identified to be differentially expressed in the MDR-TB group. Collectively, these results indicated that molecular events in sera such as lncRNAs and mRNAs were altered in patients with MDR-TB and DS-TB.
To further investigate the detailed differences in lncRNAs between MDR-TB and DS-TB samples, we overlapped these using a Venn diagram (Fig. 2C and Excel S1). They exhibited relatively distinct expression panels: 244 and 738 genes were only up-regulated and expressed in MDR-TB and DS-TB, respectively; 28 and 85 genes were uniquely downregulated and expressed in MDR-TB and DS-TB, respectively. As for the differentially expressed mRNAs, the results were shown in Fig. 2D.
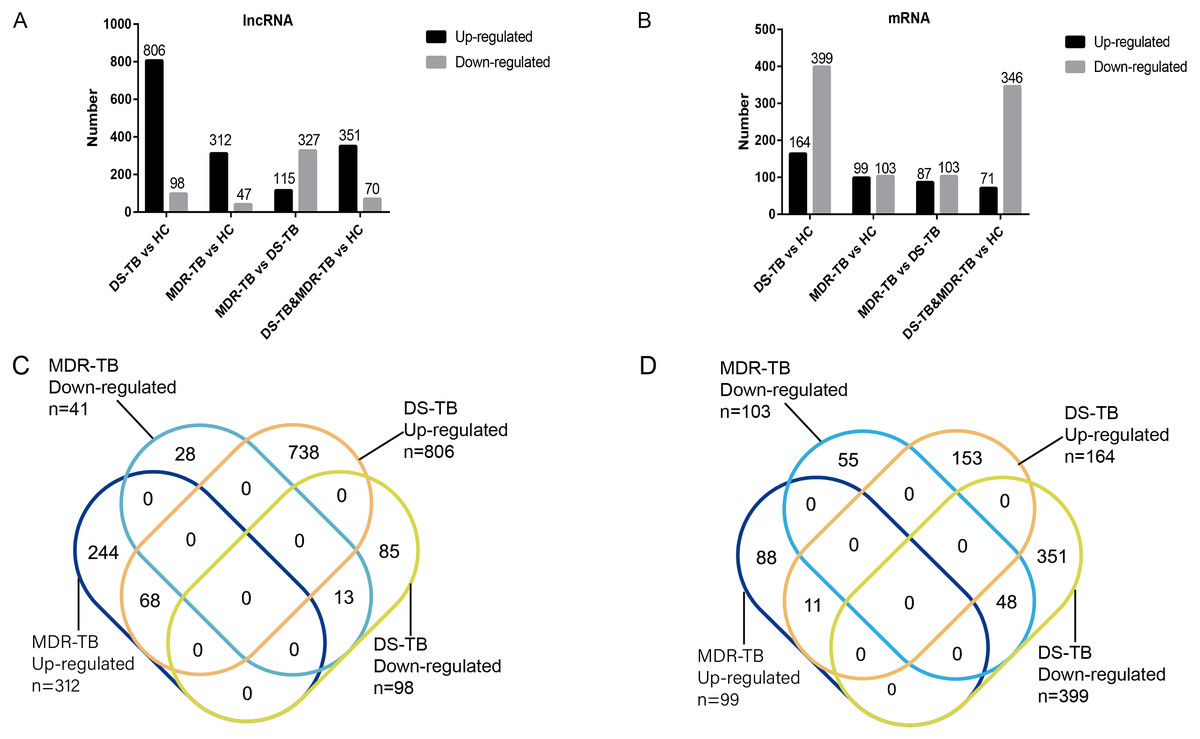
Figure 2: Number of upregulated and downregulated lncRNAs (A, C) and mRNAs (B, D) in the three groups.
lncRNA, long non-coding RNA; HC, healthy control; MDR-TB, multidrug-resistant tuberculosis; DS-TB, drug-sensitive tuberculosis.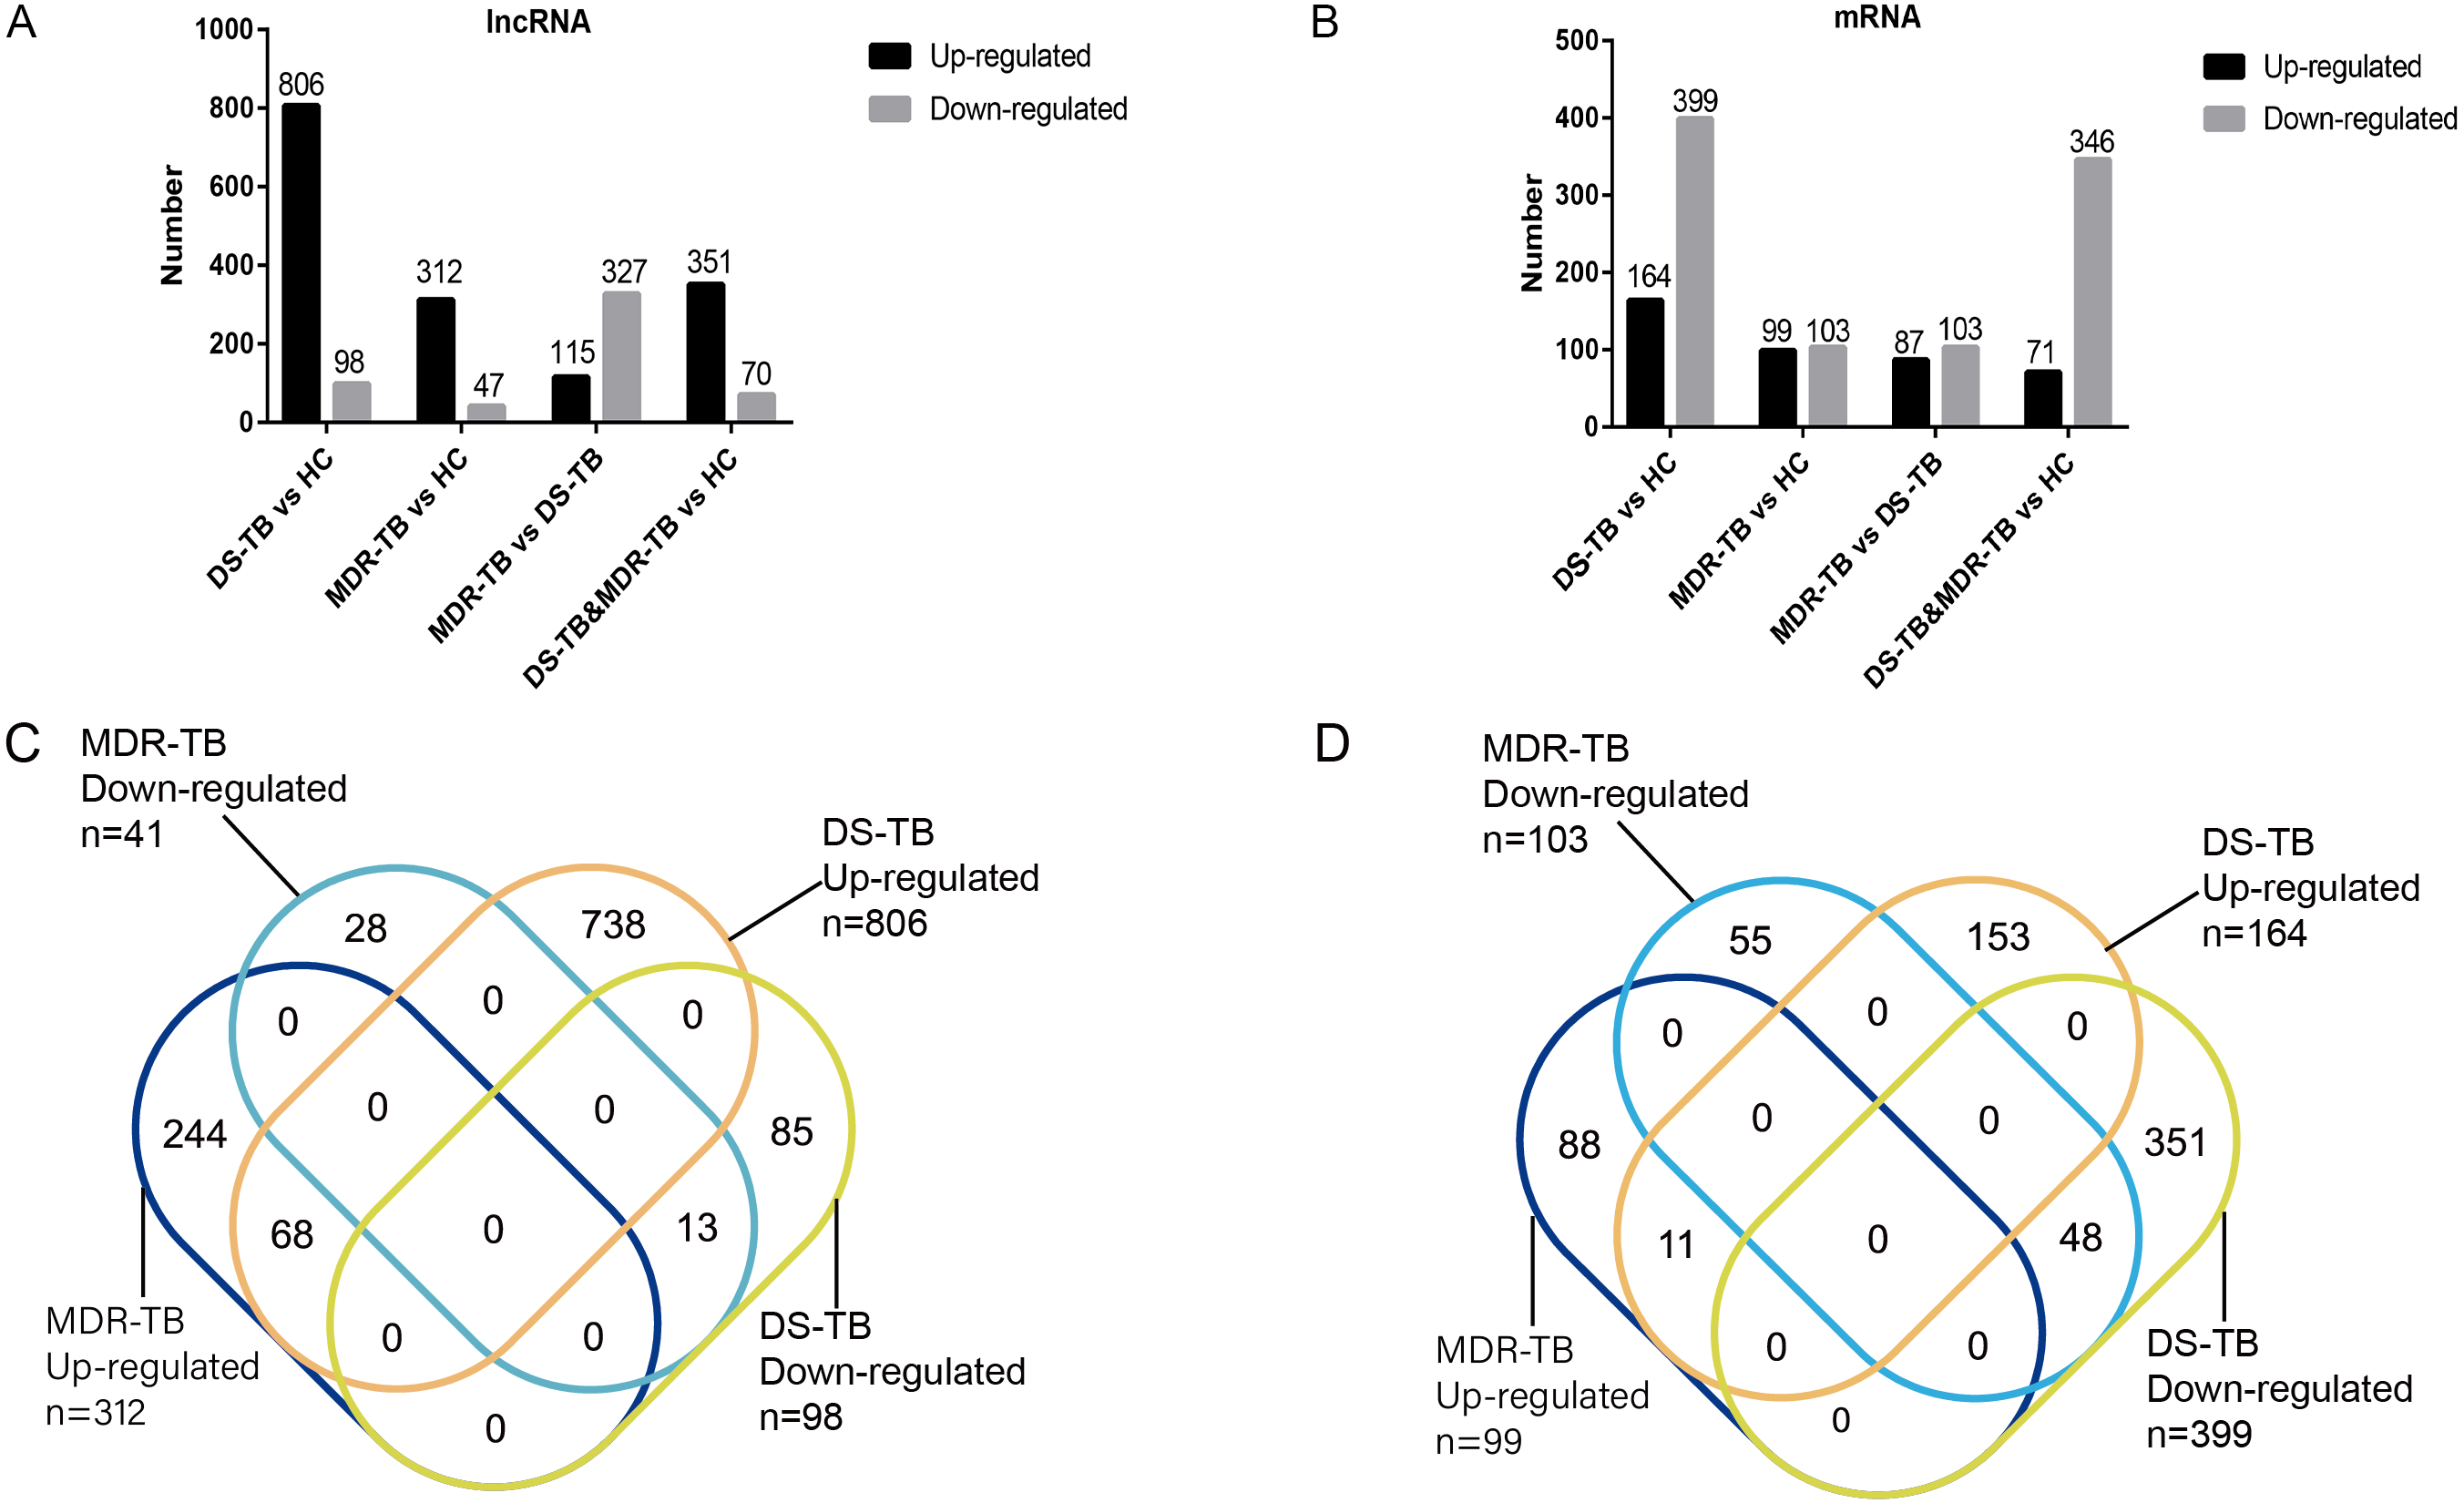
Validation of microarray results by RT-qPCR
Ten DEGs were screened out according to their expression trend and the length of lncRNA as well as abundance in the sample among three groups for further RT-qPCR verification: ENST00000423194, ENST00000433071, ENST00000522292, ENST00000410137, n335659, n339260, n335632, n332362, n338679 and ENST00000453111. The results were shown in Fig. 3. Compared with the HC group, ENST00000423194, n335659 and n332362 presented similar downward trend in the MDR-TB and DS-TB groups, but only one lncRNA, n335659, was statistically significant in each group. For distinguishing MDR-TB from DS-TB, ENST00000522292, n335659 and n338679 exhibited the potential to be used as biomarkers.

Figure 3: Confirmation of lncRNA expression by RT-qPCR.
Mean ± SD and average expression value for each lncRNA were presented for statistics. One-way ANOVA test for the three groups or Student’s t-test for two groups was used for statistical analysis. A p-value of < 0.05 was regarded as statistically significant. lncRNA, long non-coding RNA; HC, healthy control; MDR-TB, multidrug-resistant tuberculosis; DS-TB, drug-sensitive tuberculosis; ANOVA, analysis of variance; RT-qPCR, real-time quantitative polymerase chain reaction.
GO and KEGG pathway analysis
The GO analysis results are shown in Figs. 4A and 4C. Compared with the DS-TB group, GO analysis showed that the downregulated mRNAs in the MDR-TB group were mainly enriched in the BP of detection of the chemical stimulus and neutrophil activity, the CC of vesicle lumen and the MF of olfactory receptor activity and lipopolysaccharide binding, which may be related to the mechanism of body’s stress reaction to drug-resistant bacteria; The upregulated mRNAs were mainly enriched in the BP associated with the regulation of mRNA metabolic process and in the MF of chromatin DNA binding and NADH dehydrogenase (ubiquinone) activity, which may suggest there was gene regulation imbalance in patients with MDR-TB. For KEGG analysis, compared with the DS-TB group, the differentially expressed mRNAs in the MDR-TB group were mainly enriched in the olfactory transduction, proteasome and Notch signaling pathway (Figs. 4B and 4D).

Figure 4: GO and KEGG pathway analysis of differentially expressed mRNAs.
The most significant GO terms for upregulated genes (A) and downregulated genes (C) in the MDR-TB group compared with the DS-TB group. The most significant pathways for upregulated genes (B) and downregulated genes (D) in the MDR-TB group compared with the DS-TB group. Abbreviations: MDR-TB, multidrug-resistant tuberculosis; DS-TB, drug-sensitive tuberculosis.
Discussion
This study was mainly conducted to compare the expression profiles of circulating serum lncRNAs from MDR-TBs, DS-TBs and HCs and explore their possible functions through bioinformatics analysis. In the discovery phase, multifarious lncRNAs and mRNAs in MDR-TBs and DS-TBs showed significant differences in expression relative to levels in HCs. In the validation phase, using RT-qPCR analysis to validate ten lncRNAs of sera from additional TB patients and healthy control subjects, we confirmed that lncRNA n335659 was differentially expressed in each group, which indicated lncRNA n335659 was potential biomarker for MDR-TB and involved in the occurrence and development of MDR-TB.
Increasing evidence has underscored the role of lncRNAs acting as biomarkers in the diagnosis and prognosis for tumor (He et al., 2019; Li et al., 2019; Liu et al., 2020). For the diagnosis of TB, Chen et al. (2017) revealed the potential value of differentially expressed lncRNAs (NR_038221, NR_003142, ENST00000570366 and ENST00000422183) in plasma of TB patients and identified that the area under the curve (AUC) of the combination of four lncRNAs was 0.845. When it comes to the monitoring effect of lncRNA on tuberculosis treatment, Li et al. (2020) suggested lncRNAs uc.48+ and NR_105053 in plasma may serve as potential biomarkers to distinguish between untreated TB patients and cured TB subjects, and the AUC of the combined uc.48+ and NR_105053 was 0.945. However, the diagnostic value of lncRNAs for MDR-TB has not yet been fully revealed. Yan et al. (2018) reported the differentially expressed lncRNAs in PBMCs in response to MDR-TB infection by microarray assay. In this study, ENST00000423194, n335659, and n332362 were found to be significantly down-regulated of expression levels in the DS-TB and MDR-TB groups compared with the HC group, which showed that these DEGs might be used as biomarkers for TB diagnosis. ENST00000522292, n335659 and n338679 were expressed differentially between the MDR-TB group and DS-TB group, which implied these DEGs might be participated in the development of MDR-TB and might be potential biomarker for distinguishing MDR-TB from DS-TB. Moreover, with the development of omics technology, previous studies have proved that serum proteins could also be considered as biomarkers for TB (Chen et al., 2020; Wang et al., 2016), such as sCD14, PGLYRP2 and FGA. As the protein is the ultimate executor of life activities and its expression in serum is very stable, it is necessary to combined lncRNAs and mRNA with these protein biomarkers for the further study.
Multidrug resistant in Mtb evolves through several mechanisms including compensatory evolution, epistasis, clonal interference, cell envelope impermeability, efflux pumps, drug degradation and modification, target mimicry and phenotypic drug tolerance (Singh et al., 2020). GO analysis and KEGG pathway analysis can provide insights into the potential functions of the differentially expressed mRNAs and improve our understanding the mechanism of the body’s stress reaction to drug-resistant bacteria. In the present study, most of the enriched upregulated and downregulated GO terms and pathway terms between the MDR-TB group and the DS-TB group were different, suggesting specific signaling pathways were involved in host immunity induced by drug-resistant Mtb.
In this study, compared with the DS-TB group, GO analysis showed that the downregulated mRNAs in the MDR-TB group were mainly enriched in the process of detection of the chemical stimulus and neutrophil activity. Neutrophils are recruited to the site of mycobacterial infection, after activation, neutrophils recruit other innate cells including monocytes and dendritic cells at infection sites through the release of chemokines and of antimicrobial peptides with chemotactic properties (Zhang et al., 2009). Martineau et al. (2007) demonstrated that neutrophils make a very significant contribution to innate resistance immunity to TB, which showed that neutrophils play a huge part in the clearing of Mtb. Therefore, it is reasonable to speculate that multidrug-resistance Mtb has enhanced capacity to circumvent killing by human neutrophils. Furthermore, it is well-known that various polysaccharides and glycolipids in the cell wall of the mycobacterial species serve significant roles in immune recognition (Guenin-Macé, Siméone & Demangel, 2009). Mannosylated lipoarabinomannan was identified in pathogenic Mtb, which serves as a modulator of the host immune system (Zhou et al., 2019), the pathogens had divergent effects on DC maturation and cytokine responses based on the amount and scaffold of mannose in lipoarabinomannans with diverse mannosylated structures (Zhang et al., 2019). Therefore, GO analysis revealed that lipopolysaccharide binding reduced in the MDR-TB group would provide a specific clue to investigate the mechanism of multi-drug resistance in TB patients.
The KEGG analysis indicated that the upregulated mRNAs in the MDR-TB group were associated in proteasome and Notch signaling pathway compared with DS-TB (Fig. 4B). We found that the up-regulated mRNA PSMD8 and PSMD6 in MDR-TB are the proteasome 26S subunit and PSMB6 encode the β subunits of the 20S proteasome. The previous studies showed that the 26S complex play a critical role in digesting ubiquitin conjugates (Coll-Martínez & Crosas, 2019) and the variations of PSMB6 in multiple myeloma was associated with its overall survival and time to progression (Lichter et al., 2012). The up-regulated mRNA of PSMD8, PSMD6 and PSMB6 in MDR-TB could be associated with the proteasome pathway and be related to the course of the disease. Notch signaling plays a vital role in Th1/Th2 imbalance in TB infection (Li et al., 2018) and Geffner L showed that patients with multidrug-resistant tuberculosis display impaired Th1 responses (Geffner et al., 2009), which suggested Notch signaling may participant in the development of MDR-TB through regulating the balance of Th1/Th2. In addition, previous studies have indicated that Notch signaling pathways played an important role in drug resistance in cancer and targeting the Notch pathway can prevent or reverse resistance through reduction or elimination of breast cancer stem cells (BeLow & Osipo, 2020); Furthermore, Notch signaling was activated in and contributed to resistance in enzalutamide-resistant prostate cancer cells (Farah et al., 2019) and targeting Notch signaling pathway would be as an effective strategy in overcoming drug resistance in ovarian cancer (McAuliffe et al., 2012). Therefore, our study revealed that the proteasome and Notch signaling pathway might be a fraction of the mechanism of MDR-TB.
Conclusions
In summary, we have demonstrated that n335659 showed differential expression in the serum of patients with MDR-TB, DS-TB and HCs, and that it was suitable to be a biomarker of MDR-TB. To the best of our knowledge, this is the first study to address lncRNA expression profiles in sera of MDR-TB patients. Moreover, our new findings improved the understanding of the pathological mechanisms of MDR-TB, although the conclusions entirely based on the changes in lncRNAs levels and bioinformatics analysis. New theories for MDR-TB pathogenesis focusing on the function of lncRNA n335659 and therapeutic targets based on proteasome and the Notch signaling pathway in MDR-TB may be developed in future.