
ANXA9 as a novel prognostic biomarker associated with immune infiltrates in gastric cancer
- Published
- Accepted
- Received
- Academic Editor
- Ranjit Vijayan
- Subject Areas
- Bioinformatics, Gastroenterology and Hepatology, Immunology, Oncology, Medical Genetics
- Keywords
- Gastric cancer, ANXA9, Prognosis, Immune infiltrates, GEO, TCGA
- Copyright
- © 2021 Zhang et al.
- Licence
- This is an open access article distributed under the terms of the Creative Commons Attribution License, which permits using, remixing, and building upon the work non-commercially, as long as it is properly attributed. For attribution, the original author(s), title, publication source (PeerJ) and either DOI or URL of the article must be cited.
- Cite this article
- 2021. ANXA9 as a novel prognostic biomarker associated with immune infiltrates in gastric cancer. PeerJ 9:e12605 https://doi.org/10.7717/peerj.12605
Abstract
Background
Gastric cancer (GC) is the most prevalent malignancy among the digestive system tumors. Increasing evidence has revealed that lower mRNA expression of ANXA9 is associated with a poor prognosis in colorectal cancer. However, the role of ANXA9 in GC remains largely unknown.
Material and Methods
The Gene Expression Profiling Interactive Analysis (GEPIA) and Human Protein Atlas databases were used to investigate the expression of ANXA9 in GC, which was then validated in the four Gene Expression Omnibus (GEO) datasets. The diagnostic value of ANXA9 for GC patients was demonstrated using a receiver operating characteristic (ROC) curve. The correlation between ANXA9 expression and clinicopathological parameters was analyzed in The Cancer Genome Atlas (TCGA) and UALCAN databases. The Kaplan-Meier (K-M) survival curve was used to elucidate the relationship between ANXA9 expression and the survival time of GC patients. We then performed a gene set enrichment analysis (GSEA) to explore the biological functions of ANXA9. The relationship of ANXA9 expression and cancer immune infiltrates was analyzed using the Tumor Immune Estimation Resource (TIMER). In addition, the potential mechanism of ANXA9 in GC was investigated by analyzing its related genes.
Results
ANXA9 was significantly up-regulated in GC tissues and showed obvious diagnostic value. The expression of ANXA9 was related to the age, gender, grade, TP53 mutation, and histological subtype of GC patients. We also found that ANXA9 expression was associated with immune-related biological function. ANXA9 expression was also correlated with the infiltration level of CD8+ T cells, neutrophils, and dendritic cells in GC. Additionally, copy number variation (VNV) of ANXA9 occurred in GC patients. Function enrichment analyses revealed that ANXA9 plays a role in the GC progression by interacting with its related genes.
Conclusions
Our results provide strong evidence of ANXA9 expression as a prognostic indicator related to immune responses in GC.
Introduction
Gastric cancer (GC), a cause of some of the the deadliest tumors, is the fifth most common cancer worldwide and is most prevalent in East Asian countries, such as Korea, Mongolia, Japan and China, followed by Eastern Europe (Correa, 2016; Tsukanov et al., 2011). In 2015, there were an estimated 679,000 new GC cases and 498,000 deaths from GC in China (Chen et al., 2016). Despite many recent developments in the treatments of GC, including surgery, chemotherapy, radiation and immunotherapy, all of which can be used alone or in combination (Song et al., 2017), the 5-year survival rates of patients with high-grade GC remain poor, at just 30–35% (Miller et al., 2019; Chon et al., 2017). Moreover, despite substantial improvements in targeted therapies including HER2, EGFR1 and VEGF, there are still many limitations to these therapies (Kim, Mulder & Spratlin, 2014; Lordick et al., 2013; Maeda et al., 1996). Most patients with GC only demonstrate the clinical features of the disease in the advanced stage which is too late to receive effective therapy (Luebeck et al., 2013). Therefore, screening novel biomarkers to increase early diagnosis and treatment of GC is an urgent necessity.
The Annexin A (ANXA) family is known to be related to the progression of cancer (Boudhraa et al., 2016; Qi et al., 2015; Lauritzen, Boye & Nylandsted, 2015). Annexin A9 (ANXA9), initially known as annexin 31, is mainly involved in the organization and regulation of membrane/cytoskeleton linkage (Morgan et al., 1999), and is a protein encoding gene located in human chromosome 1q21 (Boczonadi & Määttä, 2012; Goebeler et al., 2003). ANXA9 is associated with relapse in both bone and breast cancers (Smid et al., 2006). Previous studies have also found that ANXA9 is a potential prognosis indicator for ER+ breast cancer and colorectal cancer (Xiao et al., 2019; Miyoshi et al., 2014; Yu et al., 2018). Furthermore, ANXA9 might be related to the invasion and metastasis of colorectal cancer through the regulation of ADAM17, MMP-9, TIMP-1 and E-cadherin (Yu et al., 2018). ANXA9 also participates in the pathogenesis of HPV-Negative head and neck squamous cell carcinomas (Salom et al., 2019), and plays a key role in the cisplatin-resistance of ovarian carcinoma cells (Kou et al., 2021). Importantly, ANXA9 has been discovered to be associated with the pathogenesis and maintenance of immunodeficiency in immunodeficient mice (Nakashima et al., 2019). Despite all these known associations, the potential role and mechanisms of ANXA9 in GC progression and immunology remain unclear.
In the present study, we aimed to systematically assess the role of ANXA9 in GC. First, the ANXA9 expression in GC was investigated using the data from the Cancer Genome Atlas (TCGA, https://portal.gdc.cancer.gov/) (Tomczak, Czerwińska & Wiznerowicz, 2015) and the Gene Expression Omnibus (GEO, https://www.ncbi.nlm.nih.gov/geo/) databases (Edgar, Domrachev & Lash, 2002). Next, we explored the correlations between ANXA9 expression and clinicopathologic features, prognosis and immune cell infiltration. We also analyzed the functions and regulating mechanisms of ANXA9. These analyses will help provide a better understanding of a possible molecular mechanism of GC and may help improve treatment for GC.
Materials and methods
Date acquisition and description
All the publicly available transcriptome data and clinical information of GC patients we used in this analysis was downloaded from the TCGA database. The TCGA transcriptome data comprised of 375 tumor tissue samples and 32 normal tissue samples.
Microarray series (GSE13861, GSE13911, GSE19826 and GSE79973) containing GC and normal samples were extracted from the GEO database. The GSE13861 dataset, based on the GPL6884 platform, contained 65 GC samples and 19 normal samples. GSE13911 is a microarray dataset that contained 38 patients with GC and 31 normal individuals. The GSE19826 dataset included 12 GC samples and 15 normal samples. A total of 20 samples were acquired from the GSE79973 dataset including 10 GC and 10 normal samples. The GSE13911, GSE19826, and GSE79973 datasets are all from the GPL570 platform.
Gene expression profiling interactive analysis (GEPIA) database analysis
GEPIA (http://gepia.cancer-pku.cn/) is an online database containing 9,736 tumors tissue samples and 8,587 normal tissue samples of the TCGA and Genotype-Tissue Expression (GTEx) databases (Tang et al., 2017). The expression of ANXA9 was examined in 33 different types of cancers within the “Single Gene Analysis” module of the GEPIA database. A P-value less than 0.05 was considered significant.
Validation of ANXA9 expression in the TCGA database and four GEO datasets
ANXA9 expression was further demonstrated in the TCGA database and four GEO datasets mentioned above. The Wilcoxon sign-ranked test (Wilcox.test) was used to analyze the difference in the expression of ANXA9 between GC and normal tissue samples. By conducting the receiver operating characteristic (ROC) analysis with “survivalROC” R package to evaluate the diagnostic value discriminating GC from normal tissues (Heagerty, Lumley & Pepe, 2000), we calculated the area under the curve (AUC) of the ANXA9 expression level.
Human protein atlas
The The Human Protein Atlas (HPA) database (https://www.proteinatlas.org/) collected the tissue and cell distribution information of 26,000 human proteins (Asplund et al., 2012). In this study, the protein expression of ANXA9 in both GC and normal tissues were acquired from the HPA database.
UALCAN database analysis
The UALCAN database (http://ualcan.path.uab.edu) is a comprehensive web resource for analyzing TCGA gene expression data (Chandrashekar et al., 2017). We analyzed the relationship of ANXA9 expression and the clinicopathological characteristics of GC patients with the UALCAN database. The differences of the different groups were compared using the Wilcox.test.
Survival analysis
After eliminating the 26 samples with missing clinical information, the remaining 349 GC patients in the TCGA database were ranked into two groups based on the expression of ANXA9—a ANXA9 high expression group and a ANXA9 low expression group. To analyze the overall survival (OS), 3-year survival rate, and 5-year survival rate of GC patients between the different groups, we performed the Kaplan-Meier (K-M) analysis with the log-rank test. Results where P < 0.05 were considered statistically significant.
Functional enrichment analysis
All the genes between the ANXA9 high and low expression groups were utilized to perform a gene set enrichment analysis (GSEA). The terms with a P value < 0.05 were considered significantly enriched. The relative expression of 29 immune-related gene sets acquired from the literatures were calculated with single-sample gene set enrichment analysis (ssGSEA) in the “gsva” R package (Hänzelmann, Castelo & Guinney, 2013).
Tumor immunity estimation resource (TIMER) database analysis
The TIMER database is a comprehensive resource that we used for the systematic analysis of immune infiltration levels in different types of cancer (Li et al., 2017). The TIMER database contained macrophages CD4+ T cells, B cells, neutrophils, CD8+ T cells, and dendritic cells. The “gene” module of TIMER was used to analyze the correlations between ANXA9 expression and the six infiltrating immune cells in GC.
The analysis of ANXA9-related genes
The differential expression analysis of the ANXA9 high and low expression groups was implemented using the “Limma” package (Ritchie et al., 2015). The differentially expressed genes (DEGs) were screened with the selection condition of |log2fold change (FC)| > 1 and P-value < 0.05. By calculating the correlation between ANXA9 expression and these DEGs, ANXA9-related genes were determined with a |correlation coefficient| > 0.3 and a P value < 0.05. A network was constructed with ANXA9 and ANXA9-related genes. The pink ellipse represented a positive correlation with the ANXA9, and the purple ellipse represented a negative correlation with ANXA9.
The ANXA9-related genes were added to the Database for Annotation, Visualization and Integrated Discovery (DAVID) online tool (https://david.ncifcrf.gov/) for GO and KEGG enrichment analysis.
Statistical analysis
All data in this study was analyzed using R software. The relationship of ANXA9 among clinicopathological characteristics in GC patients was compared using the Wilcox.test. The survival analysis of different groups was performed using the K-M analysis with the log-rank test. In all analyses, P values < 0.05 were considered statistically significant.
Results
The expression and diagnostic value of ANXA9 in GC
To investigate the differences of ANXA9 expression between tumor and normal samples, the ANXA9 mRNA expression levels in 33 human cancers were examined using the GEPIA database. The results showed that ANXA9 expression was significantly increased in breast invasive carcinoma (BRCA), colon adenocarcinoma (COAD), stomach adenocarcinoma (STAD), and rectum adenocarcinoma (READ) compared with the normal tissues. However, low expression of ANXA9 was found in esophageal carcinoma (ESCA), head and neck squamous cell carcinoma (HNSC), kidney chromophobe (KICH),kidney renal clear cell carcinoma (KIRC), kidney renal papillary cell carcinoma (KIRP), skin cutaneous melanoma (SKCM), testicular germ cell tumors (TGCT), uterine corpus endometrial carcinoma (UCEC), and uterine carcinosarcoma (UCS) (Fig. 1A, P < 0.05). ANXA9 expression in GC and normal samples was analyzed using the transcriptome data from the TCGA database. Consistently, these results revealed that ANXA9 expression was in GC patients (Fig. 1B, P < 0.05). The expression of ANXA9 was also analyzed in four GEO microarray series, and the results indicated a large increase of ANXA9 expression in GC patients (Figs. 1C–1F, P < 0.05). Based on the data from the HPA database, deeper staining levels of ANXA9 was observed in GC tissues compared to that of normal tissues, revealing a higher protein expression in GC (Figs. 1G–1J).
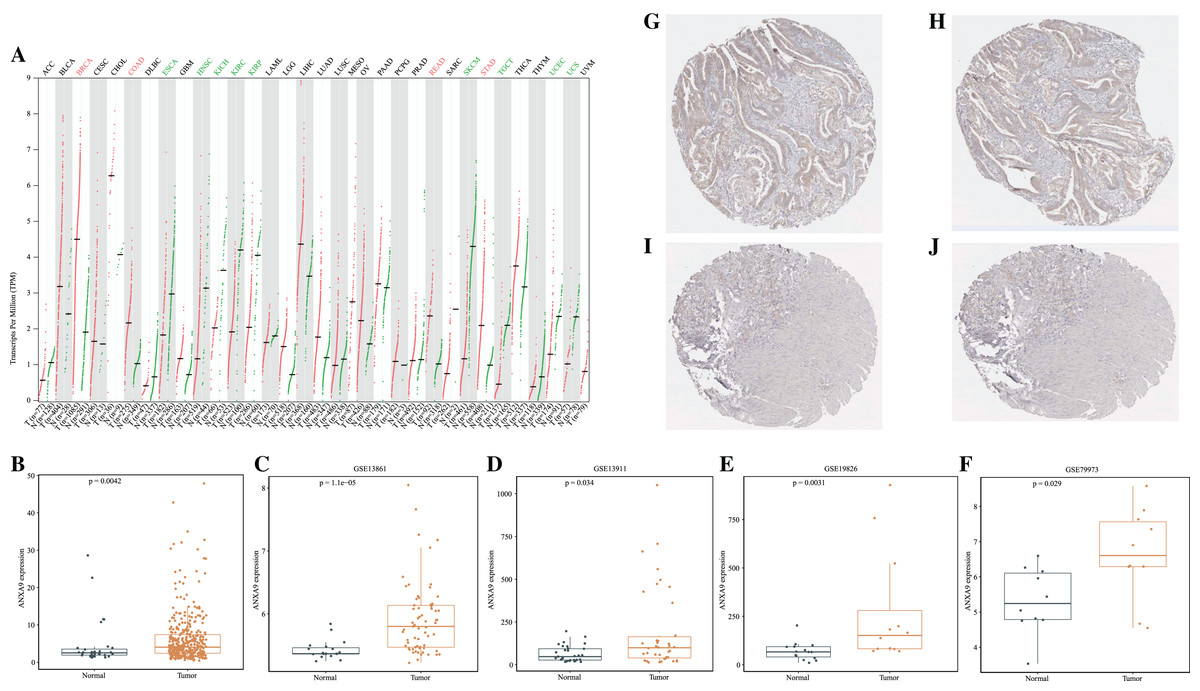
Figure 1: The expression level of ANXA9 in pan-cancer and GC.
(A) The ANXA9 mRNA levels in 33 human cancers. (B) The ANXA9 mRNA level in GC was up-regulated compared to the normal tissues based on the TCGA database. (C–F) The ANXA9 mRNA level in GC was up-regulated compared to normal tissues based on GSE13861, GSE13911, GSE19826, and GSE79973. (G) The ANXA9 protein expression in GC was higher than in the normal tissues based on the HPA database. (G–H) The ANXA9 protein expression in GC from the HPA database. (I–J) The ANXA9 protein expression in normal samples from the HPA database.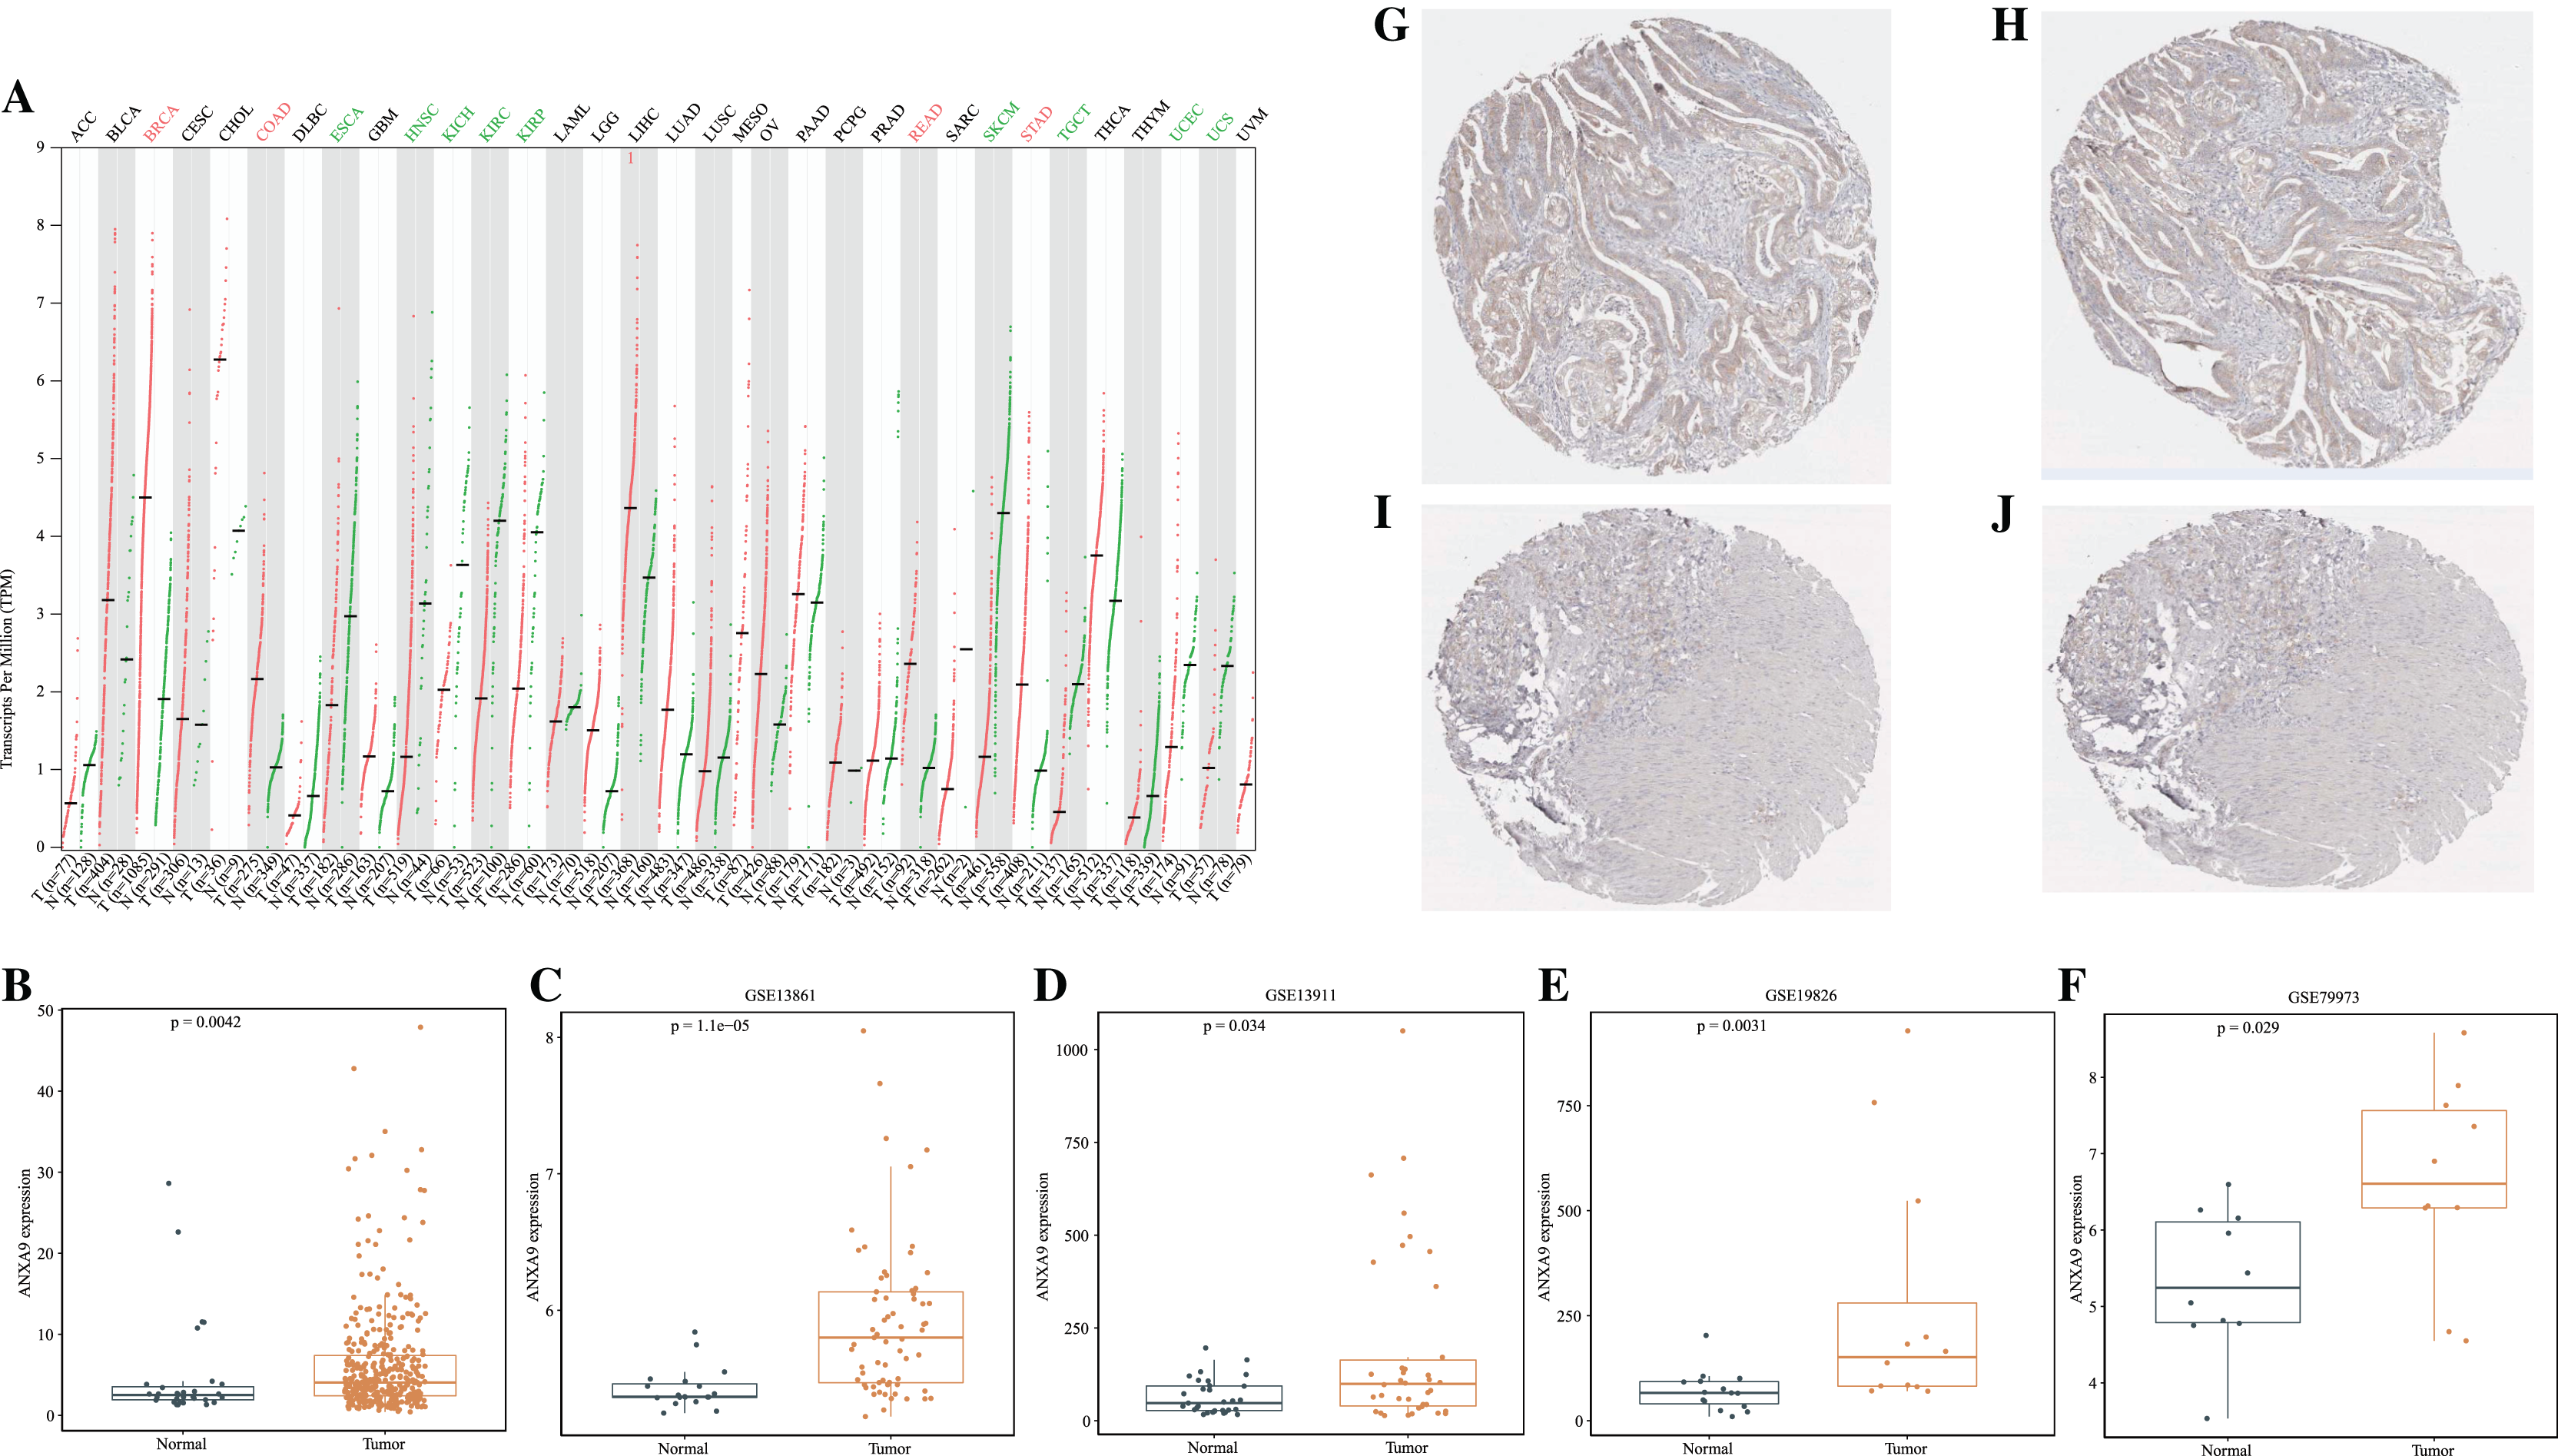
Importantly, ROC curves showed that the AUC of the ANXA9 expression levels reached 0.655, 0.828, 0.645, 0.809 and 0.774 in the TCGA, GSE13861, GSE13911, GSE19826, and GSE79973 datasets, respectively, suggesting that ANXA9 expression levels could be used to distinguish GC patients from normal individuals (Figs. 2A–2E). Collectively, these results illustrated that ANXA9 was both elevated in GC and has diagnostic value, suggesting that ANXA9 has an important regulatory role in the progression of GC.
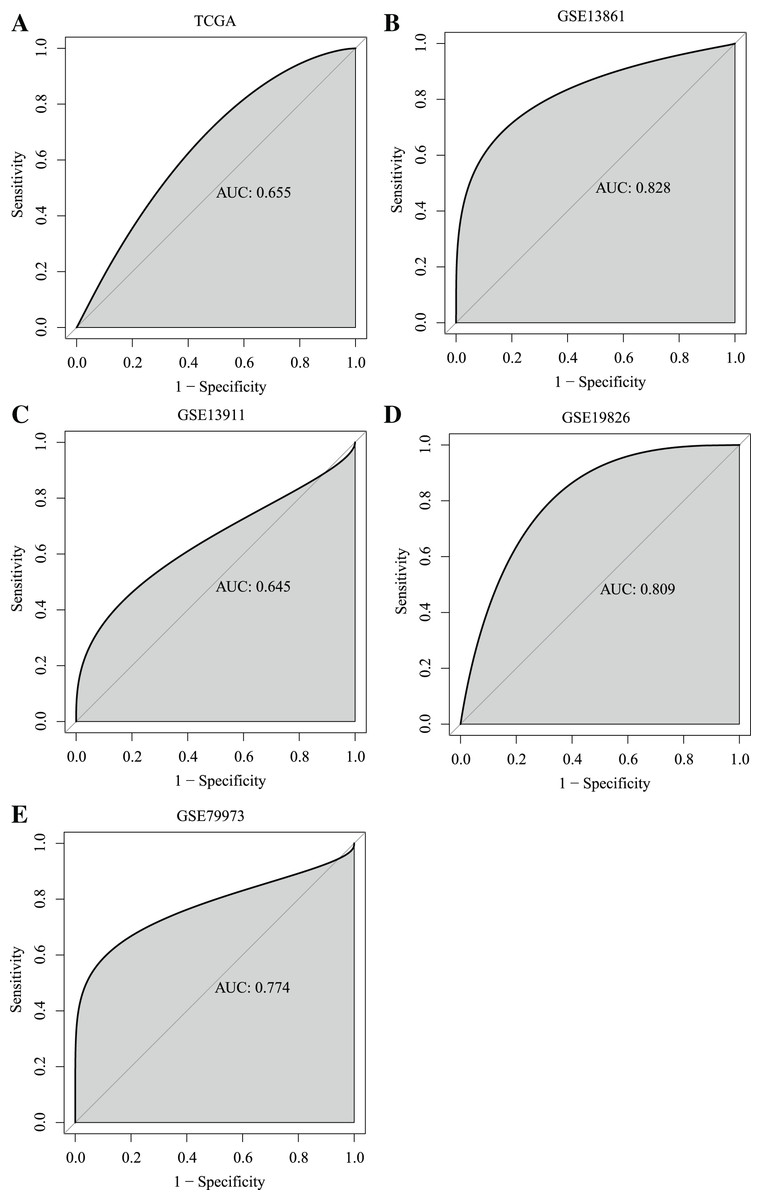
Figure 2: ROC curves showed that ANXA9 could distinguish the GC patients from normal individuals.
(A–E) ROC curves in the TCGA database (A) and GSE13861 (B), GSE13911 (C), GSE19826 (D), and GSE79973 (E) datasets.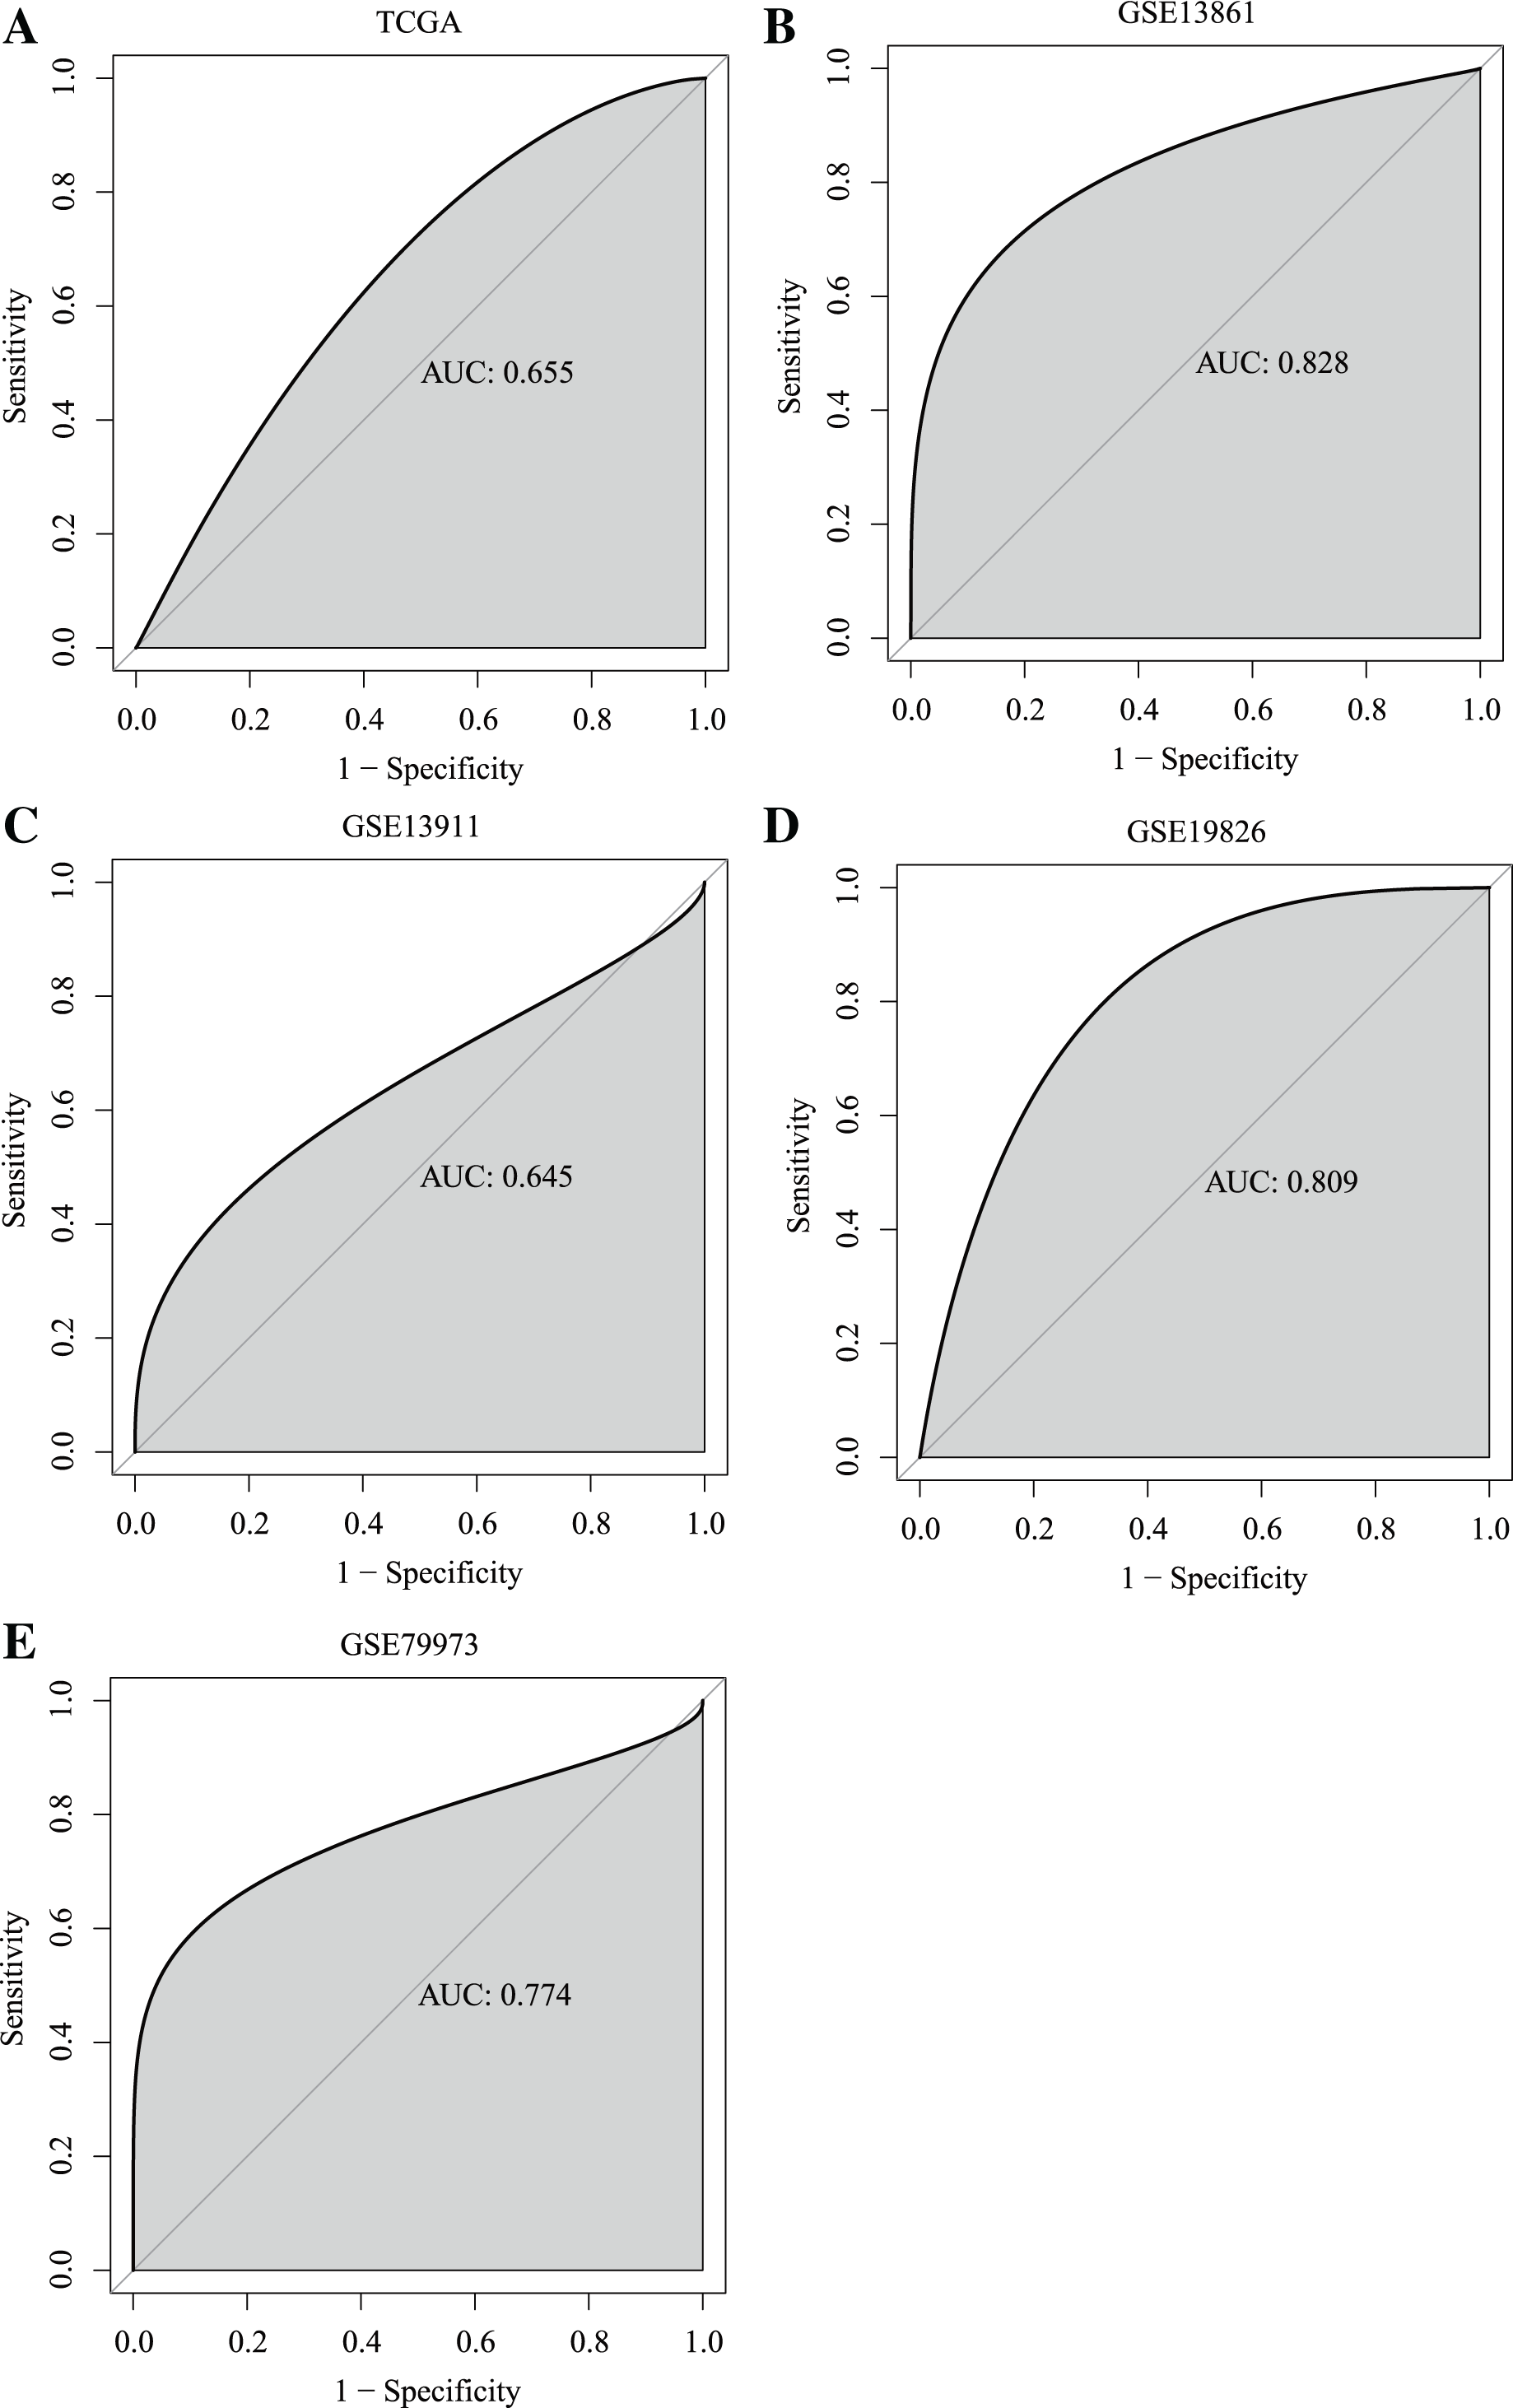
Relationship of ANXA9 expression and clinicopathological characteristics of GC patients
Having demonstrated that the expression of ANXA9 was elevated in GC patients, we then explored the relationship of ANXA9 expression and clinicopathological characteristics in GC patients. The results of the TCGA database analysis revealed that 51–70-year old GC patients had a higher ANXA9 level than 71–90-year-old GC patients (Fig. 3A, P < 0.05). Moreover, an elevated expression of ANXA9 was observed in male GC patients (Fig. 3B, P < 0.05). ANXA9 expression was not associated, however, with the pathological stage and TNM stage of GC patients in the TCGA database (Figs. 3C–3F, P > 0.05). We also tested the differences in the expression of ANXA9 between Carcinoma diffuse type GC and Adenocarcinoma intestinal type GC based on the Lauren classification. Patients with Adenocarcinoma intestinal type GC had a higher expression level than patients with Carcinoma diffuse type GC (Fig. 3G, P = 0.022).
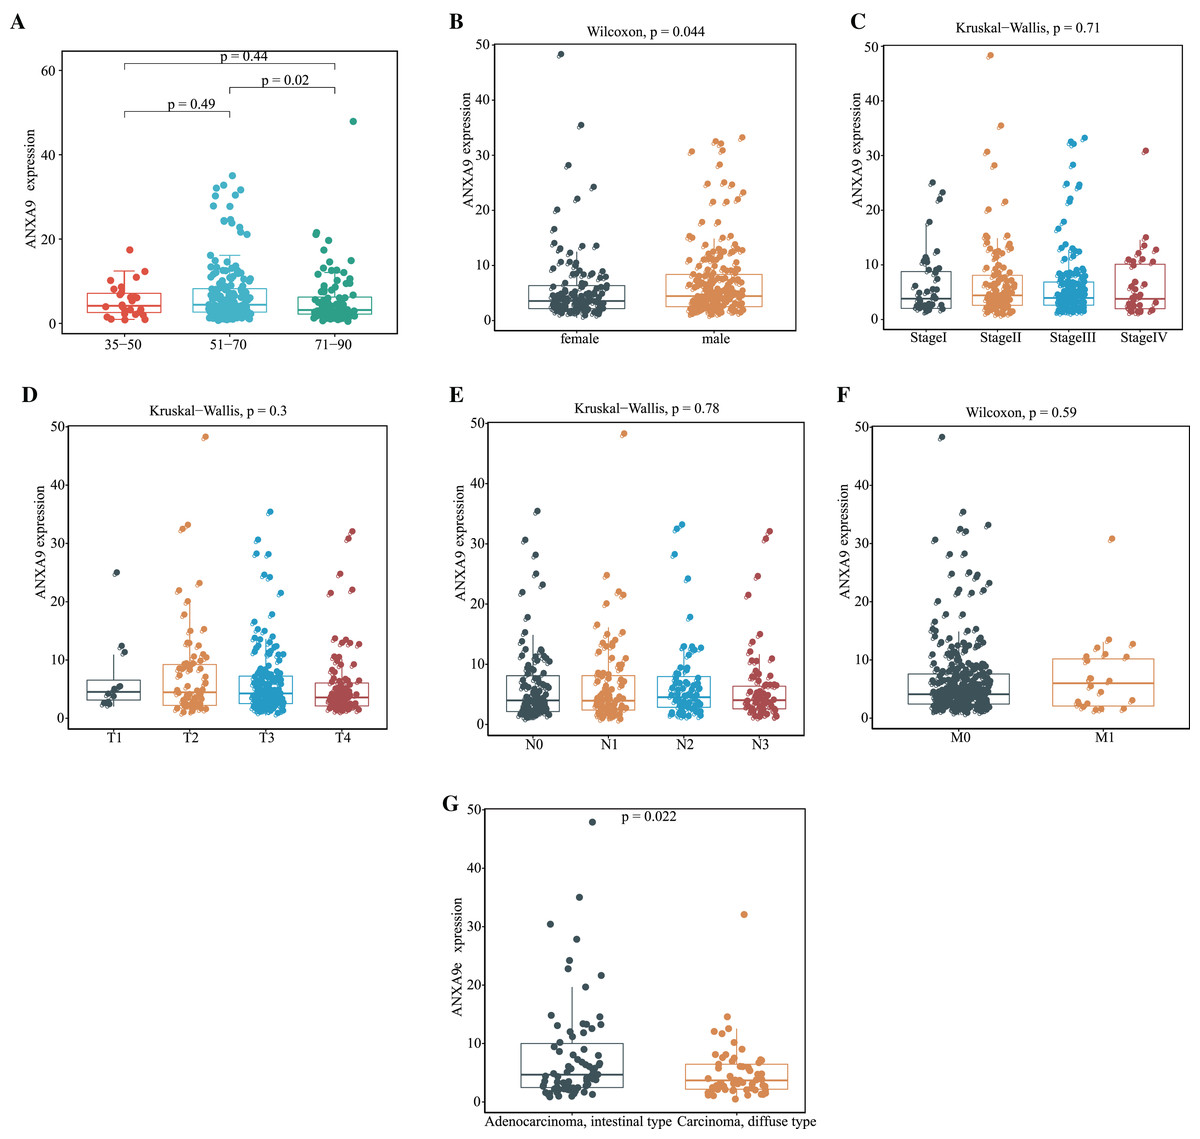
Figure 3: Relationship of ANXA9 expression and clinicopathological characteristics of GC patients based on the TCGA database.
(A–F) The mRNA expression levels by age (A), gender (B), tumor stage (C), pathological T stage (D), pathological N stage (E), pathological M stage (F), and Lauren classification (G) based on the TCGA database.
The relationship between ANXA9 expression and clinicopathological characteristics was analyzed using the UALCAN online database. In the histological subtype analysis, a significant up-regulation of ANXA9 was observed in both IntAdenoNOS and IntAdenoTubular GC patients (Fig. 4A, P < 0.05). We also found that the expression level of ANXA9 was significantly up-regulated in patients with GC classified as Grade 2 compared with the normal samples (Fig. 4B, P < 0.05). In addition, increased ANXA9 expression was observed in TP53-mutant GC patients (Fig. 4C, P < 0.05). However, no significant correlation was found between ANXA9 expression and the age, race, gender, primary tumor, H.pylori infection status, metastasis status, and pathological stage of GC patients (Figs. 4D–4J, P > 0.05). Taken together, these results indicated that high ANXA9 expression is widely correlated with different clinicopathological characteristics of GC.
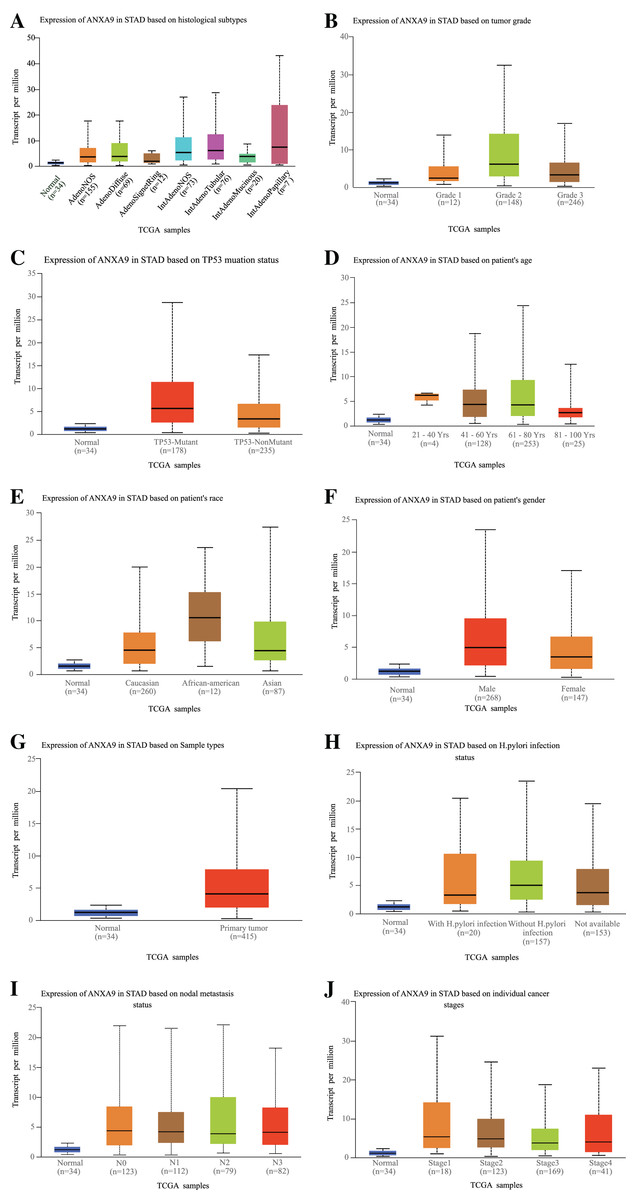
Figure 4: Relationship of ANXA9 expression and clinicopathological characteristics of GC patients based on the UALCAN online database.
(A–I) the mRNA expression levels between different histological subtypes (A), tumor grade (B), TP53 mutation status (C), age (D), race (E), gender (F), sample types (G), H.pylori infection status (H), nodal metastasis status (I), and tumor stage based on the UALCAN online database.
The prognostic value of ANXA9 in GC
To further explore whether the ANXA9 was correlated with the survival of patients with GC, we compared the OS between the ANXA9 high expression and ANXA9 low expression groups using the K-M analysis. Notably, the results showed that the GC patients with a high expression of ANXA9 had a higher survival probability (Figs. 5A–5C, P < 0.05), demonstrating that ANXA9 expression was associated with the prognosis of GC patients. We also observed a correlation between ANXA9 expression and OS in other cancers using the UALCAN database. Interestingly, the higher expression of ANXA9 was correlated with lower OS of UCEC patients (Fig. S1), which was just the opposite of the results for GC patients.
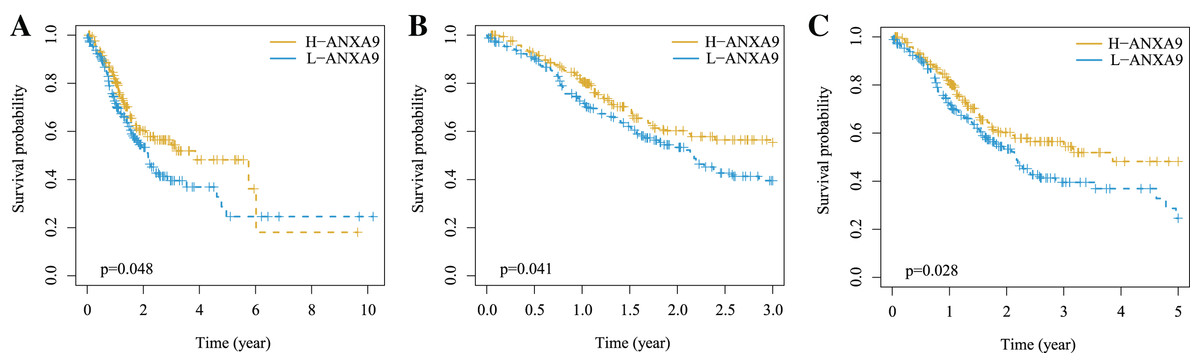
Figure 5: The correlation between ANXA9 expression and prognosis in GC.
(A–C) The K-M survival curves for OS (A), 3-year survival (B), and 5-year survival (C) of patients with GC.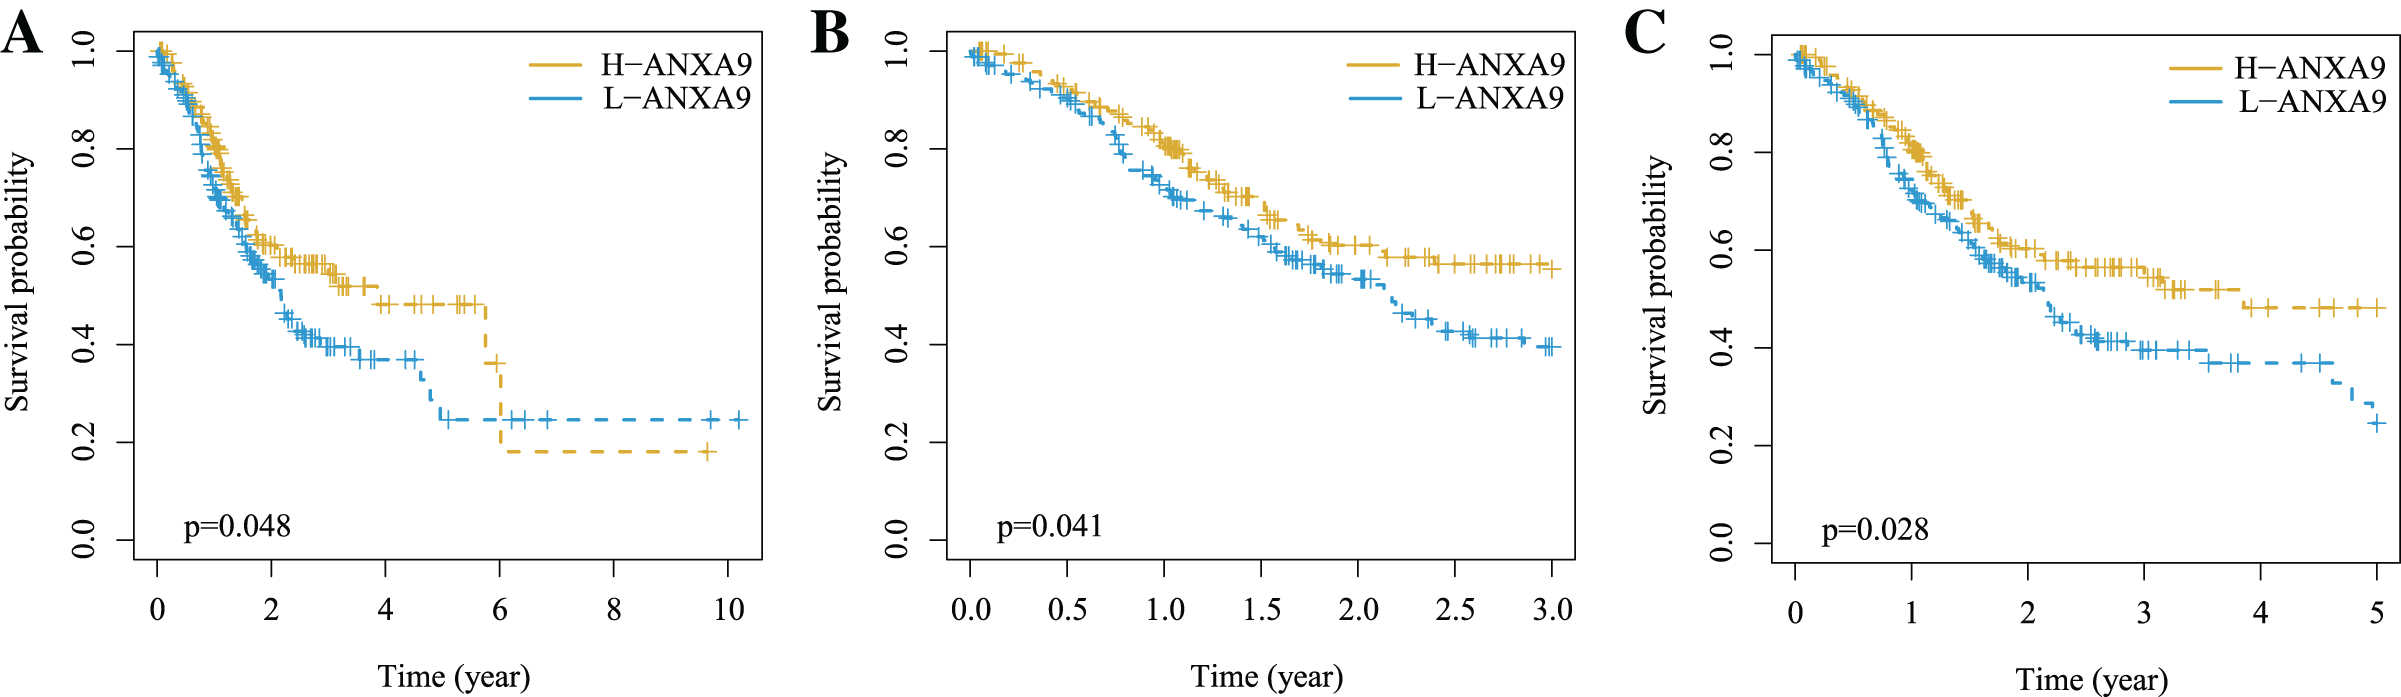
Gene set enrichment analysis
To investigate the biological functions of ANXA9 in GC, GSEA was carried out to clarify the GO terms and the KEGG pathways that ANXA9 was involved in. Based on the enrichment score, we listed the top 10 most relevant biological processes and pathways. The GO results showed that AXONEMAL DYNEIN COMPLEX ASSEMBLY, AXONEME ASSEMBLY, CILIARY TRANSITION ZONE, CORNIFICATION, CORNIFIED ENVELOPE, INTRACILIARY TRANSPORT, INTRACILIARY TRANSPORT INVOLVED IN CILIUM ASSEMBLY, INTRACILIARY TRANSPORT PARTICLE, KERATINIZATION were enriched in the ANXA9 high expression group (Fig. 6A). Low expression of ANXA9 was associated with immune-related biological functions, including CHEMOKINE BINDING, CYTOSOLIC RIBOSOME, LEUKOCYTE ADHESION TO VASCULAR ENDOTHELIAL CELL, PHAGOCYTIC CUP, POSITIVE REGULATION OF LEUKOCYTE CELL-CELL ADHESION, POSITIVE T CELL SELECTION, RESPONSE TO CHEMOKINE, and T CELL SELECTION (Fig. 6B). Interestingly, KEGG analysis demonstrated that the genes in both the ANXA9 high expression and ANXA9 low expression groups participated in STEROID BIOSYNTHESIS, HEMATOPOIETIC CELL LINEAGE, and RIBOSOME signal pathways. The comprehensive analysis of these results indicated that ANXA9 plays a regulatory role in the progression of GC.
Figure 6: The biological functions of ANXA9 in GC.
(A) The GO enrichment results based on the genes in the ANXA9 high expression group. (B) The GO enrichment results based on the genes in the ANXA9 low expression group.
Correlation between ANXA9 expression and immune infiltration levels in GC
Based on the results of the functional enrichment, we observed that ANXA9 is related to the immune response in GC. Therefore, we further calculated the number of immune cells in each GC sample using ssGSEA. A total of 21 immune-response gene sets were significantly different between the ANXA9 high expression and ANXA9 low expression groups, These gene sets include APC_co_inhibition, B_cells, CCR, CD8._T_cells, Check.point, Cytolytic_activity, DCs, HLA, Inflammation.promoting, Neutrophils, NK_cells, pDCs, T_cell_co.inhibition, T_cell_co.stimulation, T_helper_cells, Tfh, Th1_cells, Th2_cells, TIL, Treg and Type_II_IFN_Reponse. The expression of these 21 immune-response gene sets were significantly increased in the ANXA9 low expression group (Fig. 7A, P < 0.05). We then investigated the correlation between ANXA9 expression and immune infiltration in the TIMER database. As shown in Fig. 7B, ANXA9 expression was significantly negatively correlated with the infiltration level of CD8+ T cells (Cor = −0.161, P = 1.91e−03), neutrophils (Cor = −0.138, P = 7.58e−03), and dendritic cells (Cor = −0.153, P = 3.05e−03) in GC.
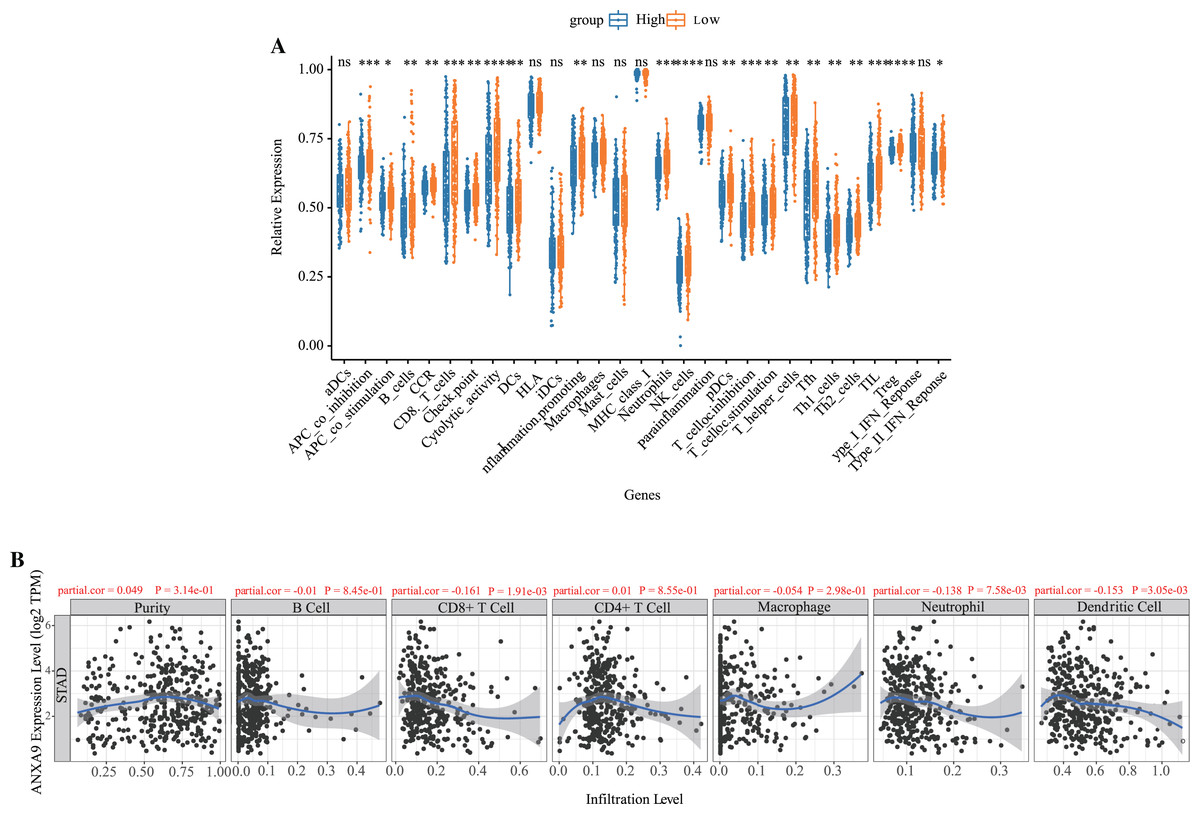
Figure 7: Correlation between ANXA9 expression and immune infiltration levels in GC.
(A) The proportion and composition of infiltrating immune cells between ANXA9 high and low expression groups based on 21 gene sets including immune cells and the activity of immune-related pathways. (B) The correlation between ANXA9 expression and immune infiltration in the TIMER database.
The ANXA9 methylation and copy number variation (CNV) analyses
DNA methylation is the main epigenetic mechanism for regulating gene expression in the tumorigenesis and development (Maeder et al., 2013). We used MEXPRESS to analyze whether the expression of ANXA9 was related to its methylation. Figure 8 showed that there was a negative correlation between the ANXA9 expression and the methylation of CpG and promoter regions. 4 abnormal methylation sites with cut-off value of correlation coefficient <−0.3 were observed including cg25468058 (Cor = −0.503), cg04144222 (Cor = −0.523), Cg07337598 (Cor = −0.349), and cg13320146 (Cor = −0.321). The ANXA9 expression positively correlated with its CNV change (Cor = 0.240, P < 0.0001). Our results showed that the CNV change of ANXA9 occurred in GC patients.
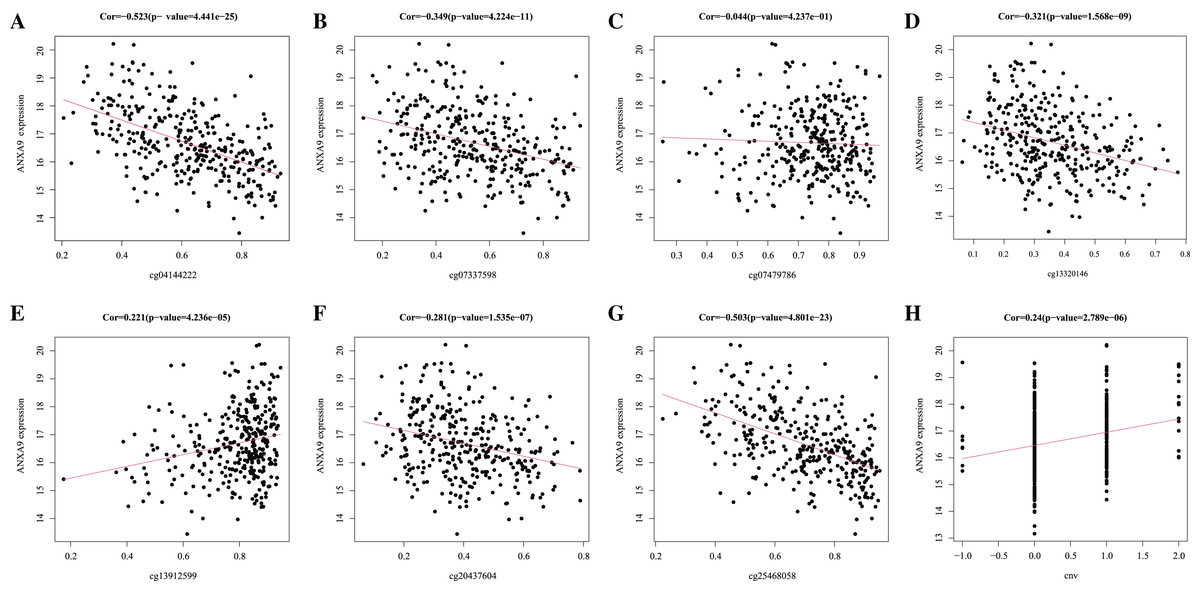
Figure 8: The analyses of ANXA9 DNA methylation and CNV.
(A–G), The correlation between DNA methylation level and expression of ANXA9 in different methylation modification sites, including cg04144222 (A), cg07337598 (B), cg07479786 (C), cg13320146 (D), cg13912599 (E), cg20437604 (F), and cg25468058 (G). (H), The correlation between CNV and expression of ANXA9.
Analysis of ANXA9-related genes
To further investigate the role of ANXA9 in GC, we identified 179 ANXA9-related genes with the criteria |Cor| > 0.3, P < 0.05 based on the DEGs between ANXA9 high and ANXA9 low expression groups (Fig. 9A, Table S1). From the PPI network, we retrieved 162 significantly positively related genes and 17 significantly negatively related genes, which were utilized for GO and KEGG enrichment analysis (Figs. 9B and 9C). The enriched biological process (BP) terms were actin filament bundle assembly, skeletal muscle contraction, cell-cell adhesion, Rho protein signal transduction, and cellular response to hyperoxia. The ANXA9-related genes were associated with cellular components (CC) terms, such as endoplasmic reticulum membrane, primary cilium, cell-cell adherens junction, extracellular exosome, and endoplasmic reticulum-Golgi intermediate compartment membrane. The molecular function (MF) terms associated with ANXA9-related genes were microtubule motor activity, Rho guanyl-nucleotide exchange factor activity, actin filament binding, and cadherin binding involved in cell-cell adhesion were significantly enriched. However, there was no significant enrichment of KEGG pathways. The data indicated that ANXA9 -related genes may also play a role in GC progression.
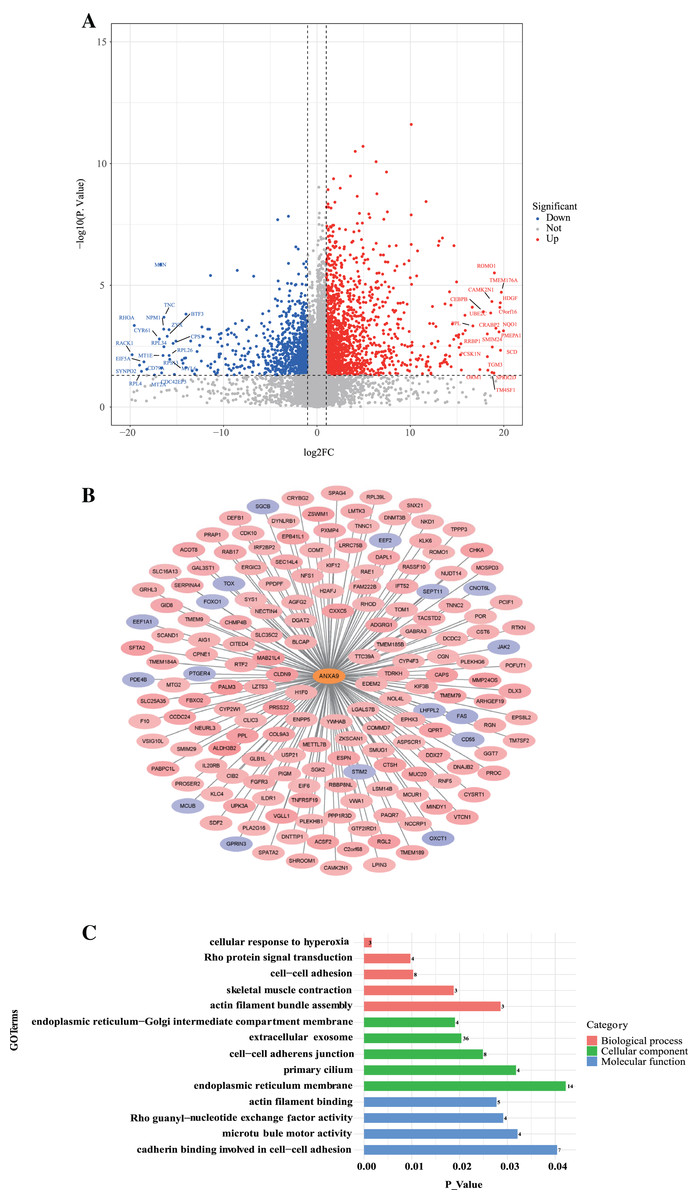
Figure 9: The analysis of ANXA9-related genes.
(A) Volcano plot of the DEGs between the ANXA9 high and ANXA9 low expression groups. (B) The PPI network of ANXA9 and ANXA9-related genes. (C) The GO function enriched by ANXA9-related genes.
Discussion
GC is a common malignancy of the digestive system. Although great advances have been made in the diagnosis and treatment of GC, the prognosis of GC patients is still terrible (Miller et al., 2019). An increasing number of studies have noted the superiority of molecular therapy in the treatment of GC (Xu et al., 2018; Shitara et al., 2019). Therefore, it is urgent to screen novel biomarkers to increase early diagnosis and treatment of GC.
To the best of our knowledge, our study was the first to systematically explore the role of ANXA9 in GC. We initially investigated the expression of ANXA9 in pan-cancer samples using the GEPIA site, and found that ANXA9 expression was up-regulated in most cancer samples, including GC samples, when compared to normal samples, as well as GC (Fig. 1A). The bioinformatics analysis of data from the TCGA and GEO databases also suggested that ANXA9 expression was significantly increased in GC samples (Figs. 1B–1G). Interestingly, the analyses we performed using the UALCAN database revealed that ANXA9 expression was significantly related to GC grade, TP53 mutation and histological subtype. More importantly, the K-M analysis suggested that ANXA9 expression was associated with the prognosis of GC patients (Figs. 5A–5C). Consistent with our results, it has been suggested that ANXA9 is associated with the prognosis of breast cancer and colorectal cancer (Xiao et al., 2019; Miyoshi et al., 2014; Yu et al., 2018). ANXA9 could also affect the pathogenesis of HPV-Negative head and neck squamous cell carcinomas (Salom et al., 2019) and regulate the enhanced cisplatin-resistance in ovarian carcinoma (Kou et al., 2021). Notably, ANXA9 expression was higher in GC samples compared to normal samples and the high ANXA9 expression group had a better OS rate (Figs. 1C–1G and 5A–5C), which is the opposite of what we see in colorectal cancer (Yu et al., 2018) and UCEC (Fig. S1). We speculate that this difference of ANXA9 role among GC, UCEC and colorectal cancer may be due to the dual roles of genes in cancer pathogenesis. For example, reducing NLK expression can suppress cell growth and tumorigenesis in some tumors, but can produce the opposite effects in other tumors (Li et al., 2018). Similarly, YY1 is up-regulated in many cancers, while sometimes is down-regulated in other cancers (Hays & Bonavida, 2019). PA2G4 also has opposite roles in prostate cancer and colon cancer (Nguyen et al., 2018). On the other hand, this difference of ANXA9 role between GC and colorectal cancer may be caused by the heterogeneity of GC and colorectal cancer. Research suggests that the factors and molecular pathways involved in GC tumorigenesis are different from colorectal cancer (Park et al., 2017). For example, alterations of p53 or missing genes may play different roles in the progression of GC compared to colorectal cancers (Kataoka et al., 2000). In addition, hepatic metastases from GC present more systematic and aggressive tumor behavior than those from colorectal cancer (Oguro et al., 2016). Furthermore, it has been revealed that MDR1 mRNA levels in GC cells are significantly lower than those in colon cancer cells, which means they have different epigenetic regulations such as DNA methylation and/or histone deacetylation in GC and colon cancer (Lee et al., 2008). Particularly, ANXA may play a multifaceted and possibly distinctive role in different cancers. For instance, annexin A7 acts as a tumor suppressor in prostate cancer, melanoma and glioblastoma (Srivastava et al., 2001; Hung & Howng, 2003; Kataoka et al., 2000), whereas annexin A7 can accelerate the progression of liver, colorectal, and breast cancers (Srivastava et al., 2004; Srivastava et al., 2007; Sun et al., 2009). Thus, given the expression pattern and prognostic impact of ANXA9, we speculated that the ANXA9 might not be related to the occurrence of GC, but might affect the development of GC. Namely, the occurrence of GC might induce the up-regulation of ANXA9 expression resulting in a protective effect on human body. It also has been noted that CA12 expression is higher in breast cancer tissues and a high CA12 expression in breast cancer patients is associated with better OS (Li et al., 2019). In addition, Li et al. (2020) also found that BUB1 was highly expressed in gastric cancer compared with normal gastric tissue and a K-M survival analysis showed that the OS time was prolonged in gastric cancer patients with a high expression of BUB1. Collectively, these findings suggested that ANXA9 might play an important role in GC, and that ANXA9 could be selected as a biomarker for the diagnosis and treatment of GC.
The genes in ANXA9 high expression group were mainly enriched in an axonemal dynein complex (Fig. 6A). It has been suggested that ANXA9 is found in protein complexes containing periplakin, a cytoskeletal linker protein belonging to the plakin family (Boczonadi & Määttä, 2012). Moreover, ANXA9 has been reported to participate in the bone metastasis of breast cancer. Thus, we speculated that ANXA9 might be involved in the bone metastasis of GC. On the other hand, the genes in ANXA9 low expression group were primarily involved in immune-related biological processes, such as chemokine binding and T cell selection (Fig. 6B). Therefore, we speculated that ANXA9 might also regulate GC prognosis by influencing the immune response. Consistent with our hypothesis, patients in ANXA9 low expression group showed higher proportions of infiltrating immune cells (Fig. 7A), indicating that the poor OS of patients in the ANXA9 low expression group might be caused by immunosuppressive milieu (Cao et al., 2020) and increasing the expression of ANXA9 could protect against the immunosuppressive environment of GC resulting in an improved GC prognosis (Li et al., 2020). Notably, we found that ANXA9 expression was significantly negatively correlated with the infiltration level of CD8+ T cells (Figure 7B). It has been suggested that CD8+ T cells could produce interferon Gamma (IFNG) and introduce the expression of PD-1/PD-L1, resulting in antitumor immunity (Ribas & Hu-Lieskovan, 2016). Therefore, these finding implies that the ANXA9 low expression group might have a stronger tumor immunosuppressive environment.
We further investigated the DNA methylation level of ANXA9 and the correlation between CNV and expression of ANXA9 expression, and found that there was a negative correlation between ANXA9 expression and the methylation of CpG and promoter regions, and ANXA9 expression positively correlated with its CNV (Fig. 8). Therefore, the DNA methylation and CNV might affect the expression of ANXA9.
Ultimately, we also found ANXA9 might affect the survival of GC by affecting ANXA9-related genes, which can regulating actin filament bundle assembly, skeletal muscle contraction, cell-cell adhesion, Rho protein signal transduction, and cellular response to hyperoxia.
Conclusion
This study found that ANXA9 expression significantly increased in GC samples compared to normal tissues and the ANXA9 high expression group showed a higher survival probability. Moreover, the present study also revealed that increasing the expression of ANXA9 might improve GC prognosis by protecting against the immunosuppressive environment of GC. Furthermore, the expression change of ANXA9 might be caused by the DNA methylation and CNV ANAXA9. In a word, this study revealed the potential role of ANXA9 in GC immunology and prognosis, which might contribute to the further understanding of the possible molecular mechanism of GC and lead to improved GC treatments. However, more studies are needed to further illustrate the specific regulatory mechanisms of ANXA9.