
Desulfovibrio is not always associated with adverse health effects in the Guangdong Gut Microbiome Project
- Published
- Accepted
- Received
- Academic Editor
- Michael LaMontagne
- Subject Areas
- Bioinformatics, Microbiology, Molecular Biology, Gastroenterology and Hepatology
- Keywords
- Desulfovibrio, Gut microbiota, Correlation, Host parameters, Microbial community
- Copyright
- © 2021 Chen et al.
- Licence
- This is an open access article distributed under the terms of the Creative Commons Attribution License, which permits unrestricted use, distribution, reproduction and adaptation in any medium and for any purpose provided that it is properly attributed. For attribution, the original author(s), title, publication source (PeerJ) and either DOI or URL of the article must be cited.
- Cite this article
- 2021. Desulfovibrio is not always associated with adverse health effects in the Guangdong Gut Microbiome Project. PeerJ 9:e12033 https://doi.org/10.7717/peerj.12033
Abstract
Desulfovibrio (DSV) is frequently found in the human intestine but limited knowledge is available regarding the relationship between DSV and host health. In this study, we analyzed large-scale cohort data from the Guangdong Gut Microbiome Project to study the ecology of DSV and the associations of DSV and host health parameters. Phylogenetic analysis showed that Desulfovibrio piger might be the most common and abundant DSV species in the GGMP. Predominant sub-OTUs of DSV were positively associated with bacterial community diversity. The relative abundance of DSV was positively correlated with beneficial genera, including Oscillospira, Coprococcus,Ruminococcus,Akkermansia, Roseburia,Faecalibacterium, andBacteroides, and was negatively associated with harmful genera, such as Clostridium,Escherichia,Klebsiella, and Ralstonia. Moreover, the relative abundance of DSV was negatively correlated with body mass index, waist size, triglyceride levels, and uric acid levels. This suggests that DSV is associated with healthy hosts in some human populations.
Introduction
Desulfovibrio (DSV) species are Gram negative species characterized by the ability to reduce sulphate to hydrogen sulfide in anaerobic respiration of organic matter (Gibson, Macfarlane & Cummings, 1988; Liamleam & Annachhatre, 2007). DSV species are widespread in natural environments (Gibson, Macfarlane & Cummings, 1988). In humans, DSV species can colonize the intestine, where high levels of organic nitrogen compounds support their growth (Gibson, Macfarlane & Cummings, 1988). Willis et al. (1997) found that human intestinal DSV could use alternative electron acceptors like sulfite, thiosulfate and nitrate, suggesting that sulfite, thiosulfate and nitrate in the diet could also influence the abundance of DSV.
Some DSV species are associated with disease. For example, Yachida et al. (2019) reported that Desulfovibrio vietnamensis and D. longreachensis increased in stage III/IV and stage 0 colorectal cancers, respectively. Bellocchi et al. (2018) reported that the gut microbiota of patients with systemic sclerosis was characterized by increased proinflammatory noxious genera, especially DSV. Crusell et al. (2018) reported that DSV abounded in women with gestational diabetes. Gobert et al. (2016) reported that DSV was higher in the gut microbiota of patients with constipated-predominant irritable bowel syndrome than in healthy people. Karlsson et al. (2012) reported that DSV was significantly lower in obese and overweight children than in normal-weight children. In contrast, Rowan et al. (2010) reported that the relative DSV load was associated with acute ulcerative colitis. Conversely, Hirano et al. (2018) reported fewer DSV at the inflammatory site of ulcerative colitis patients (n = 14) compared with the corresponding site of non-inflammatory bowel disease control (n = 14).
These contradictions may reflect sample size, inappropriate study subjects and the lack of subject health parameters. This suggests the need for large-scale cohort analysis.
In this study, we analyzed the gut microbiota data from the Guangdong Gut Microbiome Project (GGMP). This extensive gut microbiota dataset (He et al., 2018) contains 7009 individuals from 14 districts within Guangdong Province, China. We studied the prevalence and variation of DSV and the relationship between DSV and intestinal microbial community profile and evaluated the links between DSV and host parameters. Our results show that DSV was associated with healthy hosts in the GGMP dataset.
Material and Methods
Data acquisition and processing
Data acquisition and processing were applied as previously described for the GGMP (Chen et al., 2020). He et al. (2018) previously detailed and introduced GGMP. DNA was extracted from stool samples, and PCR amplification of the 16S rRNA V4 region and sequencing were conducted as described. Raw sequence data for the 16S rRNA gene are available from the European Nucleotide Archive at accession number PRJEB18535. These short reads were processed in the QIIME 2 framework using the Deblur denoising algorithm as previously described (Chen et al., 2020). A total of 6376 samples were remaining in the Deblur BIOM table for the follow-up analysis. Metadata for these samples can be found at https://www.nature.com/articles/s41591-018-0164-x. Deblur denoised sequences were assigned to bacterial features, which are almost equal to sub-OTUs (Wang et al., 2019). Taxonomic profiling of bacterial sub-OTUs was accomplished using the Greengenes reference database (version 13_8) as previously described (Chen et al., 2020).
Phylogenetic analysis
Complete 16S rRNA gene sequences of six DSV type strains and two Desulfobacter type strains were obtained from the National Center for Biotechnology Information (NCBI). The V4 region of the 16S rRNA gene sequence was amplified with the barcoded V4 primers used for the GGMP (forward primer: 5′-GTGYCAGCMGCCGCGGTAA-3′, reverse primer: 5′-GGACTACNVGGGTWTCTAAT-3′) (He et al., 2018; Walters et al., 2016). We constructed a phylogenetic tree based on the V4 region gene sequences using MEGA 5, including eight predominant features of DSV (defined as a feature detected in more than 1% of all samples), six DSV-type strains (D. piger ATCC29098, D. fairfieldensis ATCC70045, D. desulfurians ATCC27774, D. legallii strain H1, D. vulgaris DSM644, and D. intestinalis strain KMS2), and two Desulfobacter type strains (Desulfobacter postgatei DSM2034 and Desulfobacter vibrioformis B54). GenBank accession numbers for each type strain are available in Table S1. The phylogenetic tree was constructed using MEGA (version 5.05) by neighbor-joining (ref). The test of phylogeny was performed using the bootstrap method, and the number of bootstrap replications was 1000. The gaps/missing data treatment was a complete deletion. Sequence alignment was calculated using the BLAST search at NCBI (https://blast.ncbi.nlm.nih.gov/Blast.cgi).
To further show the phylogenetic relationship of DSV features, we also constructed a tree based on the gene sequences of eight predominant features of DSV, and their best matches. This tree includes the V4 region gene sequences of eight predominant features of DSV, and the sequences of twenty strains. The parameters and model for this tree were same as above.
Biostatistics analysis
To reveal the associations of DSV and predominant genera (defined as a genus with mean relative abundance above one percent) and the associations between predominant DSV features, we conducted a co-occurrence network analysis in R, as previously described (Chen et al., 2020). Spearman’s correlations were applied to each pair with FDR correction. Only significant correlations (FDR-adjusted P < 0.05) are shown.
Mann-Whitney U-tests were applied to compare DSV relative abundances in men and women, people with different BMI, normal waist and oversize waists, normal and elevated triglyceride (TG) levels, and normal and elevated uric acid (UA) levels. BMI and waist were classified on the basis of the Guidelines for Prevention and Control of Overweight and Obesity in Chinese adults. We classified TG levels on the basis of the Guidelines for the Prevention and Treatment of Dyslipidemia in Chinese adults. We classified UA levels according to the Chinese Guidelines for Diagnosis and Treatment of Hyperuricemia and Gout.
Kruskal-Wallis tests were performed to compute DSV relative abundance in seven Bristol stool types and at 14 geographical locations.
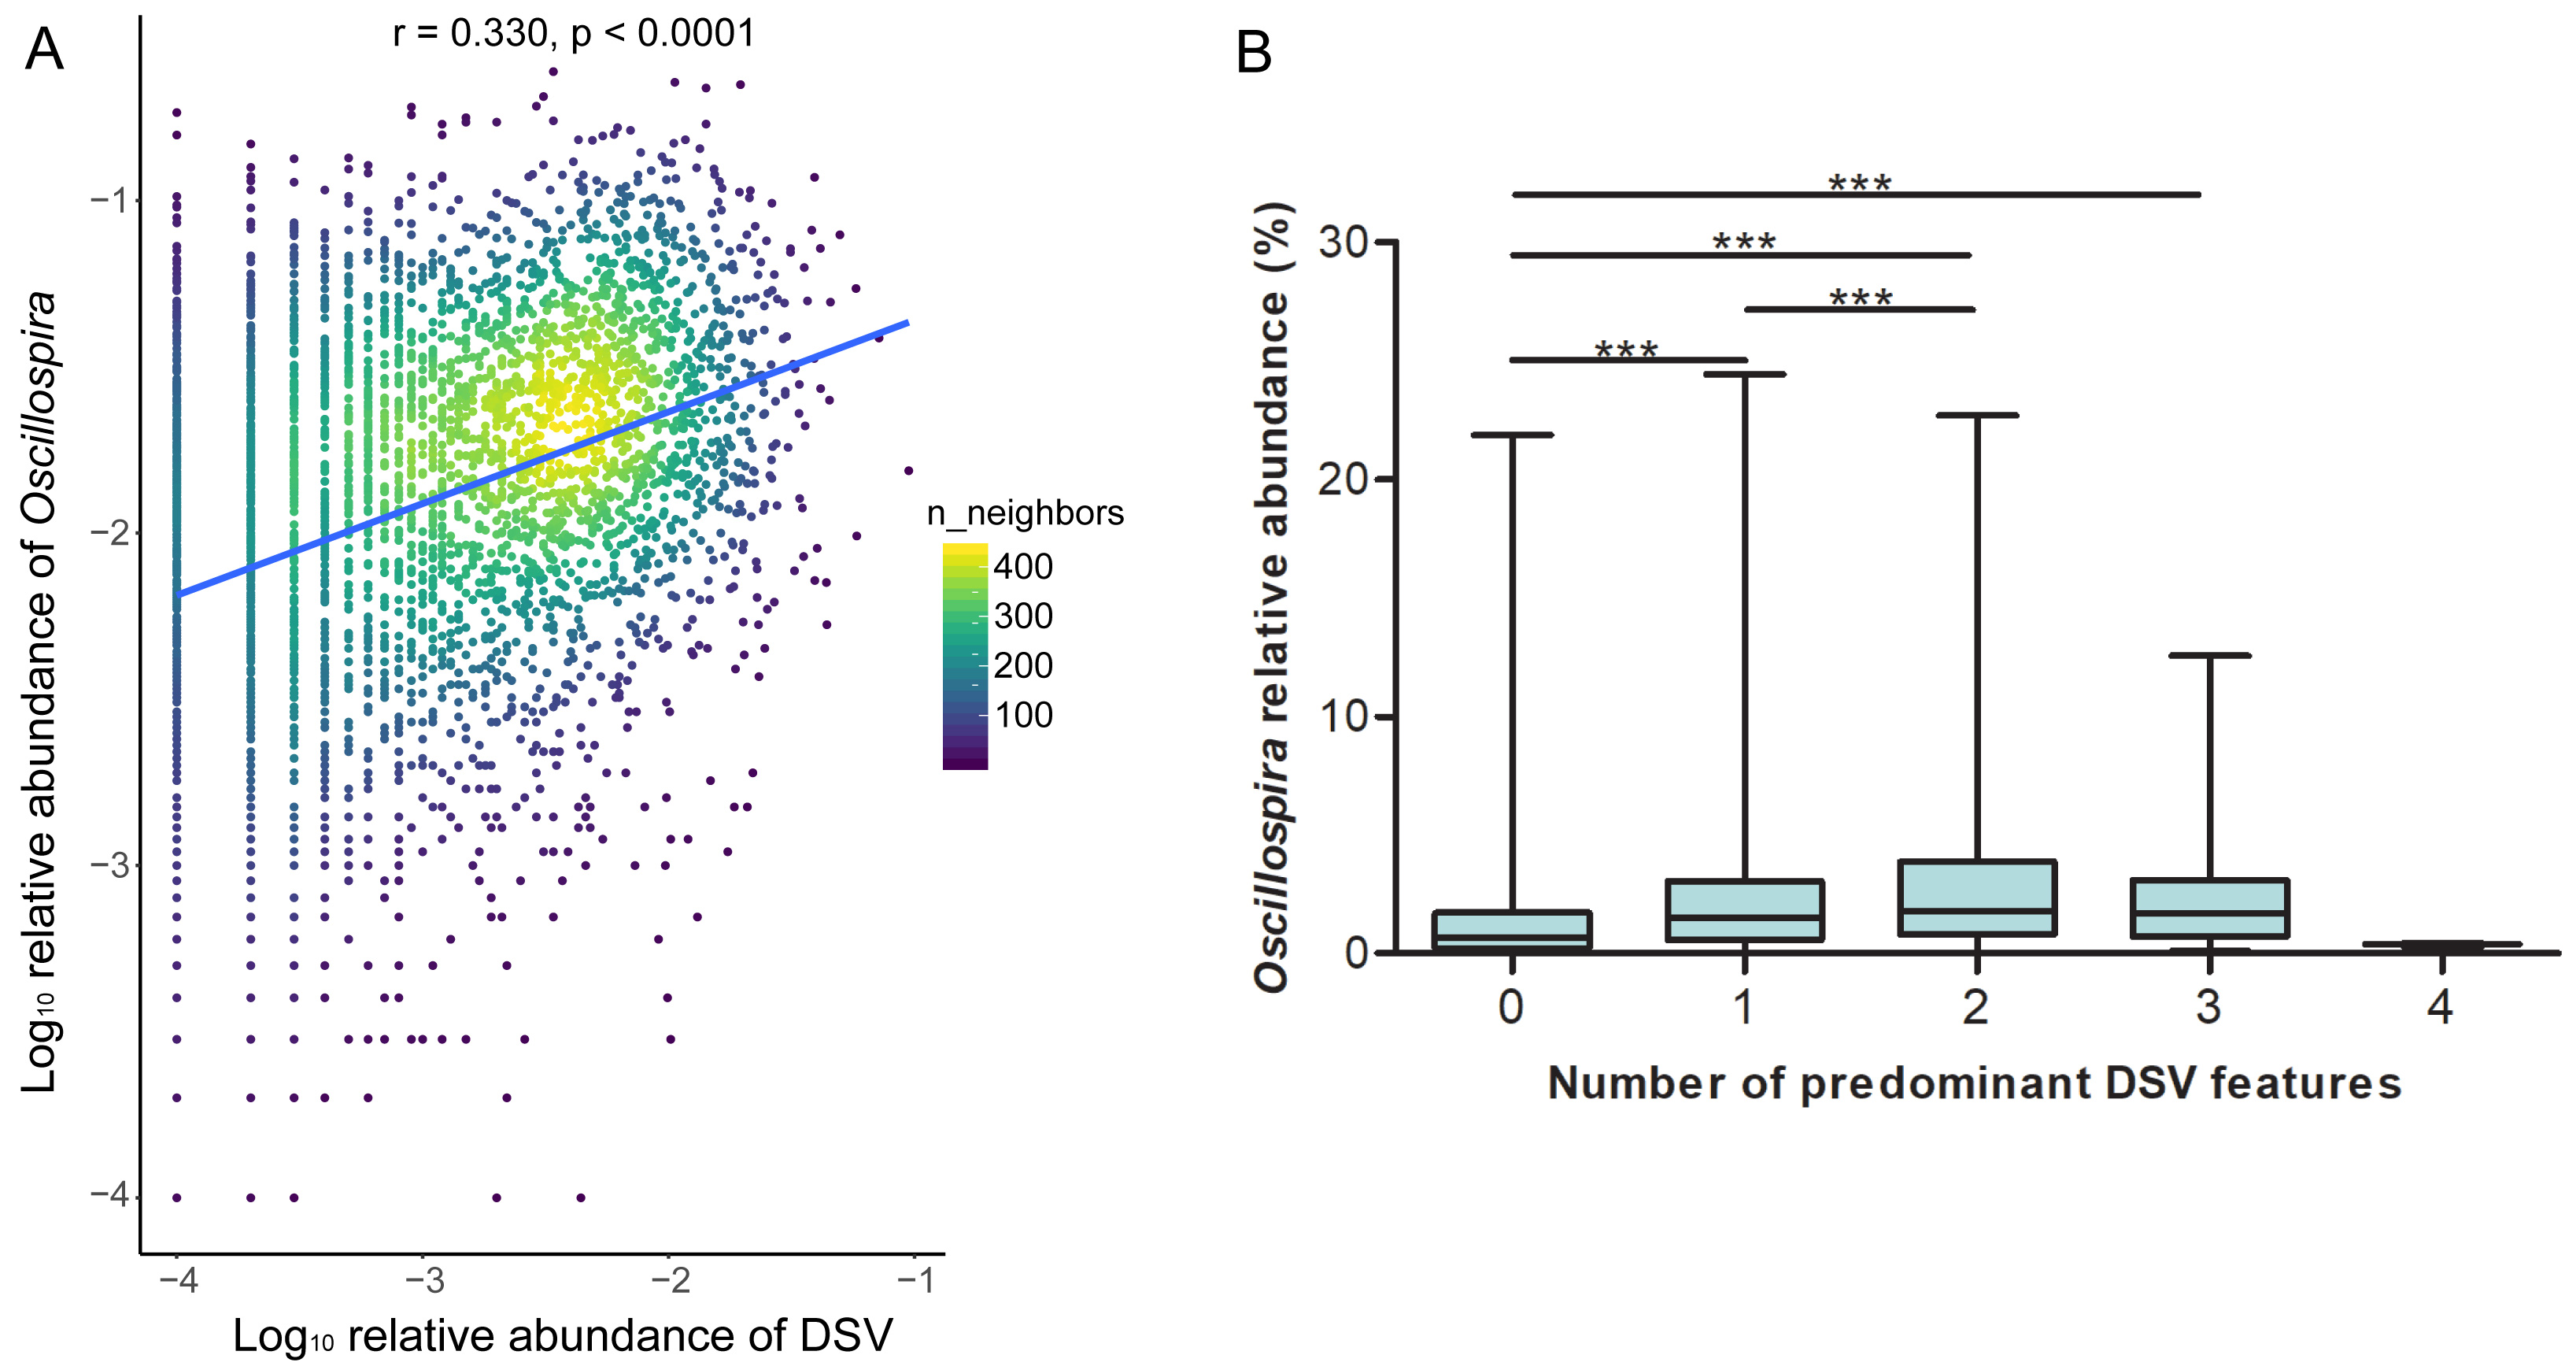
Correlations between Log10 relative abundance of DSV and α-diversity indices and correlations between the number of predominant DSV features and α-diversity indices were calculated by Spearman’s rank correlation test by SigmaPlot 13.0. Correlation between Log10 relative abundance of DSV and Log10 relative abundance of Oscillospira was calculated by Spearman’s rank correlation test and visualized using “ggpointdensity” (version 0.1.0) package. Correlations between DSV (at the genus and sub-OTU levels) and host metadata were calculated by Spearman rank correlation test, and FDR correction was conducted to adjust all p-values. A two-tailed p-value less than 0.05 was considered to have statistical significance for all analyses.
Results
Detection of Desulfovibrio in the GGMP samples
In total, we detected DSV in 3731 of 6376 gut microbiota. The mean relative abundance of the genus was 2‰. Seq14263 was the most prevalent. This sub-OTU was detected in 32% of all samples and accounted for 49% of the DSV-associated sequences (Table 1).
The mean relative abundance of eight predominant features ranged from 0.01‰ to 1.02‰ (Table 1 and Fig. 1A). Among the total samples, 2831 samples carried only one predominant DSV feature, and 814 samples carried two or more predominant features. The maximum number of predominant DSV features detected in a sample was four, and only two samples carried four predominant DSV features. Co-occurrence analysis at the sub-OTU level showed that Seq14263 was positively associated with Seq15128. Seq7611 was positively associated with Seq295. Seq12972 was not associated with other predominant DSV sub-OTUs (Fig. 1B).
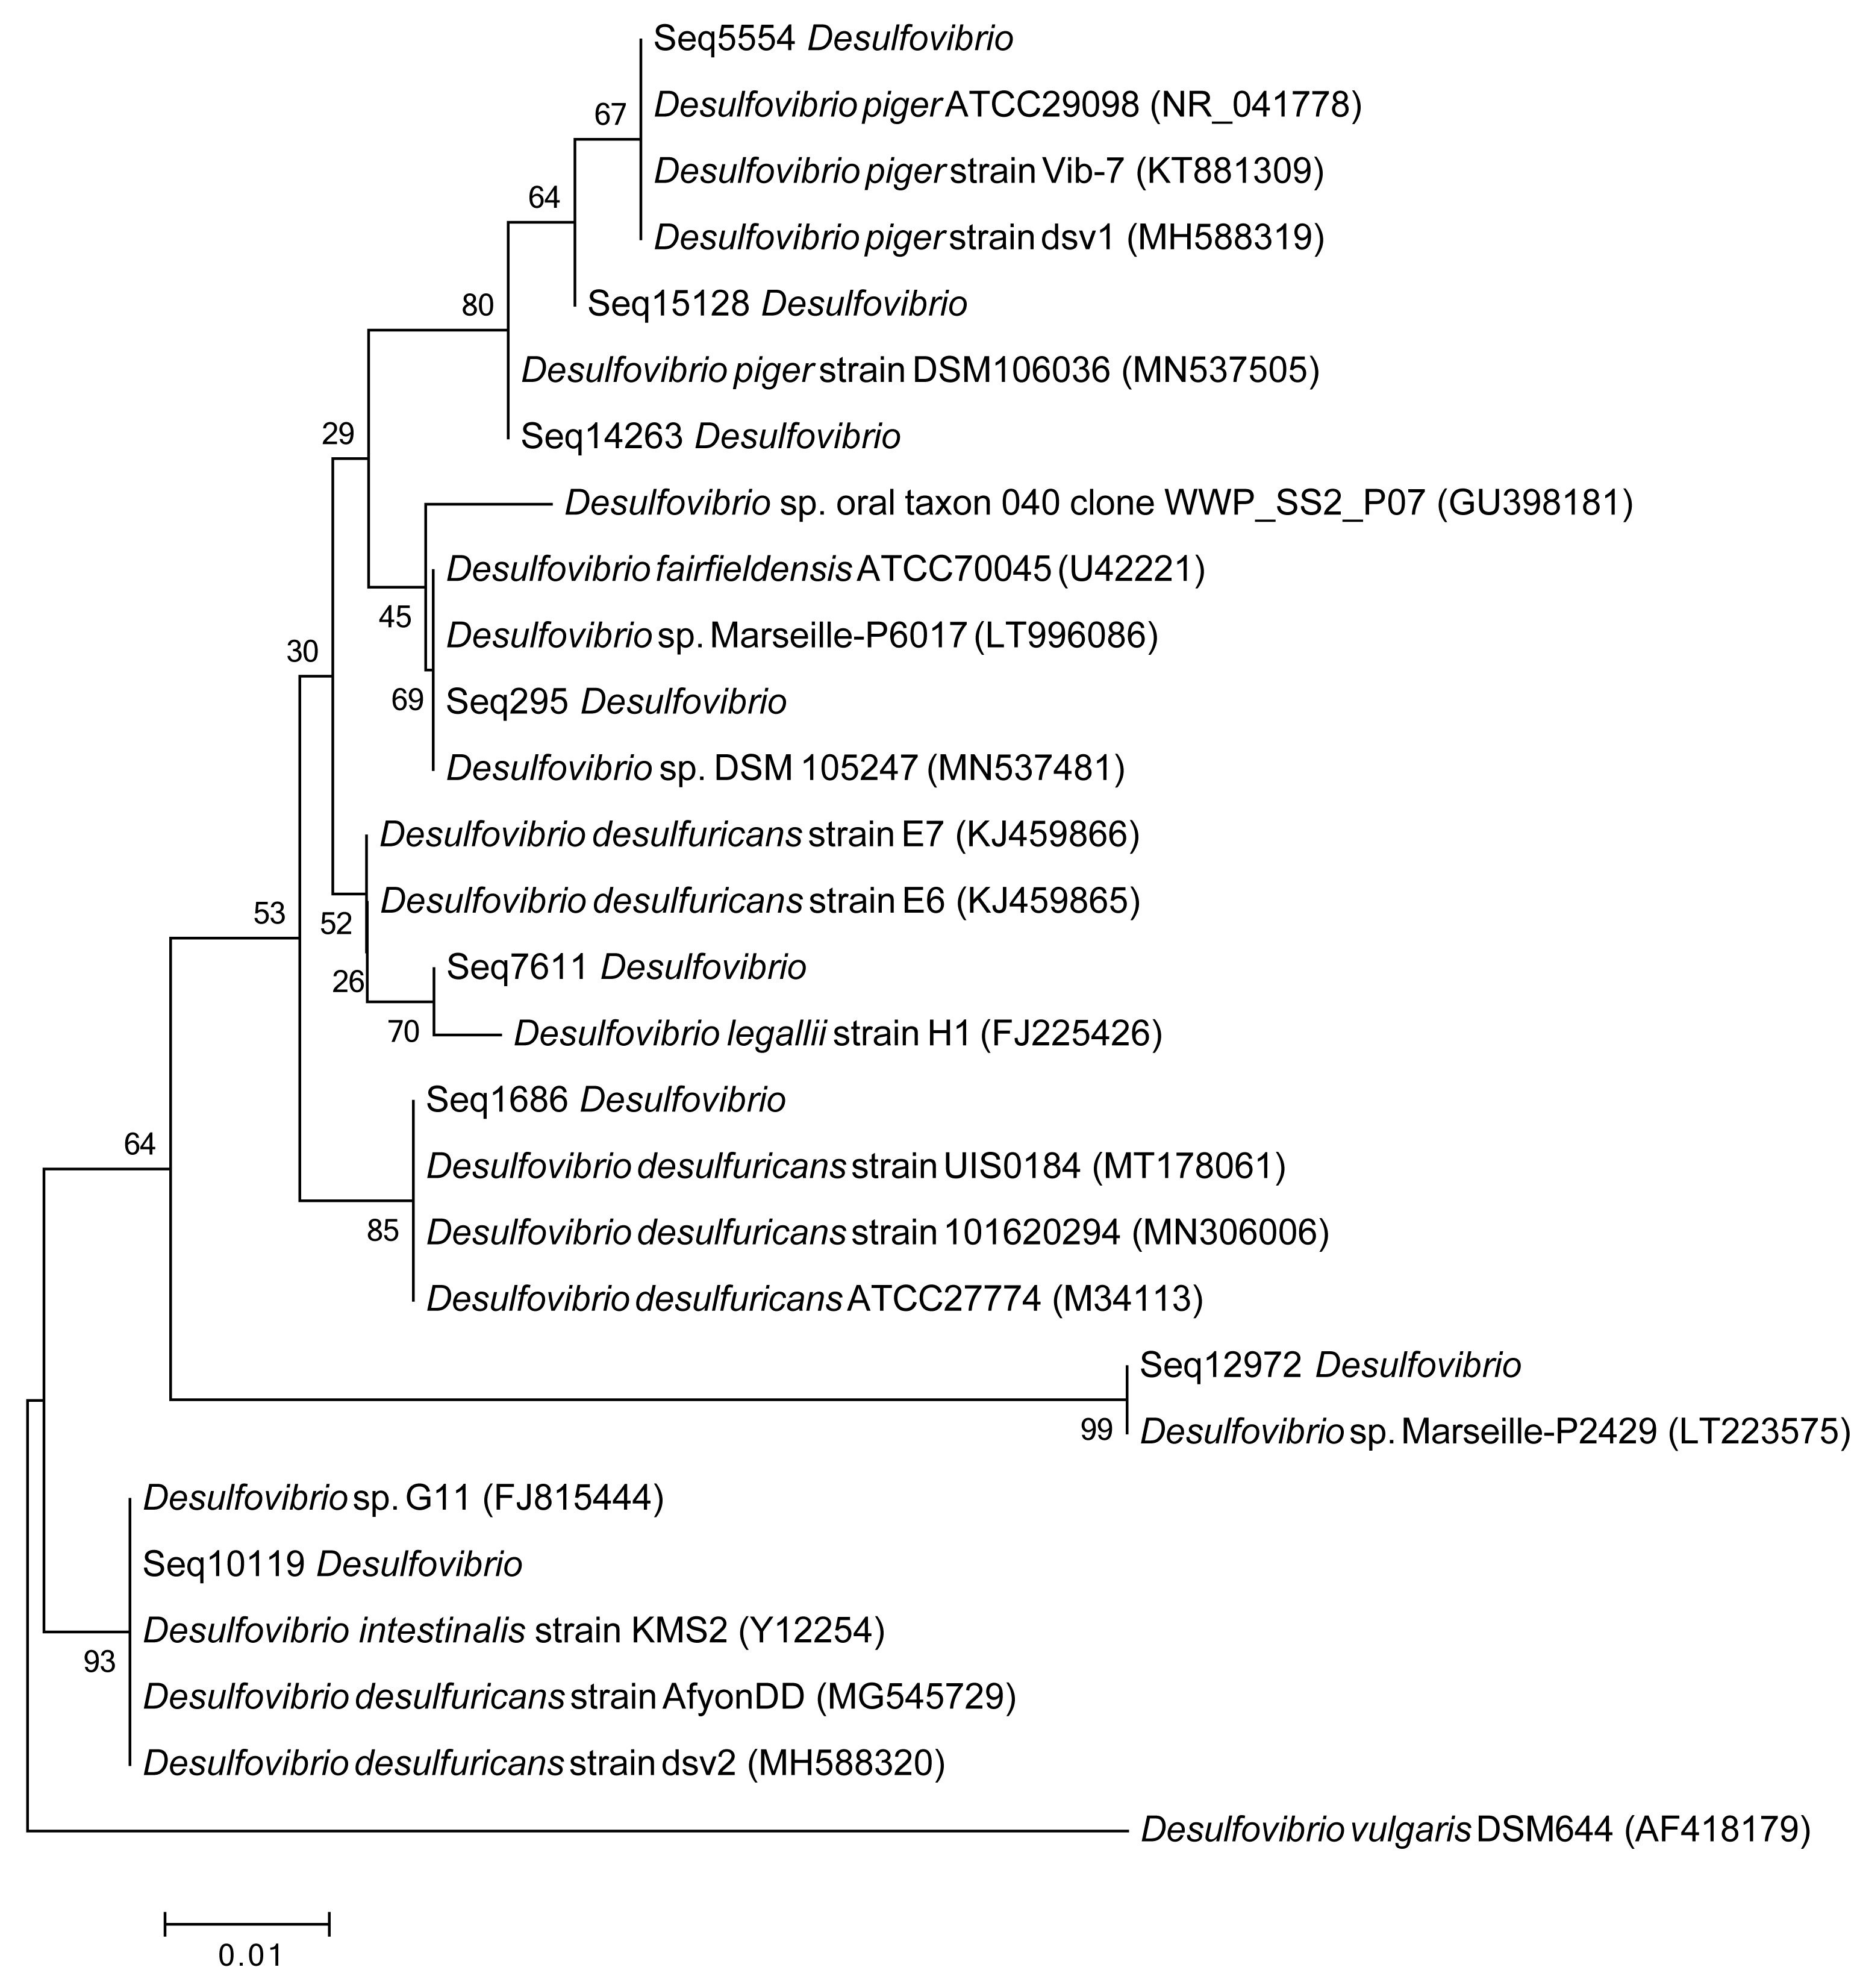
Phylogenetic analysis showed that D. piger might be the most common and abundant DSV species in the GGMP. The V4 regions of Seq295, Seq5554, Seq1686, and Seq10119 were 100% identical to that of D. fairfieldensis ATCC70045, D. piger ATCC29098, D. desulfuricans ATCC27774, and D. intestinalis strain KMS2, respectively. The V4 region of Seq12972 was not very similar (<93%, Table S3) to that of the six DSV type strains (Fig. 2). All the predominant sub-OTUs of DSV showed low similarity (<94%) to D. vulgaris DSM644 (Table S3), suggesting that it may be an uncommon strain in the GGMP.
A phylogenetic tree that includes the eight predominant features of DSV and twenty strains of DSV also showed that Seq14263, Seq15128 and Seq5554 clustered with D. piger strains with good (80%) bootstrap support (Fig. S1), suggesting that D. piger might be the most common and abundant DSV species. D. fairfieldensis, D. desulfuricans, D. legallii, D. vulgaris, and D. intestinalis were less prevalent in the GGMP.
Microbial community profile link with Desulfovibrio
The relative abundance of the genus of DSV was positively correlated with the microbiota α-diversity indices. As the Log10 relative abundance of the DSV genus increased, α-diversity also increased. The correlation between ascending α-diversity and DSV detection was positive when we examined α-diversity with Shannon, PD_whole_tree, and Observed sub-OTUs (Figs. 3A–3C). Spearman rank correlation analysis showed positive correlations between the number of predominant DSV features and Shannon, PD_whole_tree, and Observed sub-OTUs (Figs. 3D–3F).
| Feature ID | Prevalence of predominant DSV features | Percentage of DSV-associated sequences | Mean relative abundance of predominant DSV features |
|---|---|---|---|
| Seq14263 | 31.59% | 48.50% | 1.02 × 10⁻³ |
| Seq12972 | 12.14% | 24.45% | 0.51 × 10⁻³ |
| Seq5554 | 7.17% | 9.64% | 0.20 × 10⁻³ |
| Seq295 | 7.64% | 5.39% | 0.11 × 10⁻³ |
| Seq7611 | 3.98% | 4.96% | 0.10 × 10⁻³ |
| Seq15128 | 5.46% | 4.01% | 0.08 × 10⁻³ |
| Seq1686 | 1.71% | 0.51% | 0.01 × 10⁻³ |
| Seq10119 | 1.41% | 0.51% | 0.01 × 10⁻³ |
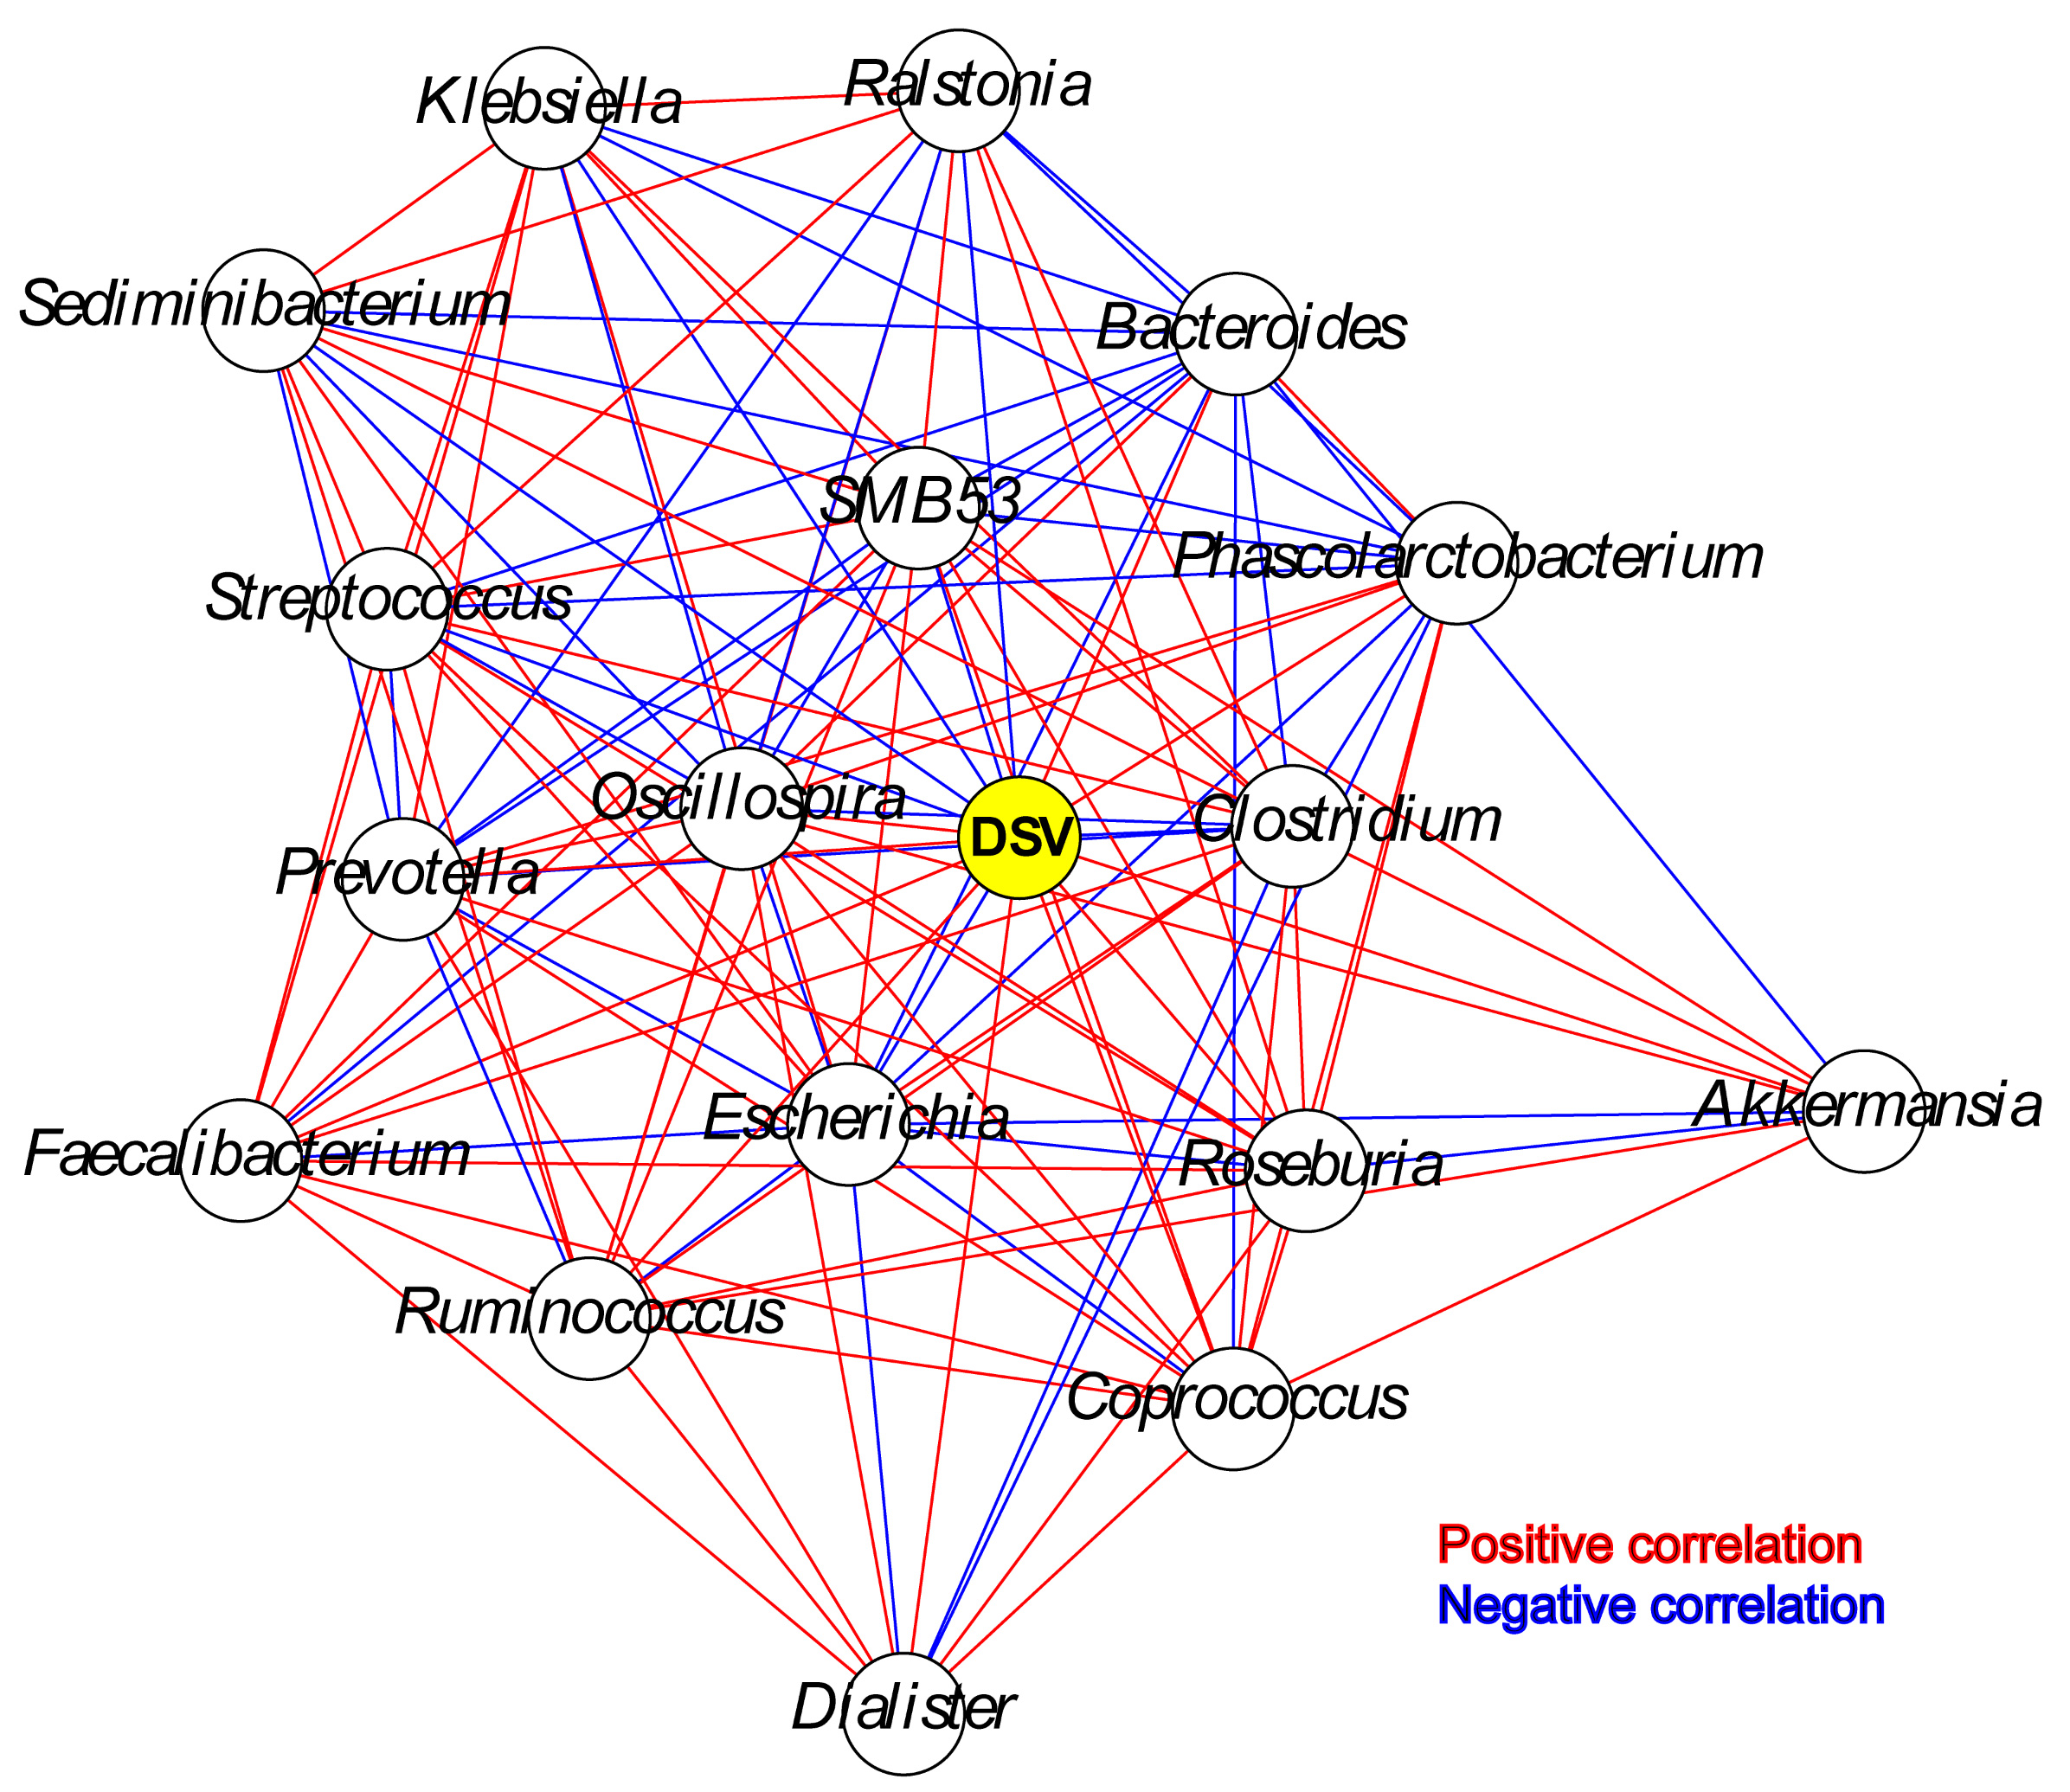
The relative abundance of DSV was positively correlated with beneficial genera, and was negatively correlated with harmful genera. The relative abundance of DSV was positively associated with Oscillospira, Phascolarctobacterium, Prevotella, Coprococcus, Dialister, Ruminococcus, Akkermansia, Roseburia, Faecalibacterium, and Bacteroides and negatively associated with Streptococcus, Ralstonia, Sediminibacterium, Clostridium, SMB53, Escherichia, and Klebsiella (Fig. 4, Fig. S2). Correlation between DSV and Oscillospira was the strongest among all the correlations (Fig. 4, Table S4). Log10 relative abundance of DSV was positively correlated with Log10 relative abundance of Oscillospira in the GGMP in samples that DSV and Oscillospira can both be detected (Fig. S3A).
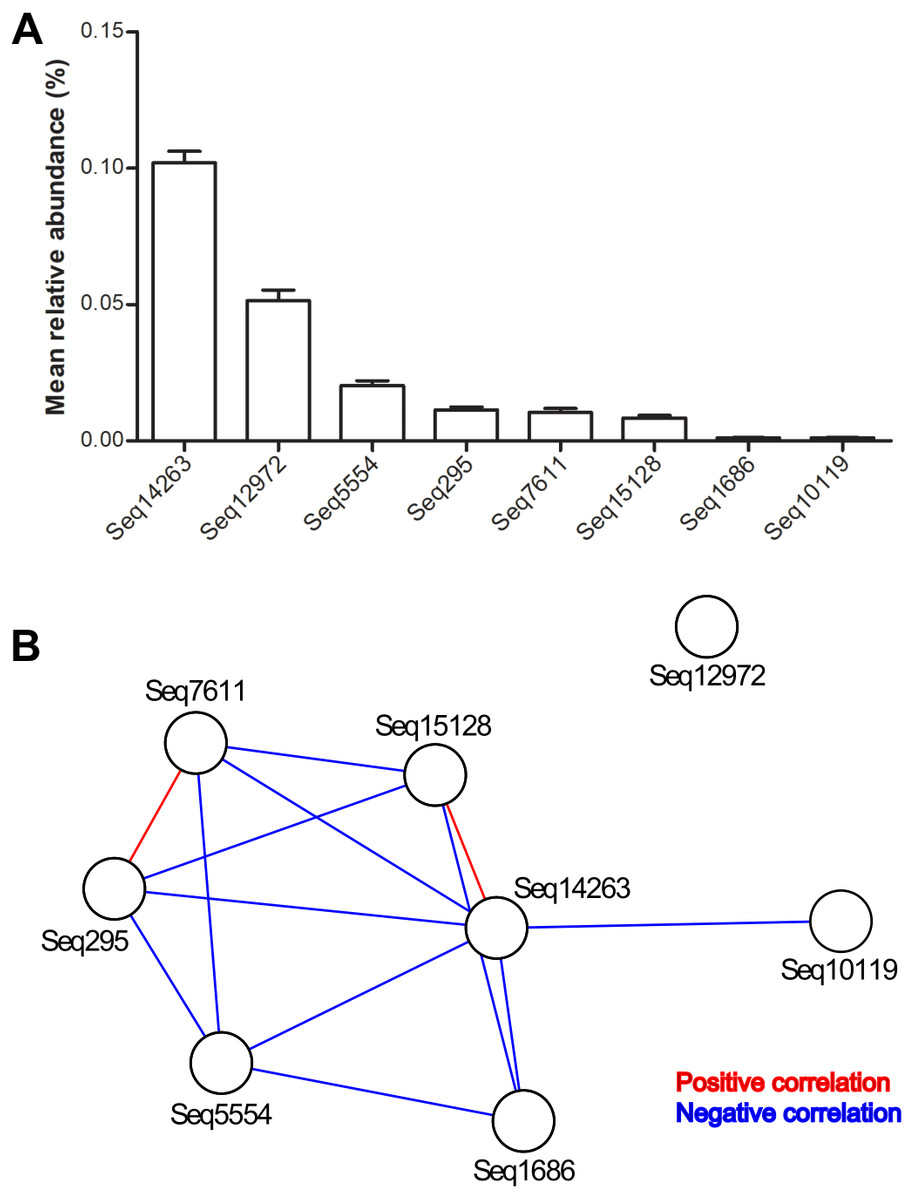
Figure 1: Relative abundances and internal associations of eight predominant DSV features.
(A) Relative abundances of predominant DSV features across all samples, plotted by GraphPad Prism 5; (B) internal associations of the predominant DSV features. Red lines represent positive associations; blue lines represent negative associations.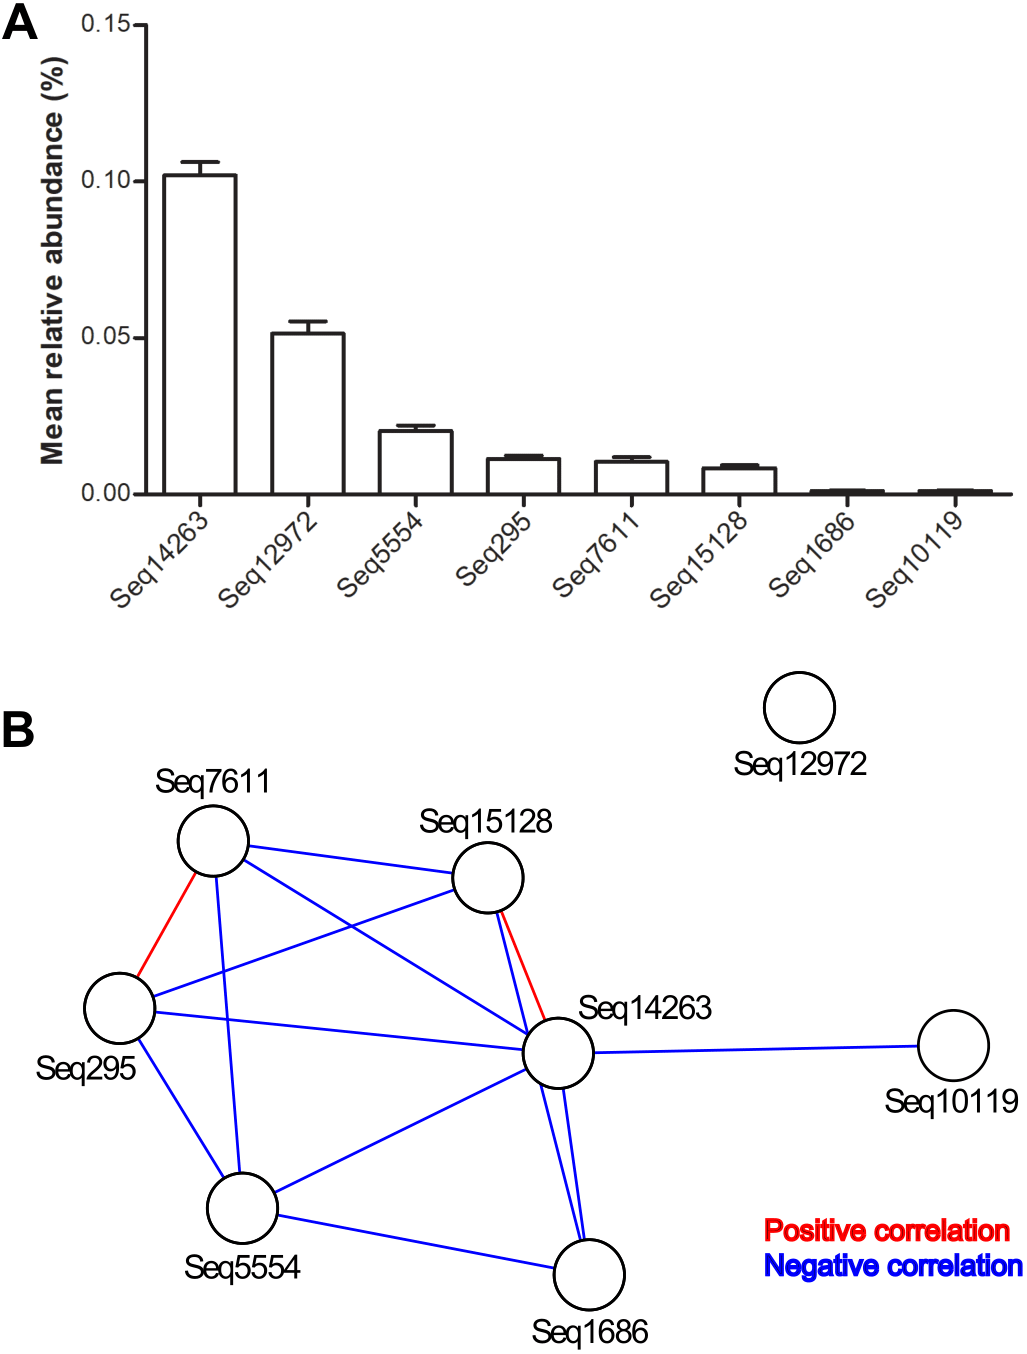
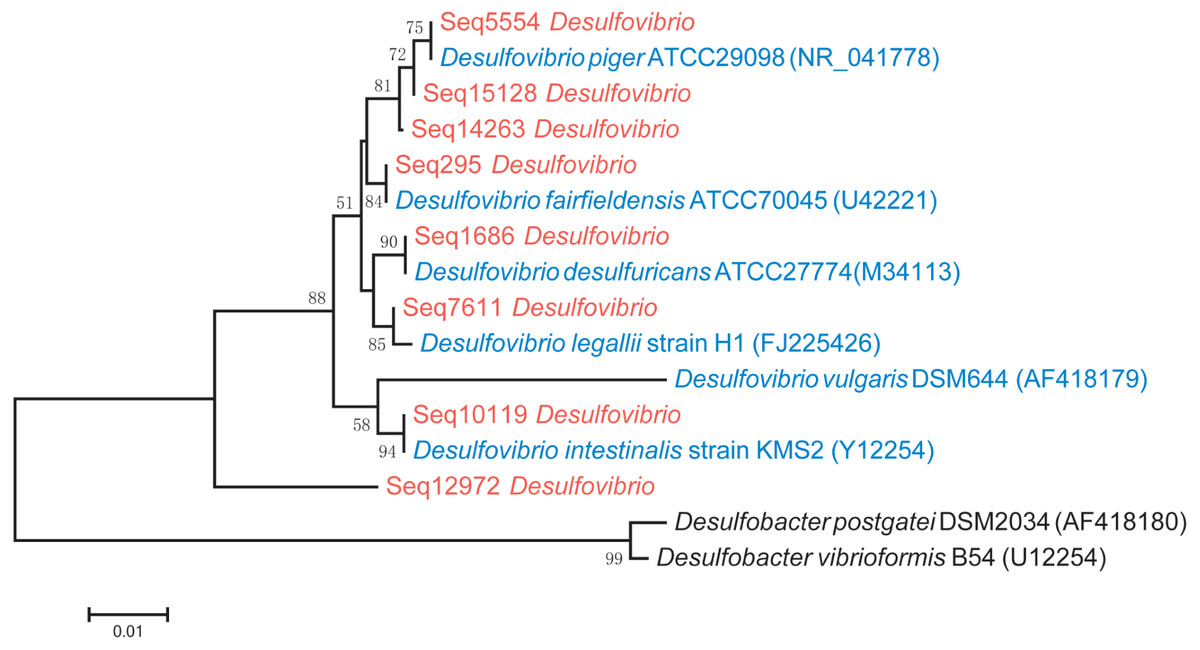
Figure 2: Phylogenetic tree of the eight predominant DSV features (marked in red), six typestrains of DSV (marked in blue) and two type strains of Desulfobacter (marked in black).
The tree was constructed based on 16S V4 region sequences.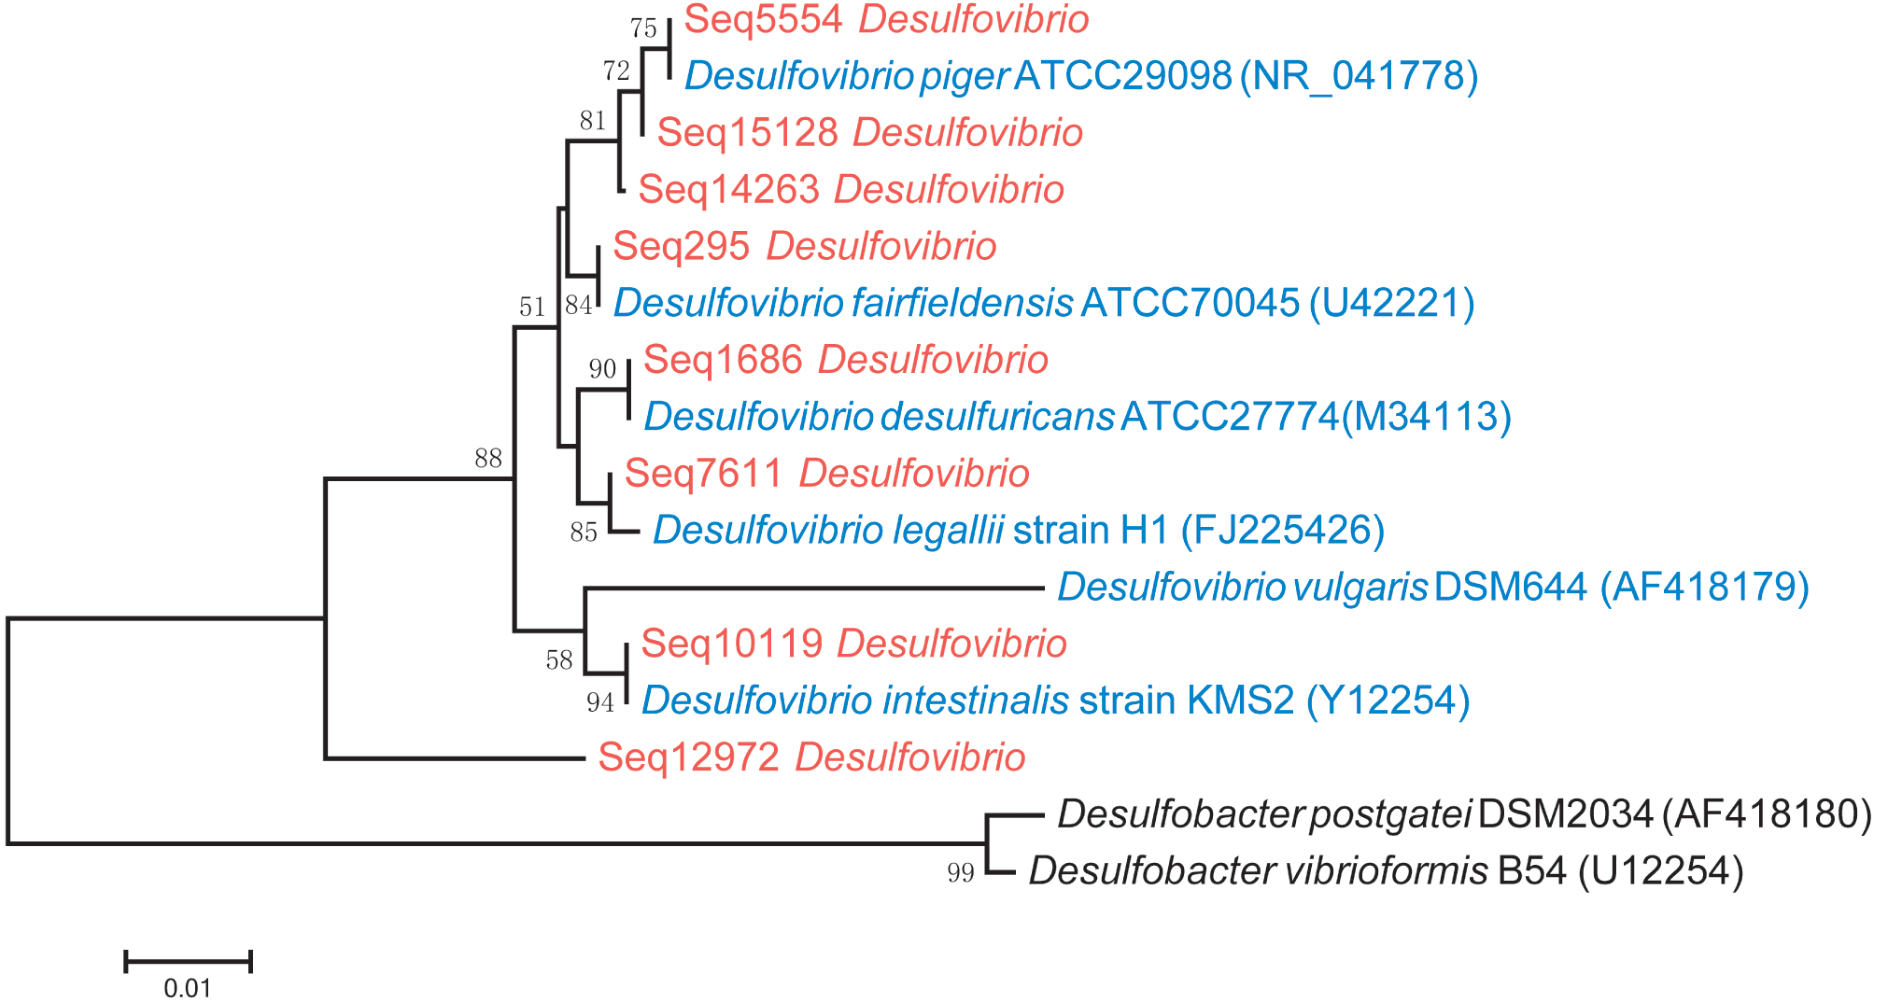
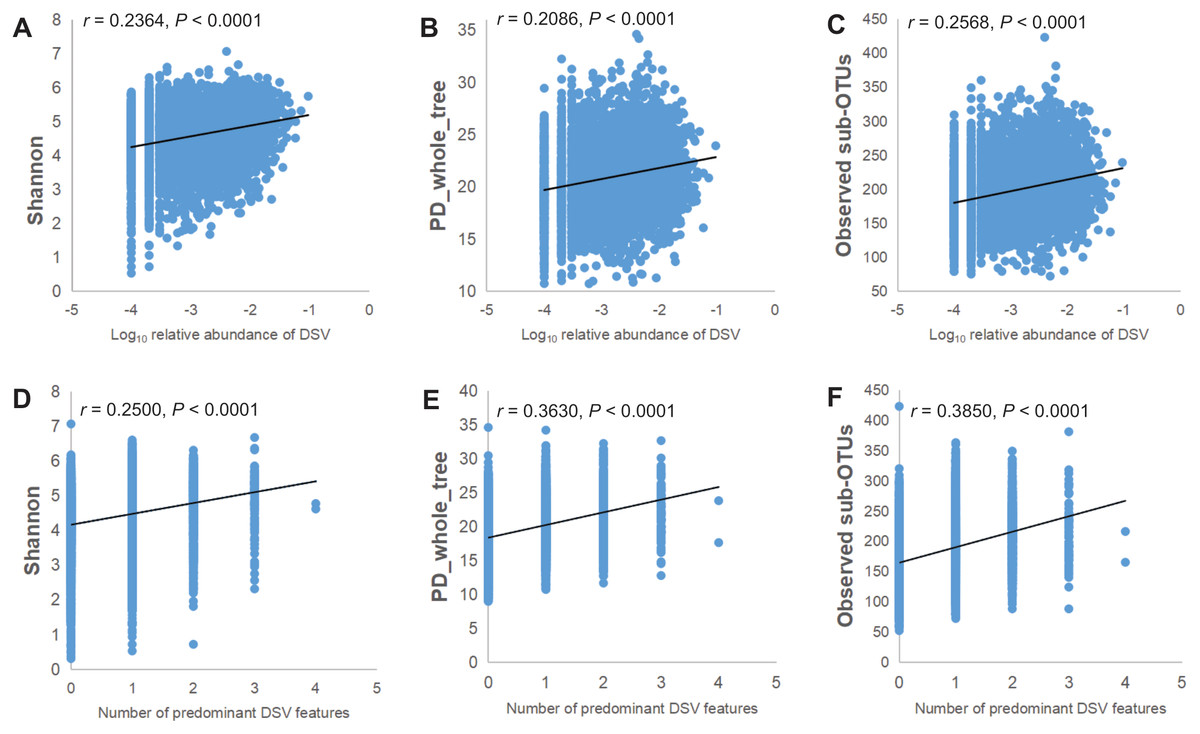
Figure 3: Microbial community α-diversity indices linked with DSV.
(A–C) Spearman rank correlations between Log10 relative abundance of DSV and Shannon index,PD_whole_tree index, and Observed sub-OTUs. (D–E) Spearman rank correlations between the number of predominant DSV features and Shannon index, PD_whole_tree index, and Observed sub-OTUs.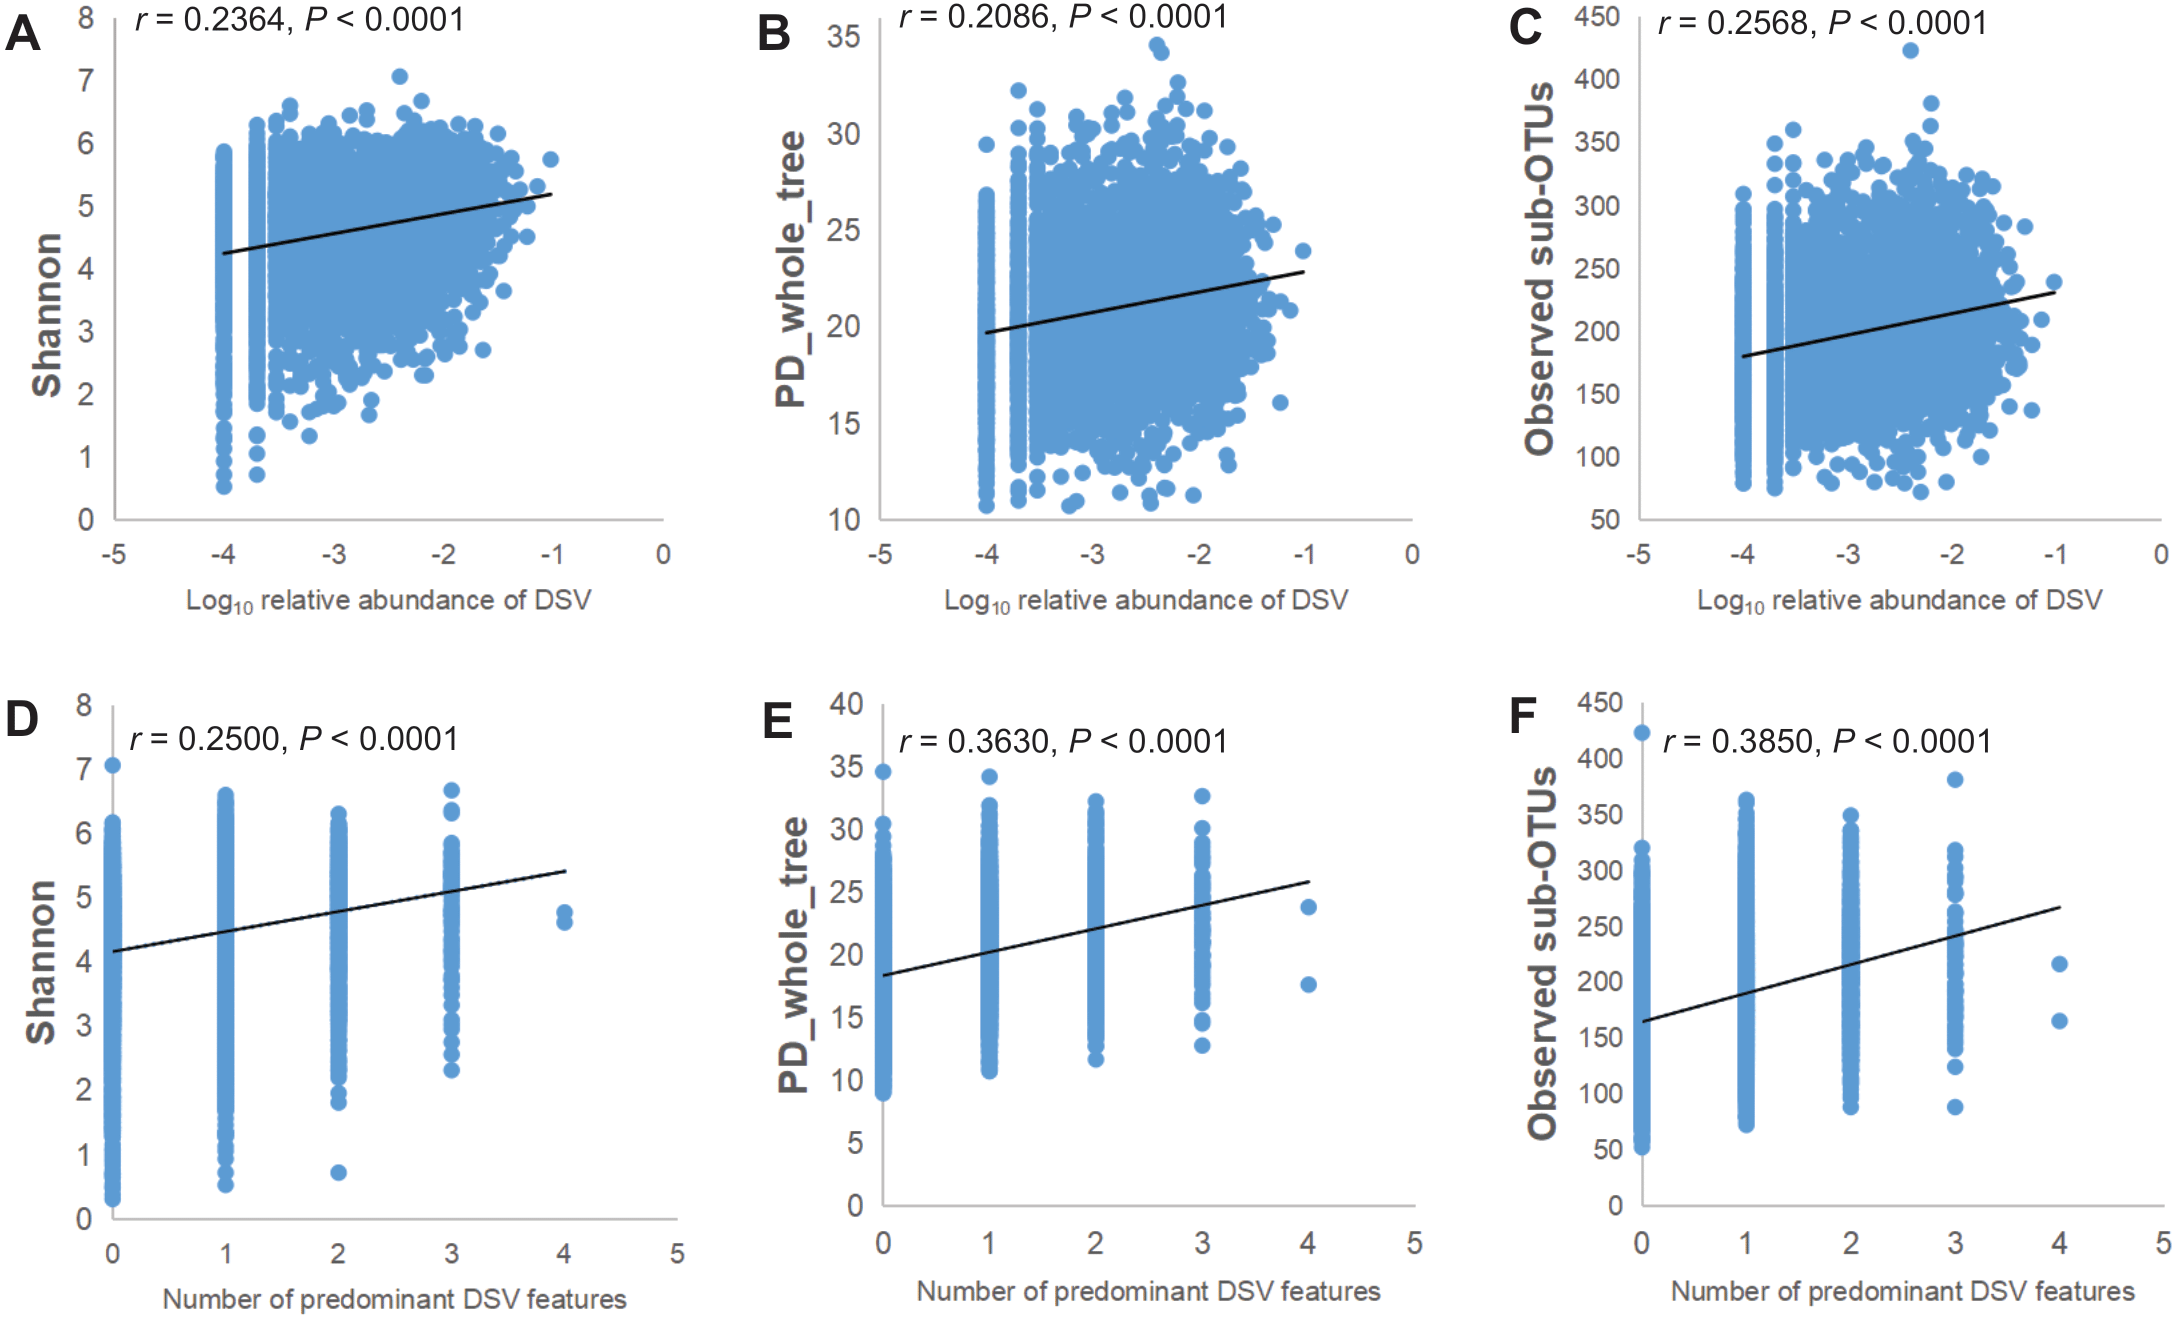
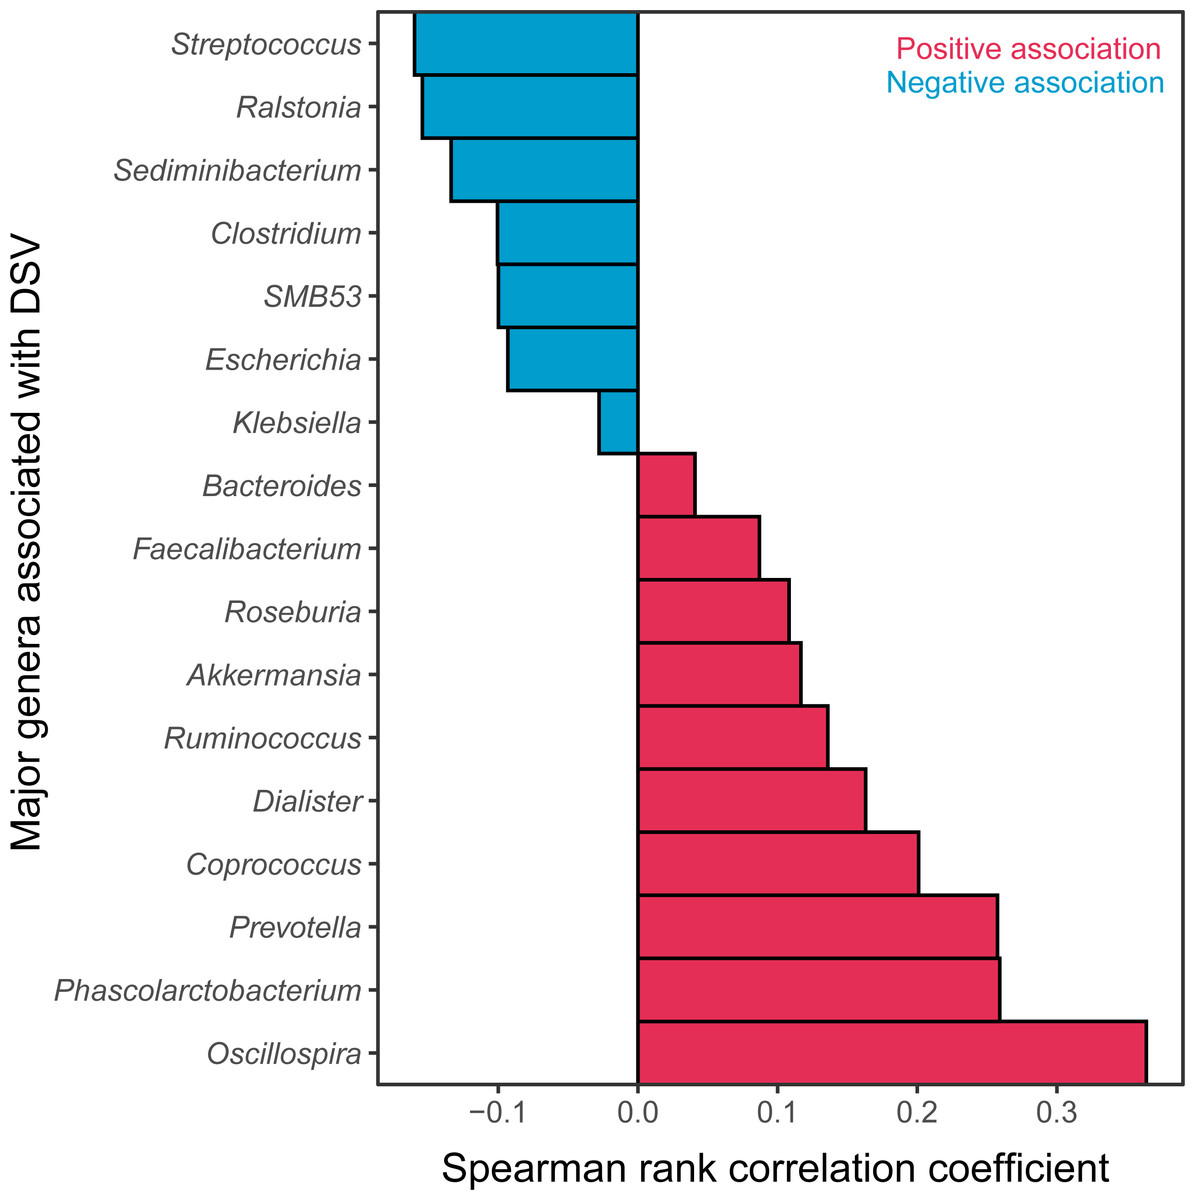
Figure 4: Major genera correlated with DSV.
Red represents positive correlations; blue represents negative correlations.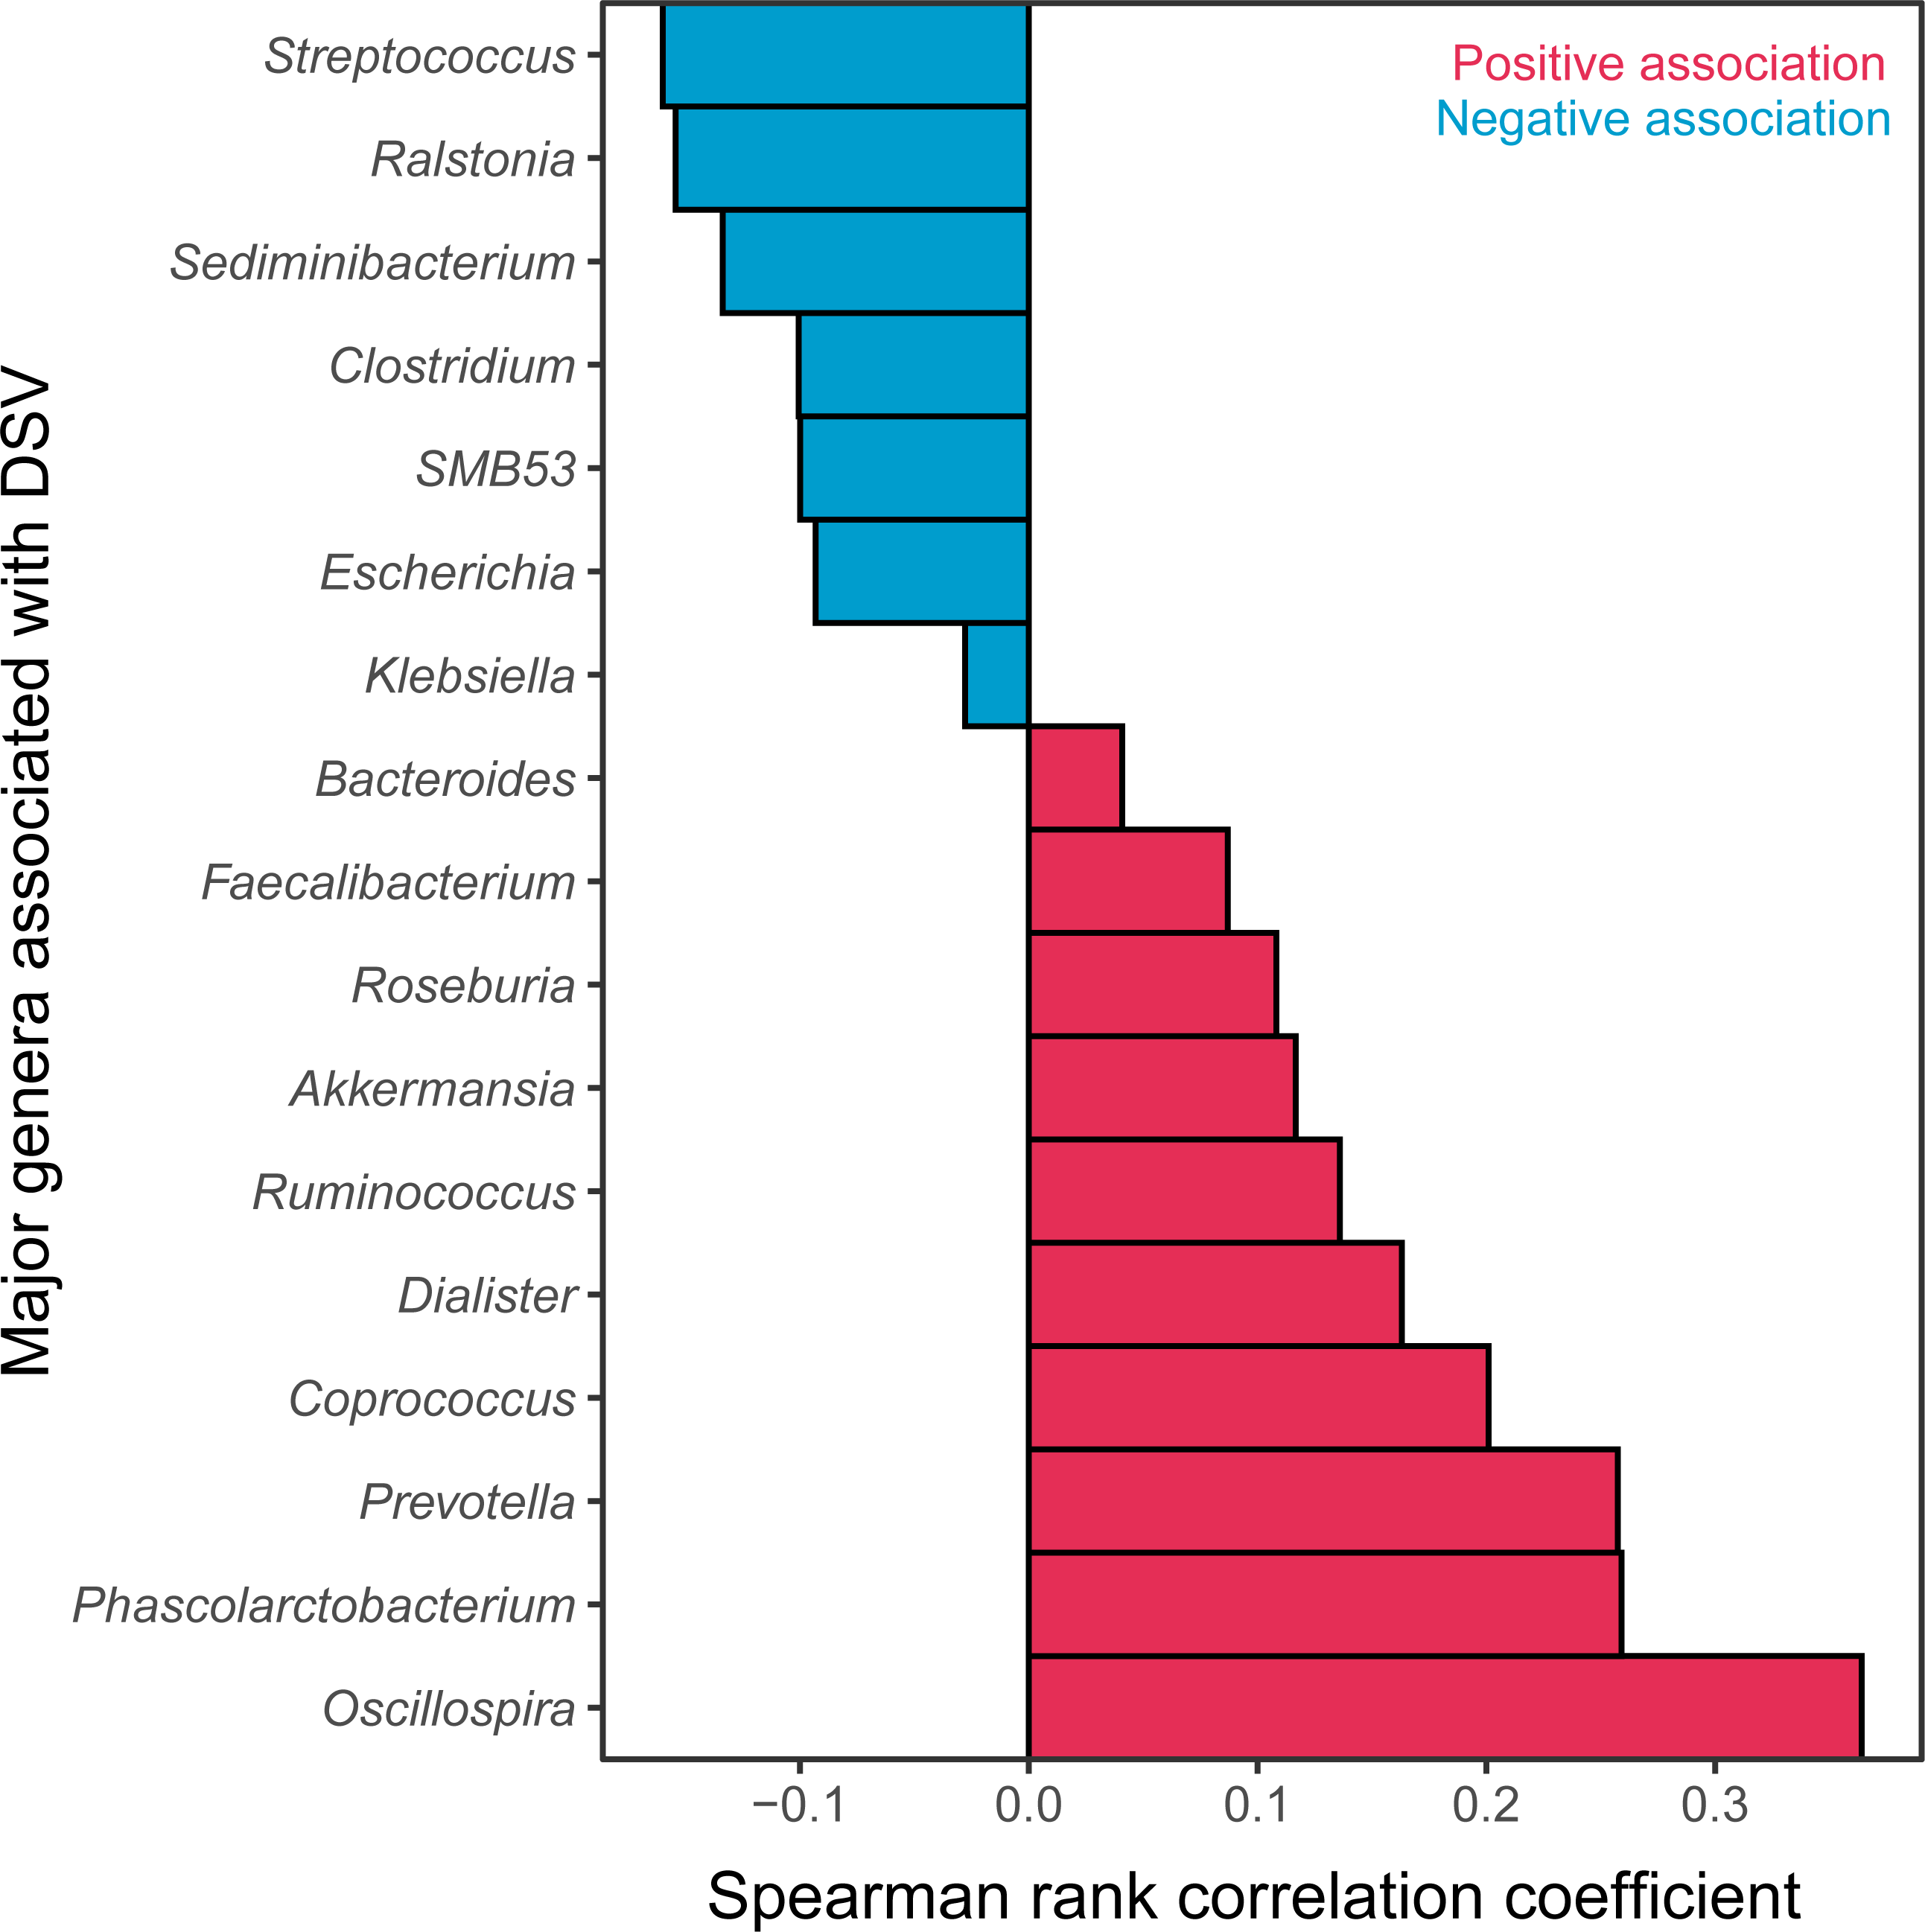
Host parameters linked to the detection of Desulfovibrio
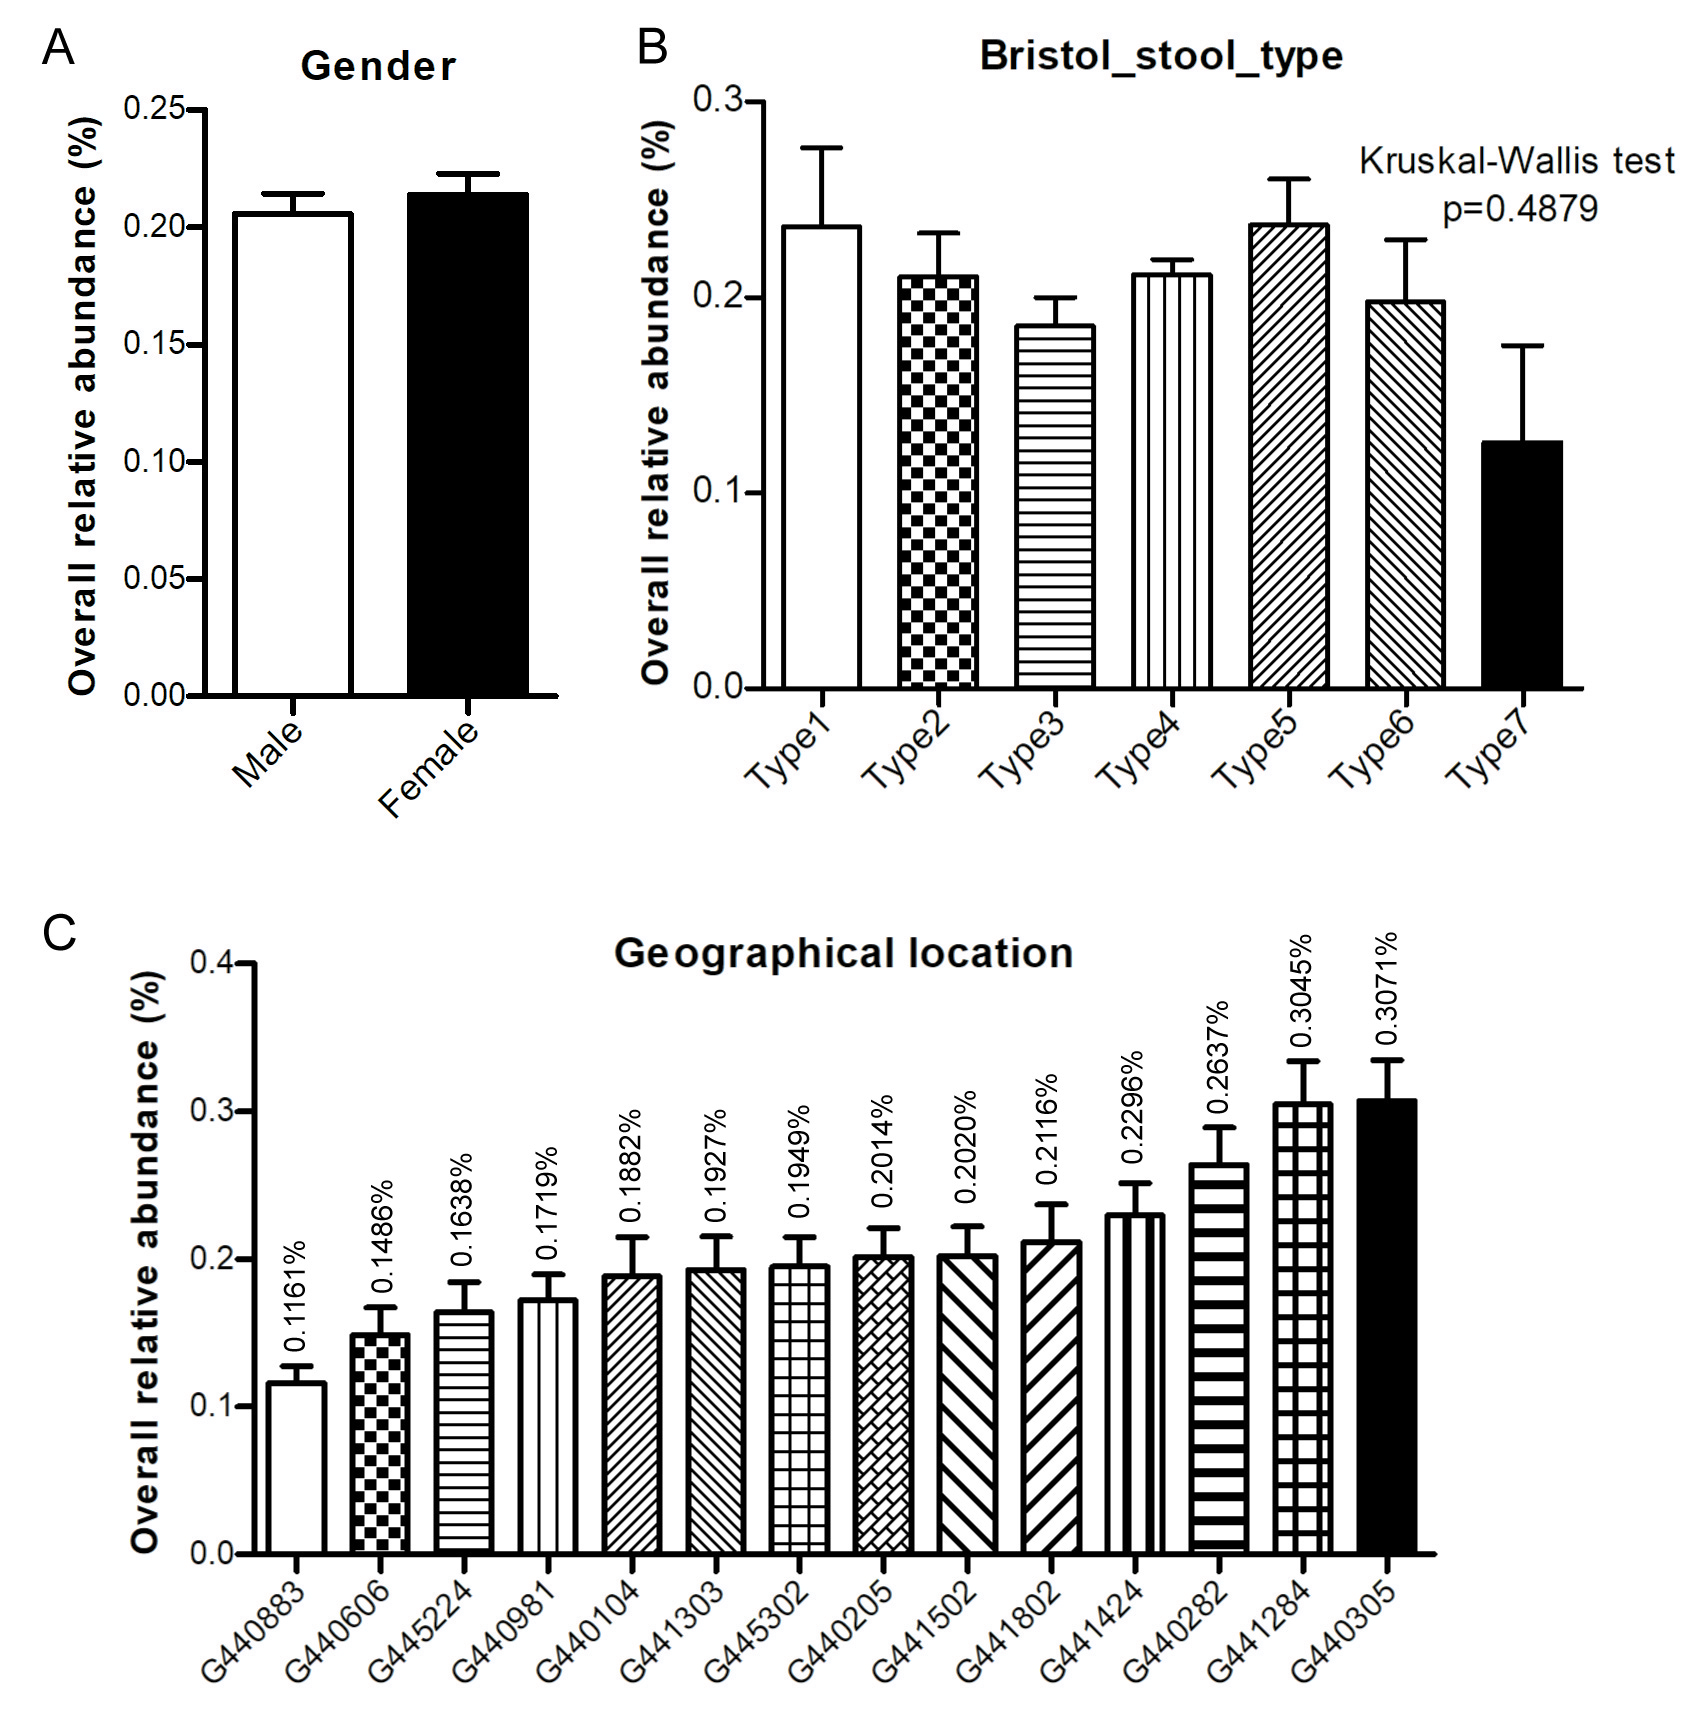
DSV relative abundance did not vary significantly with gender (P = 0.1559, Fig. S4A). The mean relative abundance of DSV was similar across samples with different Bristol stool types (P = 0.4879), ranging from 1.3‰ (type 7) to 2.4‰ (type 5) (Fig. S4B). There was a clear difference in the relative abundance of DSV among different geographical locations (P < 0.0001, Fig. S4C). DSV were most abundant in subjects from the Nanshan, Shenzhen (G440305), and least abundant in samples from subjects in the Wuchuan, Zhanjiang (G440883). The mean relative abundance of DSV ranged from 1.2‰ to 3.1‰ (Fig. S4C).
DSV relative abundances in people with normal weight (18.5 ≤ BMI < 24) and low BMI (BMI < 18.5) were significantly more abundant than those in overweight (24 ≤ BMI < 28) and obese (BMI ≥ 28) (Fig. 5A). Women and men with normal waist sizes had higher levels of DSV than those with oversized waists (P = 0.0197 and P = 0.0015, respectively; Fig. 5B). The mean relative abundance of DSV was 2.2‰ vs. 2.0‰ in women and 2.1‰ vs 1.9‰ in men with normal and oversized waists, respectively (Fig. 5B). People with normal TG had higher levels of DSV than those with elevated TG (2.2‰ vs. 2.0‰, P = 0.0031, Fig. 5C). People with normal UA had higher levels of DSV than those with excessive UA (2.2‰vs 1.8‰, P = 0.0074, Fig. 5D).
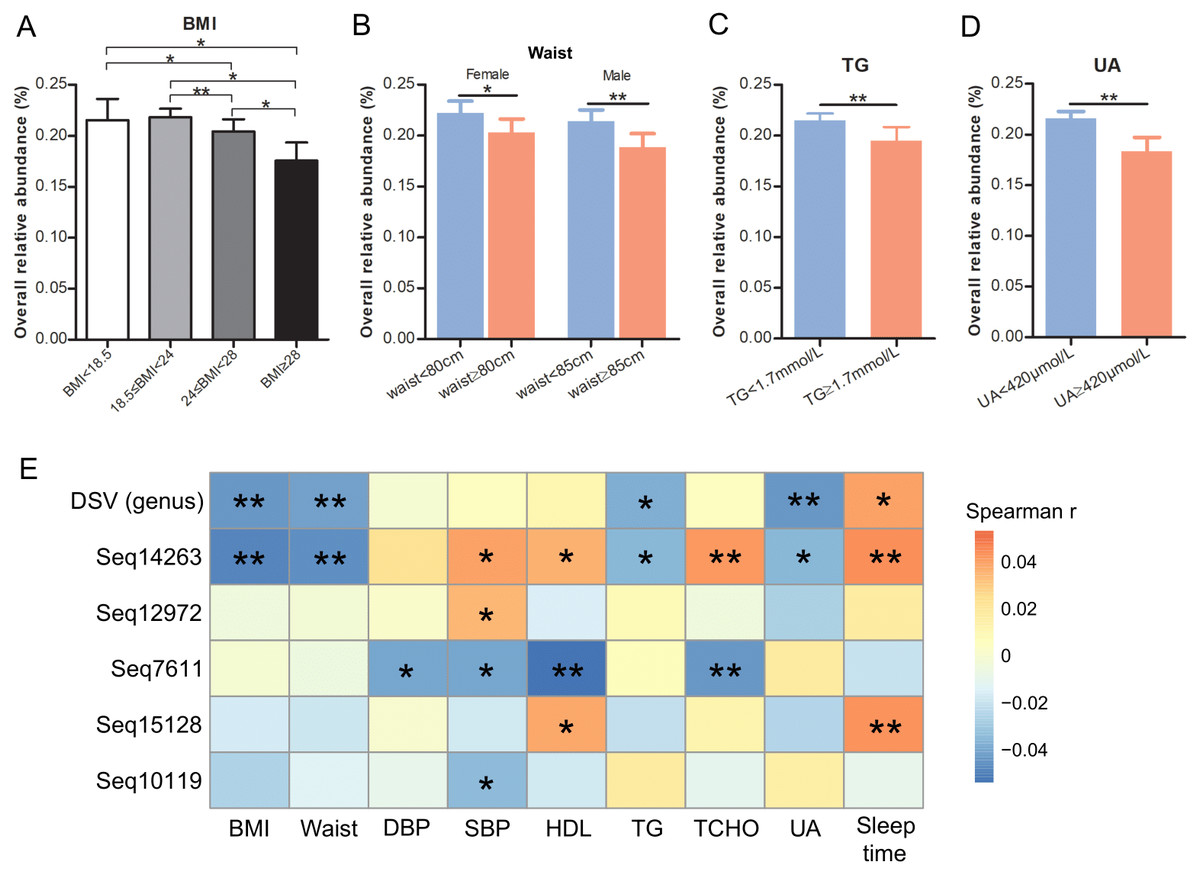
Figure 5: Relationships of DSV relative abundance and host metadata.
Relative abundance of DSV in people with different BMIs (A), waist size (B), TG levels (C), and UA levels (D). (E) Heatmap of Spearman rank correlation coefficients gathering correlations between host parameters and DSV (at the genus and sub-OTU levels). An asterisk (*) indicates FDR adjusted P values smaller than 0.05; Two asterisks (**) indicate FDR-adjusted P-values smaller than 0.01; and three asterisks (***) indicate FDR-adjusted P-values smaller than 0.001.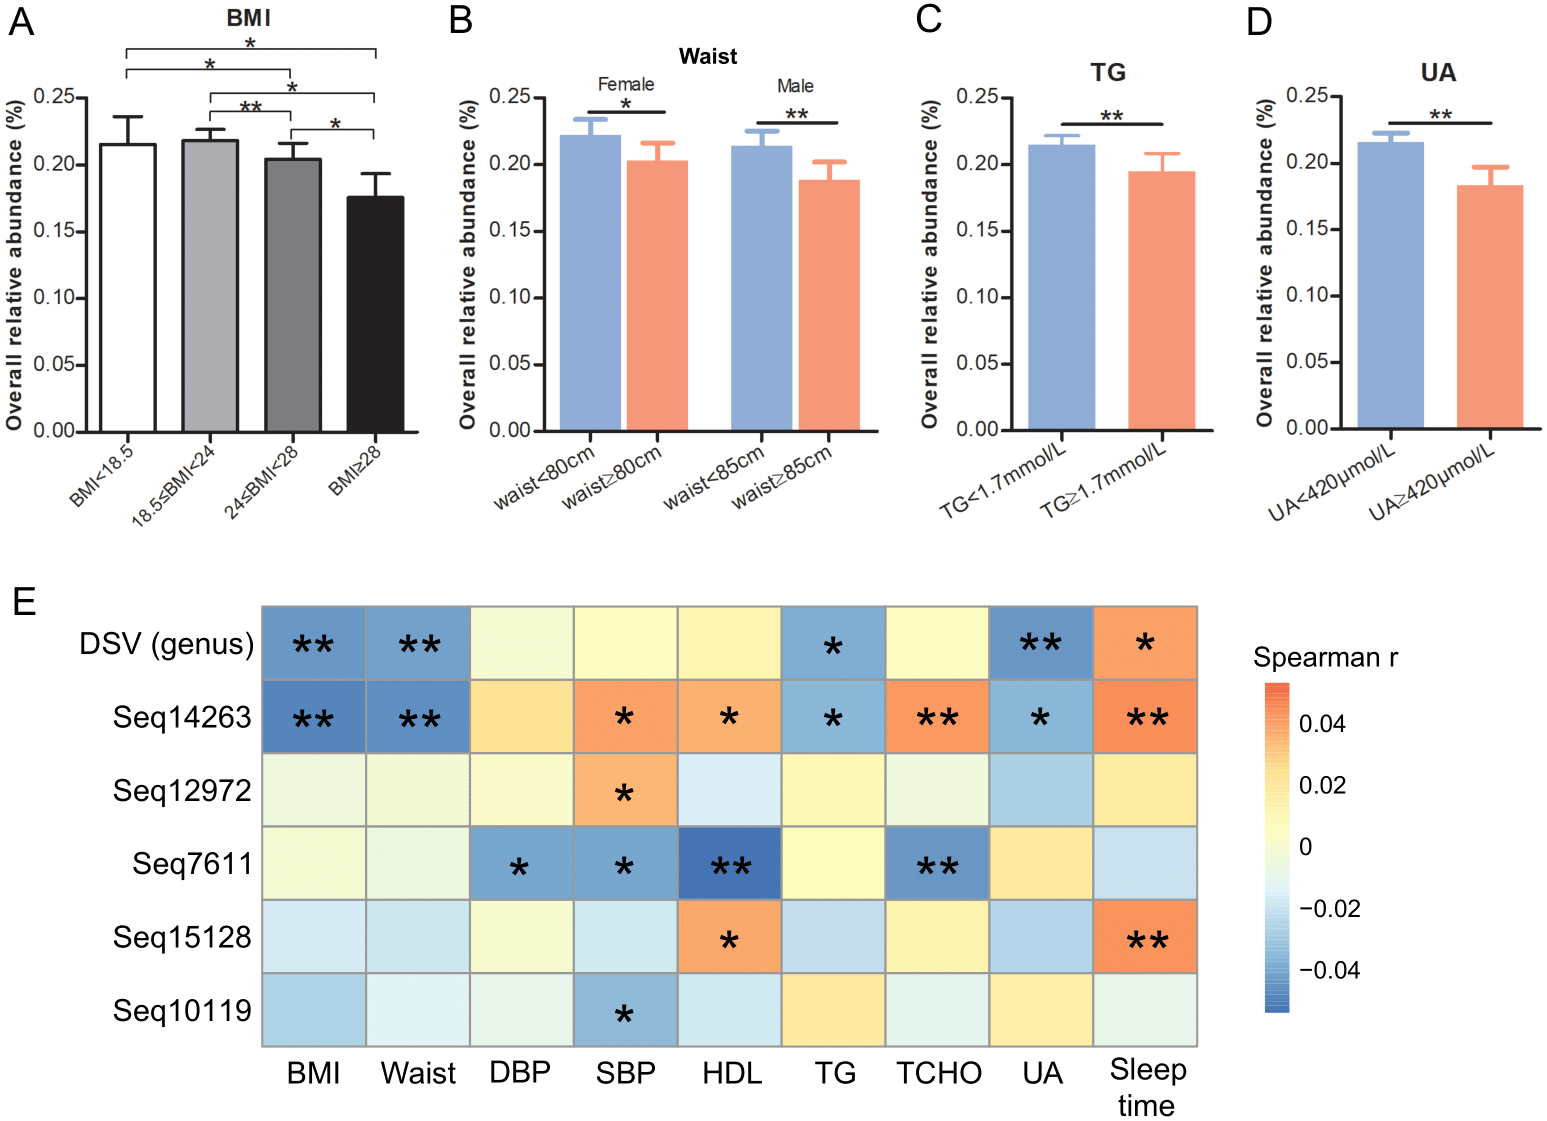
At the genus level, DSV correlated negatively with host BMI, waist, TG, and UA. The mean relative abundances of DSV were 2.2‰ (low weight), 2.2‰ (normal weight), 2.0‰ (overweight), and 1.8‰ (obese). DSV genus and sleep time correlated positively (Fig. 5E). At the sub-OTU level, Seq14263 was negatively linked with BMI, waist size, TG, and UA and positively linked with systolic pressure (SBP), high-density lipoprotein (HDL), total cholesterol (TCHO), and sleep time; Seq12972 was positively linked with SBP; Seq7611 was negatively linked with diastolic pressure (DBP), SBP, HDL, and TCHO; Seq15128 was positively linked with HDL and sleep time; and Seq10119 was negatively linked with SBP (Fig. 5E, Table S5). Seq5554, Seq295, and Seq1686 were not correlated with these parameters. Low-density lipoprotein (LDL) was not correlated with DSV and these eight sub-OTUs (Table S5).
Discussion
In this study, we revealed that DSV are generally associated with healthy hosts, which is in contrast to several previous studies. Petersen et al. reported the outgrowth of DSV was associated with obesity in mice. Increased DSV upregulated the expression of CD36, a receptor that mediates the binding to and uptake of long-chain fatty acids, thus promoting lipid absorption. These mouse model results correspond to reports that DSV are involved in diseases and adverse health effects (Vinke, El & Van Dijk, 2017; Kushkevych et al., 2019; Petersen et al., 2019; Rowan et al., 2010).
Our analysis of the GGMP suggest that DSV is not always associated with adverse health effects. First, DSV was negatively correlated with host BMI, waist, TG, and UA, which are all indications of obesity or metabolic disturbance (Osborne et al., 2020; He et al., 2018; Zeng et al., 2019; Tito et al., 2019). This is consistent with several previous studies. Karlsson et al. (2012) found that DSV were less abundant in obese/overweight children in Sweden. Andoh found that DSV were more abundant in lean people (range 31–58 years) than that in obese people (range 33–55 years) in Japan (Andoh et al., 2016). Second, DSV relative abundance was positively associated with microbial community diversity, which is conducive to microbiome stability and host health (Le Chatelier et al., 2013; Vieira-Silva et al., 2016). The number of predominant DSV features was also positively associated with microbial community diversity. Third, DSV was positively associated with Oscillospira, Phascolarctobacterium, Prevotella, Coprococcus, Dialister, Ruminococcus, Akkermansia, Roseburia, Faecalibacterium, and Bacteroides and negatively associated with Streptococcus, Clostridium, Escherichia, Klebsiella, and Ralstonia. Oscillospira is positively associated with lower BMI and lower levels of inflammatory diseases (Konikoff & Gophna, 2016). Phascolarctobacterium can generate short-chain fatty acids (Zhang et al., 2015) and is positively associated with positive mood in humans (Li et al., 2016). Dialister can be depleted in people with depression (Valles-Colomer et al., 2019). Prevotella is a beneficial genus because of its abundance in healthy human gut microbiota, although a few strains may have pathogenic potential (Precup & Vodnar, 2019). Coprococcus, Ruminococcus, Akkermansia, Roseburia, and Faecalibacterium produce short-chain fatty acid, which have health benefits (Duncan et al., 2002; Hiippala et al., 2018; Li et al., 2019; Plovier et al., 2017; Hou et al., 2020). Bacteroides species have health-promoting effects (Hiippala et al., 2018), while Streptococcus, Clostridium, Escherichia, and Klebsiella are generally considered harmful gut bacteria. Intestinal Ralstonia is more abundant in obese humans with T2DM and worsened glucose tolerance in diet-induced obese mice (Udayappan et al., 2017). Fourth, DSV relative abundance was weakly correlated with longer sleep time. Sleep depravation could disturb human microbiota and glycometabolism (Benedict et al., 2016).
An important factor in this dataset that could explain the positive associations between health effects and DSV is geographical location. He et al. (2018) showed that geography could affect human gut microbiota. Diet could also influence the host gut microbes. Gut microbes utilize components from food, and their metabolites may have beneficial or harmful effects on host physiology (Gentile & Weir, 2018). Ethnicity of the subjects in the GGMP study could be a factor. The ethnicity of subjects in this study was different from previous studies. Ethnicity relates to the gut microbiota (Gaulke & Sharpton, 2018). A study of 314 healthy volunteers from seven ethnic groups in China showed that gut microbiota composition at species level could be discriminated by the ethnicity (Zhang et al., 2015). Another study of 1673 volunteers in the United States showed that ethnicity could shape gut microbiota (Brooks et al., 2018).
In conclusion, based on an analysis of the GGMP dataset, we linked DSV with positive health parameters. This suggests DSV is beneficial for this specific population. We recommend more research to elucidate the relationship between DSV and host health in this population.
Supplemental Information
Phylogenetic tree of eight predominant DSV features and their best matches
Co-occurrence network between DSV (marked in yellow) and the major genera
Only the significant associations are shown. Red lines show positive associations, and blue lines show negative associations.