
Phylogeography of high Andean killifishes Orestias (Teleostei: Cyprinodontidae) in Caquena and Lauca sub-basins of the Altiplano (Chile): mitochondrial and nuclear analysis of an endangered fish
- Published
- Accepted
- Received
- Academic Editor
- Korakot Nganvongpanit
- Subject Areas
- Biogeography, Genetics, Molecular Biology, Zoology, Freshwater Biology
- Keywords
- Orestias, Killifishes, Phylogeography, Altiplano, D-loop, Microsatellite, Fish, Endangered, Freshwater ecosystem
- Copyright
- © 2021 Cárcamo-Tejer et al.
- Licence
- This is an open access article distributed under the terms of the Creative Co mMons Attribution License, which permits unrestricted use, distribution, reproduction and adaptation in any medium and for any purpose provided that it is properly attributed. For attribution, the original author(s), title, publication source (PeerJ) and either DOI or URL of the article must be cited.
- Cite this article
- 2021. Phylogeography of high Andean killifishes Orestias (Teleostei: Cyprinodontidae) in Caquena and Lauca sub-basins of the Altiplano (Chile): mitochondrial and nuclear analysis of an endangered fish. PeerJ 9:e11917 https://doi.org/10.7717/peerj.11917
Abstract
From the early Miocene, the uplift of the Andes Mountains, intense volcanic activity and the occurrence of successive periods of dryness and humidity would have differentially influenced the modification of Altiplano watersheds, and consequently the evolutionary history of the taxa that live there. We analyzed Orestias populations from the Caquena and Lauca Altiplanic sub-basins of northern Chile to determine their genetic differentiation and relationship to their geographical distribution using mitochondrial (D-loop) and nuclear (microsatellite) molecular markers and to reconstruct its biogeographic history on these sub-basins. The results allowed reconstructing and reevaluating the evolutionary history of the genus in the area; genic diversity and differentiation together with different founding genetic groups suggest that Orestias have been spread homogeneously in the study area and would have experienced local disturbances that promoted isolation and diversification in restricted zones of their distribution.
Introduction
Mitochondrial and nuclear markers analyzed in a geographic context have been used to elucidate the relationship between geological events, species distribution and driving speciation mechanisms, as well as to infer the evolutionary history of populations, deepening the knowledge generated by phylogeography since it was pointed out by Avise in 1987 (Avise, 1998; Hickerson et al., 2010). In addition, this type of analysis can be used to know and explain the structure and genetic diversity of populations in a more efficient way (Yi et al., 2020). The information that they can generate is useful when making conservation decisions around those populations where the delimitation of species has not been well defined considering that the diversification of species can be explained by population-level evolutionary processes and making inferences from geographic distributions of genealogical lineages (Katongo et al., 2005; Rissler, 2016). Also, considering small and isolated populations that face a high degree of threat such as loss and fragmentation of habitat, contamination or introduction of invasive species and whose small population sizes make them more likely to generate inbreeding, loss of genetic diversity and therefore the decrease in their ability to adapt to future changes (Frankham, 2005; Rubinoff et al., 2020), as those freshwater fishes that inhabit environments prone to desiccation.
Phylogeographic studies in freshwater fishes have shown that they have a marked phylogeographic structure that is strongly linked to historical changes in the ecology and geology of the systems they inhabit and can be a good study model to analyze speciation processes associated with divergence adaptive and reproductive isolation (Beheregaray, 2008). In addition, it is known that some groups of organisms have an unusually high rate of speciation, reason why they are ideal for studying genetic differentiation processes in shorter times (Kornfield & Smith, 2000; Salzburger et al., 2005; Mehner et al., 2010; Bezault, Mwaiko & Seehausen, 2011; Marques, Meier & Seehausen, 2019).
“Killifishes” are Cyprinodontiforms (Berg, 1940), freshwater fishes that have been widely studied due to their morphological specialization, life history traits and geographic distribution that includes America, the Mediterranean, Southeast Asia and Africa (Parker & Kornfield, 1995; Capobianco & Friedman, 2018). The monophyly of the Cyprinodontiform group and its subdivision into suborders Aplocheiloidei and Cyprinodontoidei has been supported by morphological and genetic studies (Parenti, 1981; Setiamarga et al., 2008; Pohl et al., 2015), however, genealogical relationships within each of these groups remain controversial since their fossil record is still scarce; it has been postulated that their present continental radiation has been mediated by a large-scale vicariance or dispersion radiation (Capobianco & Friedman, 2018). The current presence of this group on both sides of the Atlantic Ocean can be explained by their particular physiology, life history and behavior, which have allowed them to explore habitats with ephemeral waters and adapt to them (Parenti, 1981; Capobianco & Friedman, 2018; Vrtílek et al., 2018). In the family Cyprindontidae (Cyprinodontoidei) the genera Orestias (Parenti, 1984a) and Pseudorestias (Arratia et al., 2017) inhabit exclusively aquatic systems in the Andes Highlands, including the extensive inter-Andean plain or Altiplano between 15–27°S whose average altitude exceeds 3,000 m (Isacks, 1988; Muñoz & Charrier, 1996). The aquatic systems of the Altiplano and their associated biota are exposed to extreme environmental conditions including altitude, wide ranges of salinity, radiation, wind and high daily temperature variation. In these systems there are places where surface waters freeze at night and thaw during the day. There is a negative hydrological regime with well-defined wet (January–March) and dry seasons (April to December) that constantly modulate the superficial water courses (Kött, Gaupp & Wörner, 1995; Rundel & Palma, 2000; Lambrinos, Kleier & Rundell, 2006; Márquez-García et al., 2009; Demergasso et al., 2010; Scott, 2010; Vila et al., 2013; Scott et al., 2015).
Geomorphologic and climatic changes occurred during the Miocene and more strongly in the Plio-Pleistocene (∼5–2 million years ago or MyBP) with the rise of the Andes Range and the major elevation of the Altiplano, produced significant disturbances in South American hydrography; only those taxa which adapted to these variations survived. It is believed that the Orestias cyprinodontoid ancestor colonized northern South America 80–100 MyBP (late Jurassic-Cretaceous) and reached the territory we know today as the Altiplano before its uplift. Survival and dispersion after the uplift would have been favored given its tolerance to environmental conditions such as altitude and salinity. The existence of large water bodies that were progressively subdivided into several paleo-lakes facilitated the disaggregation and reproductive isolation of the ancestral population (Villwock, 1983) resulting in new genetic diversity. Lake Titicaca, today one of the largest lakes in South America, has been postulated as the center of radiation of the genus, mainly due to its effluent Desaguadero River that flows south to Lake Poopó (Villwock, 1983; Lüssen, Falk & Villwock, 2003; Scott, 2010; Vila et al., 2013).
Although different approaches have been used to obtain information about genetic, ecological and evolutionary characteristics of Orestias populations (Lüssen, Falk & Villwock, 2003; Vila, Pardo & Scott, 2007; Maldonado et al., 2009; Peña, 2010; Esquer-Garrigos et al., 2011; Morales, Vila & Poulin, 2011; Vila et al., 2013; Cruz-Jofré et al., 2014; Cruz-Jofré et al., 2016; Esquer-Garrigos et al., 2015; Guerrero-Jiménez et al., 2015; Arratia et al., 2017; Morales, 2018), aspects like its evolutionary history and biogeography are still poorly understood.
Orestias has been described as a species flock (Parenti, 1984b; Northcote, 2000; Esquer-Garrigos, 2013) and so far, 47 species have been described in the highland systems of Peru, Bolivia and Chile (Fricke, Eschmeyer & Fong, 2021); seven of them inhabit the Chilean Altiplano between 17–27°S (Arratia et al., 2017) whose conservation status on the Red List of Threatened Species of the International Union for Conservation of Nature and Natural Resources (IUCN) includes “data deficient”, “vulnerable” and “near threatened” (Esmaeili, Asrar & Gholamifard, 2018). Other authors have indicated them as “endangered” given the fragility of the ecosystems that inhabit and the threats to which they are exposed (Vila, Pardo & Scott, 2007; Vila et al., 2007). In Chile, the Altiplano basins are subdivided into sub-basins depending on the tributaries that carry out the drainage towards the main river course (Dirección General De Aguas (DGA), 2014). In this study we examined the Caquena and Lauca sub-basins, which are the nearest area to Lake Titicaca in the Chilean Altiplano, which is why their Orestias populations have special relevance. Studies on the gastropod Biomphalaria which co-inhabits with Orestias indicated differentiation between populations of the Lauca and Caquena sub-basins, each belonging to a different lineage with a divergence time of 0.68–0.34 million years. Recent isolation processes of aquatic systems would have occurred within Caquena compared to those within the Lauca sub-basin (Collado, Vila & Méndez, 2011; Collado, Salinas & Méndez, 2014). A phylogeny of Orestias populations of Chilean species (Vila et al., 2013) constructed from mitochondrial DNA showed four differentiated clades which are spatially segregated, suggesting a pattern consistent with a differentiation process by vicariance and found that individuals belonging to the locality of Umaqui (Caquena sub-basin) appear in a separate clade along with those of southern sub-basins of the Chilean Altiplano, however, there is no evidence about the processes of genetic differentiation of the genus in this sub-basin. All species described in Lauca sub-basin are grouped in one clade. However, the study of Peña (2010) in Lauca National Park (LNP) highlighted the genetic coherence (mitochondrial markers) between specimens from the northern and middle regions of the sub-basin, suggesting divergence from the southeastern region. In addition, Guerrero-Jiménez et al. (2017), using mitochondrial (D-loop) and nuclear DNA (8 microsatellites) found that the genetic patterns of differentiation would correspond to an incipient speciation in allopatry due to the signs of population expansion and the mixed genetic patterns. Their results were associated with the processes of fragmentation of the systems in the sub-basin during the Pleistocene-Holocene, whose main detonator would have been the collapse of Parinacota volcano’s old cone 12,500 years before present (hereinafter yBP), dating that has been adjusted to 8,800 yBP (Jicha et al., 2015), which would have caused a significant transformation in the landscape, changed the direction of the main river course and produced three systems that remain until today: Lake Chungará, Cotacotani Lagoons and the Lauca River (Sáez et al., 2007; Giralt et al., 2008).
The Caquena and Lauca sub-basins are separated by a volcanic cord of Pleistocene origin whose summits rise above 4,000 m; both being part of larger basins shared with the countries of Bolivia and Peru and both lithological covers have been described as Tertiary superior to Quaternary origin (Niemeyer, 1982), but they have different characteristics despite their geographical proximity. The area of Caquena sub-basin is 1,268 Km2; it is limited by the slopes of adjacent terraces, has an average elevation of 4,230 m.a.s.l. and is widely covered by wetlands (bofedales); the Caquena River course goes from south to north. Lauca sub-basin has a surface of 2,406 Km2 with an average elevation of 4,295 m, has varied types of aquatic systems including lakes, lagoons, and wetlands (bofedales); the Lauca River runs from north to south (Salazar, 1997). This area is interesting to analyze evolutionary relations of Orestias, especially considering its geographical proximity to the proposed center of radiation of the genus and also, that given its rapid speciation characteristics and to the history of the geological, hydrological and climatic changes that have occurred in the Altiplano since its formation (Morales, Vila & Poulin, 2011). Differentiation processes linked to adaptation during short evolutionary periods has been evidenced in fishes of the Cichlidae family that inhabit Victoria Lake in Africa, or Apoyeque Lake in Nicaragua where a sympatry process could explain the high diversity of species within the same lake (Elmer et al., 2010; Takuno et al., 2019). Furthermore, some species of cichlids have shown similar morphological features (Kocher, 2004) where has been postulated a radiation of species related to colonization events by different lineages due to allopatry. This vicariant process would be related to substantial changes in the climate and rainfall regimes that would have fragmented the water systems on drought periods. According to this, we consider that the genus Orestias represents an excellent model to probe phylogeographic hypothesis on a historically and successively fragmented populations.
Given the high specialization of Orestias to the different aquatic systems of the Altiplano and that Caquena and Lauca sub-basins conform differentiated hydrological units, we hypothesized that genetic variation in Orestias populations would be reflected in these two units and could be a response to geological events that affected their evolutionary history. Thus, the objective of this study was to analyze the phylogeographic relationships of Orestias populations in the Caquena and Lauca sub-basins using mitochondrial and nuclear molecular markers (mitochondrial D-loop and microsatellites) to provide evidence of its evolutionary history.
Materials & Methods
Sampling sites
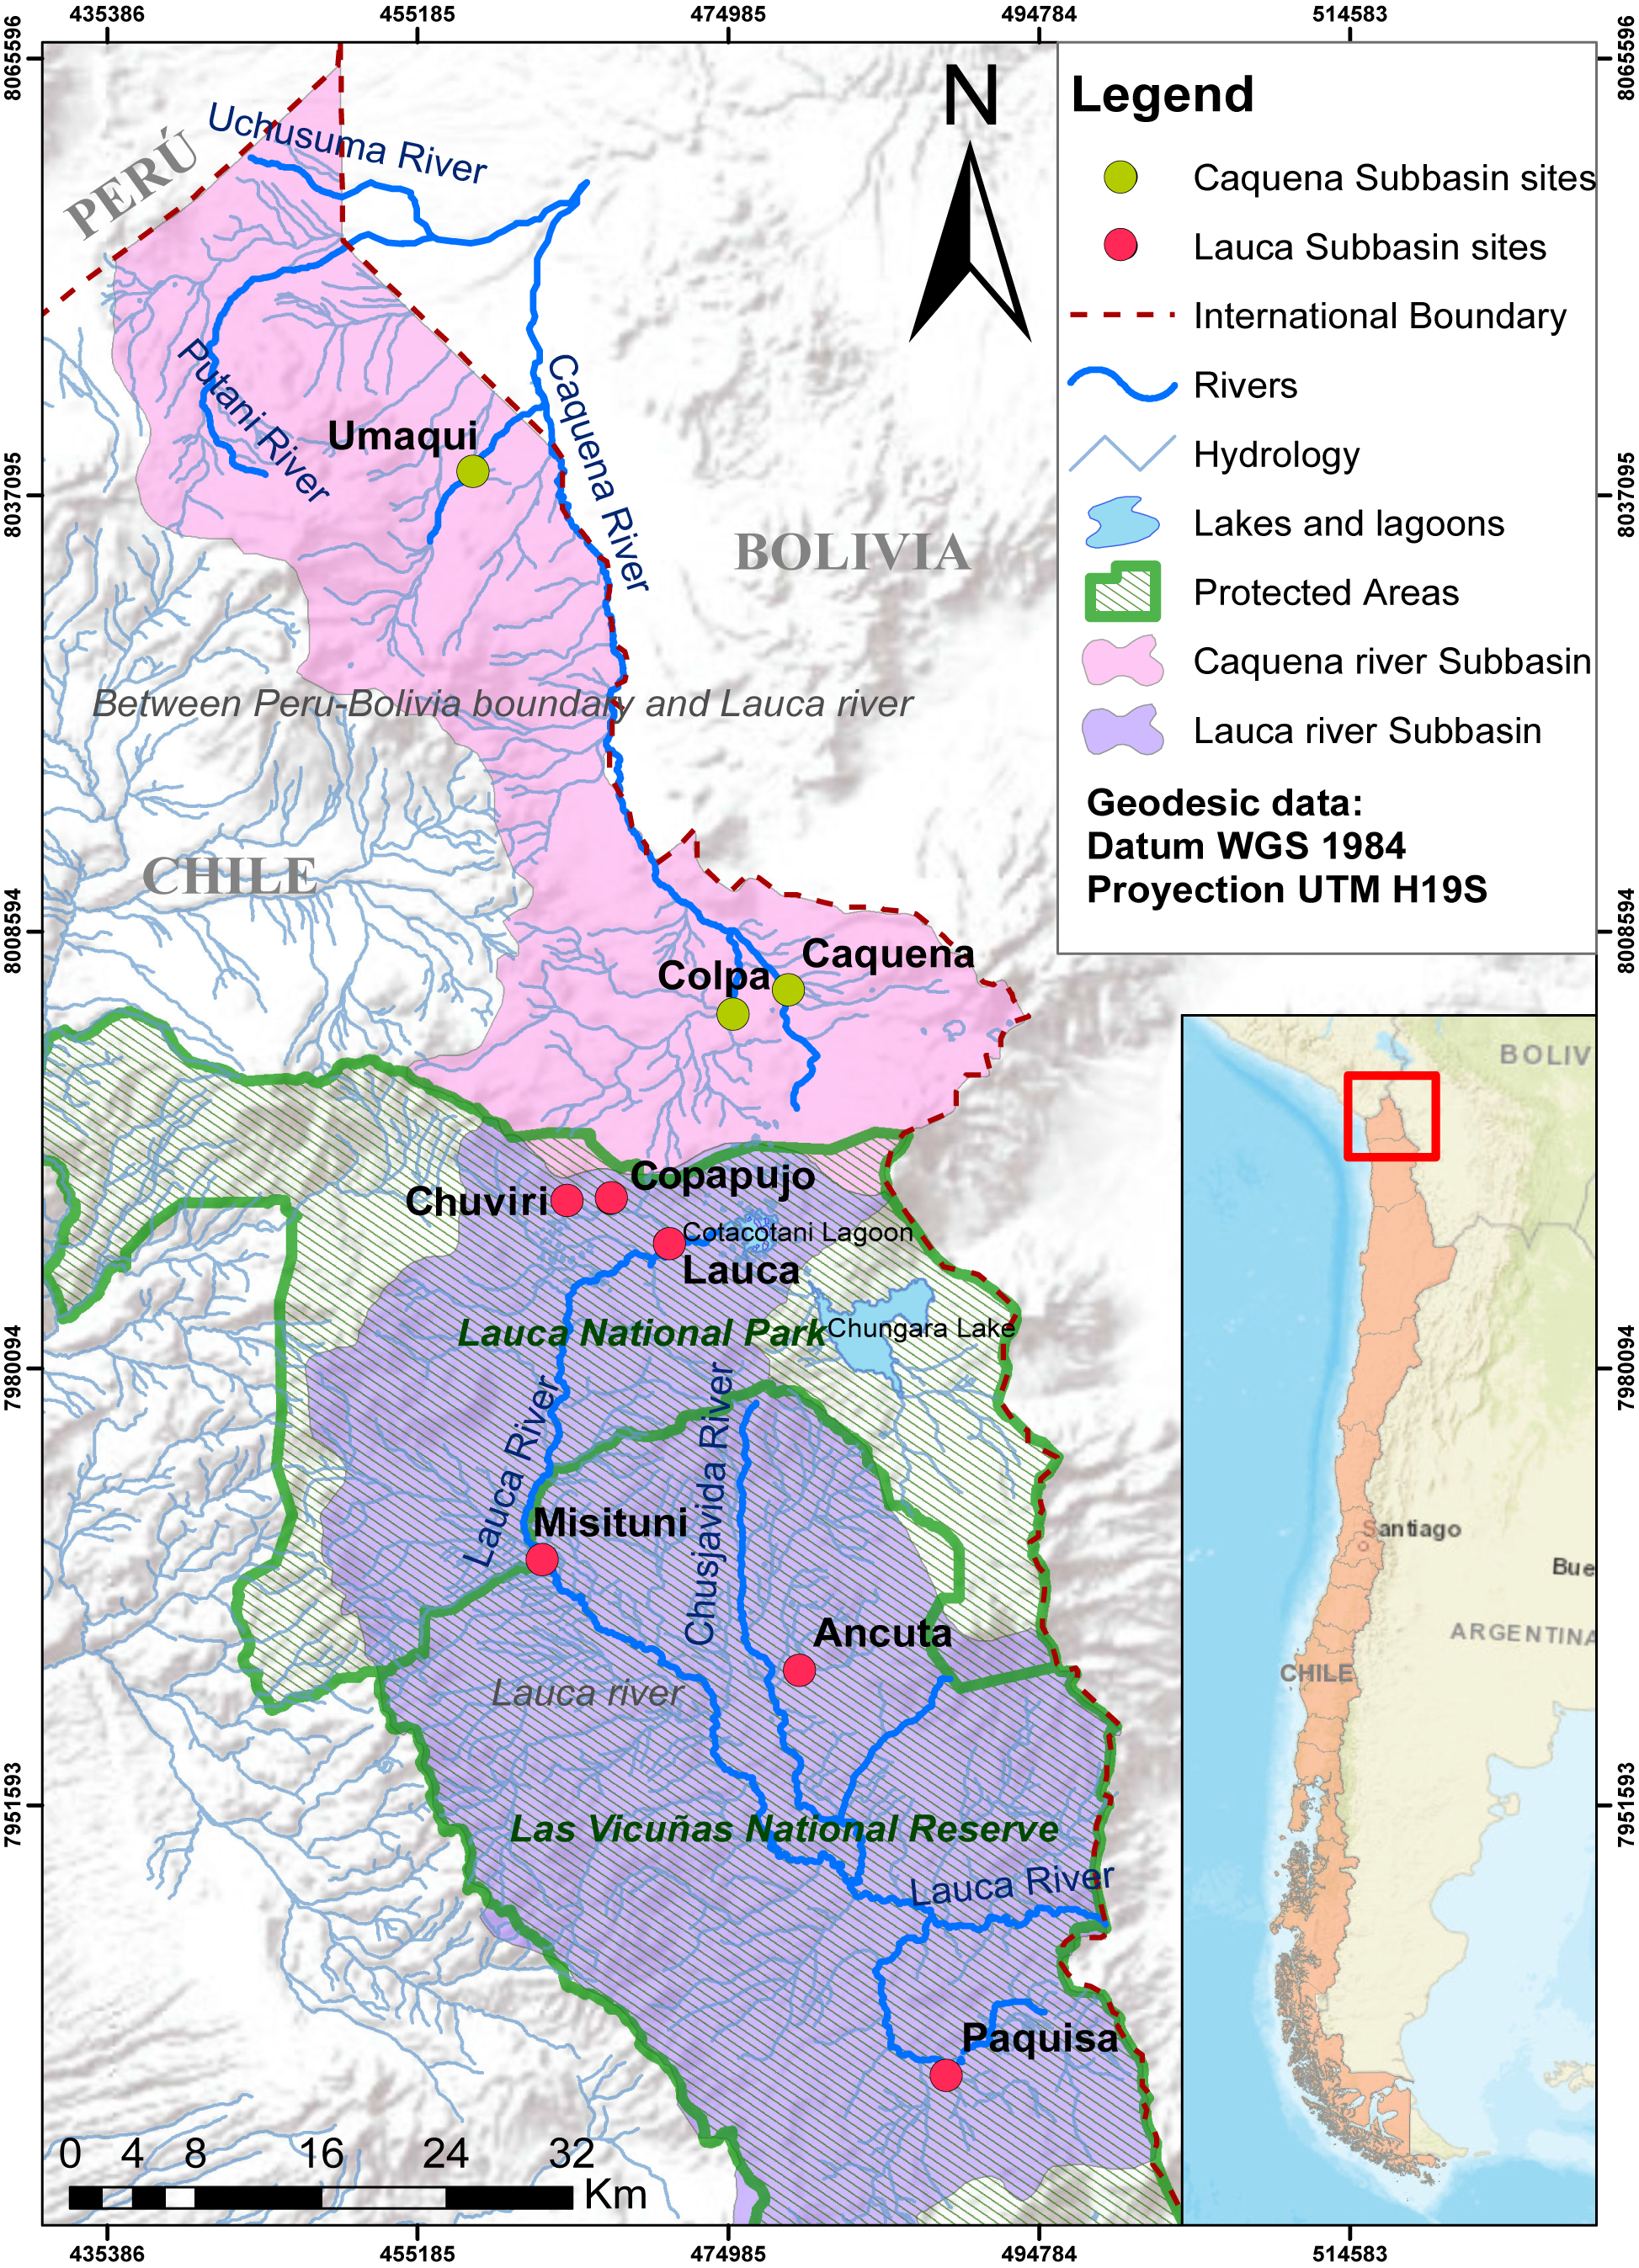
Fish samples were captured from Caquena and Lauca sub-basin, during the years 2016–2017. The Caquena sub-basin area considers three locations: Caquena, Colpa and Umaqui. The southern zone of the Lauca sub-basin considers two locations: Ancuta and Paquisa (GenBank accession numbers BankIt2361457: MW149163 –MW149238). To complement the information of the geographical distribution of the genus, data from Guerrero-Jiménez et al. (2017) were included (GenBank accession numbers BankIt1931003: KX498091–KX498358) from four representative localities of genetic diversity in northern zone of the Lauca sub-basin: Chuviri, Copapujo, Lauca and Misituni. These locations were selected from the pool of available data after a previous analysis that allowed us to choose those populations that turned out to be more informative for the representation of the genetic diversity of the northern zone of the Lauca sub-basin (data not shown). The geographic data of the locations considered in this work are shown on Fig. 1 and Table 1.
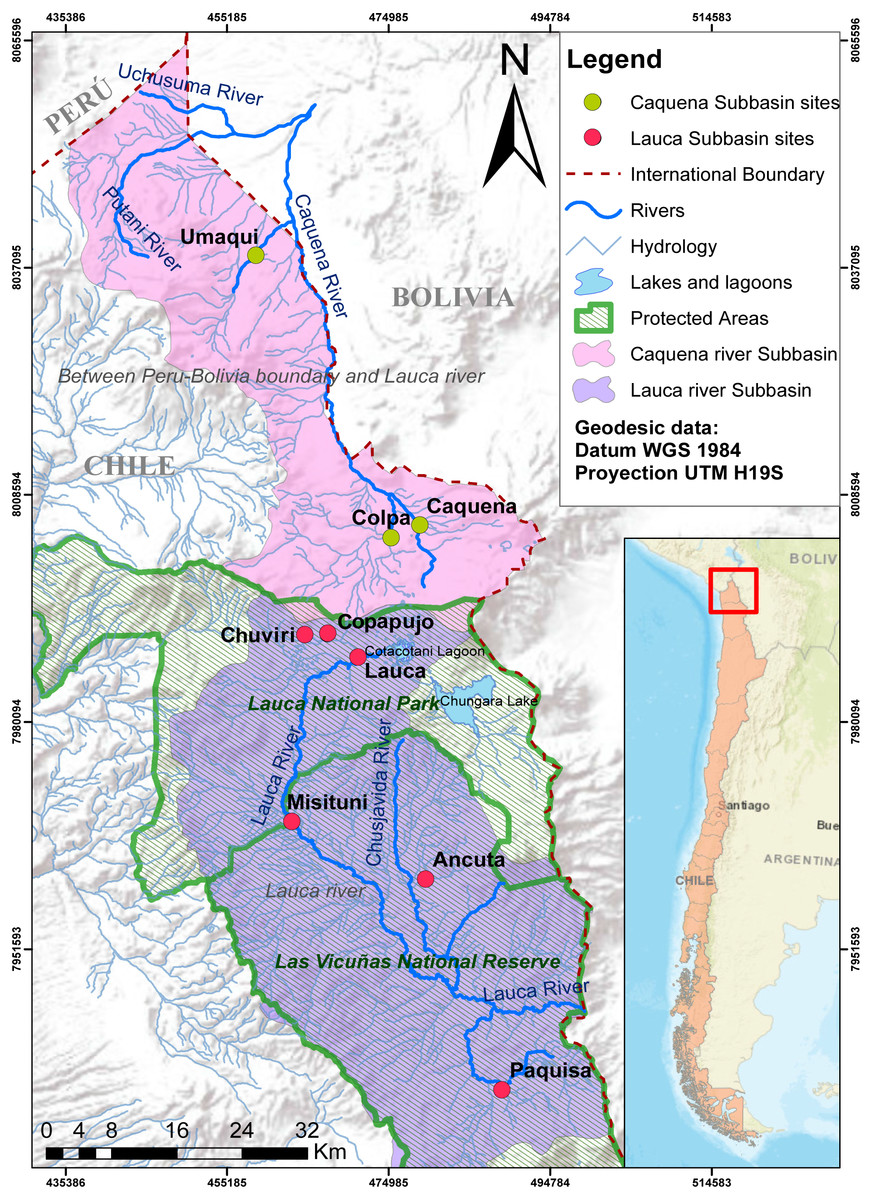
Figure 1: Map of localities of Caquena and Lauca sub-basins.
Sampling and preservation of samples
The fish were obtained according to research fishing permit number 1103-2015 of the Chilean Undersecretary of Fisheries (see S1) and were captured with manual fishing nets. The number of samples obtained did not significantly affect the conservation status of the populations. Euthanasia was performed with 100 mgl-1 of tricaine methanesulfonate. They were preserved in 95% ethanol and stored at the Laboratorio de Limnología of Universidad de Chile.
The identification of individuals was carried out through a review of specialized literature and consultation with experts, being classified as Orestias sp. for the Caquena sub-basin locations and as Orestias cf laucaensis for Ancuta and Paquisa. Regarding the other locations, they had been classified by Guerrero-Jiménez et al. (2017) as Orestias laucaensis for those individuals from Lauca and Misituni. For those locations of Chuviri and Copapujo, they were identified as Orestias sp.
| Sub-basin | Location | Abbreviation | Coordinates (∘) | |
|---|---|---|---|---|
| South | West | |||
| Caquena | Umaqui | UMA | 17.73926 | 69.39064 |
| Caquena | CAQ | 18.04527 | 69.20166 | |
| Colpa | COL | 18.05816 | 69.23445 | |
| Lauca | Chuviria | CHU | 18.16925 | 69.33481 |
| Copapujoa | COP | 18.16925 | 69.30785 | |
| Laucaa | LAU | 18.19379 | 69.27360 | |
| Misitunia | MIS | 18.38074 | 69.34920 | |
| Ancuta | ANC | 18.44611 | 69.19486 | |
| Paquisa | PAQ | 18.68510 | 69.10563 | |
Notes:
DNA extraction
DNA was extracted from muscle tissue obtained by dissecting the area on the pectoral fin. The muscle is dried and then pulverized, after which it is subjected to the action of proteinase K and is treated with repeated cycles of immersion in saline dilutions and centrifugation according to the procedure indicated in Aljanabi & Martinez (1997). After extraction, the purity and concentration of the DNA samples was determined by spectrophotometry with the Thermo Scientific NanoDropTM 1,000 spectrophotometer.
Amplification/genotyping and data analysis
Mitochondrial DNA
The control region of mitochondrial DNA (D-loop) was amplified by PCR using specific primers for the genus: Forward 5′ ACC CCT AAC TCC CAA AGC T 3′; Reverse 5′ TGA TAG TAA AGT CAG GAC CAA 3′ (Morales, Vila & Poulin, 2011). The PCR reaction was standardized in a total volume of 25 µl: 2.5 µl 10 X PCR buffer (50 mM KCl, 10 mM Tris-HCl, pH 8.0), 2 µl MgCl2 50 mM, 2 µl of each primer 10 pm/µl, 2 µl dNTP 2.5 mM, 0.5 µl Taq (Invitrogen), 9 µl ultrapure water, 1 µl DMSO and 4 µl of 10 ng/µl DNA.
The PCR cycle consisted of an initial denaturation for 4 min at 94 °C, followed by 38 cycles of 45 s at 94 °C, 90 s at 66 °C (65.2 °C for Caquena samples, 63.5 °C for Colpa samples) and 90 s at 72 °C, with a final extension of 10 min at 72 °C. PCR products were visualized in 2% agarose gel stained with SYBR. Amplification products were sent for sequencing to Macrogen Inc. (South Korea). D-loop sequences were aligned, edited and assembled using the Proseq v.2.9.1 program (Filatov, 2002) and Bioedit Sequence alignment editor version 7.2.6 software (Hall, 1999).
Using the mitochondrial D-loop control region, genetic diversity indices were calculated for each locality, including number of haplotypes (K), number of polymorphic sites (S), haplotype diversity (H), average number of differences between pairs of sequences (Π) and nucleotide diversity (π) in DNA Sequence Polymorphism (DnaSp) software version 5.10.01 (Librado & Rozas, 2009).
To estimate the level of genetic differentiation between pairs of locations we used the ΦST and FST indices in Arlequin software version 3.5.1 (Excoffier & Lischer, 2010). The significance of FST and ΦST was tested with 10,000 permutations. To evaluate the existence of phylogeographic structure GST (genetic differentiation) and NST (genetic differentiation considered as genetic distance between haplotypes) values were calculated in PERMUT version 2.0 (Pons & Petit, 1996; Burban et al., 1999) based on the null hypothesis GST =NST. If NST is significantly greater than GST this hypothesis is rejected and suggests the existence of phylogeographic structure. A total of 1,000 permutations to determine significance of this comparison were tested in the same software.
Coalescent analysis was based on single locus; the genealogical relationships between haplotypes were graphed by constructing a haplotype network using the median-joining algorithm implemented in the Network version 4.501 software (Bandelt, Forster & Röhl, 1999). To detect possible deviations from mutation-drift equilibrium (under the Wright-Fisher model) that could indicate population expansions or bottlenecks, in each genetic group Tajima and Fu tests were performed under assumption of neutrality in Dnasp version 5.10.01 (Librado & Rozas, 2009). Although both account for the occurrence of demographic pressures in the past, their predictive power varies according to the type of event (Ramírez-Soriano et al., 2008), so the results of the tests were compared.
For demographic analysis, a mutational rate was estimated. Considering the evidence of “time dependency” of mitochondrial DNA evolutionary rates in freshwater fishes (Ho et al., 2005; Ho & Larson, 2006; Burridge et al., 2008; González-Wevar et al., 2015), the substitution rate for the demographic analysis of Orestias was estimated using the phylogenetic relationships and divergence times on BEAST software version 1.8.4 (Drummond et al., 2012). A Bayesian framework which allowed for variable divergence time estimations among lineages was used and an uncorrelated relaxed clock with a lognormal distribution model was used as prior based on the relevance of evolutionary rates. We used a total of 254 sequences where 61 was from of Chilean Orestias phylogeny on Vila et al. (2013) with GenBank accession numbers JX134506.1–JX134566.1 and 117 from Guerrero-Jiménez et al. (2017) with the GenBank accession numbers KX498242.1–KX498358.1. We added 76 new sequences from this work. Despite not having fossil record, the analysis was calibrated according geological/ hydrological events that modified the aquatic systems of Altiplano (Data S2). We used three different models to evaluate past demographic changes. First, mismatch distribution and demographic expansion values were calculated based on the instant growth model of Schneider & Excoffier (1999) available in Arlequin; Tau τ is the time the expansion began measured in mutational steps, θ0 corresponds to 2Nµ, Ne0 refers to the theoretical effective population size before expansion and θ1 is the effective population size after expansion. Second, we reconstructed the demographic history of each population using (LAMARC) version 2.1.9 (Kuhner, 2006). This program constructs coalescence trees using maximum likelihood; several population parameters are estimated from these trees. The growth rate is g and the values of θ0 and θt indicate the population sizes at present and at time t, respectively. Finally, we infer demographic history of populations performing a Bayesian Skyline analysis available on BEAST program version 1.10.4 (Suchard et al., 2018) with an uncorrelated relaxed clock and a random starting tree. The analysis was performed with MCMC of 10,000,000–2,000,000 iterations depending on the number of sequences analyzed with 10% as a burn-in. The value of the estimated mutational rate was assumed as the “mean” value of the uncorrelated relaxed clock model with a standard deviation of 10% on priors setting. The results were analyzed using Tracer program version 1.7.2 (Rambaut et al., 2018) where a Bayesian skyline plot was constructed. Bayesian skyline plots shows changes through the time of the product of effective population size (Ne) and generation time (t).
Nuclear DNA
We amplified eight microsatellite loci, originally optimized in O. agassii of Bolivia by Esquer-Garrigos et al. (2011) (Table 2). Amplification of the loci was performed in three mixes according to affinity of alignment temperatures, they were MIX1: A106, B1 and C102; MIX2: A116, B104, C105 and D110; MIX3: B103. The PCR reaction volume was standardized at 10 µl: 2 µl 5X PCR Buffer (50 mM KCl, 10 mM Tris-HCL, pH 8.0), 0.9 µl 25 mM MgCl2, 1 µl 0.1 mg/l BSA, 0.5 µl of each 50 pm/µl primer, 0.8 µl 2.5 mM dNTP, 3.2 µl ultrapure water, 0.1 µl Taq (according to MIX number) and 1 µl 50 ng/µl DNA. Multiplex PCR Master Mix (QIAGEN) was used for MIX 1 and 2 and Taq platinum (ThermoFisher Scientific®) was used for MIX 3. The PCR program was different for each MIX used, with annealing temperatures that varied between 51–60 °C (see Table S3). Amplification products were sent for genotyping to Macrogen Inc. (South Korea). The genotyping results were processed using GeneMarker version 2.6.3 program (SoftGenetics). To review and correct the existence of null alleles, stuttering errors and alleles with large peaks, Micro-Checker version 2.2.3 program (Van Oosterhout et al., 2004) was used.
| Locus | Primer (5′–3′) | Dye label | Temperature Alignment (°C) |
MIX |
|---|---|---|---|---|
| A9a | F: CAGGAAGGAATCTCAGGAATG R: ACGCACCGTTTCATAGTAAGG |
FAM | 58 | 1 |
| A106 | F: TGGCTGATGGTATTGGTTG R: AGCACACCTTCACAGGATG |
VIC | 60 | |
| B1 | F: TACAAACACATCCATCTCAGTC R: AACACTCCTATCATCCATCATC |
PET | 58 | |
| C102 | F: TTCCAAACCACATTTTAGATCC R: CAGCCTTTTGATTATGGAGGT |
NED | 63 | |
| A116 | F: TCGCTACTTACTCCGACCTC R: AAATCACAATGGCTTTCTCTG |
PET | 54 | 2 |
| B104 | F: ACCGTAGTTGCCTGGTTACA R: AGGGTGCTGTCAGAGATGAG |
VIC | 64 | |
| C105 | F: AGCAAGACCAGTTTGAAATCT R: GTTGCCCTGCGATGTAC |
NED | 58 | |
| D110 | F: ATCACAAGACGAGGTTCTCAC R: GATTGGAGCAAGGGACTG |
FAM | 59 | |
| B103 | F: TATTATCCACTCCTGGTCAGTC R: GTTGAAGCGTTTCCAAGAT |
FAM | 51 | 3 |
Allele frequencies observed, heterozygosity (Ho) and expected heterozygosity (He) were calculated for each locus. FIS was calculated and its significance was tested with 10,000 permutations in Genetix version 4.05.2 (Belkhir et al., 2004). To evaluate genetic and phylogeographic structure, FST between pairs of locations were determined in Arlequin version 3.5.1 (Excoffier & Lischer, 2010); their significance was evaluated by 10,000 permutations. A reassignment test was performed in the different genetic groups to assess the agreement between the assignment or exclusion of reference populations as a possible origin of the individuals based on multilocus genotypes (Paetkaud et al., 1995) in the Geneclass 2 software (Piry et al., 2004). Finally, a Bayesian analysis was performed to infer the number of genetic groups (K) of the individual genotypes in Structure version 2.2 (Evanno, Regnaut & Goudet, 2005), using the parameters cited in Guerrero-Jiménez et al. (2017).
Results
Mitochondrial DNA
Genetic diversity
195 sequences of 815 bp in 9 locations were obtained. The genetic diversity indices are shown in Table 3. The Ancuta population showed only one haplotype, with the lowest diversity of all analyzed localities. The Umaqui population presented the highest values of nucleotide and haplotype diversity.
| Sub-basin | Location | N | S | K [rarefaction] | Hd | ∏ | π |
|---|---|---|---|---|---|---|---|
| Caquena | UMA | 15 | 26 | 8 [6.450+/-0.827] | 0.895 +/- 0.053 | 9.467 +/- 4.604 | 0.012 +/- 0.006 |
| CAQ | 13 | 14 | 5 [4.30+/-0.665] | 0.692 +/- 0.119 | 6.128 +/- 3.118 | 0.008 +/- 0.004 | |
| COL | 10 | 16 | 6 | 0.844 +/- 0.103 | 6.689 +/- 3.448 | 0.008 +/- 0.005 | |
| Lauca | CHUa | 23 | 11 | 9 [5.552+/-1.087] | 0.755 | 1.621 | 0.00182 |
| COPa | 11 | 4 | 4 | 0.600 | 1.055 | 0.00118 | |
| LAUa | 37 | 3 | 4 [1.89+/-0.76] | 0.158 | 0.213 | 0.00024 | |
| MISa | 48 | 6 | 7 [2.467+/-0.924] | 0.340 | 0.368 | 0.00041 | |
| ANC | 20 | 0 | 1 [1+/-0] | 0.000 +/- 0.000 | 0.000 +/- 0.000 | 0.000 +/- 0.000 | |
| PAQ | 18 | 11 | 8 [8+/-0] | 0.641 +/- 0.130 | 1.320 +/- 0.862 | 0.002 +/- 0.001 | |
| TOTAL | 195 | 54 | 40 | 0.727 | 6.285 | 0.00771 | |
Notes:
- N
-
sample size
- S
-
polymorphic sites
- K
-
haplotype number
- []
-
rarefaction of number of haplotypes
- Hd
-
haplotype diversity
- Π
-
mean number of differences between pairs of sequences
- π
-
nucleotide diver
Differentiation among populations and haplotype characterization
FST and ΦST analyses (Table 4) show highly significant differentiation (p < 0.0001), except for the Lauca-Chuviri and Misituni-Chuviri comparisons, whose values were not significant.
| FST | Caquena sub-basin | Lauca sub-basin | |||||||
|---|---|---|---|---|---|---|---|---|---|
| UMA | CAQ | COL | CHU | COP | LAU | MIS | ANC | PAQ | |
| UMA | – | *** | NS | *** | *** | *** | *** | *** | *** |
| CAQ | 0.20378 | – | ** | ** | ** | *** | *** | *** | *** |
| COL | 0.06675 | 0.23559 | – | ** | *** | *** | *** | *** | *** |
| CHU | 0.19611 | 0.19986 | 0.22456 | – | NS | *** | *** | *** | *** |
| COP | 0.35877 | 0.34594 | 0.41186 | 0.09172 | – | NS | NS | *** | *** |
| LAU | 0.57288 | 0.56382 | 0.64004 | 0.25104 | 0.01357 | – | NS | *** | *** |
| MIS | 0.53883 | 0.51535 | 0.59371 | 0.21757 | −0.00669 | −0.00072 | – | *** | *** |
| ANC | 0.5959 | 0.71229 | 0.6884 | 0.62099 | 0.8751 | 0.89908 | 0.84069 | – | *** |
| PAQ | 0.23615 | 0.33546 | 0.26941 | 0.31605 | 0.48565 | 0.66046 | 0.62494 | 0.69262 | – |
| ΦST | |||||||||
| UMA | – | * | * | *** | *** | *** | *** | *** | *** |
| CAQ | 0.19778 | – | NS | *** | ** | *** | *** | *** | *** |
| COL | 0.11547 | 0.07463 | – | *** | *** | *** | *** | *** | *** |
| CHU | 0.64063 | 0.66901 | 0.74684 | – | NS | *** | *** | *** | *** |
| COP | 0.57269 | 0.61894 | 0.70361 | 0.02789 | – | NS | NS | *** | *** |
| LAU | 0.74491 | 0.78465 | 0.85076 | 0.10726 | 0.04145 | – | NS | *** | *** |
| MIS | 0.7765 | 0.81096 | 0.87065 | 0.11986 | 0.04306 | 0.01728 | – | *** | *** |
| ANC | 0.59147 | 0.70938 | 0.72001 | 0.92075 | 0.97654 | 0.98285 | 0.97868 | – | *** |
| PAQ | 0.50848 | 0.56525 | 0.56178 | 0.88715 | 0.90679 | 0.94745 | 0.9508 | 0.81725 | – |
The haplotype network showed an extended pattern with some haplotypes shared between Caquena and LNP populations.
A clear differentiation is observed between the locations of LNP and Ancuta-Paquisa, however, they share a star-like net form (Fig. 2).
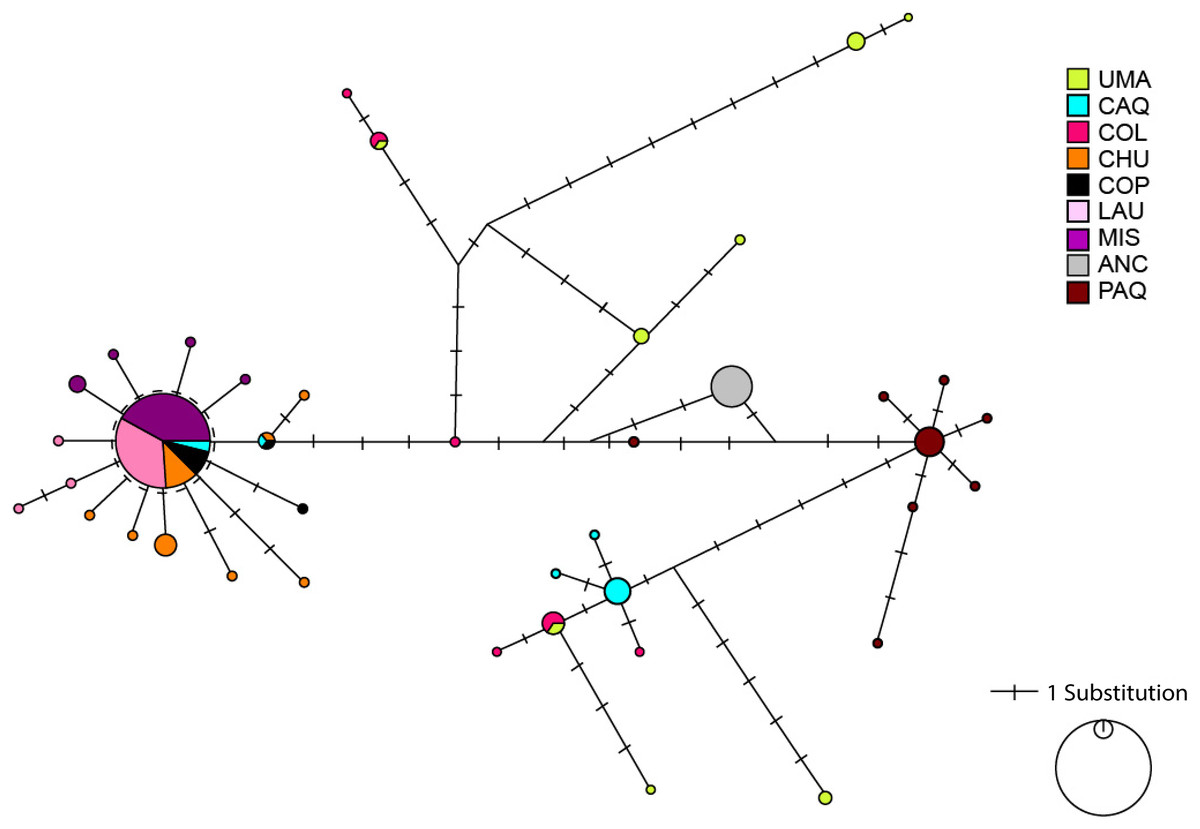
Figure 2: Haplotype network based on a median joining criterion of the studied locations of Lauca and Caquena sub-basins.
Circles represent haplotypes, while the length of the main lines is proportional to the number of mutational steps between haplotypes. Short black lines that intercept the main lines correspond to mutational steps between haplotypes.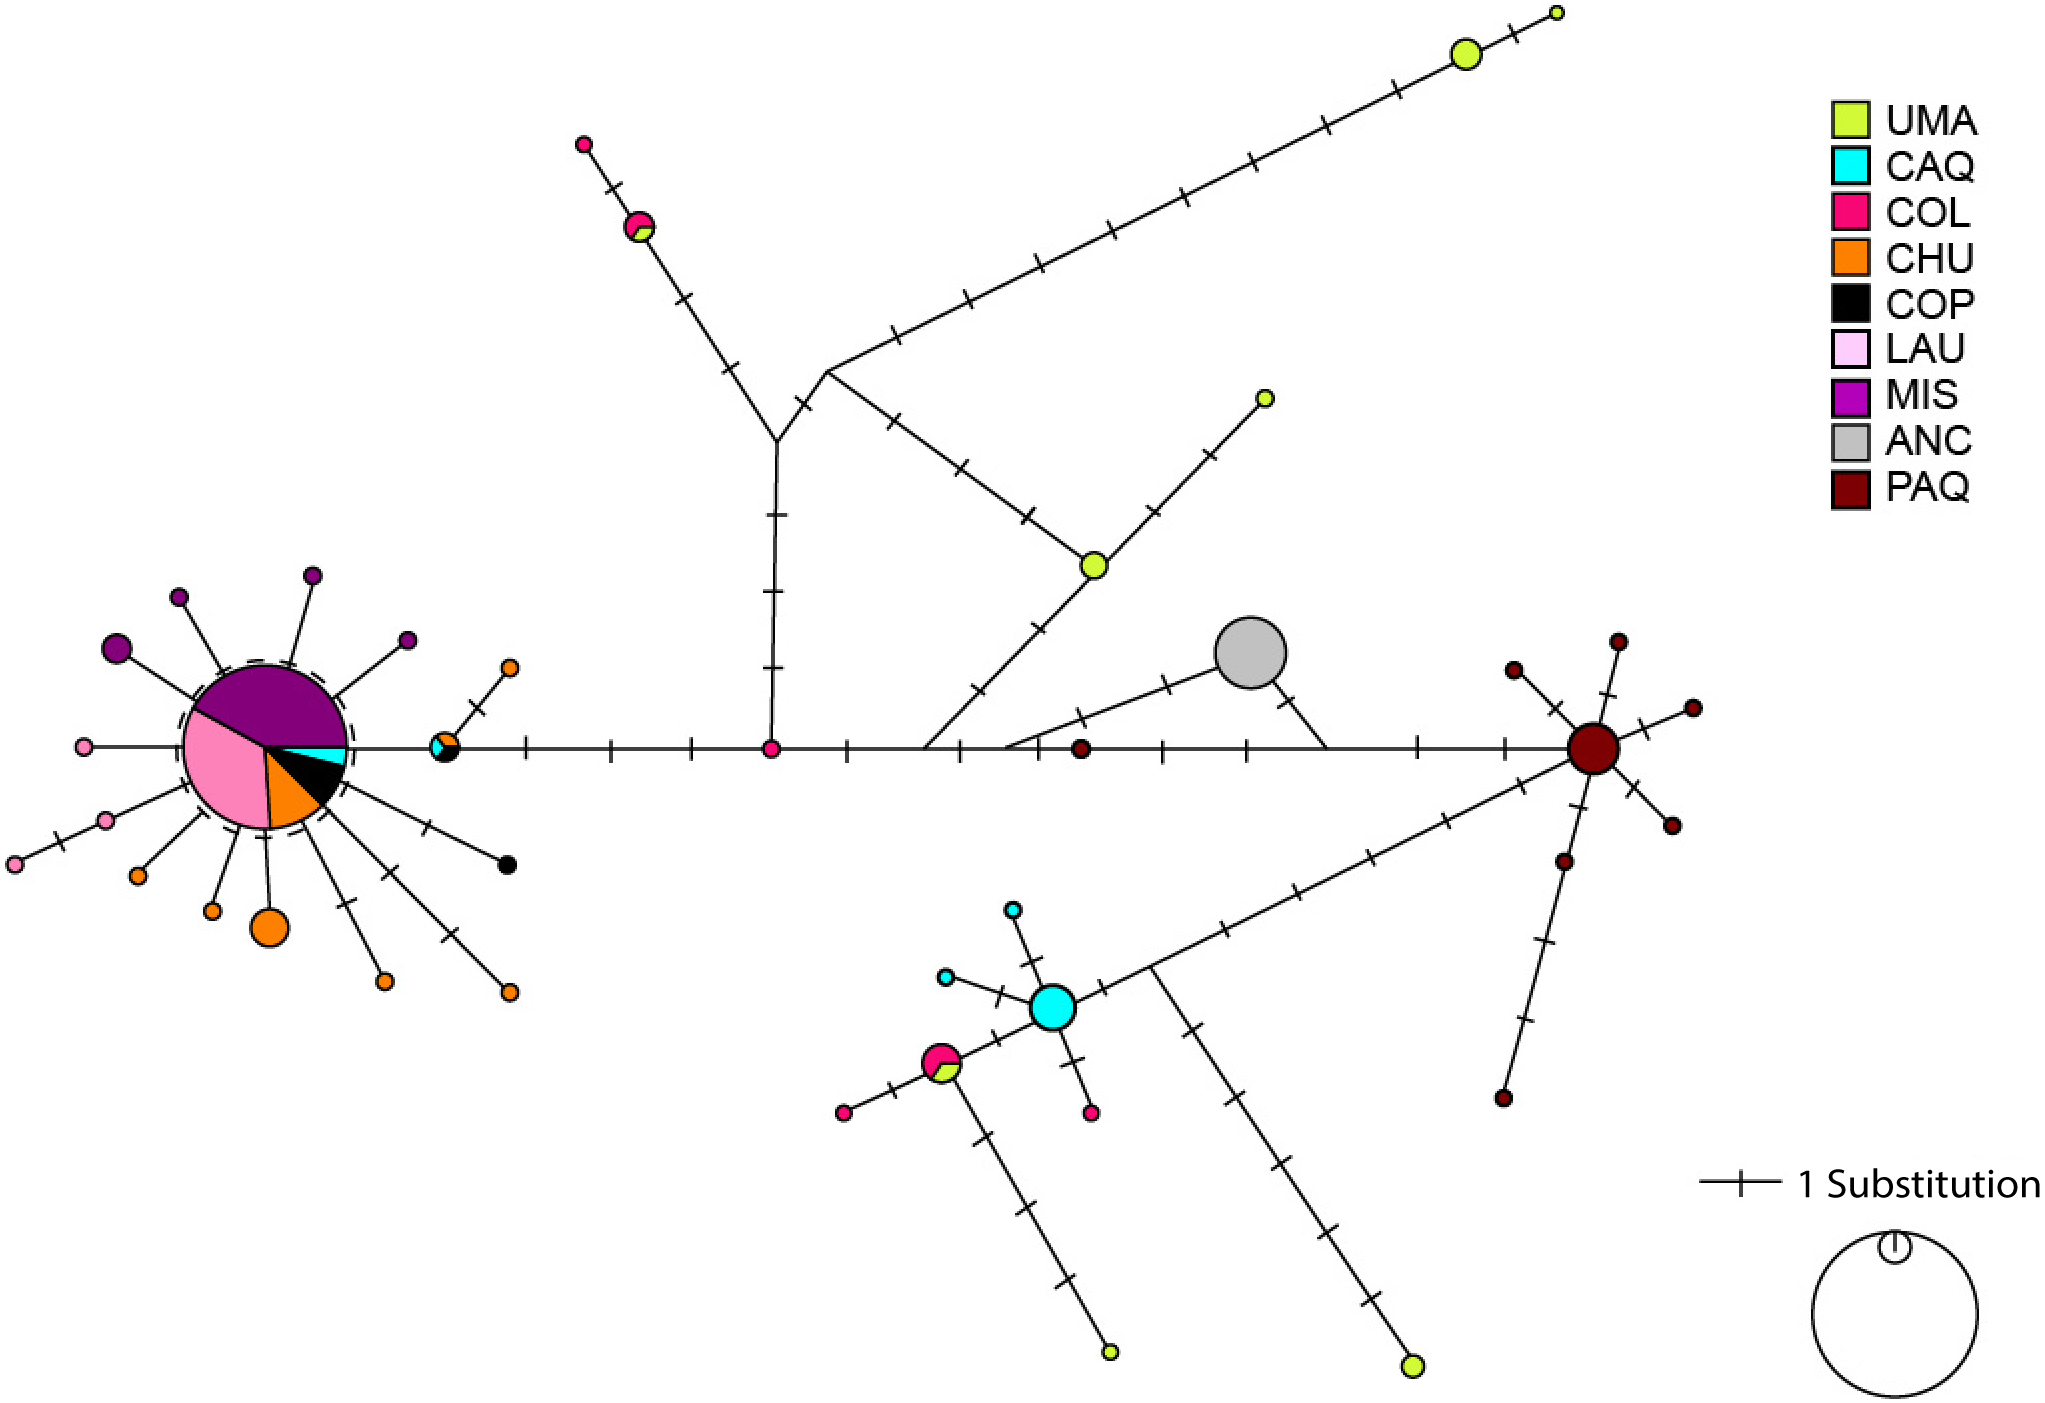

Figure 3: Haplotype network based on a median joining criterion and mismatch distribution.
(A) Umaqui. (B) Caquena. (C) Colpa. (D) Paquisa. It was not possible to build this for Ancuta because it only presented one haplotype.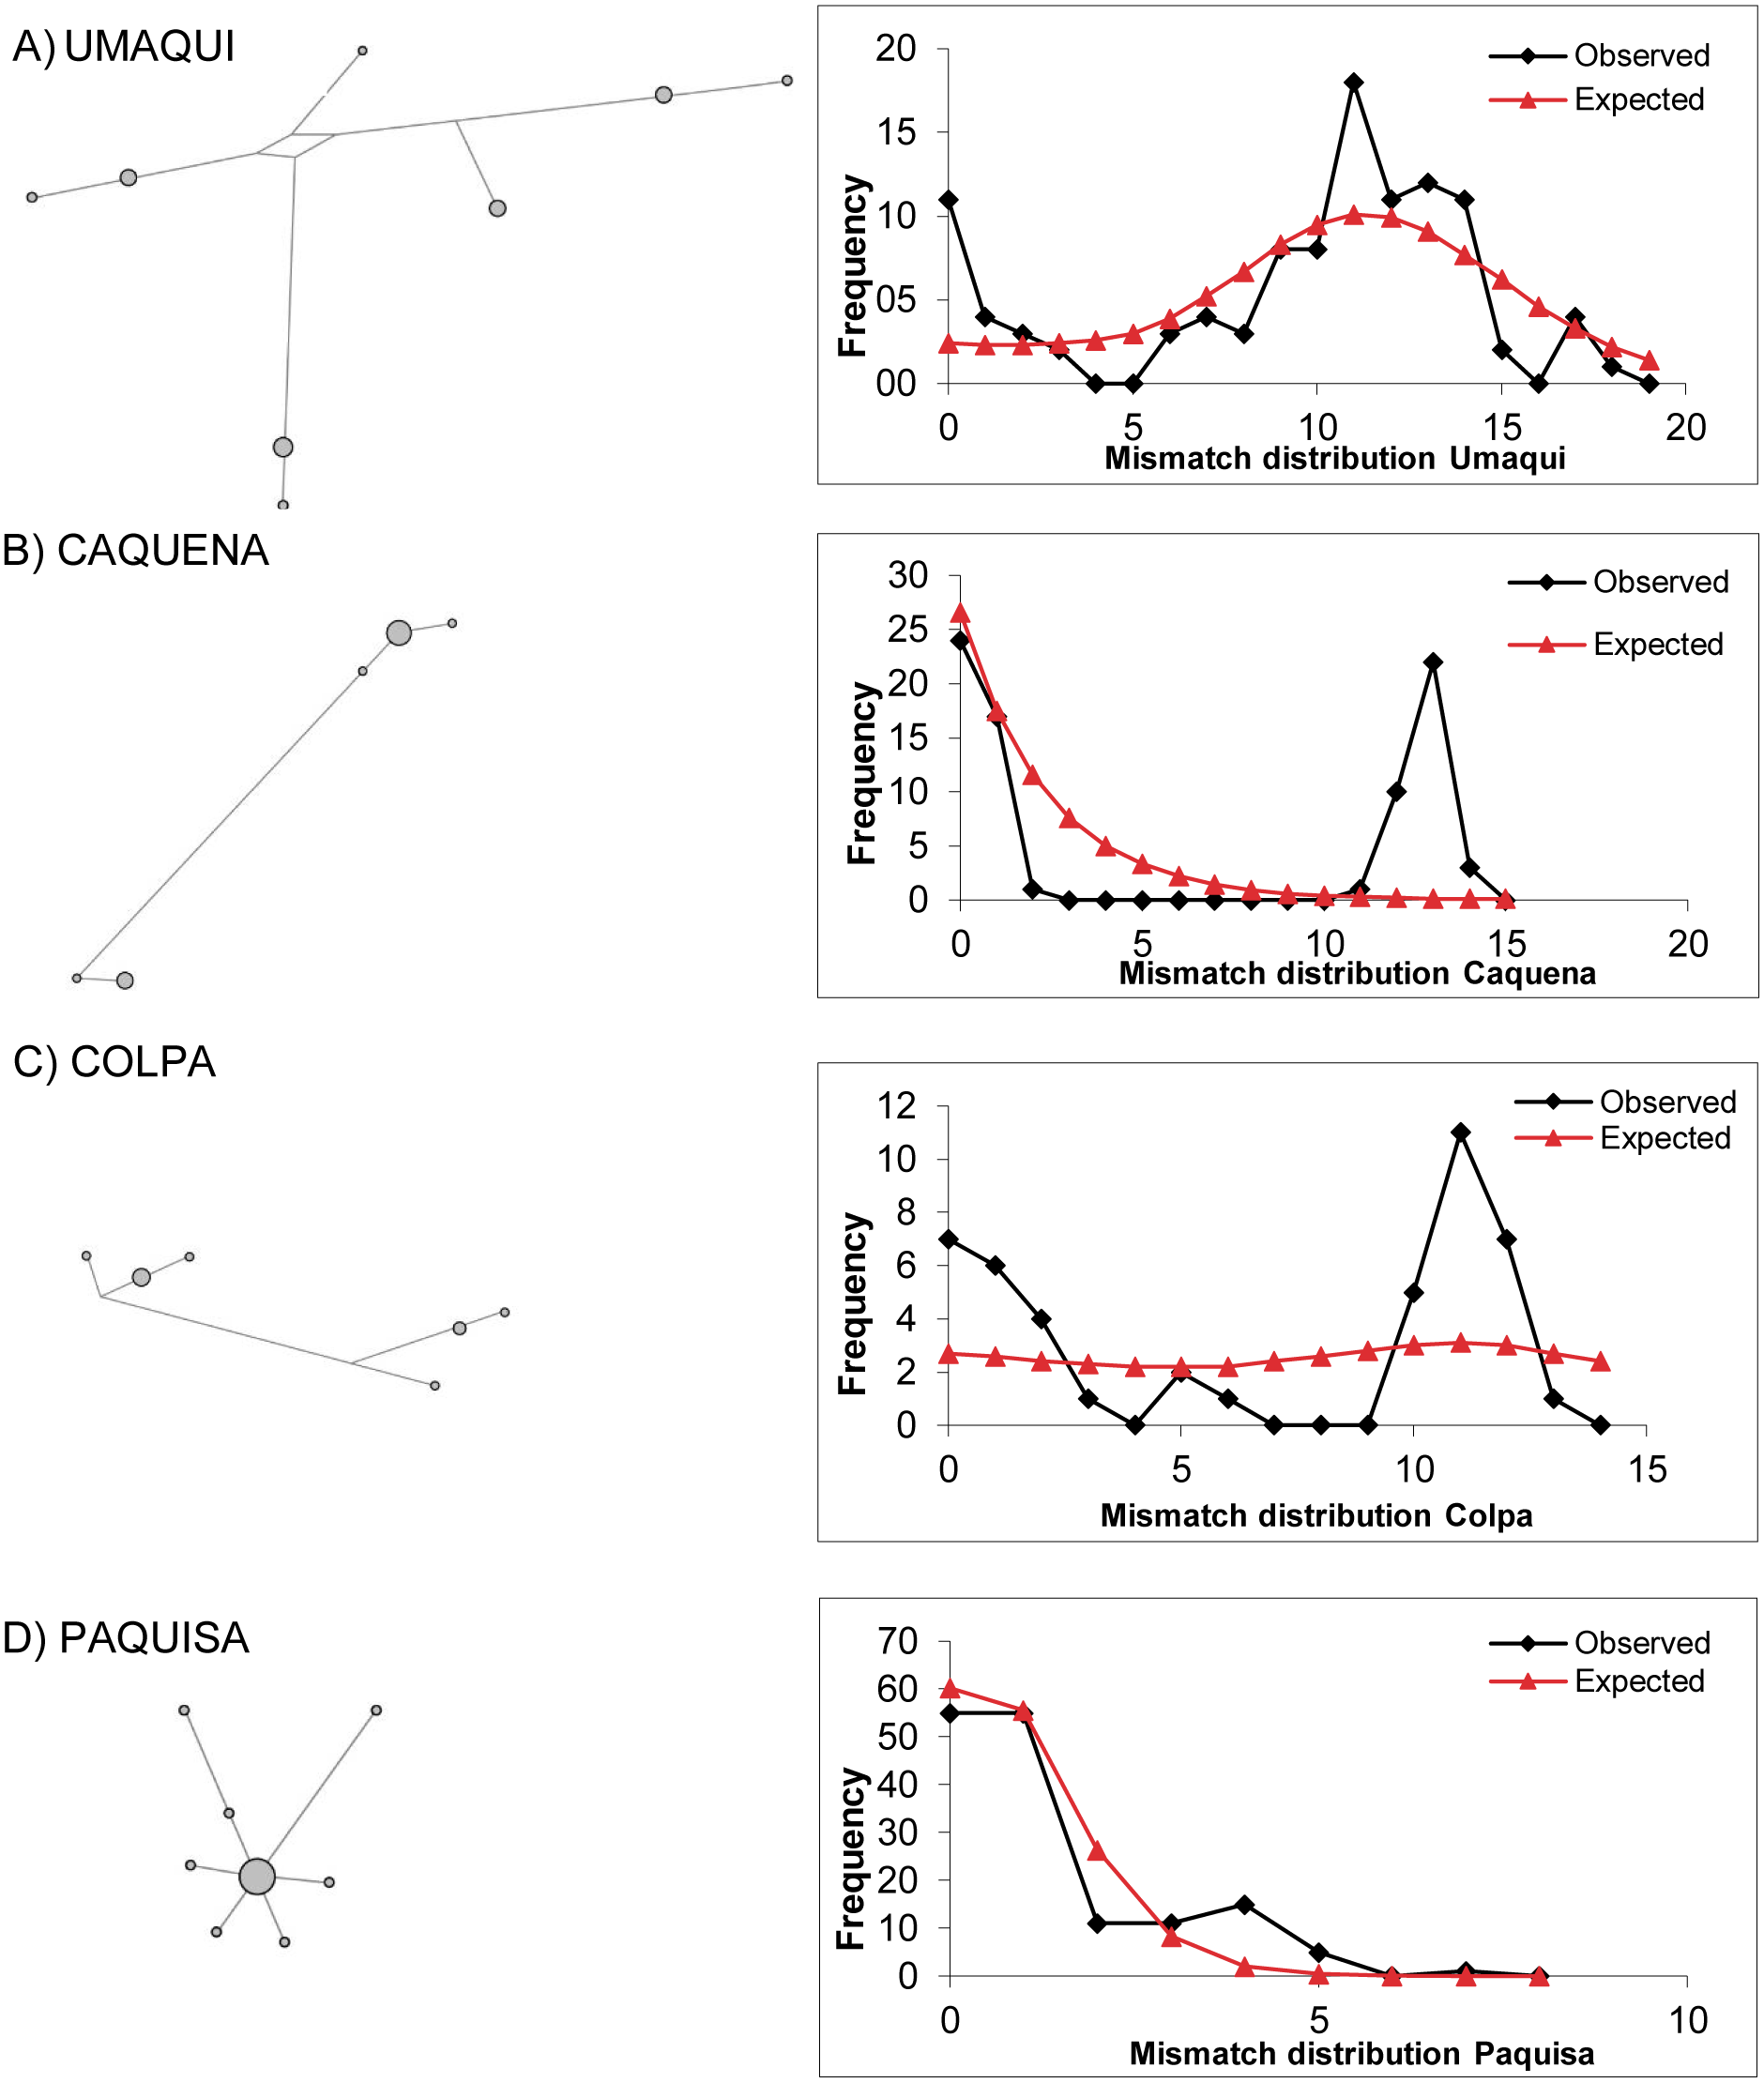
As found by Guerrero-Jiménez et al. (2017), the mismatch distribution was unimodal for the LNP localities and also for Paquisa (Fig. 3); this is consistent with the results of the indexes of Tajima and Fu, which were significant and negative for all these locations (Paquisa Fu: −2.14, p < 0.01/Tajima: −2.80, p < 0.02; LNP Fu: −2.27, p < 0.01/Tajima: −4.3, p < 0.02), indicating evidence of demographic expansion.
The mismatch distribution for Caquena sub-basin locations was multimodal (Fig. 3), and the Tajima and Fu indexes were positive but not significant (data not shown). It was not possible to perform this analysis for Ancuta, because only one haplotype was found. Considering this result, the models of demographic history of populations were tested only on those locations where evidence of population expansion was found.
The permutation analysis to evaluate the existence of phylogeographic structure showed a GST value lower than NST but it was not significant (p > 0.05) therefore it can be inferred that there is no phylogeographic structure between sub-basins.
Demographic analysis
Corresponding to parameters estimated by the demographic analyses performed, the calculation of the expansion time in years was based on numbers of mutational steps with a mutational rate of 3.99% per million years (Data S2).
According to the model of Schneider & Excoffier (1999) the time since the expansion for Paquisa is 14,800 yBP, while in the Kuhner model (2006), it corresponds to 9,250 yBP (Table 5). The times estimated since expansion for LNP locations were 5,245y BP and 7,750 yBP respectively.
Regarding the Bayesian skyline analysis performed, the mean of the uncorrelated relaxed clock model was, as mentioned, the value of the estimated rate per millions of years (3.99*10−6) and the prior distribution was computed as normal with an interval of 3.136*10−6– 4.664*10−6. The Bayesian Skyline Plots of populations showed the same patterns found on mismatch distributions. While historical Net of Caquena sub-basin populations Umaqui, Caquena and Colpa were stable over time with signals of population decline towards to recent time, Paquisa and LNP populations showed an expansion signal that began approximately 2.5–3 My BP for Paquisa population and 15-20,000 yBP for LNP populations. For Umaqui and Paquisa, the TMRCA was estimated approximately at 1My BP while for Caquena, Colpa and LNP was of 2.8My BP, 4My BP and 13,000 yBP respectively (Fig. 4).
| Demographic expansion model of Schneider & Excoffier (1999) Arlequin v. 3.5.1 | ||||
|---|---|---|---|---|
| τ=2µt | Ne0 | Ne1 | Time (years) | |
| LNP | 0.342 [0–2.02] |
7546.01 | 16150.31 | 5245 [0–37653] |
| Paquisa | 0.965 [0–2.094] |
0 | 300546.01 | 14800 [0–32055] |
| Coalescence model of likelihood Kuhner (2006) LAMARC v.3.2 | ||||
| G | Nei | Nef | Time (years) | |
| LNP | 14701.9 [19292.9–11128.6] | 34865.8 [76900.2– 11993.3] |
3.32*106 [6.50*106–1.15*106] |
7750 [5750–10250] |
| Paquisa | 12374.5 [17953.9-6510.2] |
6.59*106 [2.11*108– 3.72*104] |
6.42*108 [1.88*1010–3.55* 106] | 9250 [6250–17500] |
Notes:
- τ
-
tau
- µ
-
nucleotide substitution rate
- t
-
time from expansion (in mutational time units)
- Ne0
-
initial effective size
- Ne1
-
final effective size
- G
-
growth rate
- Nei
-
initial effective size
- Nef
-
final effective size
- []
-
confidence interval
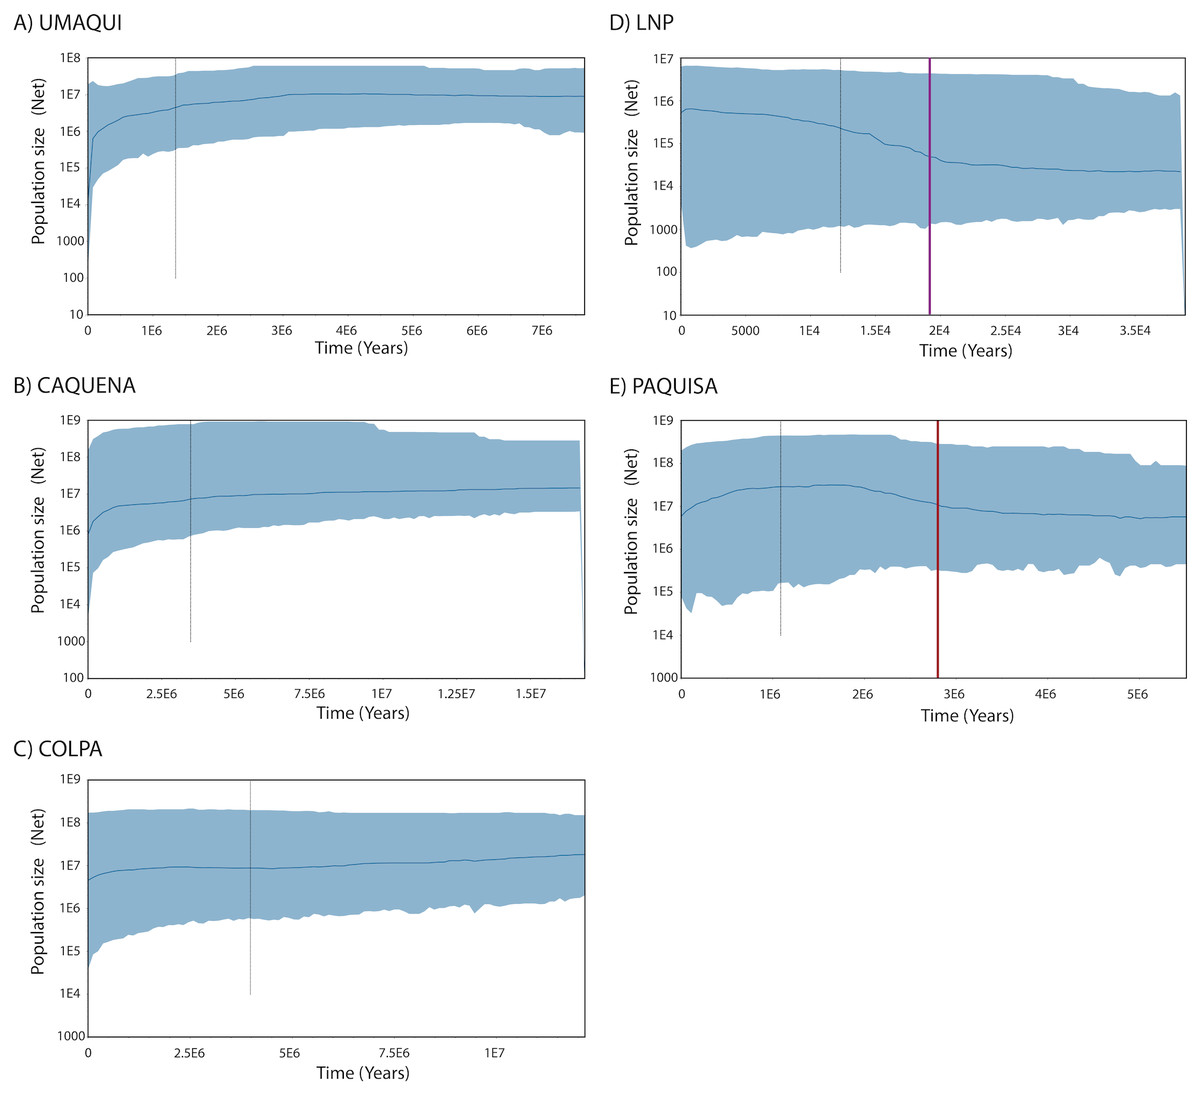
Figure 4: Demographic history from a Bayesian skyline plot analysis estimated using mitochondrial control region sequences of Orestias groups: (A) Umaqui, (B) Caquena, (C) Colpa, (D) LNP group and (E) Paquisa.
The x-axis shows the Time in years and y-axis shows the Population size as the product of effective population size (Ne) and generation time (t). The black solid line represents the median estimate of the estimated effective population size, and 95% highest probability density (HPD) interval corresponds to the shaded blue area. The segmented line corresponds to the estimated time of the most recent common ancestor (TMRCA) and the purple and red solid lines on (D) and (E) respectively correspond to the estimated time for the expansion of that populations.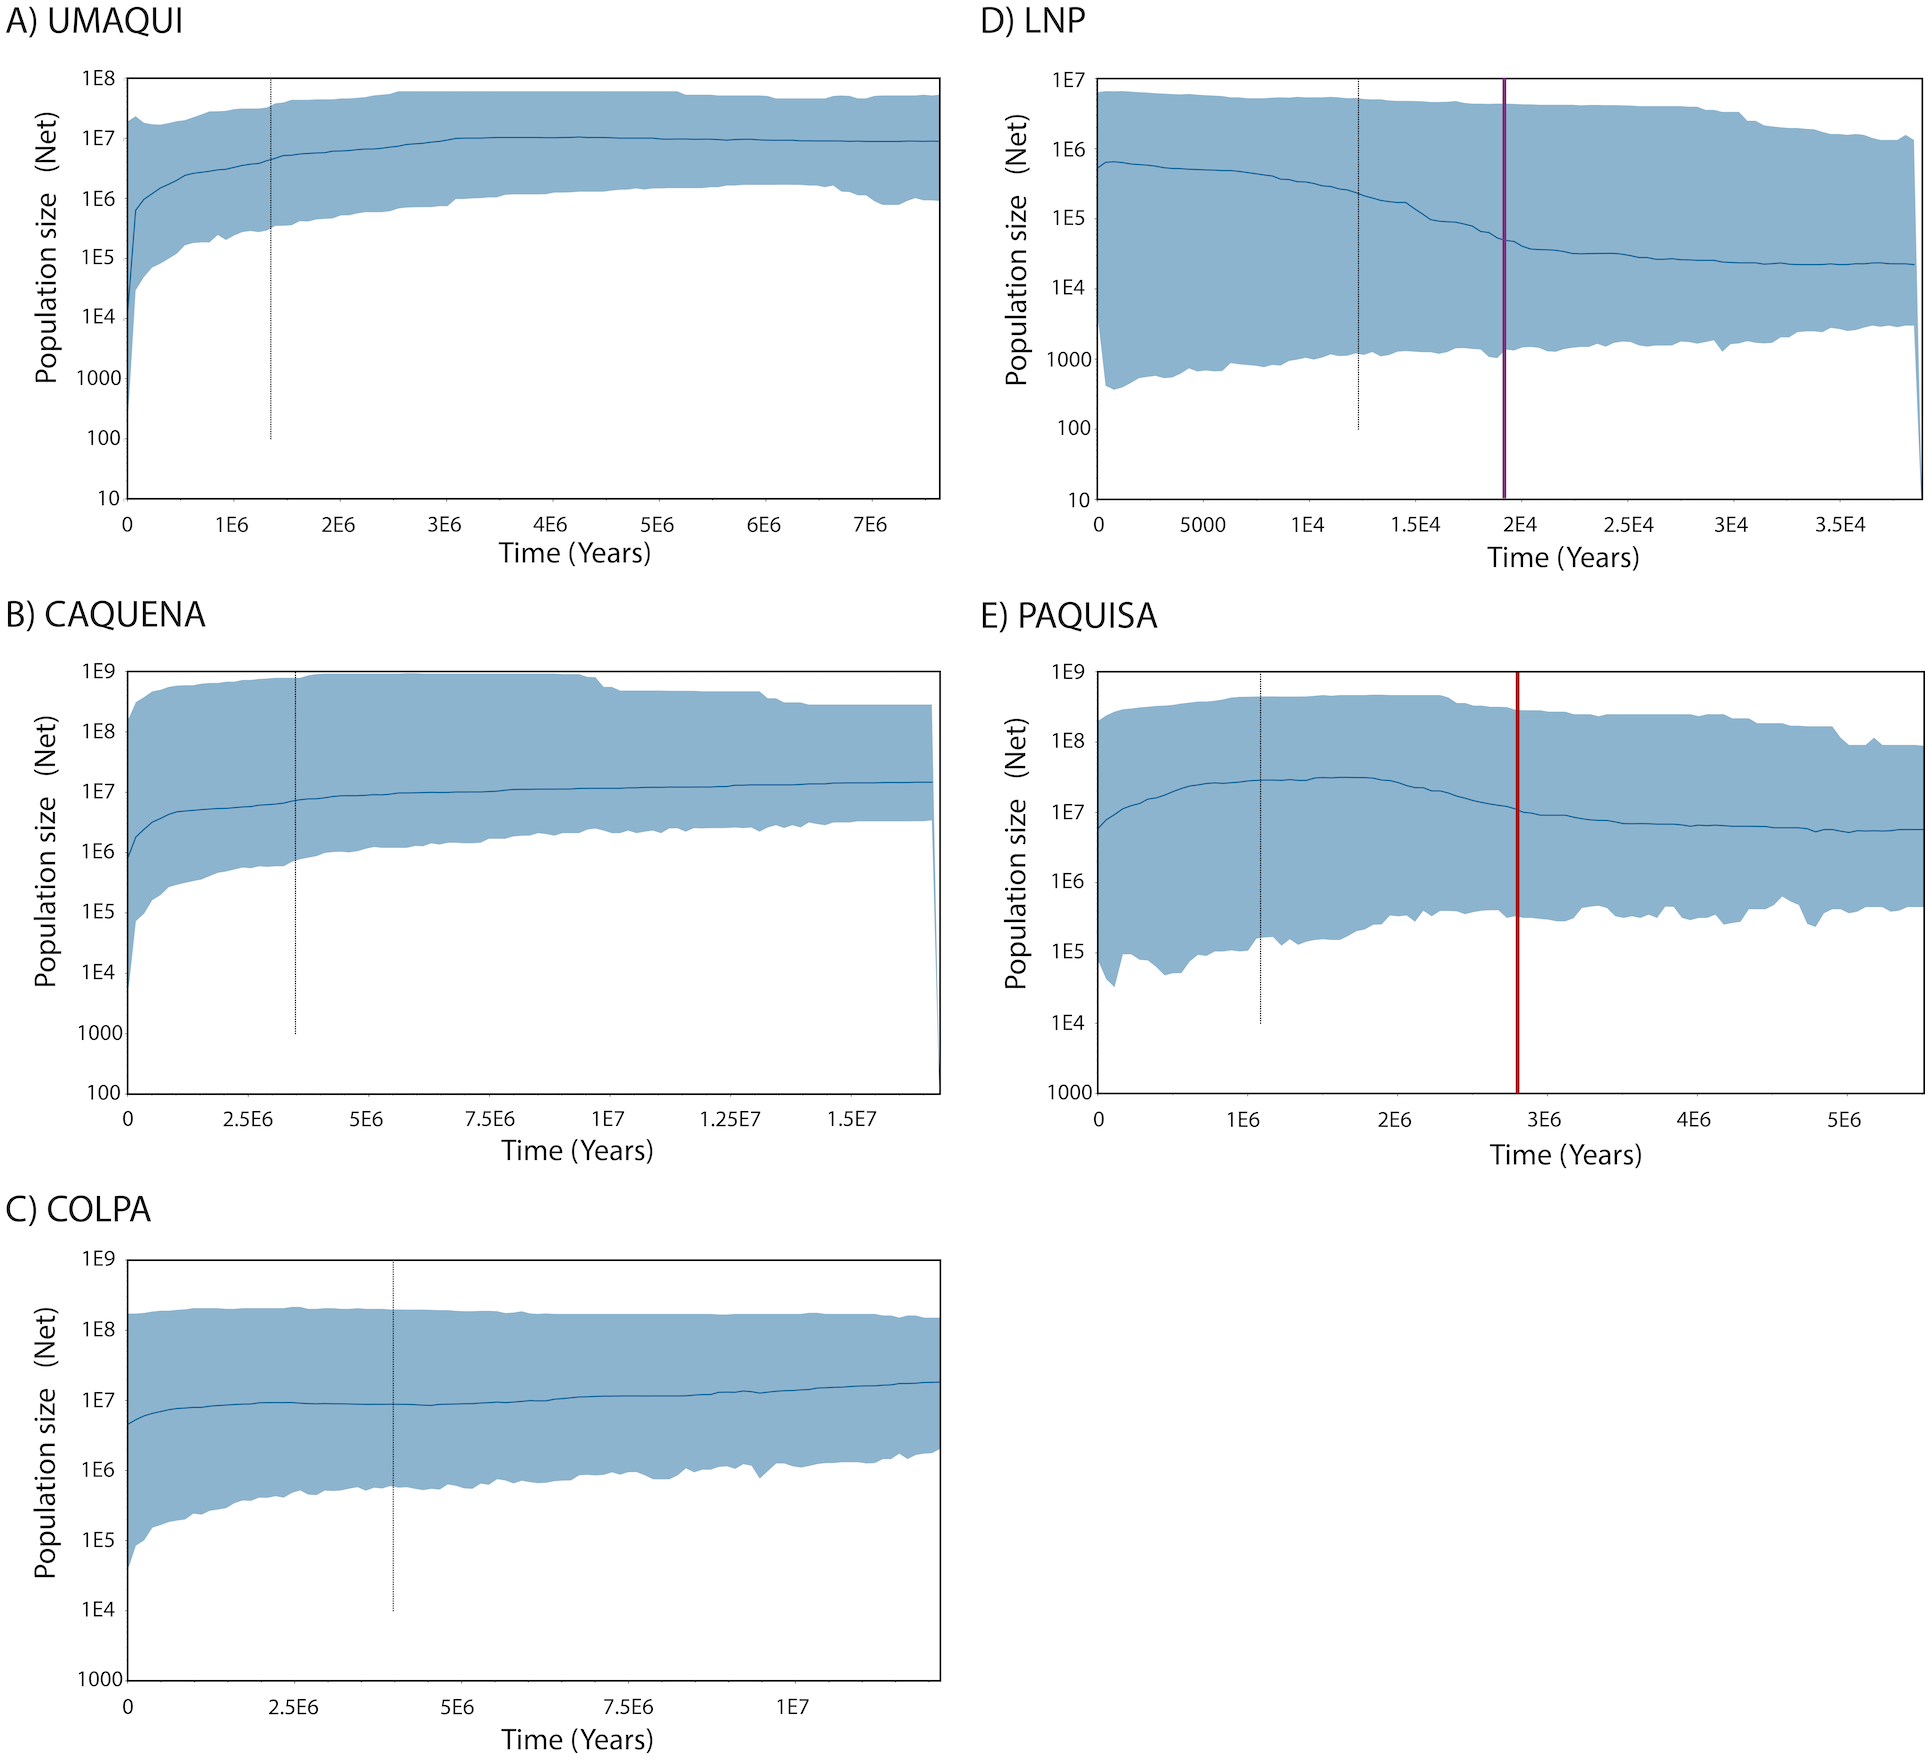
Nuclear DNA
Genetic diversity
Multilocus genotypes of 207 individuals in 9 locations were obtained. The analysis of the data with Micro-checker did not find null alleles, stuttering errors or significant deviations from the Hardy-Weinberg equilibrium. In addition, no linkage imbalances were found among loci within populations after applying the Bonferroni correction. Descriptive indices of genetic diversity are shown in Table 6.
As was observed on mtDNA diversity, Ancuta showed lowest values in all the indexes analyzed. FIS showed non-significant values in almost all the localities except for Misituni, where it was positive and significant.
Differentiation among populations
FST analyses (Table 7) indicated that the comparisons of locations between and within sub-basins show highly significant differentiation values (p < 0.0001) except for the Copapujo-Chuviri and Lauca-Misituni pairs, both from the Lauca sub-basin, where the values of the index were not significant.
Individual assignment (GeneClass) to the populations delimited by pairwise FST analysis (Fig. 5), showed a high percentage (75%) of correct assignments to their reference location. Caquena and Paquisa had 100% correct assignments, while the localities of LNP show a great percentage of individuals that were not reassigned to their reference location.
Genetic structure and cluster assignment
Bayesian analysis (Structure) to infer the number of genetic groups (K) of the individual genotypic data is shown in Fig. 6, where it was obtained, in which the appropriate number of genetic groups based on Ln (P) of the sample is five, formed by Umaqui and Colpa; Caquena; Chuviri and Copapujo; Lauca and Misituni and finally a group with Ancuta and Paquisa.
Discussion
It has been proposed that the uplift of the altiplano occurred mainly during the Miocene-Pliocene period, whose greatest height would have been reached at the end of the Pliocene (∼5–2 MyBP) (Villwock, 1983; Muñoz & Charrier, 1996; Lamb & Davis, 2003). In this period, the Caquena and Lauca sub-basins would have risen above 4,000 m.a.s.l. During this process, together with high tectonic activity, atmospheric and oceanic circulation, it would have promoted hyper-arid climatic conditions in the area (Lamb & Davis, 2003), even when highly variable rainfall regimes are reported (Feitl et al., 2019). Our results showed an expanded haplotype network, with some shared haplotypes between Caquena and LNP populations, which suggests the existence of an ancient lineage with presence in both Caquena and Lauca sub-basins. Individuals of this ancient population of Orestias would have colonized the different limnic systems of the sampled area where the variation in water levels given by the alternation between wet and dry periods would have allowed the sporadic connection of some of them. During the arid periods, isolation, local adaptation and genetic differentiation were promoted, while the wet periods facilitated gene flow (Moreno et al., 2007). Additionally, local pressures like volcanism and anthropic activity would have had a differentiated effect on localities over time (Fig. 7).
| Sub-basin | Location | N | A | Hobs | Hexp | FIS |
|---|---|---|---|---|---|---|
| Caquena | UMA | 20 | 9.500 | 0.674 | 0.688 | 0.046NS |
| CAQ | 20 | 6.125 | 0.543 | 0.548 | 0.035NS | |
| COL | 20 | 8.250 | 0.685 | 0.647 | −0.034NS | |
| Lauca | CHU | 15 | 4.375 | 0.453 | 0.451 | 0.038NS |
| COP | 19 | 4.250 | 0.496 | 0.469 | −0.012NS | |
| LAU | 34 | 5.250 | 0.520 | 0.513 | 0.004NS | |
| MIS | 42 | 6.625 | 0.493 | 0.538 | 0.097* | |
| ANC | 17 | 3.125 | 0.309 | 0.303 | 0.012NS | |
| PAQ | 20 | 6.125 | 0.519 | 0.523 | 0.033NS |
Notes:
- N
-
number of individuals
- A
-
mean number of alleles per locus
- SD
-
standard deviation
- Hobs
-
observed heterozygosity
- Hexp
-
expected heterozygosity
- FIS
-
endogamy index
- NS
-
nonsignificant
- *
-
p < 0.05
| FST | UMA | CAQ | COL | CHU | COP | LAU | MIS | ANC | PAQ |
|---|---|---|---|---|---|---|---|---|---|
| UMA | *** | * | *** | *** | *** | *** | *** | *** | |
| CAQ | 0.11508 | *** | *** | *** | *** | *** | *** | *** | |
| COL | 0.03453 | 0.09327 | *** | *** | *** | *** | *** | *** | |
| CHU | 0.26120 | 0.33904 | 0.29692 | NS | *** | *** | *** | *** | |
| COP | 0.22754 | 0.31640 | 0.27715 | 0.00955 | *** | *** | *** | *** | |
| LAU | 0.25316 | 0.30655 | 0.27420 | 0.09676 | 0.11751 | NS | *** | *** | |
| MIS | 0.23674 | 0.29918 | 0.25849 | 0.07809 | 0.08711 | 0.00911 | *** | *** | |
| ANC | 0.31965 | 0.31940 | 0.36195 | 0.50843 | 0.47407 | 0.42248 | 0.41178 | *** | |
| PAQ | 0.15498 | 0.17257 | 0.18544 | 0.35136 | 0.31075 | 0.32431 | 0.31447 | 0.27961 |
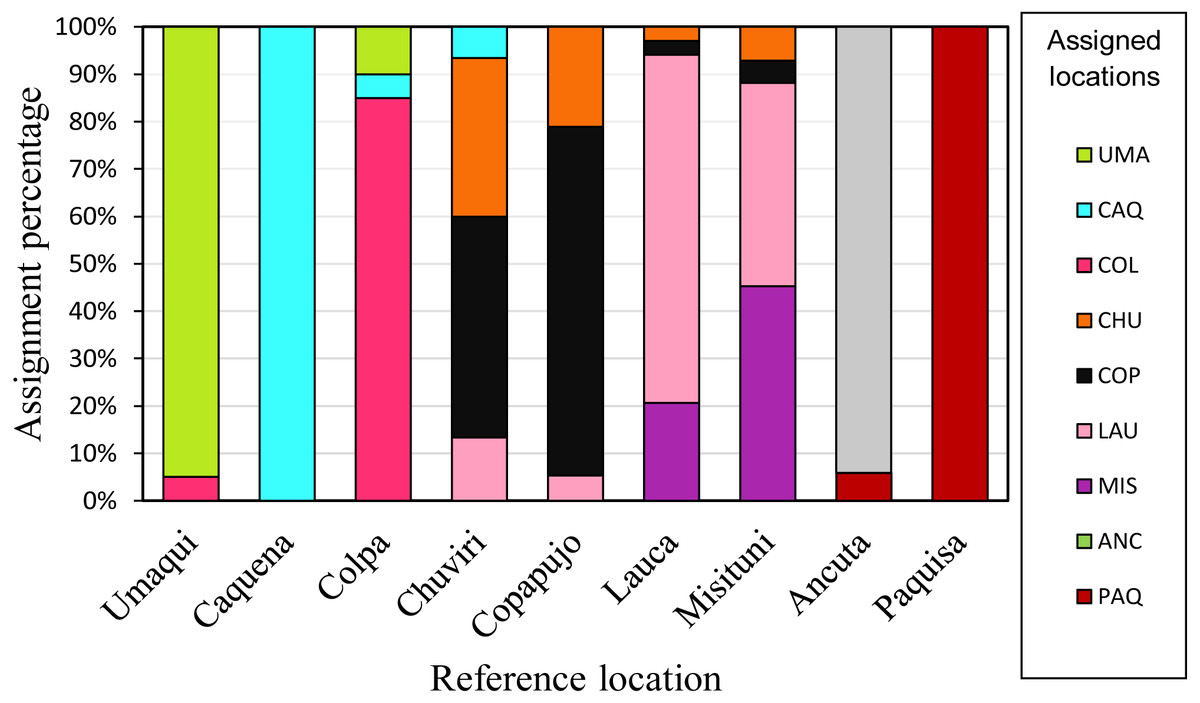
Figure 5: Reassignment percentages of studied locations.
Reference locations are on the X axis and the percentage of reassignment is on the Y axis. Different colors of the bars represent the percentage of individuals from each assigned location. The colors of each locality are the same as in the haplotype network.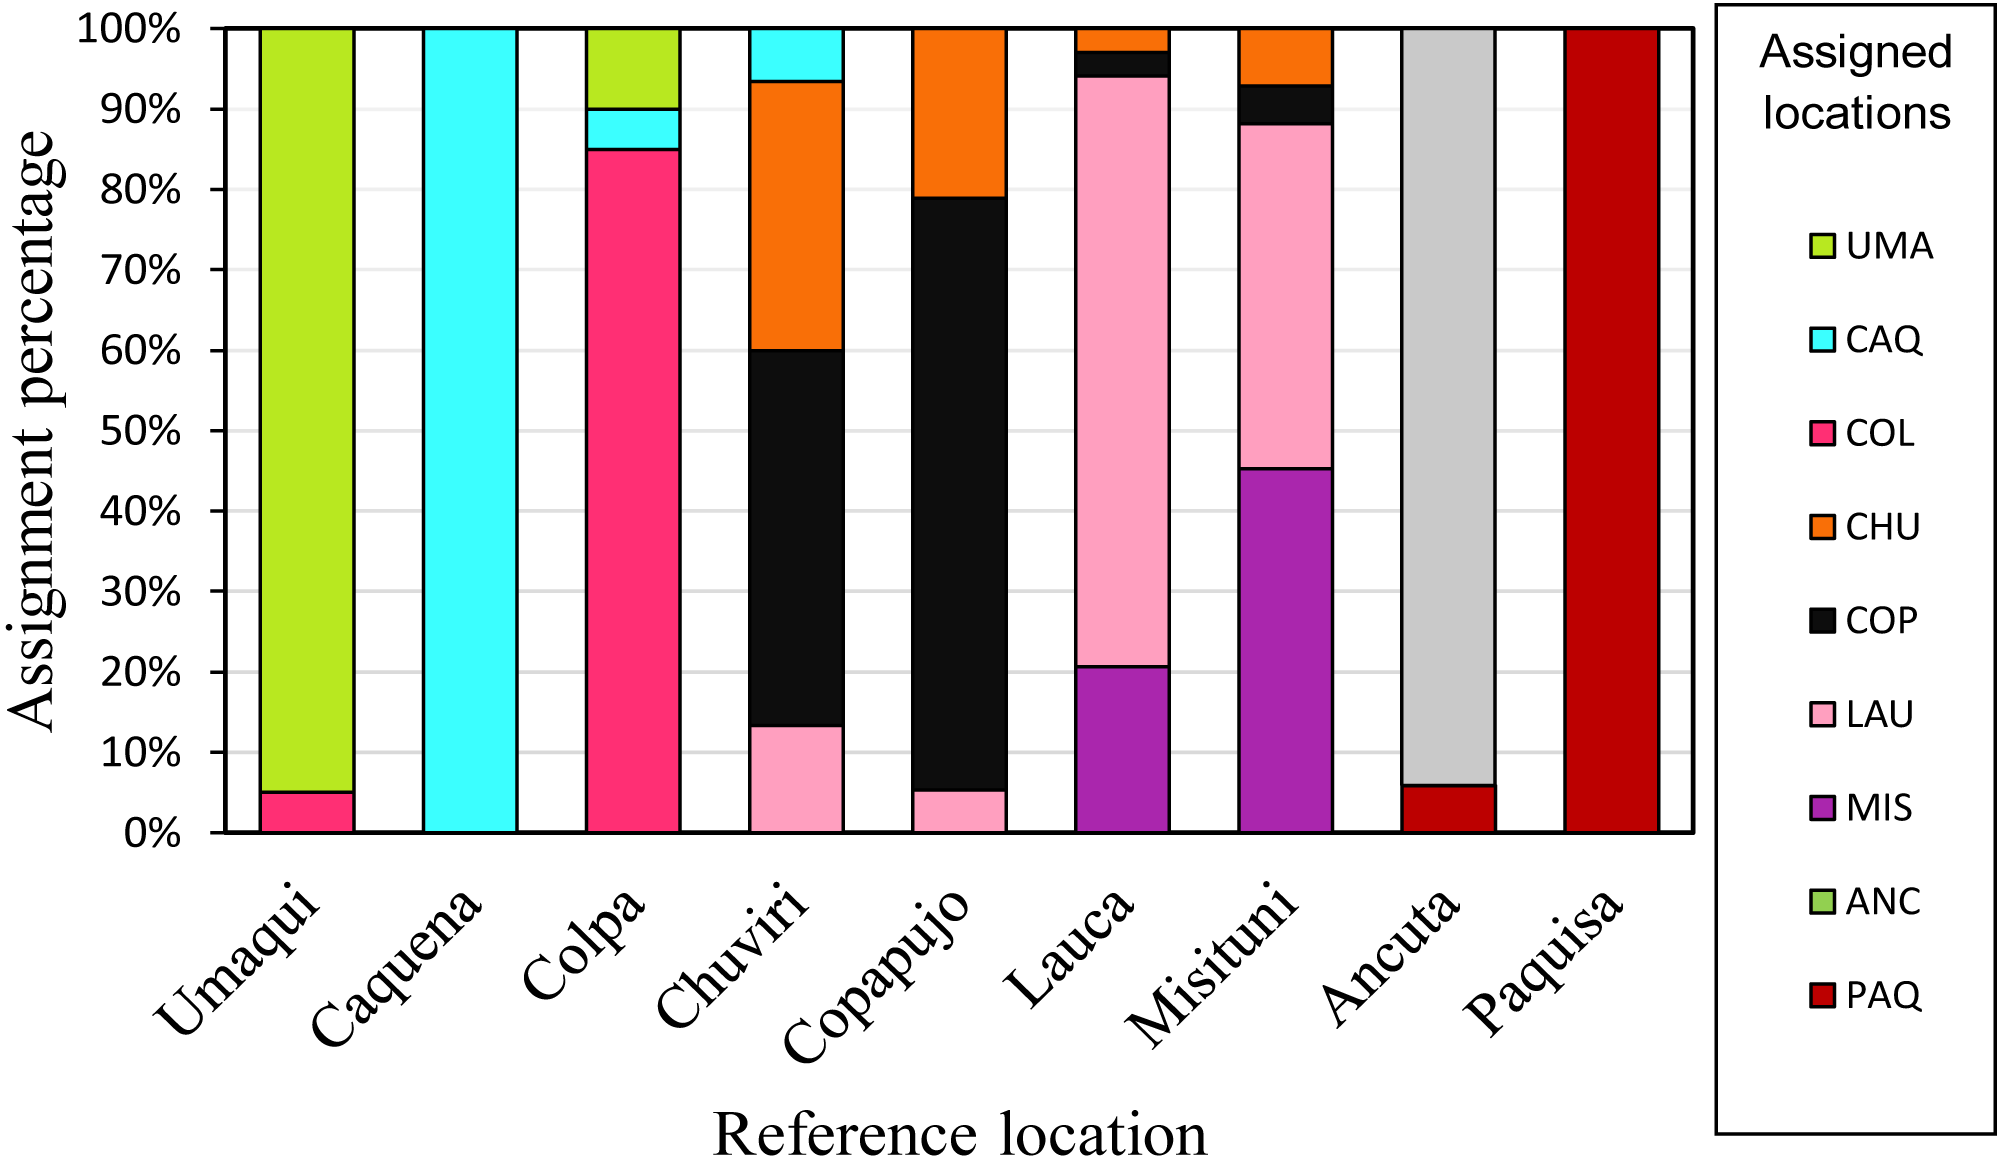
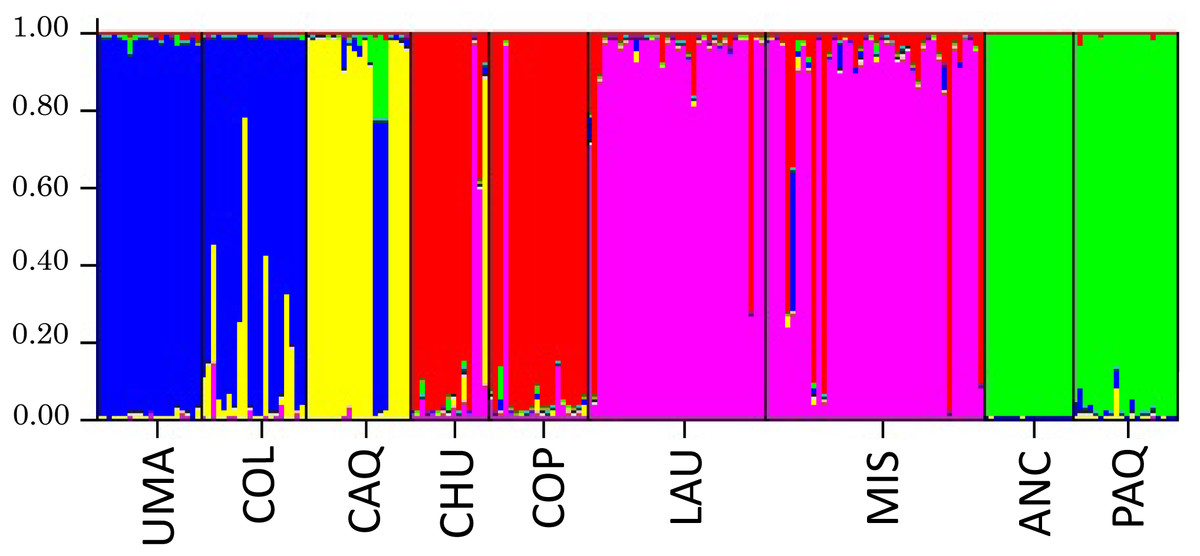
Figure 6: Results of the analysis of genetic structuring and cluster assignment (Structure) for all locations analyzed with k = 5.
Each vertical line represents an individual, grouped according to their place of origin separated by black lines. Each color corresponds to a genetic group. The different colors in each individual represent their probability of assignment to that genetic group.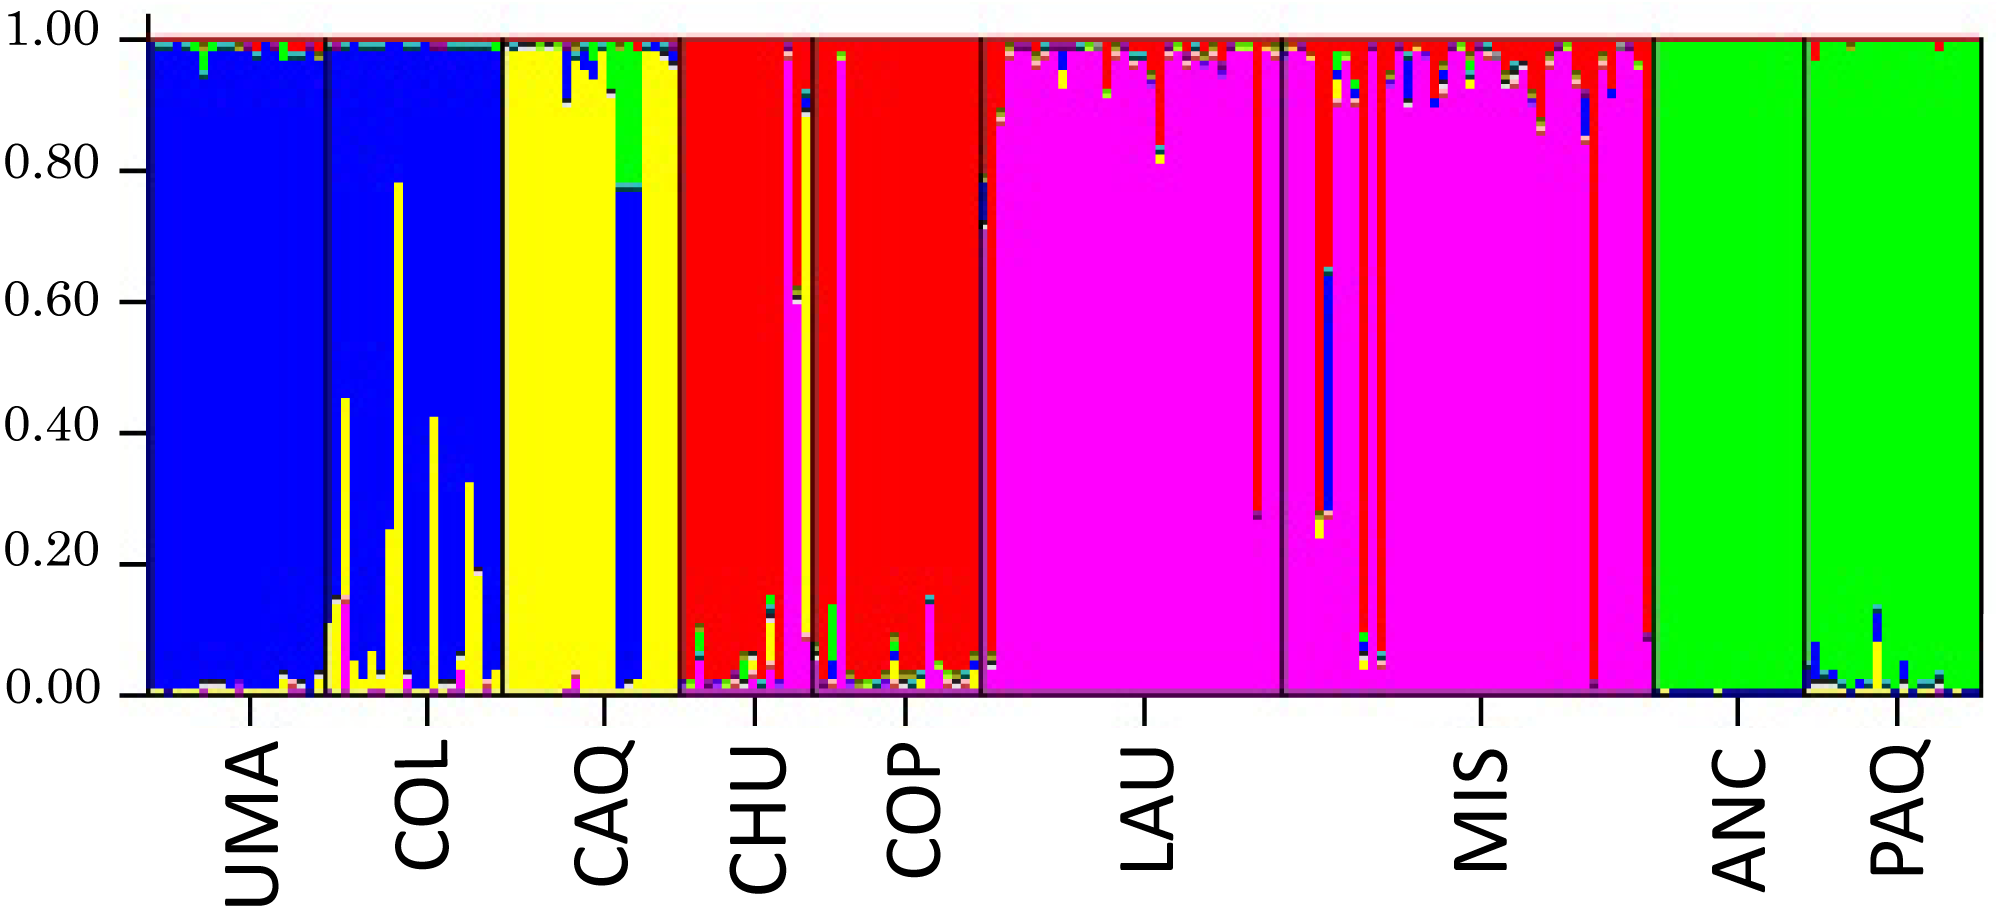
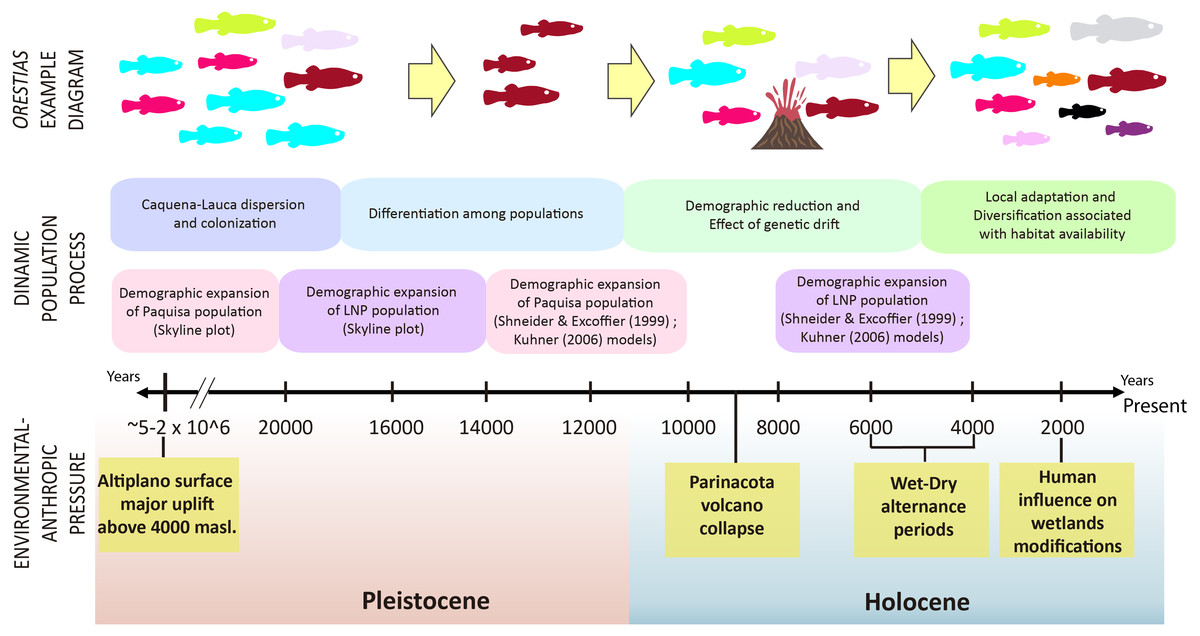
Figure 7: Timeline and diagram of results interpretation.
Fish color icons are the same as the haplotypes used in the haplotype network of results.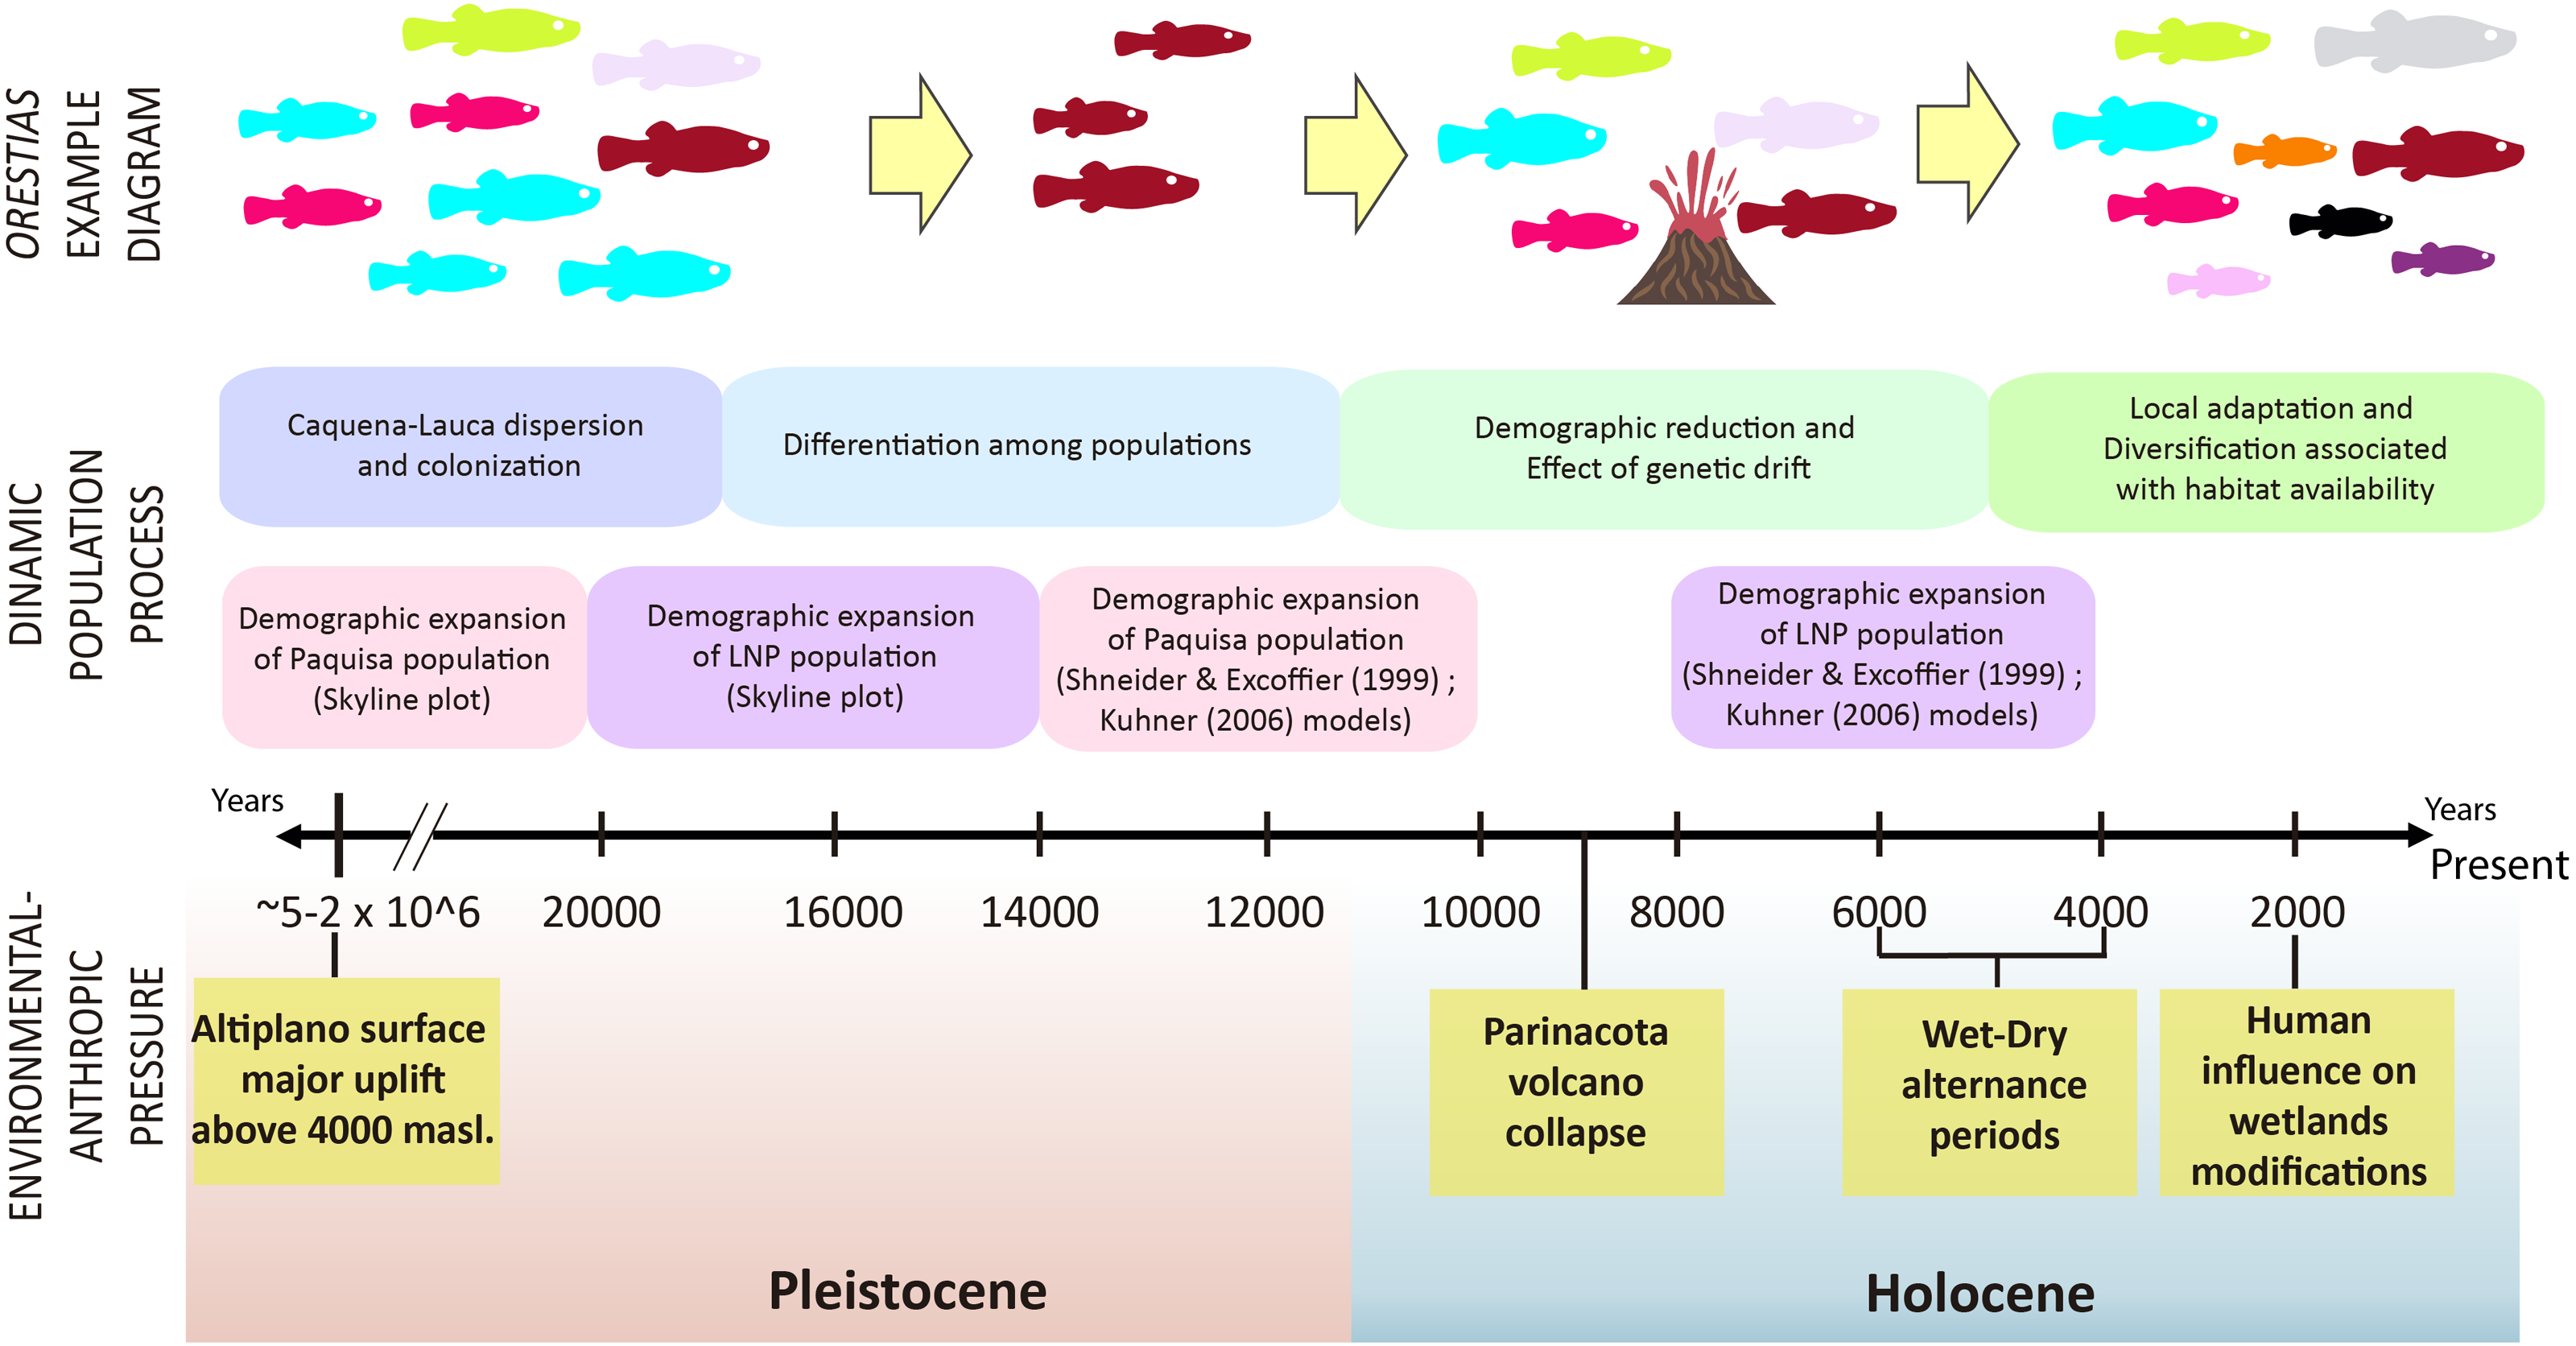
Caquena sub-basin
The Caquena sub-basin area is covered by wetlands (bofedales) formed by cushion plants and other azonal vegetation; several water courses flow in different directions that may or may not discharge into a main course. Pollen record studies of Domic et al. (2018) show that these characteristics have been present at least since 1,400 yBP and could have been promoted by human activity since 2,000 yBP; using the land to maintain grazing areas and water availability would have encouraged humans to maintain them and expand them across the area. The ashes found in cores indicate that volcanism did not have a significant effect on the local vegetation community, which remained stable over 7,000 yBP. When the level of water rises, this landscape characteristic allows the rapid connection for a wide area and facilitates the exchange of biota, which would have allowed it to maintain effective migrants of Orestias over time. Results of Fu and Tajima indexes were positive but not significant. Therefore, no evidence of demographic expansion could be probed. However, the multimodal distribution of differences between pairs of sequences of populations of Caquena sub-basin, the Bayesian skyline plots and network results are coherent with those of populations that have remained stable over time (Slatkin & Hudson, 1991; Harpending et al., 1993). This homogenization process may continue to occur today, given the seasonal wet variation within the year.
Lauca sub-basin
The collapse of the Parinacota volcano (8,800 yBP) is cited as one of the principal modifiers of the Lauca sub-basin area during the Pleistocene-Holocene ages; it gave origin to varied aquatic systems that remain today. This volcanic event would have had a local effect mainly with two different patches, one that reached approximately a 150 km2 zone that was buried by an avalanche of debris (Jicha et al., 2015), and another given by the modification of course of the Paleo-Lauca River that changed from northerly to southerly (Sáez et al., 2007), affecting the connectivity of some areas of the sub-basin. It was observed the conformation of two well-defined haplotype groups on the sub-basin, one containing the LNP localities and the other with Ancuta-Paquisa localities, however it is important to highlight that they are inserted on a wider haplotype network sharing genetic diversity with the neighbor Caquena sub-basin. Our results support that, as was demonstrated by Guerrero-Jiménez et al. (2017) on LNP, the fragmentation of hydrological systems, would have restructured the gene flow between the populations of Orestias that inhabit them. Initially by a decrease in the effective size that, due to the effect of genetic drift, decreased the number of haplotypes and later, by a demographic expansion that increased the number of individuals but with genetic diversity remaining scarce. Subject to the generation of new environmental conditions and the ability of populations to respond to them, new genetic diversity would be generated. A star-like pattern was found for the haplotype network of both LNP and Paquisa populations, both had unimodal mismatch distributions and also both showed signals of population expansion on Bayesian skyline plot. However, their starting point of demographic expansion was different. For LNP, the range of estimated dates with both Schneider & Excoffier (1999) and Kuhner model (2006) models were after the date of the volcanic collapse making it more likely that the demographic expansion detected could be attributable to the geological changes caused by this event. For Paquisa, on the other hand, despite the range of intervals calculated for both models was wider, the date of demographic expansion was rather before the collapse (Table 5). Yet although the timing of population expansion start time estimated by the Bayesian skyline analysis was earlier than that estimated by the other models, all three models agree on Paquisa expansion time would have been earlier than LNP populations. In addition, it is remarkable the high differentiation of FST and ΦST indexes of Paquisa-Ancuta with all other sampled locations. This high genetic distance seems to respond to an older isolation reached before the change in the course of Lauca River and suggests their haplotypes might have not been constituted as a consequence of the volcanic collapse 8,800 yBP rather it could have been generated together with the uplift of Altiplano 5–2 M yBP (Villwock, 1983; Kött, Gaupp & Wörner, 1995; Muñoz & Charrier, 1996; Lamb & Davis, 2003).
The reconstruction of geological history of the basin, indicates a shallower northern part and a southern part which houses its oldest deposits. Over this area the existence of closed lake conditions with significant variation on water level has been probed (Feitl et al., 2019). This Lake (3.7 < 0.25 MyBP), was progressively replaced by rivers and ponds to several terraces fragmented the area by precursors of Lauca River and its tributaries (Kött, Gaupp & Wörner, 1995; Gaupp, Kött & Wörner, 1999). These antecedents suggest that not only the volcanic activity could have effects on the evolutionary history of the Orestias populations and that perhaps in the southern area (Ancuta-Paquisa) of the Lauca sub-basin, events of landscape modifications such as variations in water levels could have had greater incidence on the genetic differentiation of their populations.
A shared history?
Further analysis is required for the comprehension of Orestias colonization processes across the Altiplano basin, however, this study provides new evidence that contributes to the reconstruction of its evolutionary history.
The geological and climatic variations that occurred after the collapse of the Parinacota volcano, strong volcanic activity 8,000–4,000 yBP followed by arid and humid periods, gradually generated the arid and warm conditions that prevail today (Placzek, Quade & Patchett, 2006; Vila et al., 2013) and gave way to the formation of aquatic systems as we know them. This transition process would have increased geographic isolation among the sampled populations, restricting dispersion and promoting genetic diversification associated with local adaptation, which is reflected in the microsatellite results where FST comparisons (Table 7) and reassignment tests (Fig. 5) show similarities between geographically closest localities and the five genetic groups that were identified with the cluster analysis, Caquena, Umaqui-Colpa, Copapujo-Chuviri, Lauca-Misitune and Ancuta-Paquisa (Fig. 6). Nuclear marker analysis results were coherent with those obtained by mitochondrial data. These confirm the scenario of recent diversification and incipient speciation process of Orestias that was described by Guerrero-Jiménez et al. (2017) in Lauca National Park but it shows signs that it is framed on a much older evolutionary history that points to a shared history of all populations sampled before the conformation of the sub-basins, meaning that what was reported for the LNP would respond to a local disturbance. According to this, we hypothesize that first there was an original widespread population across Caquena and Lauca sub-basins due to variations in the water level and their adaptation to environmental conditions that allowed them to establish. Then this population was subjected to local disturbances that strongly affected the connectivity of some areas like isolation (Ancuta-Paquisa) and fragmentation of habitat but were not significant for others (Caquena sub-basin localities). Finally, the availability of novel habitats with different environmental characteristics resulted in genetic diversification (mainly in LNP). Additionally, we think that the high genetic differentiation found for Ancuta-Paquisa from the rest might be the result of an older event and could be attributed to different factors. One of these explanations could be a border colonization of individuals that would have been carriers of low frequency haplotypes of an ancient population that reach this area and remained isolated even after the collapse of Parinacota volcano.
Finally, it is important to point out that the processes of connection and disconnection between populations would be associated with both past and present environmental conditions, and also that both Caquena and Lauca sub-basins are part of broader hydrological networks connected with Bolivia and Peru, which creates a framework of much greater possibilities when it comes to elucidating the possible routes that would account for the colonization of Orestias through the Altiplano and for the understanding of their diversification processes, thus it would be of great importance to expand these studies to the neighboring basins in Bolivia and Perú.
Implications for conservation
Altiplano aquatic systems are highly threatened and tend to desiccation and salinization because they are immersed in a desert matrix that intensifies significantly year after year (Demergasso et al., 2010). It is expected that current climatic conditions will be different according to the particularities of the ecosystems and specific places (Sarricolea Espinoza & Romero Aravena, 2015; Sarricolea Espinoza, Meseguer Ruiz & Romero Aravena, 2017). These highland aquatic ecosystems are faced with various threats, among which are legal factors derived from the regulatory status that Chile adopted for water resources, the overexploitation of aquifers especially associated with their high use in the mining industry, and water pollution which has created hydric stress throughout the area (Instituto Geográfico Militar (IGM), 1983; Ministerio del Medio Ambiente (MMA), 2018). Studies of genetic diversity are key to the development of conservation and management strategies to allow conservation efforts to be directed towards these most vulnerable populations and to be able to recover and maintain them in the long term, minimizing the impacts that anthropic activity could generate on them (Ministerio del Medio Ambiente (MMA), 2018). They are a significant source of knowledge for the understanding of the evolutionary history of species and how they have been related over time.
Despite the fact that they now inhabit separate basins, the Orestias populations of the Caquena and Lauca sub-basins have a shared history and represent different conservation units, whether due to the age of their haplotypes, the genetic diversification processes that continue to occur or for the uniqueness of their genetic diversity, hosting a relevant gene pool for this genus and maybe not only for it but also of the biodiversity that characterizes the entire area. However, the status of protection of these sub-basins is still in development. While the Caquena sub-basin has been considered in a national plan to protect wetlands that should be fully implemented in 2022, Lauca sub-basin is protected by a National Park and a National Reserve (Fig. 1). Even with these measures, during sampling we observed anthropic perturbations inside it such as the extraction of water to moisten the roads and the channeling of water courses for the mining industry, increasing water quality deterioration.
Conclusions
The performed analyzes allowed us to use the information obtained from mitochondrial and nuclear molecular markers to characterize genetic diversity and reconstruct part of the evolutionary history of Orestias in the Caquena and Lauca sub-basins. It was found that although the localities have variable genetic diversity and are differentiated from each other, they share genetic diversity. Our results revealed a scenario where Orestias of Caquena and Lauca sub-basins shared its evolutionary history by the presence of ancient lineages. These groups that would have dispersed throughout this area were affected by local disturbances that fragmented and isolated them. We deduced that geological and hydrological events occurred mainly during Pleistocene-Holocene ages, affected the studied sub-basins differently, and we provide some genetic evidence about how the collapse of the Parinacota volcano would have had an effect on the Orestias populations closest to its volcanic cone as LNP populations, but it would not have reached the most distant populations, as Ancuta-Paquisa area and Caquena sub-basin. Moreover, our results allowed us to infer that the genetic differentiation processes of the LNP populations are more recent than those occurred in the rest of the sampled localities. Further studies of taxa cohabitant with Orestias would allow contrasting their diversification patterns and strengthen the proposal of genetic and ecological differentiation processes in the Altiplano aquatic ecosystems.
Altiplano aquatic ecosystems harbor very unique characteristics of environmental conditions and biodiversity and they face varied types of threats to their conservation and consequently to the taxa that inhabit them. Studies of this type will provide basic information to formulate proposals for conservation and management strategies that guide decision-making regarding their protection.