
Heterogeneity of gut microbial responses in healthy household dogs transitioning from an extruded to a mildly cooked diet
- Published
- Accepted
- Received
- Academic Editor
- Korakot Nganvongpanit
- Subject Areas
- Bioinformatics, Microbiology, Molecular Biology, Veterinary Medicine, Nutrition
- Keywords
- Canine microbiome, Canine nutrition, Diet processing, Dog kibble, Fresh food, Pet food
- Copyright
- © 2021 Tanprasertsuk et al.
- Licence
- This is an open access article distributed under the terms of the Creative Commons Attribution License, which permits using, remixing, and building upon the work non-commercially, as long as it is properly attributed. For attribution, the original author(s), title, publication source (PeerJ) and either DOI or URL of the article must be cited.
- Cite this article
- 2021. Heterogeneity of gut microbial responses in healthy household dogs transitioning from an extruded to a mildly cooked diet. PeerJ 9:e11648 https://doi.org/10.7717/peerj.11648
Abstract
Background
The gut microbiota (GM) is associated with canine health and can be impacted by diet. Dog owners in the U.S. have increasingly shown an interest in feeding their dogs a mildly cooked (MC) diet. However, its impact on canine GM and health remains largely unknown.
Methods
Healthy household dogs were tracked upon switching from various brands of extruded to MC diets for four weeks. A health assessment was completed and stool samples were collected by each owner before (day 0) and after the diet transition (day 28). Shotgun metagenomic sequencing was performed at both time points to characterize the GM.
Results
Dogs completed the study by either completing the health assessments (n = 31) or providing stool samples at both time points (n = 28). All owners reported either better or no change in overall health at the end of the study (61% and 39%, respectively), and none reported worse overall health. Defecation frequency was also reported to be lower (58%) or about the same (35%). Principal coordinate (PCo) analysis showed a significant shift (p = 0.004) in the β-diversity of the GM upon diet transition (34.2% and 10.3% explained by the first two axes). The abundances of 70 species increased after the diet change (adjusted p < 0.05), 67% and 24% of which belonged to the Lactobacillales and the Enterobacterales orders respectively. The abundances of 28 species decreased (adjusted p < 0.05), 46%, 18%, and 11% of which belonged to the Clostridiales, Bacillales, and Bacteroidales orders, respectively. Lower Lactobacillales and Enterobacterales, and higher Bacteroidales at baseline were associated with a greater shift along the PCo1 axis. Protein content of the baseline diet was correlated with the shift along the PCo1 axis (ρ = 0.67, p = 0.006).
Conclusion
Owners reported either improvement or no change in health in dogs transitioning from extruded kibble to MC diets for 4 weeks, but this report of health perception requires further exploration in a controlled trial. Diet change also led to a significant shift in the GM profile of healthy dogs. The magnitude of shift was associated with baseline GM and dietary protein, and warrants further examination of individualized responses and personalized nutrition in companion dogs. These results also support future investigation of the impact of a MC diet on health maintenance given its increasing popularity.
Introduction
For several millennia humans and dogs coevolved, sharing food and shelter (Axelsson et al., 2013). However, extruded dry food, commonly known as kibble, remains the most common form of feeding pet dogs in the United States. Extrusion cooking refers to a process where a mixture of ingredients is steam conditioned, compressed, and forced through the die of an extruder (Tran, Hendriks & Van der Poel, 2008). Mildly cooked (MC) diets, composed of ingredients that are cooked without extrusion, have been gaining in popularity in recent years among dog owners in the U.S. (PRWeb, 2015; Algya et al., 2018). Commercial MC canine diets are increasingly available, and must conform with the American Association Feed Control Officials (AAFCO) nutrient profiles or have been tested in feeding trials for the labeled life stages when complete and balanced. The nutritional profile of a MC diet may or may not differ significantly from dried and extruded pet food. Compared to dried and extruded food, MC diets have higher moisture content, higher digestibility of fats and protein, and dogs fed a MC diet for 28 days had lower levels of triglycerides (Algya et al., 2018; Oba et al., 2020; Do et al., 2021). Additionally, positive health perception was reported by dog owners after feeding their dogs a veterinarian-formulated MC diet (Johnson et al., 2016). However, the nutritional contents of MC diets and their effect on overall canine health remain understudied compared to other types of commercial dog foods.
Dietary changes are generally accompanied by alterations of the gut microbiota (GM) (Wernimont et al., 2020), which can have profound impact on canine health and disease (Redfern, Suchodolski & Jergens, 2017; Pilla & Suchodolski, 2019). Many studies have shown microbiome compositional changes upon switching to raw food diets, which are often higher in protein and fat and lower in carbohydrates (including fiber) than kibble diets (reviewed in (Wernimont et al., 2020)). These studies have shown that raw food diets lead to increased levels of certain Fusobacteria and Proteobacteria (Sandri et al., 2017; Algya et al., 2018; Schmidt et al., 2018). Similarly, MC diets have been associated with higher levels of certain Bacteroidetes, Fusobacteria and Proteobacteria, and lower levels of certain Actinobacteria and Firmicutes as compared to an extruded kibble diet (Algya et al., 2018; Do et al., 2021). However, these studies were conducted in only a small group of dogs under a laboratory setting. Thus, the extent that a MC diet influences the gut microbiomes of real world pet dogs with heterogeneous characteristics such as age, breeds, living conditions, and body size remains unexplored.
An investigation of the effect of dietary transition to a MC diet on GM and owner-reported subjective health metrics in healthy dogs was carried out to improve understanding of the effects of this increasingly popular diet type. Dogs switched from an extruded kibble to a MC diet for four weeks were assessed for changes relative to baseline in: (1) the gut microbiome by profiling the taxonomic and functional compositions of feces; and (2) perceived health outcomes using an owner-reported survey. Due to the variety of differences between diets, we hypothesized we would observe a shift in the diversity and abundance of GM upon diet change. Enrolled dogs were healthy at recruitment, however we aimed to determine if any additional positive impacts were reported by owners, including outcomes likely to change based on the literature for similar diets (e.g fecal output).
Materials and Methods
Dog owners gave electronic informed consent to the use of their dog’s non-identifying data for scientific study prior to study enrollment. All dog owners willingly underwent diet transition regardless of study participation. As previously explained (Tanprasertsuk et al., 2021), since fecal samples were collected non-invasively by the dog owners, no institutional animal ethical review was required.
Animals and study design
A total of 4,978 dog owners were contacted via email to gauge interest in study participation (Fig. 1). All owners were incoming customers of NomNomNow, Inc. (a direct-to-consumer pet food and health company in Nashville, TN, USA), who intended to switch their dog’s diet to a MC diet regardless of study participation. A total of 850 dogs of various breeds were screened using an online questionnaire; 54 dogs met the inclusion criteria described below and were enrolled in the study.
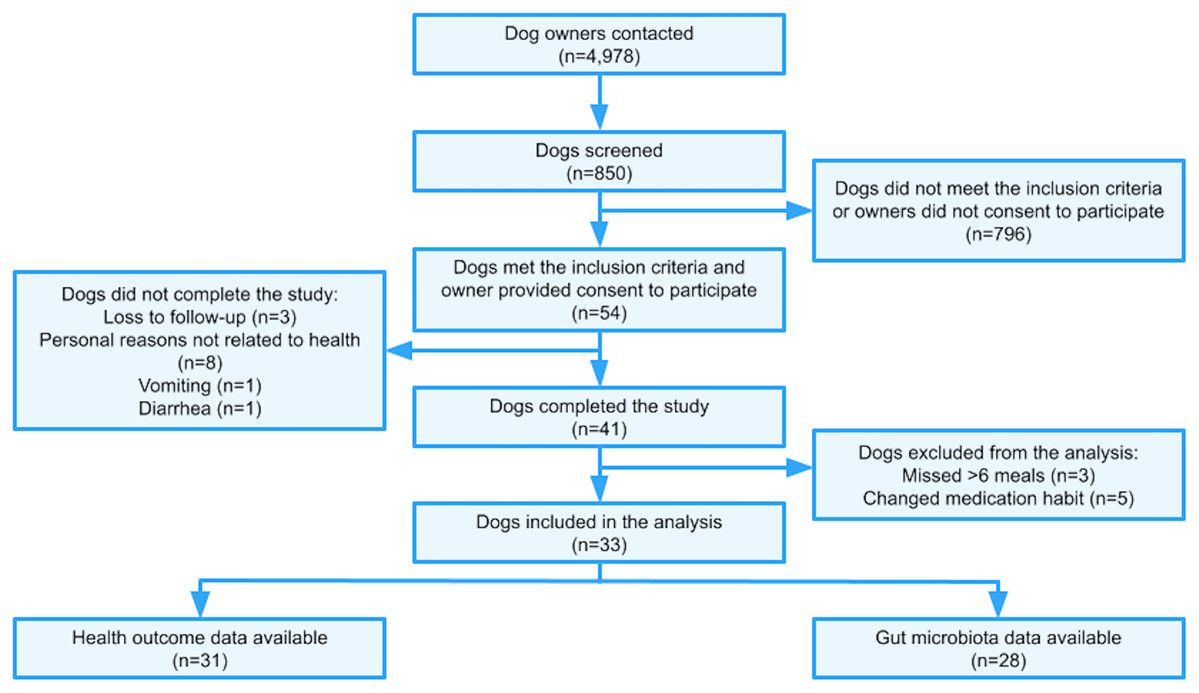
Figure 1: Trial flowchart.
Dogs were eligible to participate in the study if they met the following owner-assessed criteria at enrollment: aged 1–14 years, body condition score (BCS) of 4–6 on the 9-point scale (Laflamme, 1997), currently feeding two meals per day exclusively of an extruded kibble diet with treats comprising ≤10% of overall caloric intake, absent of gastrointestinal (GI) issues (including chronic diarrhea/vomiting or diarrhea/vomiting within the previous 30 days), absent of any infections or major chronic diseases (pancreatitis, diabetes, kidney disease or failure, liver disease, heart disease, cancer, severe GI issues when young (<6 months old), and not pregnant or lactating). Only one dog per household was permitted to enroll. Dogs were not eligible to participate if they had consumed any prebiotics, probiotics, cultured foods, or antibiotics within the last three months, had a significant change in their diet within the last month, or had surgery within the previous three months. The criteria were similar to those previously described (Tanprasertsuk et al., 2021).
Participants were asked to provide the brand and formula of the baseline extruded kibble diet, and guaranteed analysis of nutrients was assembled when possible. Online health assessments were administered and stool samples were collected by owners one day before the diet transition (day 0) and again four weeks after the diet transition (day 28). On day 1, dogs began the transition from their previous extruded diet to a MC diet. An email reminder was sent out to all dog owners weekly to ensure adherence to the study diet and maintenance of baseline habits (supplements, medication, and exercise), as well as provide owners with the opportunity to report any observed adverse effects.
Dietary interventions
Dog owners chose one to four commercially-available Nom Nom recipes as their study MC diet (Beef, Chicken, Pork, Turkey). Mildly cooking includes cooking techniques designed to reach internal temperatures for reduction of pathogens but without canning or extrusion, and the term is used to describe similar diets in a previous study (Algya et al., 2018). However, unlike the MC diet in the referenced paper, the protein sources were not ground and emulsified, but mixed into a homogenous blend with vitamin and mineral supplements. After cooking, the diets were then refrigerated or frozen and thawed prior to feeding. Dietary information for participants who completed the study is summarized in Fig. S1. The ingredients and guaranteed nutrient analysis of each recipe are available in Table 1. All recipes were formulated to meet AAFCO standards for all life stages. All dog owners were instructed to feed two MC meals daily from day 1 to the completion of the study on day 28. The meal portion for each dog was calculated using a proprietary custom-portioning algorithm which takes owner-reported ideal body weight and physical activity level into account. The amount of food not consumed was also reported at the end of the study to account for dietary adherence.
| Recipe | Guaranteed analysis | ||||
|---|---|---|---|---|---|
| Calories, kcal/kg FW | Crude protein, min %AF | Crude fat, min %AF | Crude fiber, max %AF | Moisture, max %AF | |
| Beef | 1,239 | 10 | 5 | 1 | 73 |
| Chicken | 1,255 | 8.5 | 6 | 1 | 77 |
| Pork | 1,246 | 8 | 5 | 2 | 75 |
| Turkey | 1,479 | 11 | 5 | 1 | 70 |
| Recipe | Ingredients | ||||
| Beef | Ground beef, russet potatoes, eggs, carrots, peas, dicalcium phosphate, calcium carbonate, salt, fish oil, sunflower oil, vinegar, citric acid (preservative), taurine, choline bitartrate, zinc gluconate, ferrous sulfate, vitamin E supplement, copper gluconate, manganese gluconate, thiamine mononitrate (vitamin B1), selenium yeast, riboflavin (vitamin B2), vitamin B12 supplement, cholecalciferol (source of vitamin D3), potassium iodide | ||||
| Chicken | Diced chicken, sweet potatoes, yellow squash, spinach, sunflower oil, canola oil, dicalcium phosphate, calcium carbonate, fish oil, vinegar, citric acid, taurine, choline bitartrate, zinc gluconate, ferrous sulfate, vitamin E supplement, copper gluconate, manganese gluconate, thiamine mononitrate (vitamin B1), selenium yeast, riboflavin (vitamin B2), vitamin B12 supplement, cholecalciferol (source of vitamin D3), potassium iodide | ||||
| Pork | Ground pork, russet potatoes, green beans, yellow squash, kale, brown mushrooms, dicalcium phosphate, salt, fish oil, vinegar, citric acid, taurine, choline bitartrate, zinc gluconate, ferrous sulfate, vitamin E supplement, copper gluconate, manganese gluconate, thiamine mononitrate (vitamin B1), selenium yeast, riboflavin (vitamin B2), vitamin B12 supplement, cholecalciferol (source of vitamin D3), potassium iodide | ||||
| Turkey | Ground turkey, brown rice, eggs, carrots, spinach, dicalcium phosphate, calcium carbonate, salt, fish oil, vinegar, citric acid, taurine, choline bitartrate, zinc gluconate, ferrous sulfate, vitamin E supplement, copper gluconate, manganese gluconate, thiamine mononitrate (vitamin B1), selenium yeast, riboflavin (vitamin B2), vitamin B12 supplement, cholecalciferol (source of vitamin D3), potassium iodide | ||||
Note:
FW: fresh weight, AF: as fed.
Health assessment
An online health assessment was completed by each owner prior to diet transition (day 0). The assessment was composed of five broadly targeted questionnaires containing questions about signalment, overall wellness, diet and lifestyle, medical history, oral health, and behavior, and was previously used in a research study (Jha et al., 2020). Questions included single-choice checkbox, multiple-choice radio-button, dropdown, and fill-in-the-blank questions. A second set of online assessment questions was administered to assess change in health outcomes from baseline as perceived by the owner on day 28. The questions are written verbatim in Table S1. A visual stool chart was used to assess the fecal quality (Lewis & Heaton, 1997), and a previously validated 9-point system was used to assess the BCS (Laflamme, 1997).
Stool sample collection and DNA extraction
Stool samples from each dog were collected by owners with Nom Nom Plus Microbiome Testing Kits (NomNomNow, Inc., Nashville, TN, USA) at baseline (day 0) and four weeks after the diet transition (day 28). The kits were previously used in research studies (Jha et al., 2020; Tanprasertsuk et al., 2021). All stool samples were processed and sequenced in a single batch at Diversigen, Inc. (New Brighton, MN, USA). DNA extraction and library construction protocols were performed as previously described (Johnson et al., 2019; Tanprasertsuk et al., 2021), with the exception that DNA was extracted using the Zymogen Quick-DNA Fecal/Soil Microbe 96 Mag Bead kit (Zymo Research, Irvine, CA, USA) using Powerbead Pro (Qiagen, Redwood City, CA, USA) plates with 0.5 and 0.1 mm ceramic beads. Extraction controls included a no template control (water) and a characterized homogenized stool. All samples were quantified with Quant-iT Picogreen dsDNA Assay (Invitrogen, Carlsbad, CA, USA). Subsequently, DNA amplification and library construction were performed with the Nextera XT DNA Library Preparation Kit (Illumina Inc, Foster City, CA, USA).
GM shotgun metagenomic sequencing and annotation
Whole genome shotgun sequence reads used for this study are available on the NCBI Short Read Archive associated with the NCBI BioProject PRJNA714112. Shotgun metagenomic sequencing was performed at Diversigen, Inc. (New Brighton, MN, USA) using their Boostershot shallow metagenomic sequencing service (2 million reads/sample), as previously described (Johnson et al., 2019). For quality control, single-end shotgun reads were trimmed and processed using Shi7 (Al-Ghalith et al., 2018). The sequences were then aligned to the NCBI RefSeq representative prokaryotic genome collection at 97% identity using BURST with default settings (Al-Ghalith & Knights, 2017). A filtering step was performed to remove taxa present in <5% of the samples and those belonging to unknown phyla. The resulting taxonomy table was also aggregated at higher taxonomy levels (for example, species, genus, family). After filtering, a total of 959 taxa were used for the analysis (Fig. S2). The average sequencing depth was 2,481,073 ± 909,748, and the depth per sample ranged from 476,329 to 4,819,202 reads. It has been shown that this particular method of low-depth metagenomic sequencing can reach species-level taxonomic assignment and allows for the assessment of functional profiles (Hillmann et al., 2018).
Functional annotation
Sequenced reads were matched directly using alignment at 97% identity to the Kyoto Encyclopedia of Genes and Genomes Orthology groups (KEGG KOs) derived from the NCBI RefSeq representative prokaryotic genome collection. A filtering step was performed to remove KO terms present in <5% of the samples and those whose absolute count was ≤1. After 401 KO terms were removed, 4,216 terms were used in subsequent analyses.
Statistical analysis
Continuous variables are expressed as mean ± SD, unless specified as mean ± SEM. GM relative abundances are expressed as median (IQR). Categorical variables are presented as count (%). All analyses were performed using R Studio version 1.2.5033. Statistical significance level was set at α = 0.05.
Analysis of health outcomes
Wilcoxon signed rank test (continuous variables) and a Fisher’s exact test (categorical variables) were performed to compare the observed values with the expected values under the null hypothesis (equal ratios of subjects in each category for categorical variables, and change equal to zero for continuous variables). Following the Fisher exact test, the Benjamini Hochberg method was performed to control the false discovery rate (FDR) due to multiple comparisons among categories of responses.
Analysis of GM diversity, abundance, function
Similar to the approach previously described (Jha et al., 2020), species richness and Shannon’s diversity indices were computed by rarefying the samples to various depths starting from 10,000–470,000 sequences per sample by increasing the sequencing depth by 10,000 reads. One hundred iterations were performed at each depth and mean values were used as the estimate of these measures in each sample. Wilcoxon signed rank test was used to compare changes of alpha diversity metrics (evenness, diversity indices) from baseline to week 4.
The non-rarefied count data were log-transformed and principal coordinate analysis (PCoA) was performed using Bray–Curtis dissimilarity calculated with the vegan package at the species level (Oksanen et al., 2014; Tanprasertsuk et al., 2021). Using the vegan package, permutational multivariate analysis of variance (PERMANOVA) was performed using Bray–Curtis dissimilarity with 10,000 randomizations by including timepoints to assess the differences in community composition (Oksanen et al., 2014). Partitioning around the medoids (PAM) Clustering was also performed to investigate the dissimilarity of bacterial profiles in samples collected at two different time points using the cluster package (Maechler et al., 2015). Fisher’s exact test was performed to investigate the association between cluster membership and timepoint. Kruskal–Wallis test with Dunn’s post hoc test, Wilcoxon signed rank test, and McNemar’s Chi-squared test were performed to compare various measures among different groups as specified throughout the manuscript.
Differential abundances of bacterial taxa between timepoints were assessed at each taxonomic level using a negative binomial generalized linear model (GLM), using the differential expression analysis for sequence count data version 2 package (DESeq2) (Love, Huber & Anders, 2014; Jha et al., 2020). Taxa with absolute log2(fold change (FC)) > 2 and FDR-adjusted p-values < 0.05 were considered significant.
To investigate the dissimilarity of bacterial profiles among subjects at baseline, we utilized the same statistical methods described above (PCoA using Bray–Curtis dissimilarity, PAM Clustering, negative binomial GLM with DESeq2). Additionally, random forest classifiers were constructed using repeated k-fold cross-validation and random search implemented in the R-package caret (Khun, 2014). As previously described (Jha et al., 2020), the data were randomly divided into training and validation sets containing 70% and 30% of the samples, respectively, and bacterial species were used as the predictors. The models were trained by optimizing the tuning parameters using 10-fold cross-validation repeated three times, and accuracy was used to select the optimal model. The performance of the classifiers was assessed by generating area under the receiver operating characteristic curves using the R-package ROCR (Sing et al., 2005).
Similarly, the non-rarefied count data of KO terms were log-transformed and PCoA was performed using the Bray–Curtis dissimilarity as described above. A negative binomial GLM using the DESeq2 was performed to identify differentially abundant KO terms between the two time points. The identified KO terms were used for KEGG pathway mapping against the PATHWAY database (Kanehisa & Sato, 2020).
Correlation analysis
Correlation analysis was performed to investigate the relationship between: (1) the PCo1 score and the abundance of Enterobacterales and Lactobacillales at baseline; and (2) the PCo1 score and the macronutrient composition in the baseline extruded diet. Spearman’s correlation coefficients are reported.
Results
Cohort description
Of 54 dogs initially enrolled, 13 did not complete the study due to the following reasons: vomiting (n = 1), diarrhea (n = 1), loss to follow-up (n = 3), and owners’ personal reasons not related to dog health (n = 8) (Fig. 1). No major adverse effect was reported. Eight cases (14.8%) of diarrhea and nine cases (16.7%) of vomiting were reported in those who enrolled, regardless of study completion. The rates of diarrhea and vomiting were 1 case per 27 dog-weeks and 1 case per 24 dog-weeks, respectively.
The remaining 41 participants completed the study by either filling out the online health assessment, collecting a stool sample, or both. Among those who completed the study, three dogs missed >6 meals of the study diet and five dogs changed their medication habit. These included four cases of antibiotic use (two cases of urinary tract infection, one case of diarrhea, one case of common cold) and one case of Prednisone use (to treat a physical injury not related to the study). After the exclusion of these eight dogs, data for 33 dogs were available for subsequent analyses (n = 5 only completed the online health assessment, n = 2 only provided fecal samples, n = 26 provided both). In other words, of the 33 dogs that completed the study, we included 31 dogs for health data analysis and 28 for the microbiome data analysis.
Subject characteristics
Characteristics of the 31 dogs with health assessment data and the 28 dogs with fecal samples are described in Table 2. The wide distribution of body weights reflect the diversity of breeds. Age, sex, weight, and breed information for each individual dog is available in Table S2. The baseline extruded kibble diets were diverse in terms of ingredients and nutrient profiles (data not shown). Reported fecal consistency scores were on average between 3 (sausage-shaped with cracks on surface) and 4 (sausage-shaped or snake like, smooth and soft).
| Feature | Health assessment data (n = 31) | Fecal samples (n = 28) |
|---|---|---|
| Age, in years | 4.8 ± 3.6 | 5.2 ± 3.7 |
| Male | 16 (52%) | 14 (50%) |
| Spayed or neutered1 | 24 (83%) | 24 (86%) |
| Body weight, in kg | 10.2 ± 8.4 | 10.7 ± 8.7 |
| Ideal body weight, in kg | 10.0 ± 8.2 | 10.5 ± 8.5 |
| Body condition score1 | ||
| 4–5 | 20 (77%) | 20 (74%) |
| 6 | 6 (23%) | 7 (26%) |
| Physical activity level1 | ||
| Very active | 2 (7%) | 2 (7%) |
| Active | 8 (30%) | 8 (30%) |
| Average active | 8 (30%) | 6 (22%) |
| Somewhat active | 8 (30%) | 10 (37%) |
| Not active | 1 (4%) | 1 (4%) |
| Overall health1 | ||
| Excellent | 17 (63%) | 17 (63%) |
| Good | 9 (33%) | 8 (30%) |
| Fair | 1 (4%) | 2 (7%) |
| Poor | 0 (0%) | 0 (0%) |
| Bad | 0 (0%) | 0 (0%) |
| Food motivation1 | ||
| Very motivated | 12 (44%) | 11 (41%) |
| Somewhat motivated | 11 (41%) | 12 (44%) |
| Average motivated | 1 (4%) | 1 (4%) |
| Mildly motivated | 1 (4%) | 1 (4%) |
| Not at all motivated | 2 (7%) | 2 (7%) |
| Fecal consistency score1 | 3.1 ± 1.3 | 3.0 ± 1.2 |
| Defecation frequency1 | ||
| ≥ 3 times/day | 7 (26%) | 8 (30%) |
| 2 times/day | 18 (67%) | 17 (63%) |
| 1 time/day | 2 (7%) | 2 (7%) |
| Flatulence frequency1 | ||
| Multiple times per day | 1 (4%) | 1 (4%) |
| Daily | 5 (19%) | 5 (19%) |
| Once in a while | 11 (41%) | 11 (41%) |
| Never | 10 (37%) | 10 (37%) |
Notes:
Data are expressed as mean ± SD or n (%).
Health outcomes
Dog owners’ perceptions of changes in health outcomes 28 days after the diet transition are listed in Table 3. Of 31 dog owners, 19 (61%) reported better overall health, 15 (48%) reported higher physical activity, 15 (48%) reported improved coat condition, and 19 (61%) reported higher appetite. Post-hoc pairwise comparisons showed the proportion of owners that reported no change in these outcomes was not significantly different from those that reported an improvement. None of the dog owners reported worsened overall health, coat condition, or lower physical activity level after transitioning from extruded kibble to MC diet. Furthermore, 18 (58%) reported lower defecation frequency. Fecal score showed a small decrease from 3.0 ± 1.3 to 2.5 ± 0.9 after diet transition but it was not statistically significant (p = 0.091). Body weight on average was maintained throughout the study period.
| Outcome | n (%) or mean ± SD | P−value1 |
|---|---|---|
| Overall health | <0.001 | |
| Better | 19 (61%)a | |
| About the same | 12 (39%)a | |
| Worse | 0 (0%)b | |
| Physical activity | 0.001 | |
| More active | 15 (48%)a | |
| About the same | 16 (52%)a | |
| Less active | 0 (0%)b | |
| Fecal consistency score | ||
| Post-intervention | 2.5 ± 0.9 | |
| Change from baseline2 | −0.6 ± 1.6 | 0.091 |
| Defecation frequency | 0.020 | |
| Higher | 2 (6%)a | |
| No effect | 11 (35%)a,b | |
| Lower | 18 (58%)b | |
| Flatulence frequency | 0.016 | |
| Higher | 2 (6%)a | |
| No effect | 19 (61%)b | |
| Lower | 10 (32%)a,b | |
| Coat condition | 0.001 | |
| Better | 15 (48%)a | |
| No effect | 16 (52%)a | |
| Worse | 0 (0%)b | |
| Appetite | 0.005 | |
| Increased | 19 (61%)a | |
| No effect | 11 (35%)a | |
| Decreased | 1 (3%)b | |
| Body weight change, in % | 0.8 ± 9.0 | 0.536 |
Notes:
Gut microbiome
Diversity
To investigate the effect of diet transition on GM α-diversity, we calculated two standard α-diversity measures, species richness and Shannon’s diversity index. A rarefaction curve generated for sequencing depth 10,000–470,000 reads demonstrated sufficient sequencing depth to assess the alpha diversity (Figs. S3A and S3B). Using sequencing depth at 470,000 reads, these α-diversity measures were not significantly different between baseline and four weeks after diet change (p > 0.05, Wilcoxon signed rank test).
PCoA was performed to investigate changes in β-diversity. The first two axes (PCo1 and PCo2), which respectively explained 34.2% and 10.3% of variation at the species level (Fig. 2A.) Eigenvalues for the first 25 PCo axes are displayed in Fig. S4. Spatial separation between the two timepoints along the first two PCo axes was demonstrated (p = 0.004, PERMANOVA Bray–Curtis dissimilarity matrices). A shift in PCo1 score, but not PCo2-5 scores, was also observed after 4 weeks of diet change (p = 1.72E−04, Wilcoxon signed rank test, Fig. 2B).
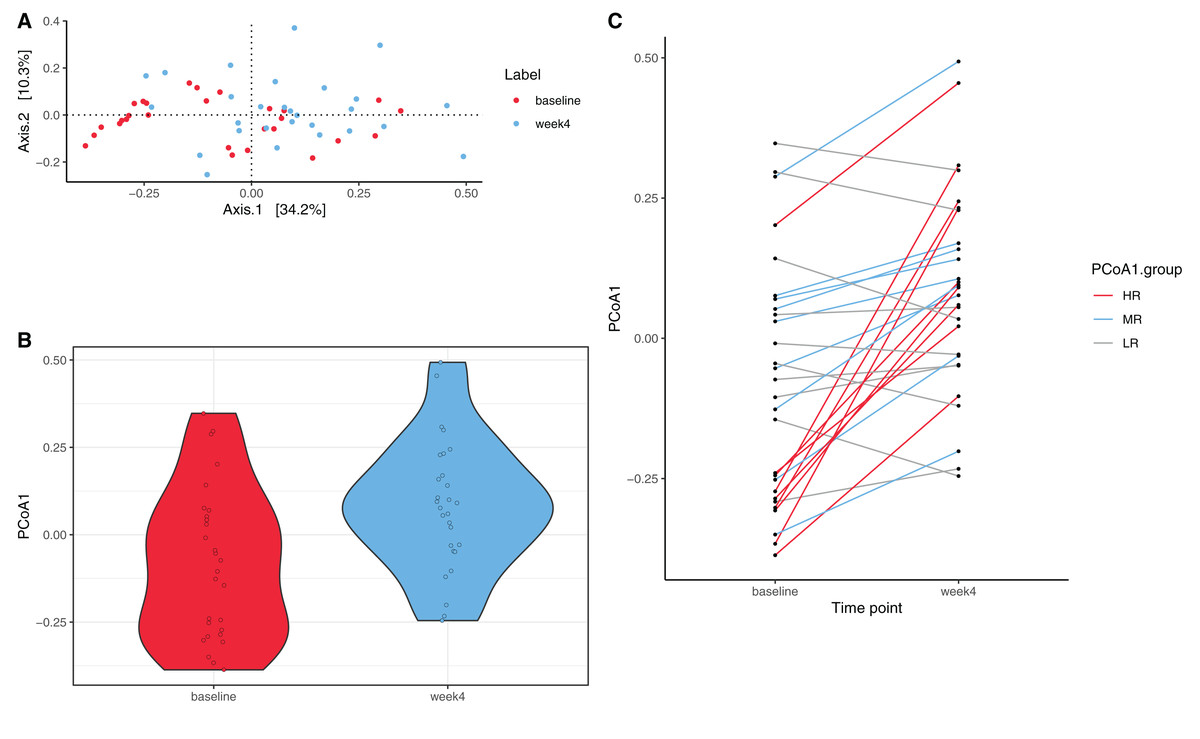
Figure 2: Species level principal coordinate analysis (PCoA).
(A) PCo1 (Axis 1) and PCo2 (Axis 2) respectively explain 34.2% and 10.3% of species abundance variance (56 samples from 28 dogs). PERMANOVA using Bray–Curtis distance shows significant spatial separation between baseline (red) and week 4 (blue) (p = 0.004). (B) A significant shift along the PCo1 axis from baseline (red) to week 4 (blue) is observed (p = 1.72E−04, Wilcoxon signed rank test). (C) Varying degrees of shift along the PCo1 axis are observable from baseline to week 4. Subjects were divided into tertiles based on the degree of PCo4 changes between baseline and week 4, with subjects in the first tertile labeled high-responders (HR, maximal PCo1 score increase, red, n = 9), those in the second tertile mid-responders (MR, blue, n = 9), and those in the third tertile low-responders (LR, PCo1 score decrease or minimal PCo1 score increase, gray, n = 10).
Using PAM Clustering analysis to investigate changes in β-diversity, the 56 samples (two samples from each of the 28 dogs) could be partitioned into two clusters (Fig. S5). The first cluster (C1) consisted primarily of baseline samples (15 samples collected at baseline and five samples collected at week 4), while the second cluster (C2) consisted of 13 samples collected at baseline and 23 samples collected at week 4. A significantly higher proportion of subjects had their baseline samples assigned to C1 and their week 4 samples assigned to C2 than the null hypothesis (p = 0.009, McNemar’s Chi-squared test). This result further confirms a significant shift in GM composition occurred due to dietary shift from extruded kibble to MC in these participants, although the presence of 13 baseline samples in C2 also indicates heterogeneous responses to diet change.
Relative abundances
Four phyla, Firmicutes, Proteobacteria, Actinobacteria, and Bacteroidetes, dominated the GM (Fig. 3, 28 subjects are displayed in three separate rows based on the magnitude of MB response as explained in section Identification of high-,mid- and low-responders). No significant changes in relative abundances were observed between the timepoints at phylum or class levels after diet change (adjusted p > 0.05, negative binomial GLM with DESeq2). The relative abundance of the order Micrococcales significantly increased after the diet change (Table S3). At the family level, the relative abundances of four families significantly increased at week 4 (Leuconostocaceae, Hafniaceae, Lactobacillaceae, and Morganellaceae), while four families significantly decreased after 4 weeks of diet change (Prevotellaceae, Sutterellaceae, Atopobiaceae and Microbacteriaceae).
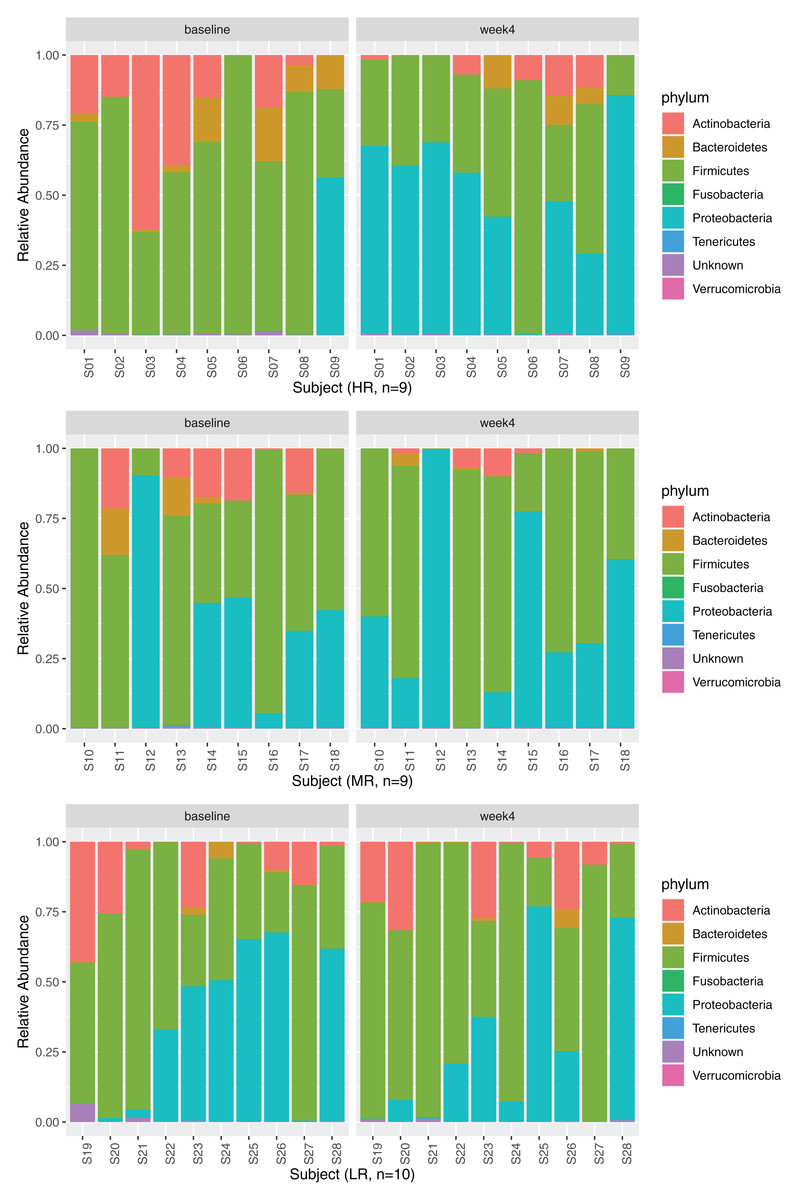
Figure 3: Relative abundances at phylum level at baseline and week 4.
The phyla Firmicutes (baseline: 59.18 (36.39–77.09)%, week 4: 49.59 (31.00–77.05)%), Proteobacteria (baseline: 2.12 (0.06–46.75)%, week 4: 33.67 (11.35–61.92)%), Actinobacteria (baseline: 12.59 (0.34–19.35)%, week 4: 1.67 (0.05–9.23)%), and Bacteroidetes (baseline: 0.39 (0.03–3.79)%, week 4: 0.05 (0.00–0.88)%) dominated the GM at baseline and at week 4. Data are displayed separately for high- (HR, n = 9), mid- (MR, n = 9), and low-responders (LR, n = 10) (see section Identification of high-, mid- and low-responders for the definition of HR, MR and LR).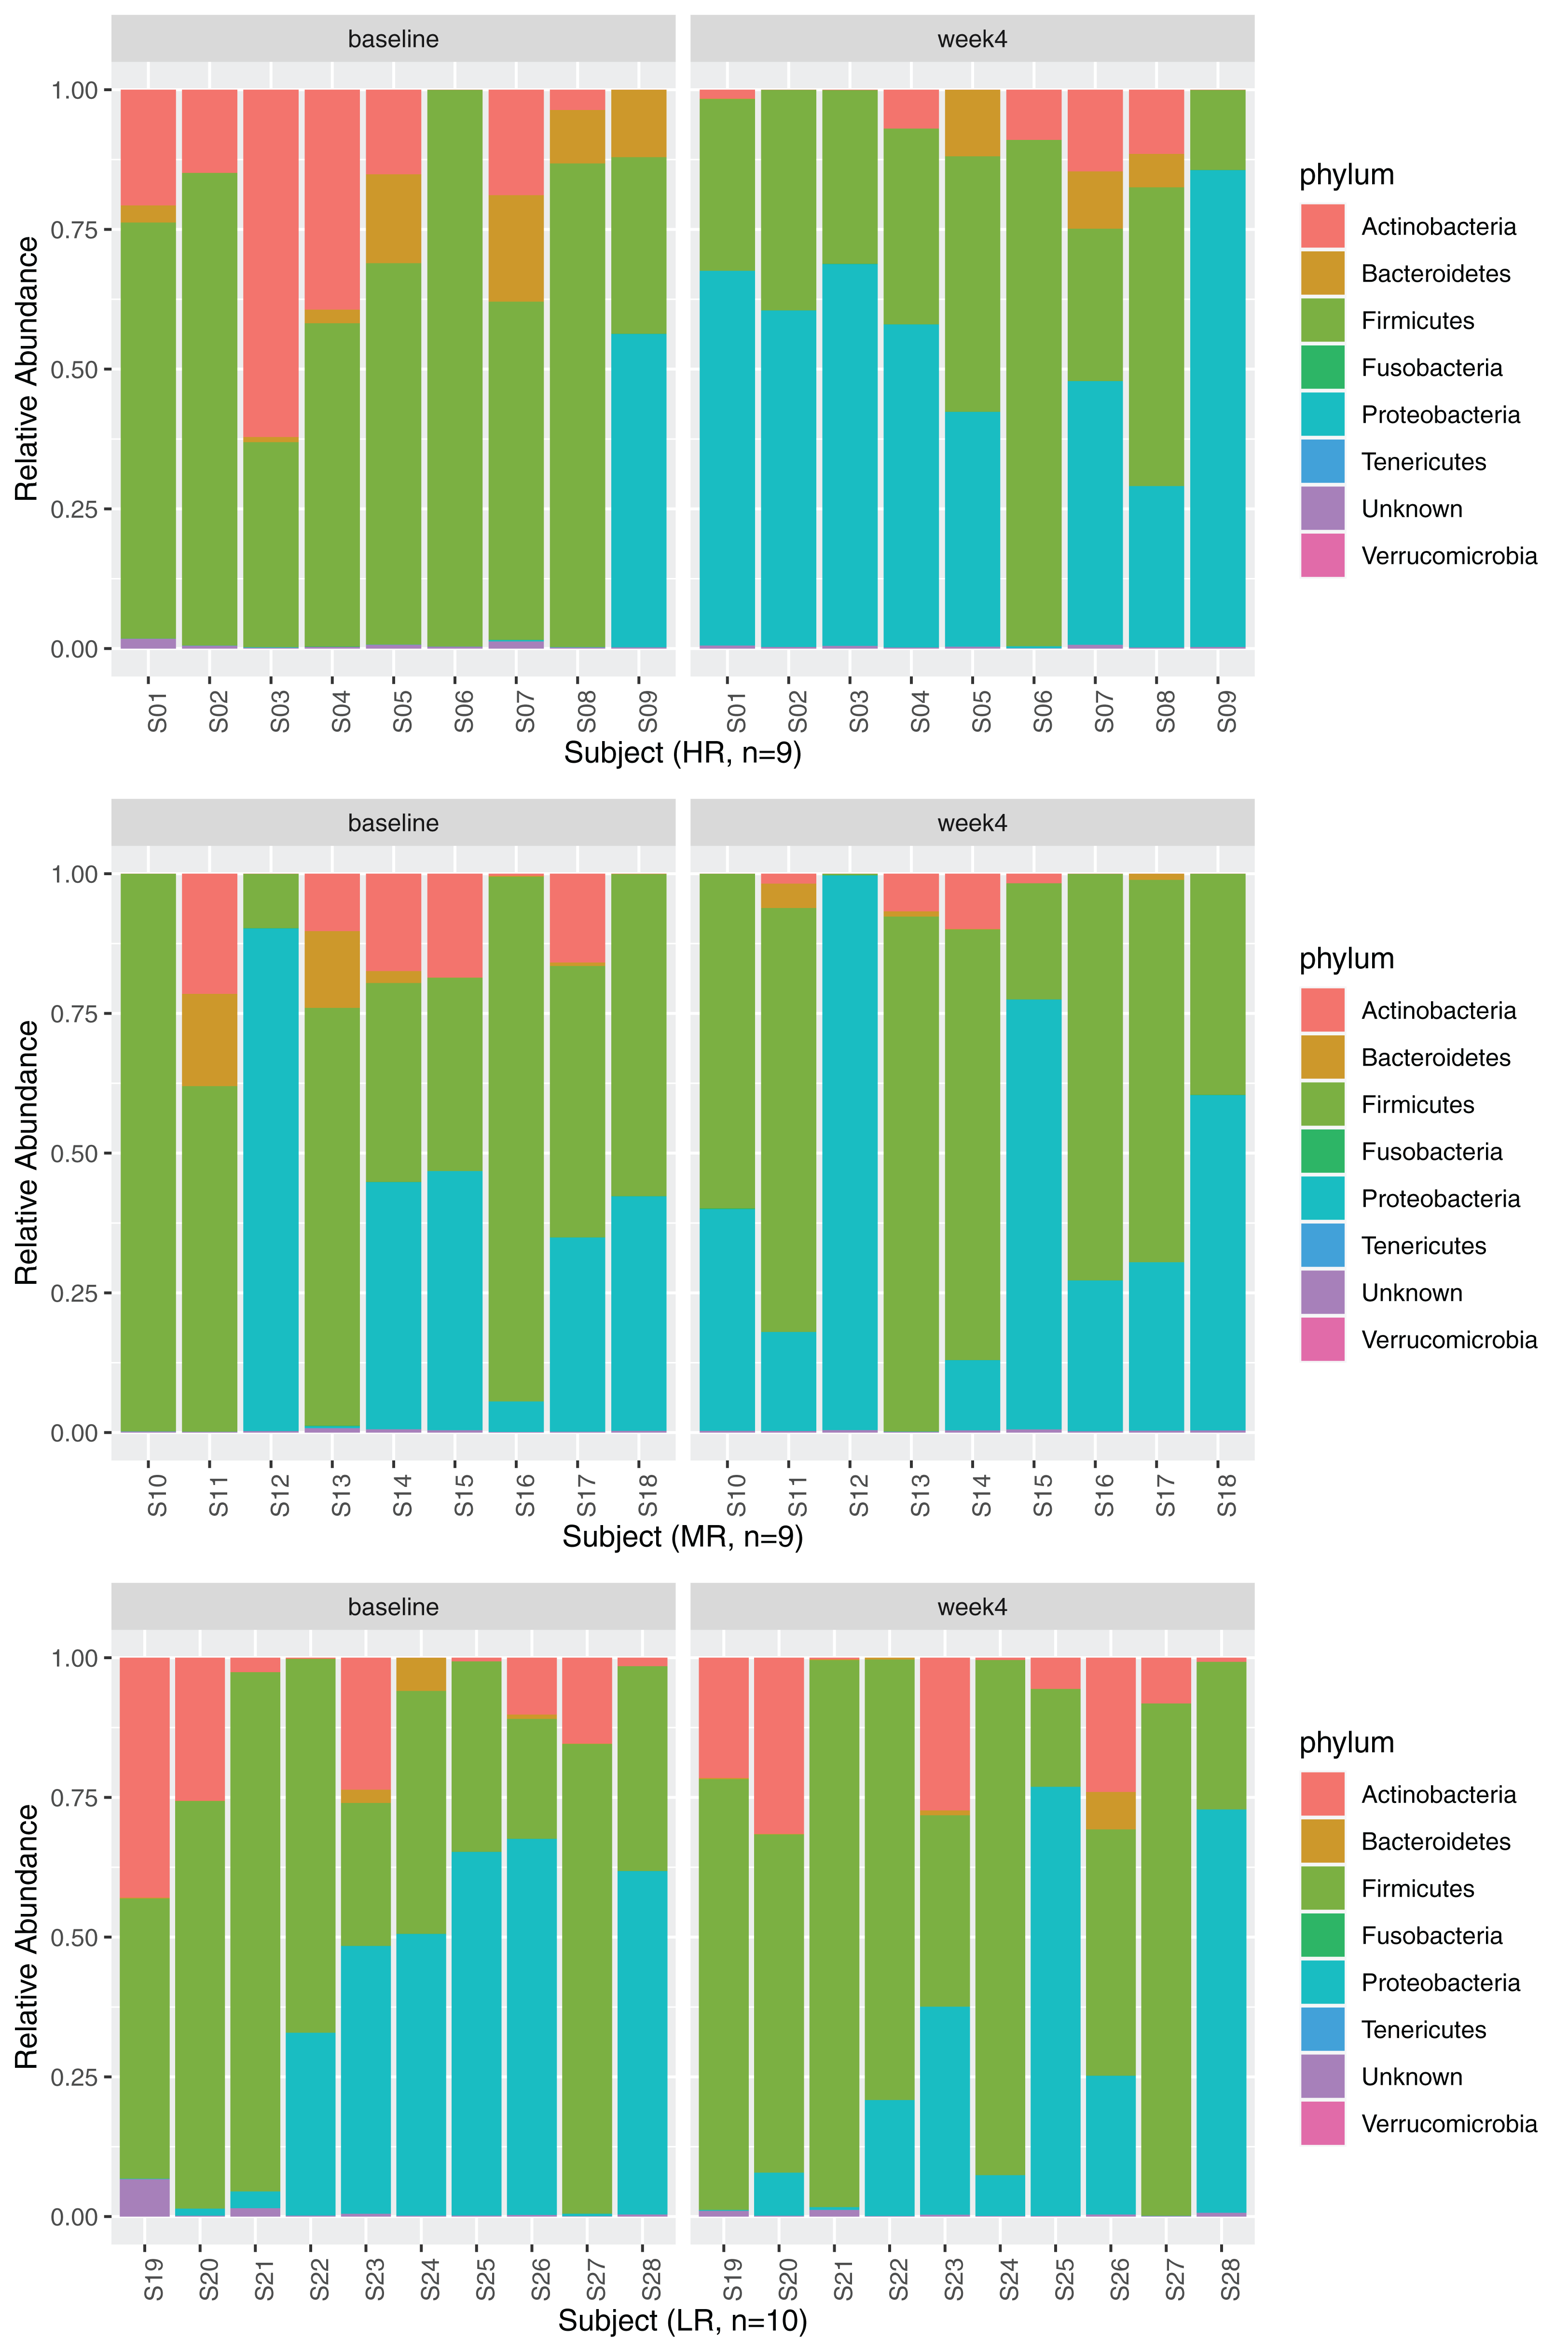
The effect of diet change was more pronounced at the genus and species levels. Relative abundances of 16 genera increased and 12 genera decreased significantly after the diet change (Table S3). Of the genera that increased, nine (56%) belong to the Enterobacterales order (Hafnia, Raoultella, Morganella, Proteus, Edwardsiella, Erwinia, Lelliottia, Yersinia, Leclercia), and seven (44%) belong to the Lactobacillales order (Leuconostoc, Tetragenococcus, Lactobacillus, Weissella, Carnobacterium, Pediococcus, Lactococcus). Half of the 12 decreasing genera were in the Bacillales order (Rummeliibacillus, Brevibacillus, Aneurinibacillus, Thermobacillus, Lysinbacillus, Bacillus). The relative abundances of 70 bacterial species significantly increased after the diet change (Fig. 4, Table 4). Among these species, 47 (67%) belong to the Lactobacillales order (also known as lactic acid bacteria or LAB), and 17 (24%) belong to the Enterobacterales order. Meanwhile, the relative abundances of 28 species significantly decreased, 13 (46%) of which belong to the Clostridiales order, 5 (18%) of which belong to the Bacillales order, and 3 (11%) of which belong to the Bacteroidales order.
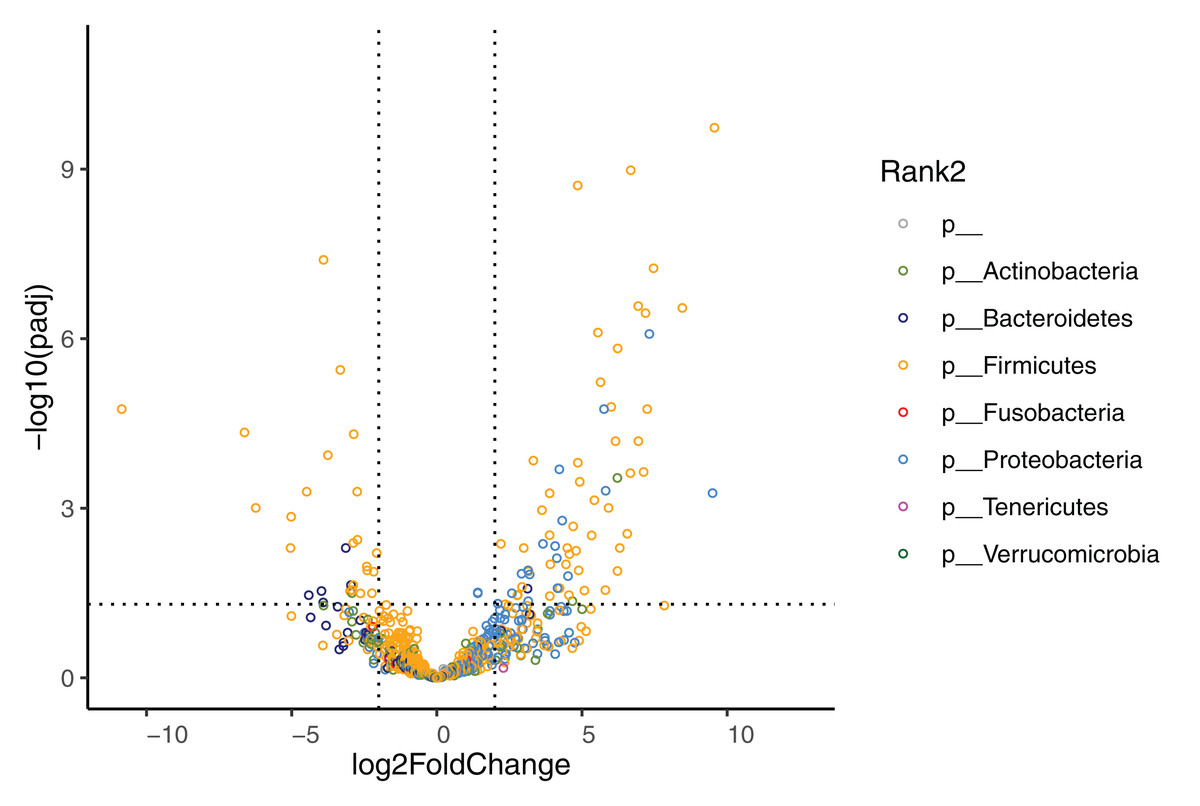
Figure 4: Volcano plot demonstrating fold-change (FC) in species abundance at week 4 compared to baseline.
Vertical dashed lines represent log2FC at 1 and −1 (i.e. FC at 2 and −2), horizontal dashed line adjusted p = 0.05. Adjustments of p values were performed with false discovery rate. Points are colored by phylum.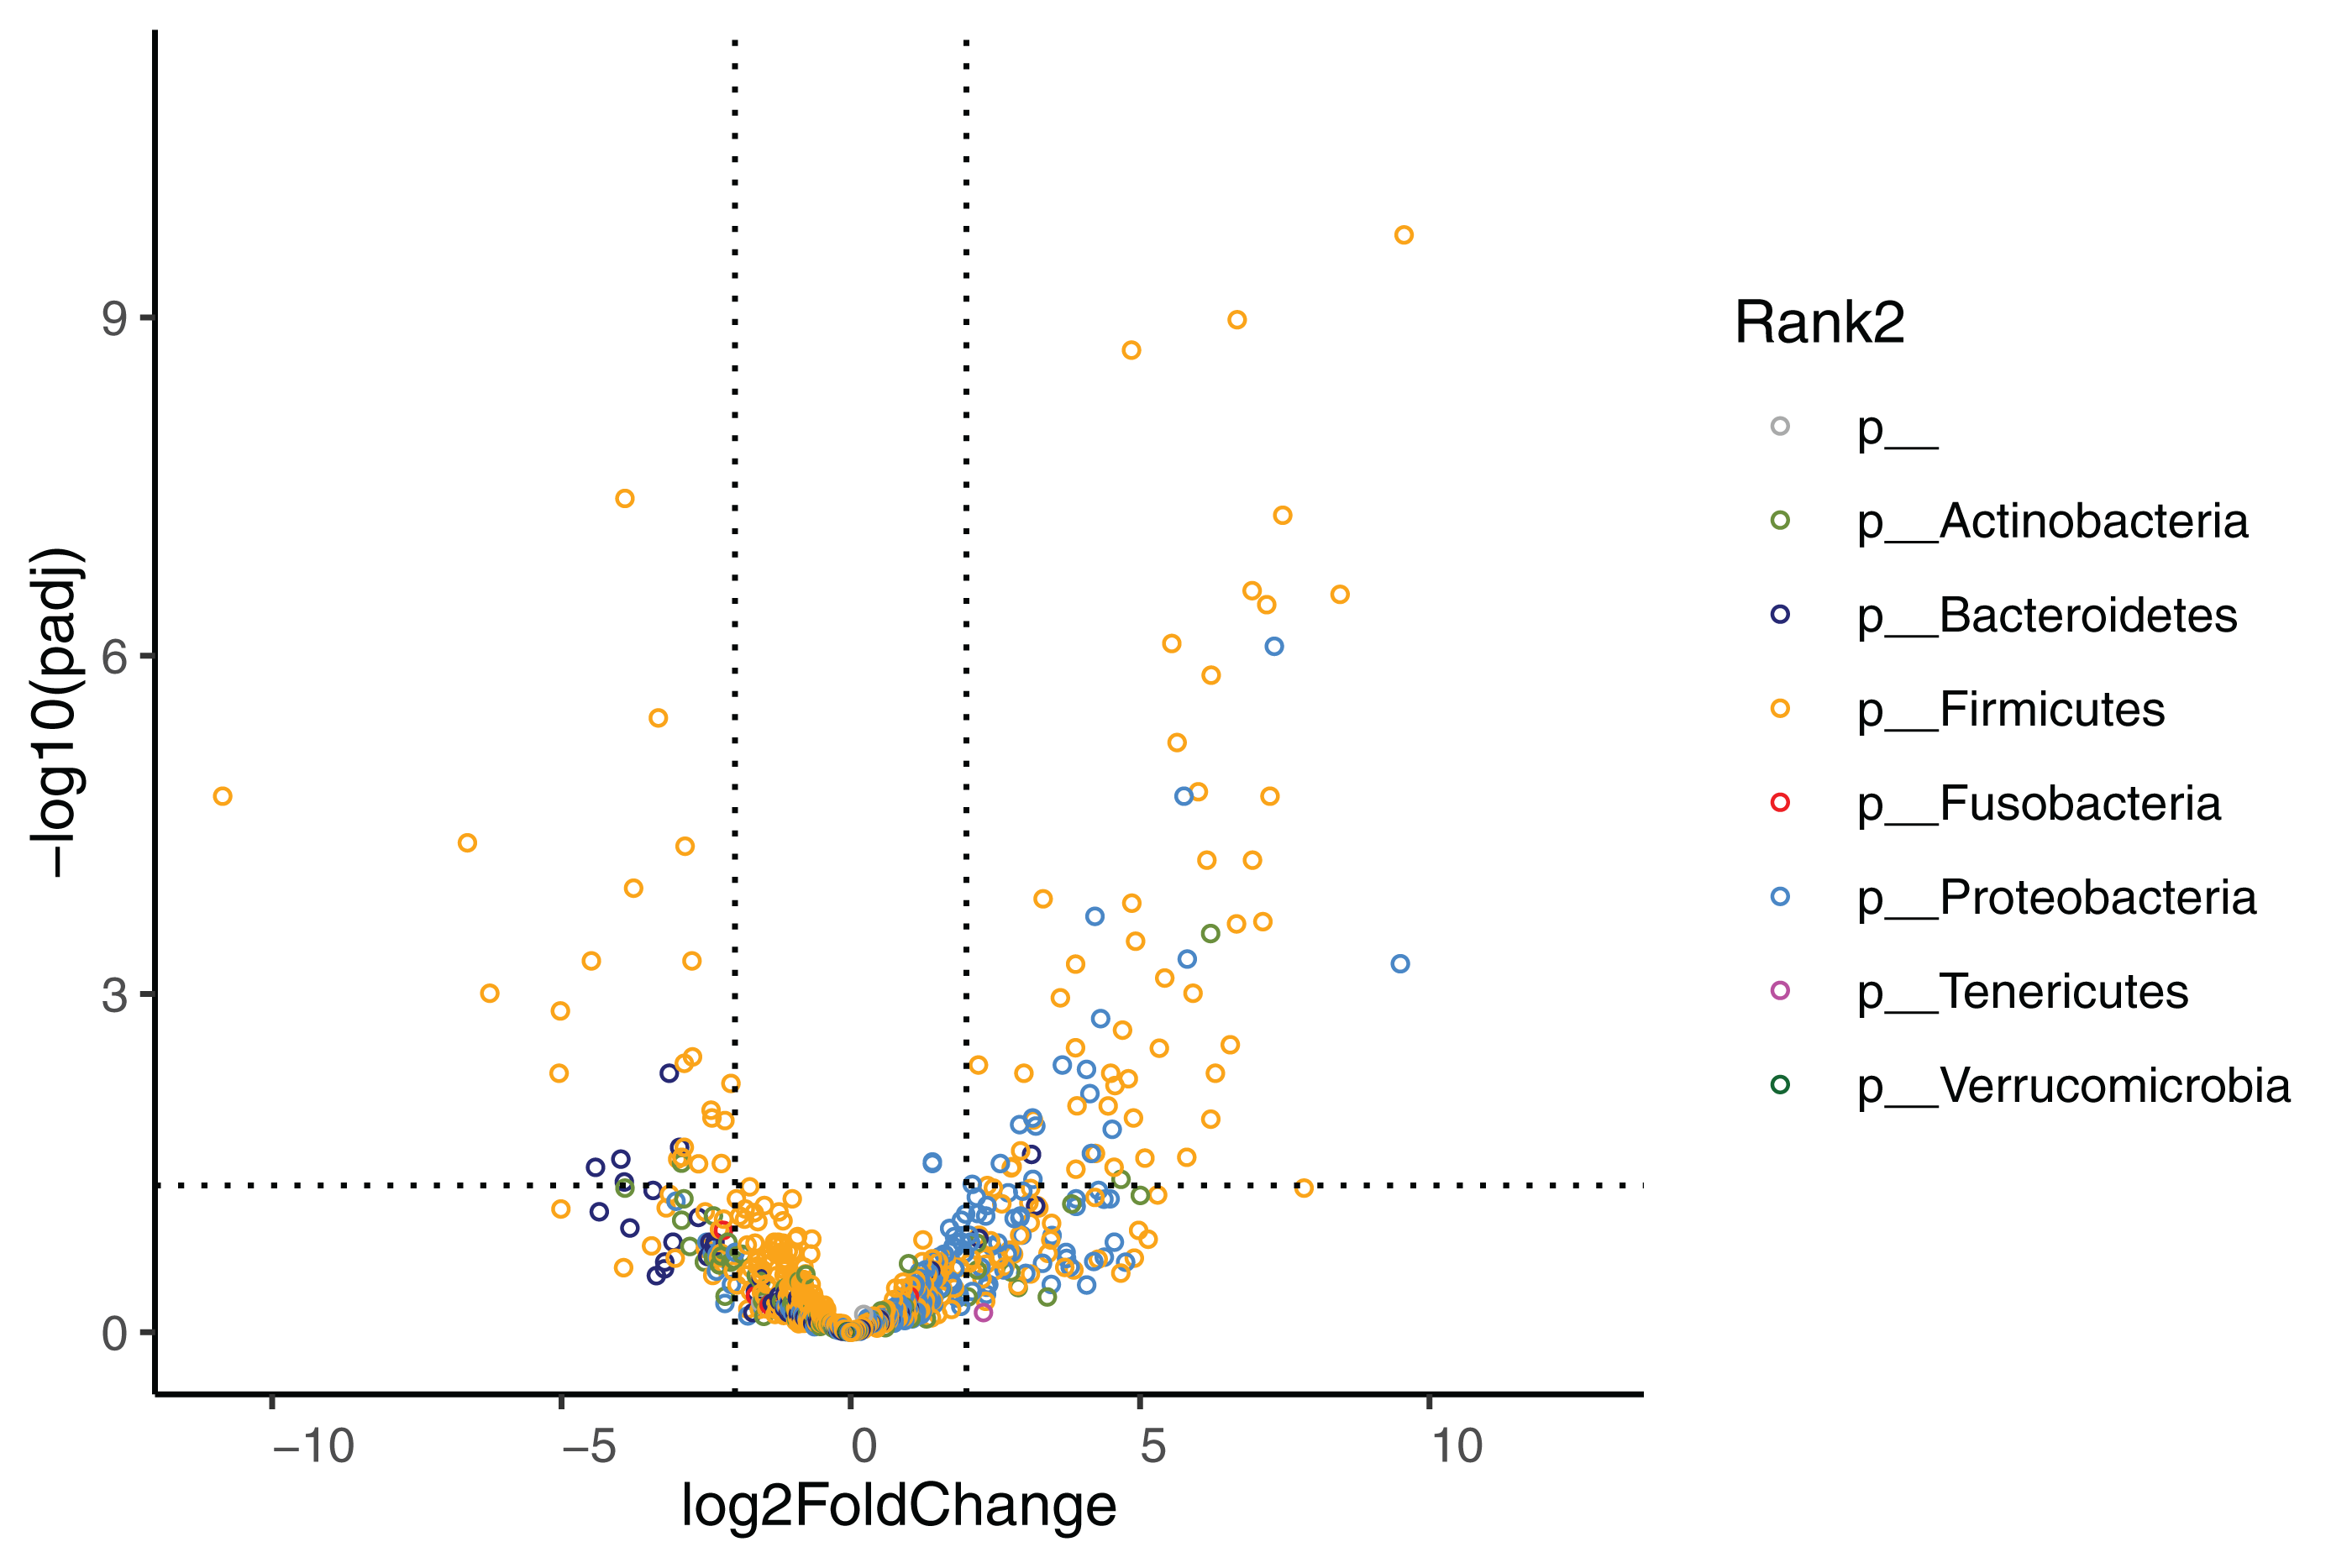
| Phylum | Class | Order | Family | Genus | Species | Relative abundance (%) Median (IQR) |
Week 4 vs Baseline | ||
|---|---|---|---|---|---|---|---|---|---|
| Baseline | Week 4 | Log 2 FC mean ± SE |
Adjusted P−value1 |
||||||
| Increased at week 4 (70 species) | |||||||||
| Firmicutes | Bacilli | Lactobacillales | Lactobacillaceae | Lactobacillus | algidus | 0.00E+00 (0.00E+00 to 1.64E−04) | 3.54E−03 (1.48E−04 to 1.50E−01) | 12.53 ± 1.11 | 1.12E−26 |
| Firmicutes | Bacilli | Lactobacillales | Leuconostocaceae | Leuconostoc | gelidum | 5.01E−05 (0.00E+00 to 2.71E−04) | 8.20E−03 (3.38E−04 to 1.43E+00) | 11.90 ± 1.17 | 9.78E−22 |
| Firmicutes | Bacilli | Lactobacillales | Lactobacillaceae | Lactobacillus | sakei | 2.62E−05 (0.00E+00 to 3.44E−04) | 3.00E−03 (5.95E−05 to 7.40E−02) | 11.61 ± 1.16 | 3.24E−21 |
| Firmicutes | Bacilli | Lactobacillales | Lactobacillaceae | Lactobacillus | fuchuensis | 0.00E+00 (0.00E+00 to 5.26E−05) | 1.12E−04 (0.00E+00 to 4.20E−03) | 9.56 ± 1.34 | 1.85E−10 |
| Proteobacteria | Gammaproteobacteria | Enterobacterales | Morganellaceae | Proteus | no data | 0.00E+00 (0.00E+00 to 0.00E+00) | 0.00E+00 (0.00E+00 to 1.06E−05) | 9.50 ± 2.25 | 5.37E−04 |
| Firmicutes | Bacilli | Lactobacillales | Leuconostocaceae | Leuconostoc | carnosum | 0.00E+00 (0.00E+00 to 1.80E−05) | 3.22E−05 (0.00E+00 to 2.10E−02) | 8.46 ± 1.43 | 2.85E−07 |
| Firmicutes | Bacilli | Lactobacillales | Lactobacillaceae | Lactobacillus | curvatus | 0.00E+00 (0.00E+00 to 2.06E−04) | 8.89E−04 (5.95E−05 to 1.83E−02) | 7.46 ± 1.21 | 5.66E−08 |
| Proteobacteria | Gammaproteobacteria | Enterobacterales | Morganellaceae | Proteus | mirabilis | 0.00E+00 (0.00E+00 to 5.66E−05) | 7.21E−05 (0.00E+00 to 1.79E−03) | 7.32 ± 1.29 | 8.23E−07 |
| Firmicutes | Bacilli | Lactobacillales | Lactobacillaceae | Lactobacillus | siliginis | 0.00E+00 (0.00E+00 to 0.00E+00) | 0.00E+00 (0.00E+00 to 1.18E−03) | 7.24 ± 1.43 | 1.76E−05 |
| Firmicutes | Bacilli | Lactobacillales | Leuconostocaceae | Leuconostoc | no data | 0.00E+00 (0.00E+00 to 1.11E−04) | 1.52E−03 (0.00E+00 to 3.58E−02) | 7.19 ± 1.23 | 3.52E−07 |
| Firmicutes | Bacilli | Lactobacillales | Leuconostocaceae | Leuconostoc | kimchii | 0.00E+00 (0.00E+00 to 0.00E+00) | 0.00E+00 (0.00E+00 to 2.26E−03) | 7.12 ± 1.60 | 2.28E−04 |
| Firmicutes | Bacilli | Lactobacillales | Lactobacillaceae | Lactobacillus | sanfranciscensis | 0.00E+00 (0.00E+00 to 9.13E−05) | 1.94E−04 (0.00E+00 to 6.55E−03) | 6.94 ± 1.46 | 6.48E−05 |
| Firmicutes | Bacilli | Lactobacillales | Leuconostocaceae | Leuconostoc | pseudomesenteroides | 0.00E+00 (0.00E+00 to 0.00E+00) | 0.00E+00 (0.00E+00 to 7.94E−04) | 6.94 ± 1.17 | 2.64E−07 |
| Firmicutes | Bacilli | Lactobacillales | Leuconostocaceae | Leuconostoc | citreum | 2.35E−05 (0.00E+00 to 2.98E−04) | 7.62E−04 (2.16E−04 to 2.33E−02) | 6.68 ± 0.97 | 1.04E−09 |
| Firmicutes | Bacilli | Lactobacillales | Leuconostocaceae | Leuconostoc | fallax | 0.00E+00 (0.00E+00 to 0.00E+00) | 0.00E+00 (0.00E+00 to 7.02E−04) | 6.67 ± 1.50 | 2.38E−04 |
| Firmicutes | Bacilli | Lactobacillales | Enterococcaceae | Tetragenococcus | halophilus | 0.00E+00 (0.00E+00 to 0.00E+00) | 0.00E+00 (0.00E+00 to 8.40E−05) | 6.56 ± 1.74 | 2.81E−03 |
| Firmicutes | Bacilli | Lactobacillales | Lactobacillaceae | Lactobacillus | saniviri | 0.00E+00 (0.00E+00 to 0.00E+00) | 0.00E+00 (0.00E+00 to 7.28E−05) | 6.30 ± 1.77 | 5.03E−03 |
| Firmicutes | Bacilli | Lactobacillales | Lactobacillaceae | Lactobacillus | plantarum | 4.21E−05 (0.00E+00 to 2.57E−04) | 1.37E−04 (0.00E+00 to 1.90E−03) | 6.23 ± 1.12 | 1.48E−06 |
| Firmicutes | Bacilli | Lactobacillales | Lactobacillaceae | Lactobacillus | paralimentarius | 0.00E+00 (0.00E+00 to 4.38E−05) | 1.61E−05 (0.00E+00 to 1.75E−04) | 6.22 ± 1.91 | 1.28E−02 |
| Actinobacteria | Actinobacteria | Micrococcales | Micrococcaceae | Arthrobacter | no data | 0.00E+00 (0.00E+00 to 0.00E+00) | 0.00E+00 (0.00E+00 to 2.25E−04) | 6.22 ± 1.42 | 2.90E−04 |
| Firmicutes | Bacilli | Lactobacillales | Leuconostocaceae | Weissella | hellenica | 0.00E+00 (0.00E+00 to 0.00E+00) | 0.00E+00 (0.00E+00 to 6.72E−04) | 6.15 ± 1.29 | 6.48E−05 |
| Firmicutes | Bacilli | Lactobacillales | Leuconostocaceae | Weissella | cibaria | 0.00E+00 (0.00E+00 to 6.30E−05) | 2.25E−04 (0.00E+00 to 2.10E−03) | 6.01 ± 1.18 | 1.61E−05 |
| Firmicutes | Bacilli | Lactobacillales | Lactobacillaceae | Lactobacillus | coryniformis | 0.00E+00 (0.00E+00 to 0.00E+00) | 0.00E+00 (0.00E+00 to 3.87E−04) | 5.91 ± 1.46 | 9.81E−04 |
| Proteobacteria | Gammaproteobacteria | Enterobacterales | Morganellaceae | Morganella | morganii | 0.00E+00 (0.00E+00 to 0.00E+00) | 0.00E+00 (0.00E+00 to 6.20E−05) | 5.81 ± 1.37 | 4.88E−04 |
| Firmicutes | Bacilli | Lactobacillales | Lactobacillaceae | Lactobacillus | capillatus | 0.00E+00 (0.00E+00 to 6.65E−05) | 1.29E−05 (0.00E+00 to 2.49E−03) | 5.81 ± 1.95 | 2.80E−02 |
| Proteobacteria | Gammaproteobacteria | Enterobacterales | Enterobacteriaceae | Kosakonia | sp S29 | 0.00E+00 (0.00E+00 to 0.00E+00) | 2.83E−05 (0.00E+00 to 1.35E−04) | 5.76 ± 1.14 | 1.76E−05 |
| Firmicutes | Bacilli | Lactobacillales | Leuconostocaceae | Leuconostoc | mesenteroides | 8.43E−05 (0.00E+00 to 2.37E−04) | 3.02E−04 (0.00E+00 to 1.46E−02) | 5.64 ± 1.07 | 5.87E−06 |
| Firmicutes | Bacilli | Lactobacillales | Lactobacillaceae | Lactobacillus | brevis | 2.63E−05 (0.00E+00 to 1.26E−04) | 9.84E−05 (0.00E+00 to 7.25E−04) | 5.55 ± 0.97 | 7.77E−07 |
| Firmicutes | Bacilli | Lactobacillales | Lactobacillaceae | Lactobacillus | pentosus | 0.00E+00 (0.00E+00 to 0.00E+00) | 0.00E+00 (0.00E+00 to 1.39E−04) | 5.43 ± 1.31 | 7.19E−04 |
| Firmicutes | Bacilli | Lactobacillales | Leuconostocaceae | Weissella | jogaejeotgali | 0.00E+00 (0.00E+00 to 0.00E+00) | 0.00E+00 (0.00E+00 to 1.78E−04) | 5.33 ± 1.43 | 3.02E−03 |
| Firmicutes | Bacilli | Lactobacillales | Lactobacillaceae | Pediococcus | inopinatus | 0.00E+00 (0.00E+00 to 0.00E+00) | 0.00E+00 (0.00E+00 to 9.05E−05) | 5.08 ± 1.71 | 2.85E−02 |
| Firmicutes | Bacilli | Lactobacillales | Leuconostocaceae | Weissella | confusa | 0.00E+00 (0.00E+00 to 1.12E−04) | 6.25E−05 (0.00E+00 to 1.90E−04) | 4.92 ± 1.13 | 3.39E−04 |
| Firmicutes | Bacilli | Lactobacillales | Lactobacillaceae | Lactobacillus | oligofermentans | 0.00E+00 (0.00E+00 to 0.00E+00) | 0.00E+00 (0.00E+00 to 4.01E−04) | 4.89 ± 1.50 | 1.25E−02 |
| Firmicutes | Bacilli | Lactobacillales | Leuconostocaceae | Weissella | no data | 0.00E+00 (0.00E+00 to 1.11E−04) | 5.12E−05 (0.00E+00 to 6.32E−04) | 4.86 ± 1.07 | 1.56E−04 |
| Firmicutes | Bacilli | Lactobacillales | Lactobacillaceae | Lactobacillus | no data | 1.61E−03 (4.32E−04 to 4.28E−03) | 1.57E−02 (7.43E−04 to 7.92E−02) | 4.85 ± 0.72 | 1.94E−09 |
| Firmicutes | Bacilli | Lactobacillales | Lactobacillaceae | Lactobacillus | paraplantarum | 0.00E+00 (0.00E+00 to 0.00E+00) | 0.00E+00 (0.00E+00 to 2.48E−04) | 4.80 ± 1.36 | 5.63E−03 |
| Firmicutes | Bacilli | Lactobacillales | Leuconostocaceae | Weissella | paramesenteroides | 0.00E+00 (0.00E+00 to 5.53E−05) | 0.00E+00 (0.00E+00 to 2.43E−04) | 4.70 ± 1.22 | 2.08E−03 |
| Actinobacteria | Actinobacteria | Bifidobacteriales | Bifidobacteriaceae | Bifidobacterium | animalis | 0.00E+00 (0.00E+00 to 1.59E−04) | 0.00E+00 (0.00E+00 to 6.60E−06) | 4.67 ± 1.68 | 4.39E−02 |
| Firmicutes | Bacilli | Lactobacillales | Streptococcaceae | Streptococcus | hyovaginalis | 0.00E+00 (0.00E+00 to 0.00E+00) | 0.00E+00 (0.00E+00 to 1.18E−04) | 4.57 ± 1.31 | 6.47E−03 |
| Firmicutes | Bacilli | Lactobacillales | Leuconostocaceae | Weissella | koreensis | 0.00E+00 (0.00E+00 to 0.00E+00) | 0.00E+00 (0.00E+00 to 4.02E−04) | 4.55 ± 1.59 | 3.43E−02 |
| Proteobacteria | Gammaproteobacteria | Enterobacterales | Hafniaceae | Hafnia | alvei | 0.00E+00 (0.00E+00 to 7.61E−05) | 9.66E−05 (0.00E+00 to 2.41E−03) | 4.52 ± 1.42 | 1.58E−02 |
| Firmicutes | Bacilli | Lactobacillales | Leuconostocaceae | Leuconostoc | lactis | 0.00E+00 (0.00E+00 to 2.35E−05) | 7.59E−05 (0.00E+00 to 8.90E−04) | 4.49 ± 1.26 | 5.03E−03 |
| Firmicutes | Bacilli | Lactobacillales | Leuconostocaceae | Leuconostoc | garlicum | 0.00E+00 (0.00E+00 to 0.00E+00) | 7.89E−05 (0.00E+00 to 1.36E−03) | 4.45 ± 1.33 | 9.80E−03 |
| Proteobacteria | Gammaproteobacteria | Enterobacterales | Morganellaceae | Proteus | sp HMSC10D02 | 0.00E+00 (0.00E+00 to 6.23E−05) | 0.00E+00 (0.00E+00 to 1.45E−04) | 4.32 ± 1.10 | 1.65E−03 |
| Firmicutes | Bacilli | Lactobacillales | Lactobacillaceae | Lactobacillus | parafarraginis | 0.00E+00 (0.00E+00 to 0.00E+00) | 0.00E+00 (0.00E+00 to 4.81E−05) | 4.23 ± 1.40 | 2.59E−02 |
| Proteobacteria | Gammaproteobacteria | Enterobacterales | Enterobacteriaceae | Raoultella | ornithinolytica | 1.59E−05 (0.00E+00 to 3.26E−04) | 1.35E−04 (0.00E+00 to 1.01E−03) | 4.22 ± 0.94 | 2.04E−04 |
| Proteobacteria | Gammaproteobacteria | Enterobacterales | Enterobacteriaceae | Klebsiella | sp HMSC25G12 | 0.00E+00 (0.00E+00 to 9.44E−06) | 0.00E+00 (0.00E+00 to 1.63E−04) | 4.16 ± 1.38 | 2.59E−02 |
| Proteobacteria | Gammaproteobacteria | Enterobacterales | Hafniaceae | Edwardsiella | tarda | 0.00E+00 (0.00E+00 to 4.38E−05) | 7.19E−05 (0.00E+00 to 6.58E−04) | 4.13 ± 1.20 | 7.62E−03 |
| Proteobacteria | Gammaproteobacteria | Enterobacterales | Enterobacteriaceae | Cronobacter | dublinensis | 0.00E+00 (0.00E+00 to 1.00E−04) | 2.29E−05 (0.00E+00 to 2.66E−04) | 4.07 ± 1.13 | 4.65E−03 |
| Firmicutes | Bacilli | Lactobacillales | Enterococcaceae | Enterococcus | sp kppr-6 | 0.00E+00 (0.00E+00 to 7.30E−05) | 3.30E−05 (0.00E+00 to 8.30E−05) | 3.91 ± 1.16 | 9.79E−03 |
| Firmicutes | Bacilli | Lactobacillales | Lactobacillaceae | Lactobacillus | kefiranofaciens | 8.20E−05 (0.00E+00 to 2.80E−04) | 1.43E−04 (2.66E−05 to 1.52E−03) | 3.89 ± 1.37 | 3.57E−02 |
| Firmicutes | Bacilli | Lactobacillales | Carnobacteriaceae | Carnobacterium | maltaromaticum | 0.00E+00 (0.00E+00 to 0.00E+00) | 0.00E+00 (0.00E+00 to 1.46E−04) | 3.89 ± 0.92 | 5.42E−04 |
| Firmicutes | Bacilli | Lactobacillales | Carnobacteriaceae | Carnobacterium | divergens | 0.00E+00 (0.00E+00 to 1.58E−04) | 1.63E−04 (0.00E+00 to 2.02E−03) | 3.88 ± 1.04 | 2.99E−03 |
| Proteobacteria | Gammaproteobacteria | Enterobacterales | Enterobacteriaceae | Klebsiella | cf. planticola B43 | 0.00E+00 (0.00E+00 to 3.96E−05) | 2.68E−05 (0.00E+00 to 4.17E−05) | 3.66 ± 1.01 | 4.25E−03 |
| Firmicutes | Clostridia | Clostridiales | Clostridiaceae | Clostridium | sp CL-2 | 3.68E−05 (0.00E+00 to 3.50E−04) | 6.46E−05 (0.00E+00 to 6.24E−04) | 3.62 ± 0.90 | 1.08E−03 |
| Firmicutes | Bacilli | Lactobacillales | Streptococcaceae | Lactococcus | piscium | 1.70E−04 (2.10E−05 to 3.65E−04) | 3.60E−04 (8.80E−05 to 4.30E−03) | 3.32 ± 0.73 | 1.43E−04 |
| Proteobacteria | Gammaproteobacteria | Enterobacterales | Enterobacteriaceae | Raoultella | planticola | 0.00E+00 (0.00E+00 to 7.77E−05) | 6.66E−05 (0.00E+00 to 5.63E−04) | 3.20 ± 1.00 | 1.48E−02 |
| Firmicutes | Bacilli | Lactobacillales | Lactobacillaceae | Lactobacillus | fermentum | 4.90E−05 (0.00E+00 to 2.86E−04) | 1.73E−04 (0.00E+00 to 5.50E−04) | 3.16 ± 0.97 | 1.31E−02 |
| Proteobacteria | Gammaproteobacteria | Enterobacterales | Enterobacteriaceae | Lelliottia | jeotgali | 0.00E+00 (0.00E+00 to 3.33E−05) | 3.11E−05 (0.00E+00 to 7.24E−05) | 3.15 ± 1.13 | 4.39E−02 |
| Proteobacteria | Gammaproteobacteria | Enterobacterales | Enterobacteriaceae | Enterobacter | cloacae complex Hoffmann cluster III | 0.00E+00 (0.00E+00 to 2.78E−04) | 1.62E−04 (0.00E+00 to 8.01E−04) | 3.14 ± 0.96 | 1.25E−02 |
| Bacteroidetes | Bacteroidia | Bacteroidales | Tannerellaceae | Parabacteroides | merdae | 1.54E−04 (0.00E+00 to 1.50E−03) | 2.75E−05 (0.00E+00 to 1.05E−03) | 3.12 ± 1.04 | 2.64E−02 |
| Firmicutes | Bacilli | Lactobacillales | Streptococcaceae | Lactococcus | lactis | 3.81E−03 (9.03E−04 to 2.35E−02) | 7.09E−03 (2.76E−03 to 3.68E−02) | 2.99 ± 0.84 | 5.03E−03 |
| Firmicutes | Bacilli | Lactobacillales | Enterococcaceae | Enterococcus | sp HMSC067C01 | 1.45E−04 (0.00E+00 to 1.67E−03) | 5.45E−04 (9.33E−05 to 1.77E−02) | 2.93 ± 0.97 | 2.45E−02 |
| Proteobacteria | Gammaproteobacteria | Enterobacterales | Enterobacteriaceae | Klebsiella | no data | 1.44E−03 (0.00E+00 to 9.01E−03) | 7.64E−03 (9.62E−04 to 2.58E−02) | 2.92 ± 0.91 | 1.43E−02 |
| Firmicutes | Bacilli | Lactobacillales | Lactobacillaceae | Pediococcus | acidilactici | 2.62E−05 (0.00E+00 to 1.36E−04) | 5.89E−05 (0.00E+00 to 4.94E−04) | 2.79 ± 0.97 | 3.39E−02 |
| Firmicutes | Clostridia | Clostridiales | Peptostreptococcaceae | Terrisporobacter | glycolicus | 9.90E−05 (0.00E+00 to 1.49E−03) | 2.07E−04 (0.00E+00 to 3.80E−03) | 2.77 ± 0.97 | 3.47E−02 |
| Proteobacteria | Gammaproteobacteria | Enterobacterales | Enterobacteriaceae | Enterobacter | asburiae | 0.00E+00 (0.00E+00 to 5.62E−04) | 2.42E−04 (3.63E−05 to 1.35E−03) | 2.58 ± 0.89 | 3.18E−02 |
| Firmicutes | Bacilli | Lactobacillales | Lactobacillaceae | Lactobacillus | parabuchneri | 8.76E−05 (0.00E+00 to 2.69E−04) | 6.09E−05 (0.00E+00 to 2.71E−04) | 2.36 ± 0.87 | 4.99E−02 |
| Firmicutes | Clostridia | Clostridiales | Lachnospiraceae | Tyzzerella | nexilis | 3.93E−02 (1.98E−02 to 5.81E−02) | 2.04E−02 (4.61E−03 to 6.78E−02) | 2.21 ± 0.61 | 4.25E−03 |
| Proteobacteria | Gammaproteobacteria | Enterobacterales | Enterobacteriaceae | Pseudescherichia | vulneris | 0.00E+00 (0.00E+00 to 8.89E−05) | 1.10E−04 (3.63E−05 to 2.01E−04) | 2.10 ± 0.77 | 4.86E−02 |
| Decreased at week 4 (28 species) | |||||||||
| Firmicutes | Bacilli | Bacillales | Planococcaceae | Rummeliibacillus | stabekisii | 0.00E+00 (0.00E+00 to 8.97E−05) | 0.00E+00 (0.00E+00 to 0.00E+00) | −10.85 ± 2.15 | 1.76E−05 |
| Firmicutes | Bacilli | Bacillales | Paenibacillaceae | Paenibacillus | ginsengihumi | 0.00E+00 (0.00E+00 to 1.49E−04) | 0.00E+00 (0.00E+00 to 0.00E+00) | −6.63 ± 1.37 | 4.55E−05 |
| Firmicutes | Bacilli | Bacillales | Paenibacillaceae | Brevibacillus | borstelensis | 0.00E+00 (0.00E+00 to 9.69E−05) | 0.00E+00 (0.00E+00 to 0.00E+00) | −6.24 ± 1.54 | 9.81E−04 |
| Firmicutes | Bacilli | Bacillales | Paenibacillaceae | Aneurinibacillus | no data | 0.00E+00 (0.00E+00 to 1.84E−04) | 0.00E+00 (0.00E+00 to 0.00E+00) | −5.04 ± 1.42 | 5.03E−03 |
| Firmicutes | Bacilli | Lactobacillales | Enterococcaceae | Enterococcus | canintestini | 4.60E−05 (0.00E+00 to 3.30E−03) | 1.06E−04 (0.00E+00 to 4.47E−04) | −5.02 ± 1.27 | 1.41E−03 |
| Firmicutes | Bacilli | Lactobacillales | Enterococcaceae | Enterococcus | hirae | 2.01E−04 (2.70E−05 to 5.32E−03) | 1.40E−03 (0.00E+00 to 8.16E−03) | −4.48 ± 1.06 | 5.07E−04 |
| Bacteroidetes | Bacteroidia | Bacteroidales | Prevotellaceae | Prevotella | copri | 5.71E−05 (0.00E+00 to 1.20E−01) | 2.94E−05 (0.00E+00 to 3.01E−04) | −4.41 ± 1.54 | 3.44E−02 |
| Bacteroidetes | Bacteroidia | Bacteroidales | Prevotellaceae | Prevotella | stercorea | 0.00E+00 (0.00E+00 to 6.00E−04) | 0.00E+00 (0.00E+00 to 0.00E+00) | −3.97 ± 1.35 | 2.90E−02 |
| Bacteroidetes | Bacteroidia | Bacteroidales | Prevotellaceae | Prevotella | buccalis | 0.00E+00 (0.00E+00 to 2.28E−04) | 0.00E+00 (0.00E+00 to 0.00E+00) | −3.91 ± 1.42 | 4.63E−02 |
| Firmicutes | Clostridia | Clostridiales | Lachnospiraceae | Blautia | wexlerae | 4.99E−02 (1.54E−02 to 1.35E−01) | 2.52E−02 (5.28E−03 to 3.90E−02) | −3.90 ± 0.62 | 4.02E−08 |
| Firmicutes | Clostridia | Clostridiales | Lachnospiraceae | Blautia | sp Marseille-P2398 | 1.90E−03 (7.51E−04 to 4.41E−03) | 6.13E−04 (0.00E+00 to 1.33E−03) | −3.75 ± 0.81 | 1.15E−04 |
| Firmicutes | Clostridia | Clostridiales | Lachnospiraceae | Blautia | no data | 2.12E−01 (9.30E−02 to 3.45E−01) | 6.61E−02 (8.53E−03 to 2.10E−01) | −3.33 ± 0.62 | 3.55E−06 |
| Bacteroidetes | Bacteroidia | Bacteroidales | Bacteroidaceae | Bacteroides | thetaiotaomicron | 1.96E−04 (3.66E−05 to 9.82E−04) | 0.00E+00 (0.00E+00 to 1.73E−04) | −3.14 ± 0.88 | 5.03E−03 |
| Firmicutes | Clostridia | Clostridiales | Clostridiaceae | Clostridium | baratii | 1.05E−04 (0.00E+00 to 5.42E−04) | 3.42E−05 (0.00E+00 to 4.11E−04) | −2.99 ± 1.01 | 2.90E−02 |
| Bacteroidetes | Bacteroidia | Bacteroidales | Bacteroidaceae | Bacteroides | coprophilus | 3.78E−04 (4.00E−05 to 2.33E−03) | 2.95E−05 (0.00E+00 to 1.87E−04) | −2.96 ± 0.97 | 2.28E−02 |
| Actinobacteria | Actinobacteria | Bifidobacteriales | Bifidobacteriaceae | Bifidobacterium | longum | 1.30E−04 (0.00E+00 to 1.04E−03) | 7.44E−05 (0.00E+00 to 5.36E−04) | −2.93 ± 1.00 | 3.15E−02 |
| Firmicutes | Clostridia | Clostridiales | Peptostreptococcaceae | Peptostreptococcus | russellii | 1.60E−04 (0.00E+00 to 5.47E−04) | 0.00E+00 (0.00E+00 to 4.79E−05) | −2.92 ± 0.98 | 2.80E−02 |
| Firmicutes | Erysipelotrichia | Erysipelotrichales | Erysipelotrichaceae | Traorella | massiliensis | 8.35E−05 (0.00E+00 to 2.42E−04) | 5.39E−05 (0.00E+00 to 1.39E−04) | −2.88 ± 0.94 | 2.28E−02 |
| Firmicutes | Clostridia | Clostridiales | Clostridiaceae | Clostridium | sp L2-50 | 4.28E−05 (0.00E+00 to 4.24E−04) | 0.00E+00 (0.00E+00 to 0.00E+00) | −2.88 ± 0.79 | 4.10E−03 |
| Firmicutes | Clostridia | Clostridiales | Lachnospiraceae | Blautia | obeum | 2.29E−02 (9.54E−03 to 5.48E−02) | 7.10E−03 (1.23E−03 to 2.10E−02) | −2.86 ± 0.59 | 4.88E−05 |
| Firmicutes | Clostridia | Clostridiales | Ruminococcaceae | no data | no data | 1.04E−03 (1.82E−04 to 4.44E−03) | 1.81E−04 (0.00E+00 to 7.61E−04) | −2.75 ± 0.65 | 5.07E−04 |
| Firmicutes | Clostridia | Clostridiales | Lachnospiraceae | Roseburia | hominis | 2.63E−04 (2.39E−05 to 1.91E−03) | 9.08E−05 (0.00E+00 to 3.07E−04) | −2.74 ± 0.74 | 3.60E−03 |
| Firmicutes | Erysipelotrichia | Erysipelotrichales | Erysipelotrichaceae | Faecalitalea | sp Marseille-P3755 | 1.04E−04 (0.00E+00 to 2.68E−04) | 0.00E+00 (0.00E+00 to 5.27E−05) | −2.63 ± 0.91 | 3.20E−02 |
| Firmicutes | Clostridia | Clostridiales | Lachnospiraceae | no data | bacterium 28-4 | 5.43E−05 (2.65E−05 to 1.67E−04) | 0.00E+00 (0.00E+00 to 4.85E−05) | −2.42 ± 0.73 | 1.07E−02 |
| Firmicutes | Bacilli | Bacillales | Bacillaceae | Bacillus | no data | 4.89E−04 (1.37E−04 to 1.13E−03) | 5.78E−05 (0.00E+00 to 2.96E−04) | −2.40 ± 0.73 | 1.25E−02 |
| Firmicutes | Clostridia | Clostridiales | Lachnospiraceae | Faecalicatena | contorta | 7.58E−04 (7.63E−05 to 1.82E−03) | 9.69E−05 (0.00E+00 to 4.14E−04) | −2.24 ± 0.77 | 3.18E−02 |
| Firmicutes | Clostridia | Clostridiales | Lachnospiraceae | no data | Bacterium 1 4 56FAA | 2.36E−02 (8.91E−03 to 7.52E−02) | 7.29E−03 (1.38E−03 to 1.72E−02) | −2.17 ± 0.67 | 1.32E−02 |
| Firmicutes | Clostridia | Clostridiales | Ruminococcaceae | Faecalibacterium | prausnitzii | 9.43E−03 (3.19E−03 to 2.18E−02) | 1.46E−03 (1.30E−04 to 8.07E−03) | −2.07 ± 0.59 | 6.19E−03 |
Notes:
FC, fold change; SE, standard error.
Gut microbiome functionality
A total of 4,617 KO terms from all samples were identified, and after filtering 4,216 remained for subsequent analyses. PCoA was performed to investigate changes between time points. Fig. 5A shows the first two principal coordinate axes (which respectively explain 67.1% and 11.3% of the variation) and the eigenvalues for the first 25 axes are shown in Fig. S6. Spatial separation between the two timepoints along the first two PCoA axes was demonstrated (p = 0.007, PERMANOVA using the Bray–Curtis dissimilarity matrices). A significant shift in the PCo1 score after 4 weeks of diet change was observed (p = 0.013, Wilcoxon signed rank test, Fig. 5B). As listed in Table 5, a significant increase in the abundances of 14 KO terms was observed using a negative binomial GLM, while the abundances of 11 KO terms significantly decreased. Pathway mapping demonstrated differential abundances of pathways including the biosynthesis of secondary metabolites (ko01110: K02203, K13548, K16011), amino sugar and nucleotide sugar metabolism (ko00520: K13019, K16011, K17716), O-antigen nucleotide sugar biosynthesis (ko00541: K13019, K16011, K17716), and microbial metabolism in diverse environments (ko01120: K00385, K02203, K16165).

Figure 5: Principal coordinate analysis (PCoA) of the Kyoto Encyclopedia of Genes and Genomes Orthology (KO) terms.
(A) PCo1 (Axis 1) and PCo2 (Axis 2) respectively explain 67.1% and 11.3% of abundance variance (56 samples from 28 dogs). PERMANOVA using Bray–Curtis distance shows significant spatial separation between baseline (red) and week 4 (blue) (p = 0.007). (B) A significant shift along the PCo1 axis from baseline (red) to week 4 (blue) is observed (p = 0.013, Wilcoxon signed rank test).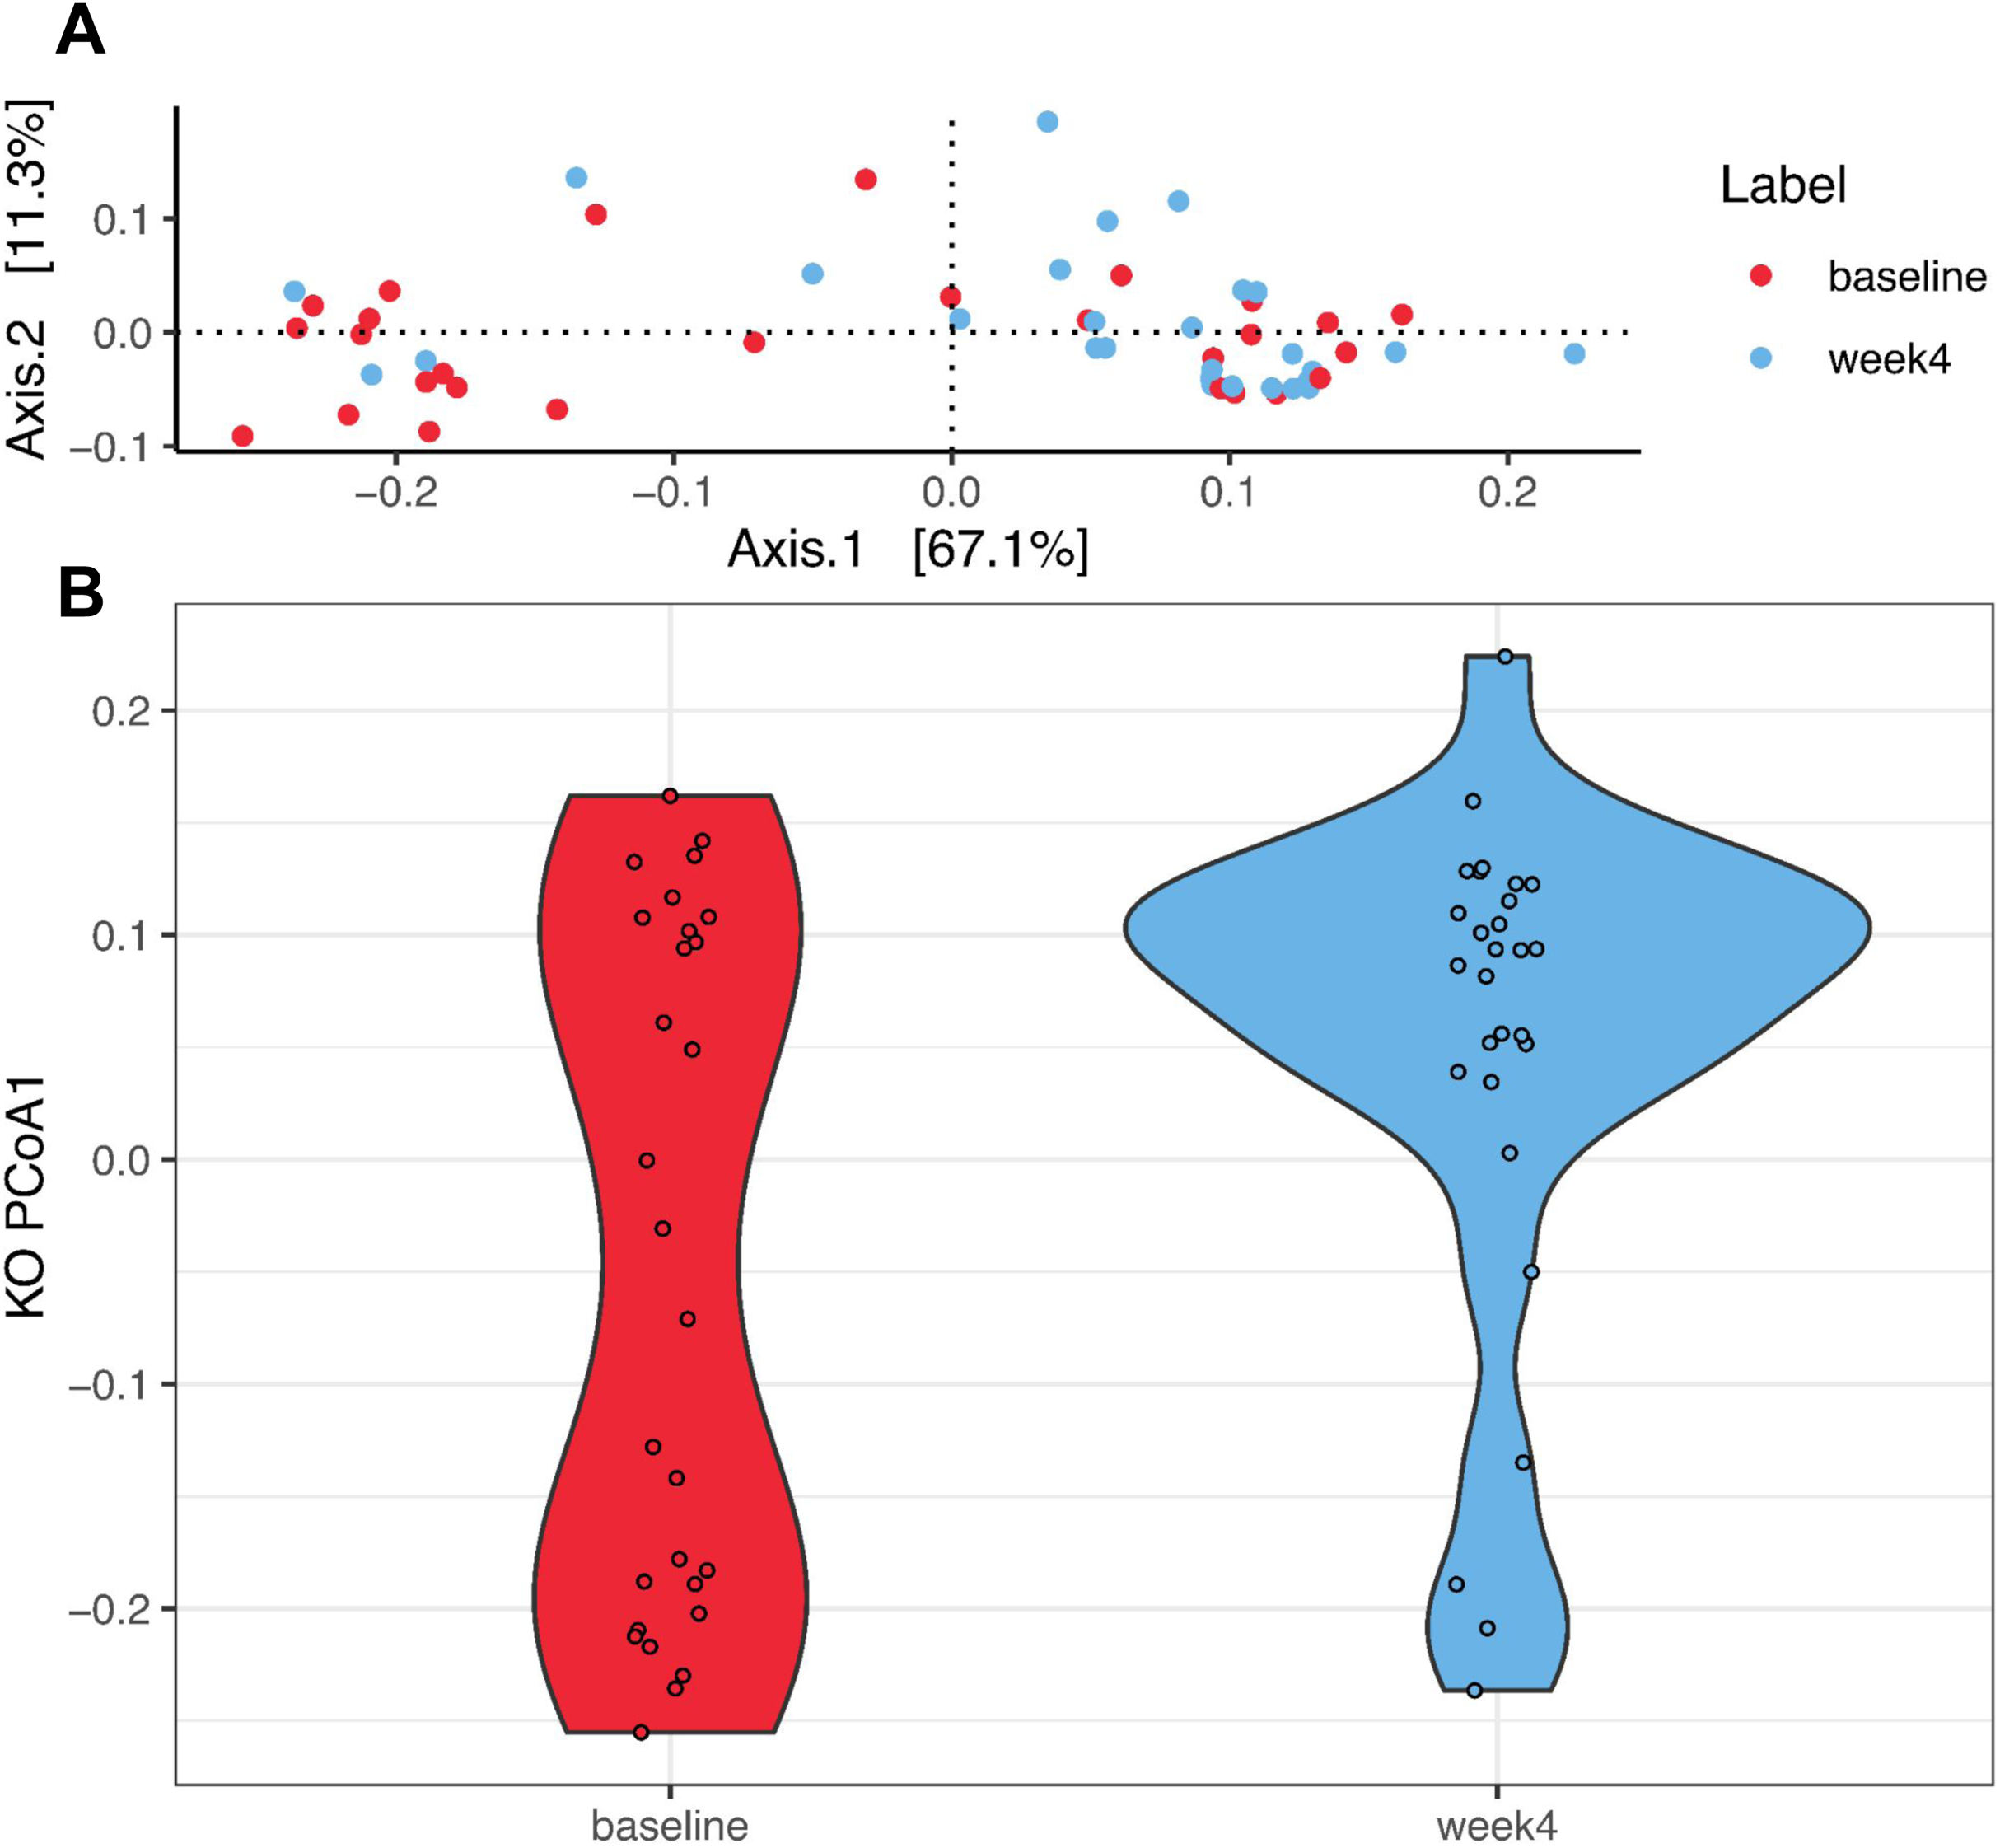
| KO term | Description | Week 4 vs. Baseline | |
|---|---|---|---|
| Log 2 FC mean ± SE |
Adjusted P−value1 |
||
| Increased abundance at week 4 | |||
| K16323 | purine nucleoside transport protein | 7.2 ± 1.24 | 1.80E−05 |
| K13548 | 2-deoxy-scyllo-inosamine dehydrogenase [EC:1.1.1.329] | 6.29 ± 1.39 | 0.005 |
| K11628 | mycocerosic acid synthase [EC:2.3.1.111] | 5.99 ± 1.58 | 0.034 |
| K20707 | lysine racemase [EC:5.1.1.5] | 5.91 ± 1.62 | 0.046 |
| K16959 | L-cystine transport system permease protein | 4.95 ± 1.15 | 0.009 |
| K00638 | chloramphenicol O-acetyltransferase type B [EC:2.3.1.28] | 4.45 ± 1.14 | 0.025 |
| K16846 | (2R)-sulfolactate sulfo-lyase subunit beta [EC:4.4.1.24] | 3.97 ± 0.97 | 0.016 |
| K03457 | nucleobase:cation symporter-1, NCS1 family | 3.32 ± 0.72 | 0.004 |
| K12442 | phthiocerol/phenolphthiocerol synthesis type-I polyketide synthase C [EC:2.3.1.292] | 3.13 ± 0.85 | 0.045 |
| K12953 | cation-transporting P-type ATPase F [EC:7.2.2.-] | 3.07 ± 0.79 | 0.025 |
| K19279 | aminoglycoside 9-adenylyltransferase [EC:2.7.7.-] | 2.66 ± 0.63 | 0.009 |
| K18104 | ATP-binding cassette, subfamily B, bacterial AbcA/BmrA [EC:7.6.2.2] | 2.65 ± 0.68 | 0.025 |
| K19422 | glycosyltransferase EpsD [EC:2.4.-.-] | 2.32 ± 0.59 | 0.025 |
| K15125 | filamentous hemagglutinin | 1.91 ± 0.53 | 0.048 |
| Decreased abundance at week 4 | |||
| K13925 | plasmin and fibronectin-binding protein A | −8.43 ± 1.90 | 0.006 |
| K02203 | phosphoserine / homoserine phosphotransferase [EC:3.1.3.3 2.7.1.39] | −5.08 ± 1.03 | 0.001 |
| K13532 | two-component system, sporulation sensor kinase D [EC:2.7.13.3] | −4.17 ± 1.15 | 0.047 |
| K09759 | nondiscriminating aspartyl-tRNA synthetase [EC:6.1.1.23] | −4.06 ± 0.78 | 0.000 |
| K00351 | Na+−transporting NADH:ubiquinone oxidoreductase subunit F [EC:7.2.1.1] | −3.88 ± 0.95 | 0.016 |
| K14136 | decaprenyl-phosphate phosphoribosyltransferase [EC:2.4.2.45] | −3.33 ± 0.87 | 0.030 |
| K16165 | fumarylpyruvate hydrolase [EC:3.7.1.20] | −2.97 ± 0.79 | 0.036 |
| K16011 | mannose-1-phosphate guanylyltransferase / mannose-6-phosphate isomerase [EC:2.7.7.13 5.3.1.8] | −2.65 ± 0.63 | 0.011 |
| K13019 | UDP-GlcNAc3NAcA epimerase [EC:5.1.3.23] | −2.01 ± 0.54 | 0.040 |
| K17716 | UDP-glucose 4-epimerase [EC:5.1.3.2] | −1.72 ± 0.46 | 0.034 |
| K00385 | anaerobic sulfite reductase subunit C | −1.64 ± 0.38 | 0.008 |
Notes:
Differential gut microbiome responses to diet transition
Identification of high-, mid- and low-responders
While a significant shift in PCo1 score (0.16 ± 0.20) was observed across all subjects over the four week period, there were interindividual differences in the magnitude of the shift along PCo1 (Fig. 2C). Given this wide range of responses, subjects were further divided into tertiles based on the magnitude of PCo1 score change to examine the differential response. Those with the highest magnitude of positive change were termed high-responders (HR, n = 9), those in the second tertile mid-responders (MR, n = 9), and those in the third tertile low-responders (LR, n = 10). PCo1 score was significantly different among HR, MR, and LR at baseline (p = 0.017, Kruskal–Wallis test), but not at week 4 (p = 0.082, Kruskal–Wallis test). PCo1 score at baseline in HR was significantly lower than that of MR (FDR-adjusted p = 0.035, Dunn’s post hoc test) and LR (FDR-adjusted p = 0.025, Dunn’s post hoc test).
To better understand the observed differences in the GM composition among the differential response groups (HR, MR, and LR), the abundances at the species level of the 28 samples collected at baseline were further analyzed. PCoA was performed and the first two axes (PCo1 and PCo2) explained 37.4% and 10.0% of the variation. Spatial separation among HR, MR, and LR along the first two PCo axes was demonstrated (p = 0.022, PERMANOVA Bray–Curtis dissimilarity matrices) (Fig. S7). PAM Clustering analysis revealed two clusters. GM clusters using Bray–Curtis dissimilarity matrices and a MDS ordination assigned 8 HR, 2 MR and 2 LR samples to one cluster (C1), while 94% of samples assigned to the other cluster (C2) contained samples from MR or LR (p = 0.004, Fisher’s exact test). In other words, a significantly higher proportion of HR samples were assigned to C1 and a significantly higher proportion of MR and LR samples were assigned to C2. We also ran a random forest classification model on the samples collected at baseline (70% of the samples used as a training data set and 30% used as a validation data set), which was able to differentiate between the two classes (HR vs. MR/LR) with 78% accuracy. Classification error for HR and MR/LR were 33% and 17% respectively; AUC = 0.94. These results collectively demonstrate that the magnitude of GM response to diet change along the PCo1 axis was dependent on the initial gut microbiota.
Gut microbiome relative abundance at baseline in high- and low-responders
The relative abundances at the phylum level are displayed for HR, MR, and LR (Fig. 3). Comparisons of species abundances demonstrate a distinctive pattern between HR and LR at baseline (Table 6, Fig. 6A). Species belonging to the order Bacteroidales were observed to have higher, and never lower, abundances in HR as compared to LR (Fig. S8A). On the contrary, species belonging to the Enterobacterales or the Lactobacillales order were observed to have lower, and never higher, abundances in HR as compared to LR, with a single exception of Streptococcus minor (Lactobacillales order).
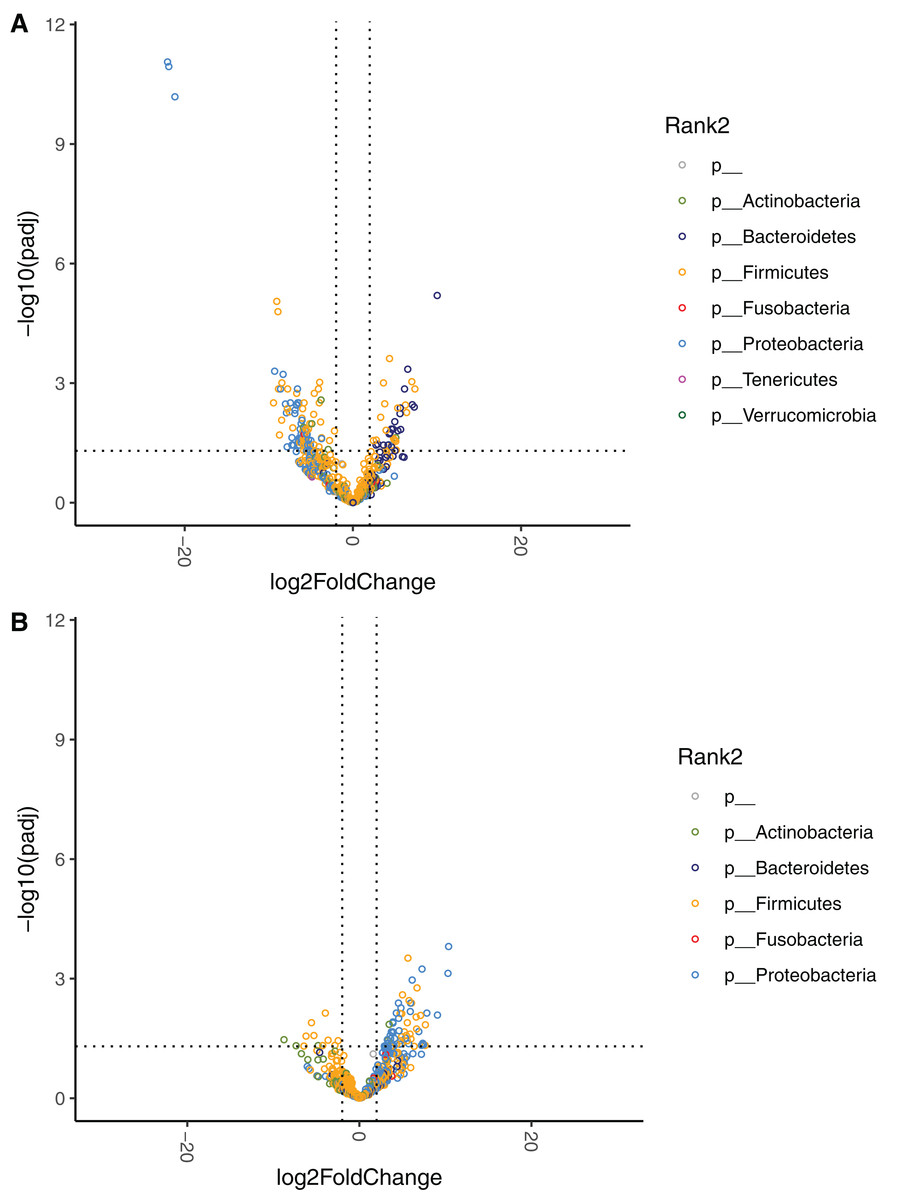
Figure 6: Volcano plots demonstrating fold-change (FC) of species abundance between high-responders (HR, n = 9) and low-responders (LR, n = 10) at (A) baseline and (B) week 4.
FC is calculated from HR/LR. Vertical dashed lines show log2FC at 1 and −1 (i.e. FC at 2 and −2). Horizontal dashed line shows adjusted p = 0.05. Adjustment of p values is performed with false discovery rate. Points are colored by phylum.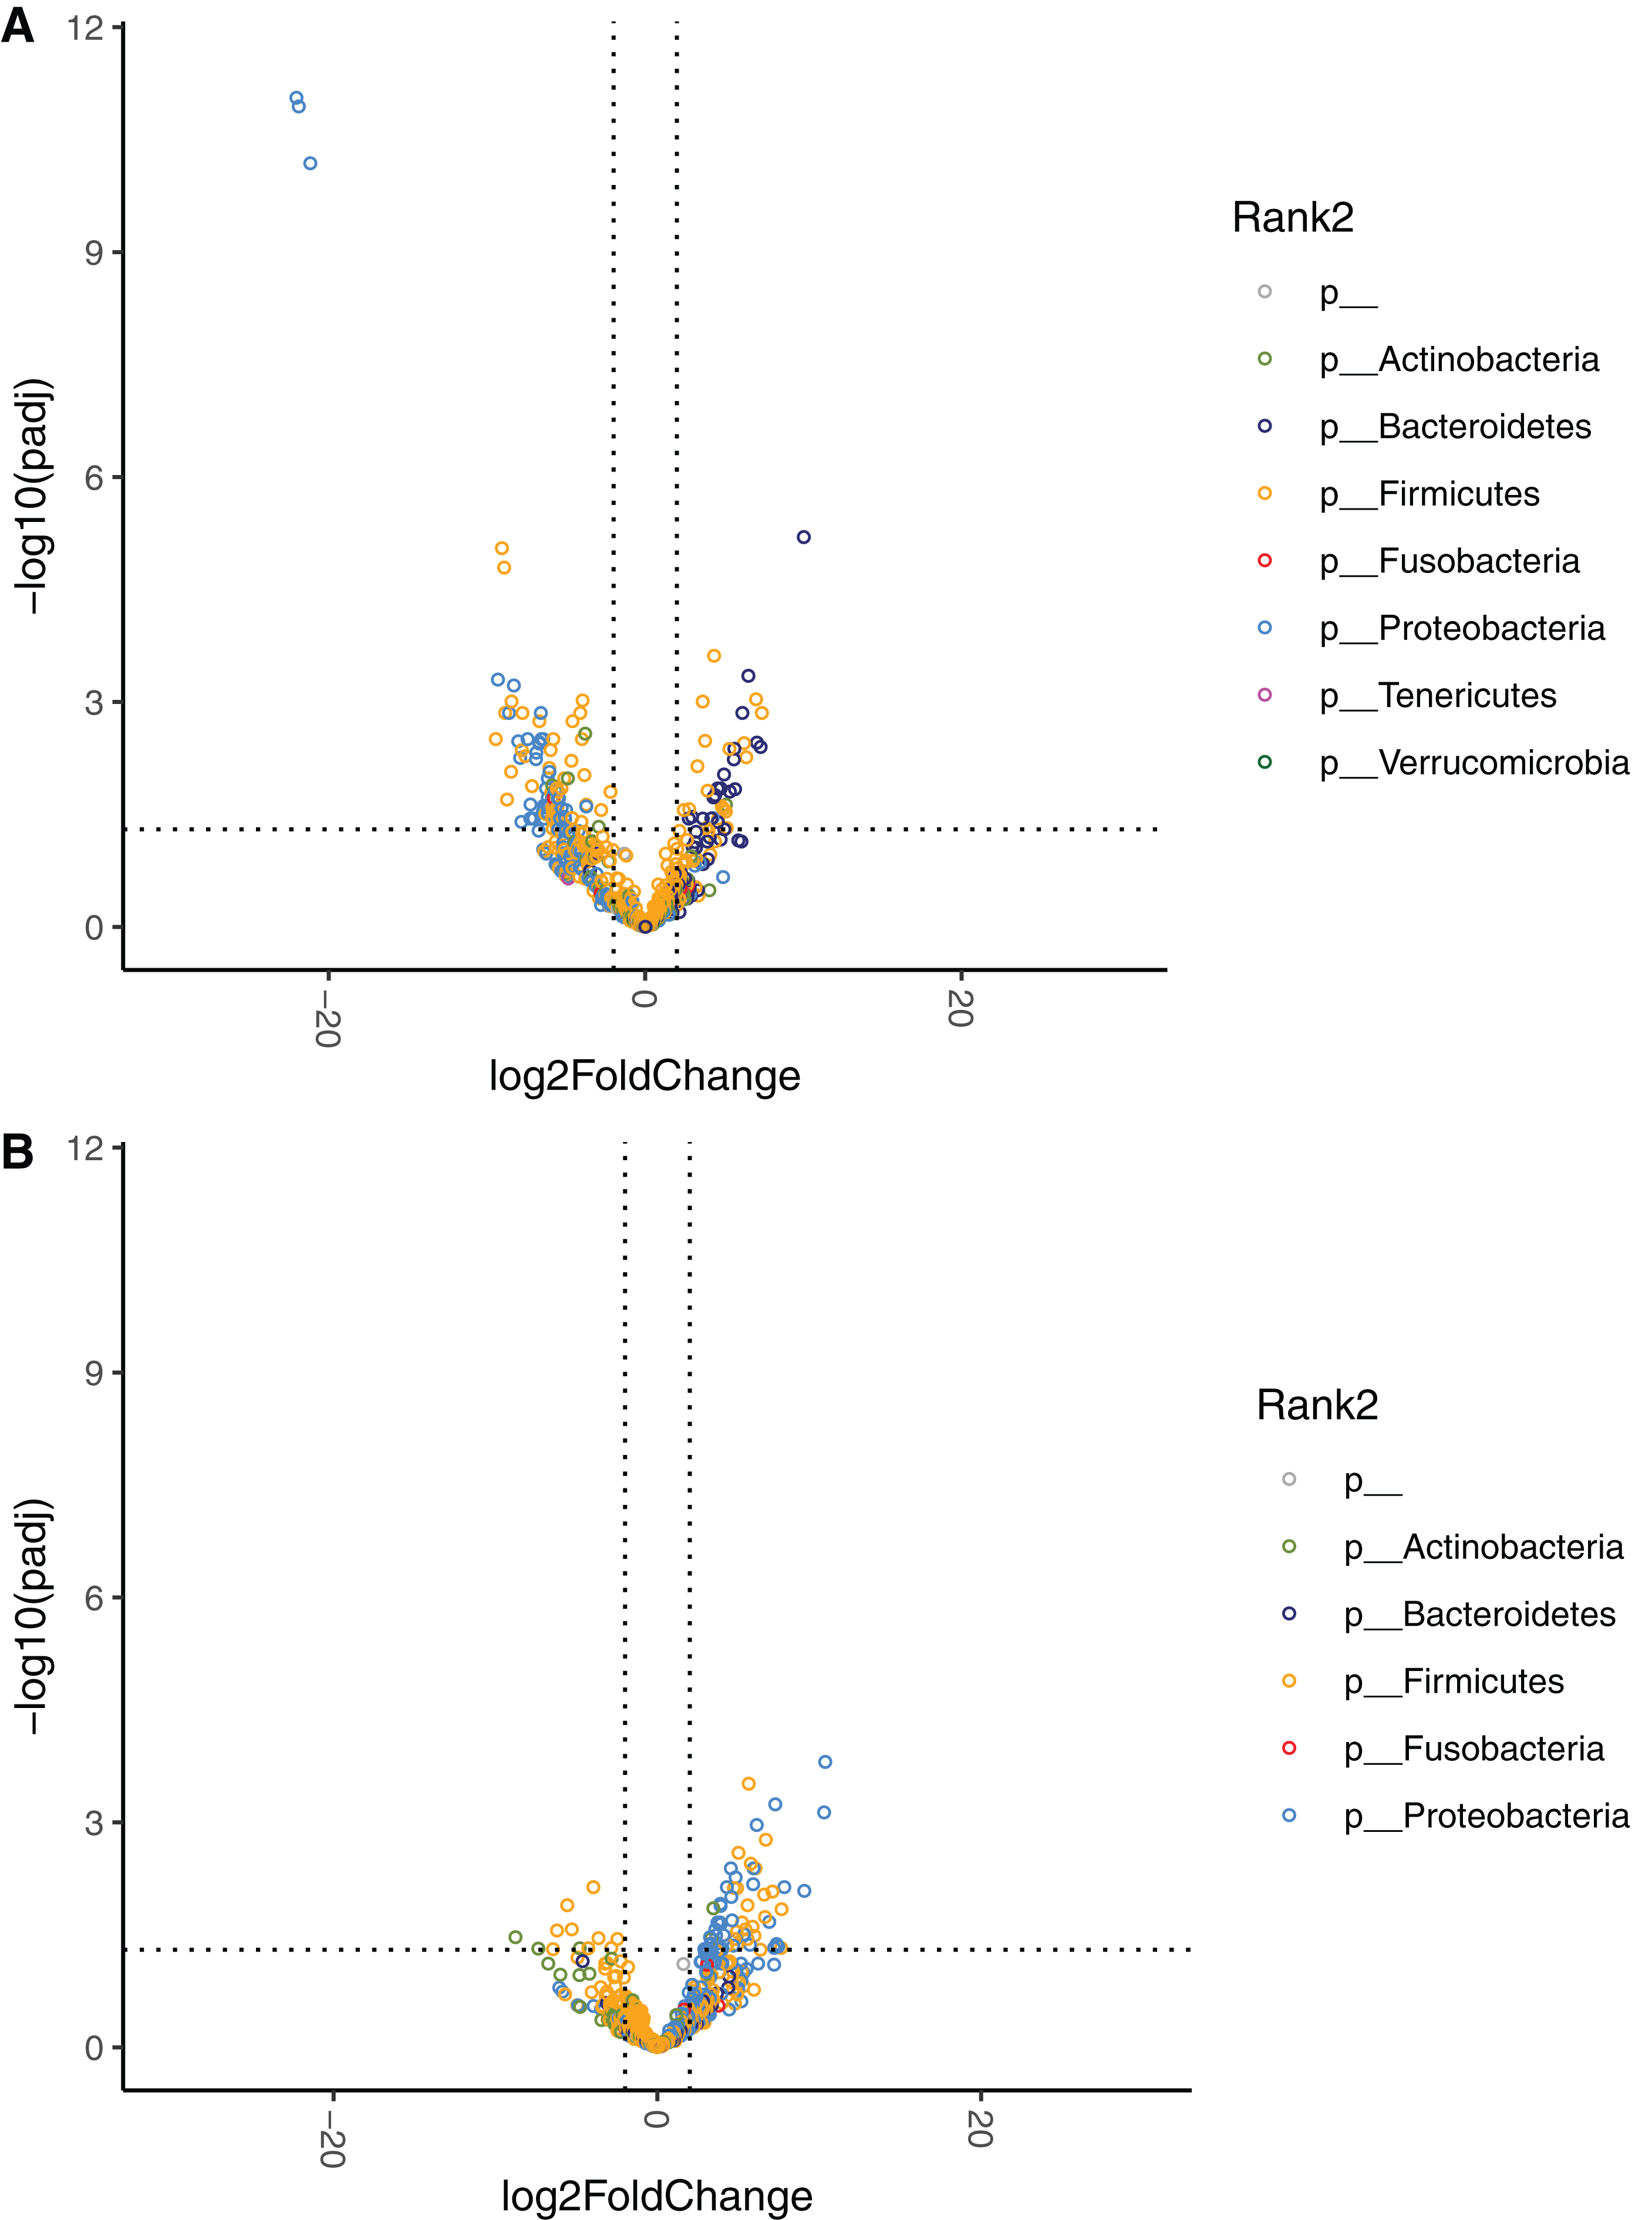
| Phylum | Class | Order | Family | Genus | Species | Relative abundance, in % Median (IQR) |
Baseline HR vs LR | ||
|---|---|---|---|---|---|---|---|---|---|
| HR (n = 9) |
LR (n = 10) |
Log 2 FC mean ± SE |
Adjusted P−value1 |
||||||
| Higher in HR (40 species) | |||||||||
| Bacteroidetes | Bacteroidia | Bacteroidales | Bacteroidaceae | Bacteroides | sp 4 3 47FAA | 3.88E−04 (5.24E−05 to 1.19E−02) | 0.00E+00 (0.00E+00 to 2.96E−05) | 10.02 ± 1.89 | 6.31E−06 |
| Firmicutes | Clostridia | Clostridiales | Ruminococcaceae | Ruminiclostridium | josui | 8.20E−04 (5.24E−05 to 7.18E−03) | 0.00E+00 (0.00E+00 to 0.00E+00) | 7.37 ± 1.84 | 1.40E−03 |
| Bacteroidetes | Bacteroidia | Bacteroidales | Prevotellaceae | Prevotella | bivia | 5.01E−04 (0.00E+00 to 3.85E−03) | 0.00E+00 (0.00E+00 to 0.00E+00) | 7.29 ± 2.01 | 3.97E−03 |
| Bacteroidetes | Bacteroidia | Bacteroidales | Prevotellaceae | Prevotella | copri | 2.09E−01 (1.01E−04 to 2.07E+00) | 5.71E−05 (6.58E−06 to 1.21E−02) | 7.06 ± 1.92 | 3.48E−03 |
| Firmicutes | Negativicutes | Selenomonadales | Selenomonadaceae | Megamonas | sp Calf98-2 | 3.92E−01 (1.17E−02 to 5.17E−01) | 8.40E−04 (0.00E+00 to 4.30E−03) | 7.01 ± 1.67 | 9.19E−04 |
| Bacteroidetes | Bacteroidia | Bacteroidales | Bacteroidaceae | Bacteroides | sp 3 1 33FAA | 9.99E−04 (4.56E−05 to 1.46E−03) | 0.00E+00 (0.00E+00 to 2.10E−05) | 6.52 ± 1.49 | 4.47E−04 |
| Firmicutes | Negativicutes | Selenomonadales | Selenomonadaceae | Megamonas | no data | 3.38E+00 (1.43E−01 to 4.20E+00) | 7.07E−03 (0.00E+00 to 4.27E−02) | 6.38 ± 1.82 | 5.45E−03 |
| Firmicutes | Negativicutes | Selenomonadales | Selenomonadaceae | Megamonas | funiformis | 5.96E−01 (3.11E−02 to 7.66E−01) | 1.25E−03 (0.00E+00 to 7.41E−03) | 6.25 ± 1.71 | 3.53E−03 |
| Bacteroidetes | Bacteroidia | Bacteroidales | Prevotellaceae | Prevotella | buccalis | 2.28E−04 (0.00E+00 to 7.57E−03) | 0.00E+00 (0.00E+00 to 3.66E−05) | 6.14 ± 1.53 | 1.40E−03 |
| Bacteroidetes | Bacteroidia | Bacteroidales | Bacteroidaceae | Bacteroides | sp 9 1 42FAA | 1.82E−04 (6.11E−05 to 2.11E−03) | 0.00E+00 (0.00E+00 to 0.00E+00) | 5.68 ± 1.81 | 1.45E−02 |
| Bacteroidetes | Bacteroidia | Bacteroidales | Bacteroidaceae | Bacteroides | vulgatus | 6.41E−03 (2.69E−03 to 5.92E−02) | 1.68E−04 (5.80E−05 to 2.84E−03) | 5.63 ± 1.56 | 4.19E−03 |
| Bacteroidetes | Bacteroidia | Bacteroidales | Bacteroidaceae | Bacteroides | dorei | 1.22E−03 (1.37E−04 to 1.38E−02) | 7.04E−05 (0.00E+00 to 3.40E−04) | 5.60 ± 1.62 | 5.82E−03 |
| Bacteroidetes | Bacteroidia | Bacteroidales | Prevotellaceae | Prevotella | no data | 2.01E−03 (2.28E−04 to 7.25E−02) | 0.00E+00 (0.00E+00 to 1.08E−04) | 5.35 ± 1.73 | 1.57E−02 |
| Firmicutes | Negativicutes | Selenomonadales | Selenomonadaceae | Megamonas | hypermegale | 4.10E−03 (1.14E−04 to 8.73E−03) | 0.00E+00 (0.00E+00 to 7.09E−05) | 5.32 ± 1.48 | 4.22E−03 |
| Firmicutes | Bacilli | Bacillales | Paenibacillaceae | Brevibacillus | panacihumi | 4.48E−05 (0.00E+00 to 7.34E−04) | 0.00E+00 (0.00E+00 to 0.00E+00) | 5.16 ± 2.02 | 4.77E−02 |
| Actinobacteria | Actinobacteria | Micrococcales | Cellulomonadaceae | Cellulomonas | carbonis | 1.82E−04 (0.00E+00 to 1.47E−03) | 0.00E+00 (0.00E+00 to 2.96E−05) | 5.10 ± 1.75 | 2.34E−02 |
| Firmicutes | Bacilli | Bacillales | Paenibacillaceae | Brevibacillus | thermoruber | 0.00E+00 (0.00E+00 to 1.14E−03) | 0.00E+00 (0.00E+00 to 2.10E−05) | 5.10 ± 1.82 | 2.88E−02 |
| Bacteroidetes | Bacteroidia | Bacteroidales | Prevotellaceae | Prevotella | bryantii | 4.56E−05 (0.00E+00 to 9.71E−04) | 0.00E+00 (0.00E+00 to 0.00E+00) | 5.00 ± 1.98 | 4.99E−02 |
| Bacteroidetes | Bacteroidia | Bacteroidales | Bacteroidaceae | Mediterranea | massiliensis | 6.29E−04 (5.04E−04 to 1.95E−03) | 0.00E+00 (0.00E+00 to 3.52E−05) | 4.98 ± 1.50 | 9.25E−03 |
| Firmicutes | Bacilli | Bacillales | Paenibacillaceae | Brevibacillus | borstelensis | 1.11E−04 (0.00E+00 to 4.04E−03) | 0.00E+00 (0.00E+00 to 7.20E−05) | 4.96 ± 1.74 | 2.66E−02 |
| Firmicutes | Bacilli | Bacillales | Paenibacillaceae | Paenibacillus | ginsengihumi | 1.11E−04 (0.00E+00 to 4.84E−03) | 0.00E+00 (0.00E+00 to 7.47E−05) | 4.84 ± 1.67 | 2.47E−02 |
| Bacteroidetes | Bacteroidia | Bacteroidales | Prevotellaceae | Prevotella | stercorea | 8.42E−04 (9.12E−05 to 6.78E−03) | 0.00E+00 (0.00E+00 to 3.52E−05) | 4.78 ± 1.52 | 1.42E−02 |
| Firmicutes | Negativicutes | Selenomonadales | Selenomonadaceae | Megamonas | rupellensis | 1.22E−01 (7.40E−03 to 1.67E−01) | 2.47E−04 (0.00E+00 to 1.11E−03) | 4.61 ± 1.72 | 3.58E−02 |
| Bacteroidetes | Bacteroidia | Bacteroidales | Tannerellaceae | Tannerella | sp 6 1 58FAA CT1 | 9.12E−05 (0.00E+00 to 5.49E−04) | 0.00E+00 (0.00E+00 to 0.00E+00) | 4.58 ± 1.75 | 3.98E−02 |
| Bacteroidetes | Bacteroidia | Bacteroidales | Prevotellaceae | Paraprevotella | clara | 1.66E−04 (4.21E−05 to 7.94E−04) | 0.00E+00 (0.00E+00 to 0.00E+00) | 4.57 ± 1.45 | 1.42E−02 |
| Bacteroidetes | Bacteroidia | Bacteroidales | Bacteroidaceae | Bacteroides | sp Marseille-P3166 | 1.47E−03 (3.03E−04 to 3.30E−03) | 0.00E+00 (0.00E+00 to 2.45E−05) | 4.42 ± 1.45 | 1.74E−02 |
| Firmicutes | Clostridia | Clostridiales | Lachnospiraceae | Blautia | wexlerae | 1.05E−01 (2.46E−02 to 3.83E+00) | 1.98E−02 (1.25E−02 to 3.64E−02) | 4.35 ± 0.96 | 2.41E−04 |
| Bacteroidetes | Bacteroidia | Bacteroidales | Odoribacteraceae | Odoribacter | laneus | 8.07E−04 (0.00E+00 to 2.87E−03) | 1.40E−05 (0.00E+00 to 4.98E−05) | 4.31 ± 1.43 | 1.87E−02 |
| Proteobacteria | Betaproteobacteria | Burkholderiales | Sutterellaceae | Sutterella | no data | 1.14E−03 (0.00E+00 to 1.26E−03) | 4.21E−05 (9.86E−06 to 1.87E−04) | 4.27 ± 1.57 | 3.52E−02 |
| Bacteroidetes | Bacteroidia | Bacteroidales | Prevotellaceae | Prevotella | multisaccharivorax | 1.26E−04 (0.00E+00 to 2.91E−04) | 0.00E+00 (0.00E+00 to 0.00E+00) | 4.18 ± 1.56 | 3.58E−02 |
| Firmicutes | Bacilli | Lactobacillales | Streptococcaceae | Streptococcus | minor | 1.27E−02 (1.85E−03 to 3.57E−02) | 5.68E−04 (7.98E−05 to 1.16E−03) | 3.94 ± 1.27 | 1.52E−02 |
| Firmicutes | Erysipelotrichia | Erysipelotrichales | Erysipelotrichaceae | Solobacterium | moorei | 2.33E−03 (5.01E−04 to 1.45E−02) | 0.00E+00 (0.00E+00 to 5.80E−05) | 3.85 ± 1.51 | 4.79E−02 |
| Firmicutes | Clostridia | Clostridiales | Clostridiaceae | Clostridium | sp AT4 | 8.65E−02 (6.45E−03 to 1.48E−01) | 4.29E−03 (1.64E−03 to 8.18E−03) | 3.78 ± 1.02 | 3.29E−03 |
| Bacteroidetes | Bacteroidia | Bacteroidales | Bacteroidaceae | Bacteroides | coprocola | 2.32E−02 (7.57E−03 to 1.06E−01) | 5.86E−04 (1.76E−04 to 2.05E−03) | 3.64 ± 1.36 | 3.58E−02 |
| Firmicutes | Clostridia | Clostridiales | Lachnospiraceae | Blautia | no data | 6.00E−01 (1.76E−01 to 8.44E+00) | 1.27E−01 (4.23E−02 to 2.47E−01) | 3.63 ± 0.88 | 9.84E−04 |
| Firmicutes | Clostridia | Clostridiales | Lachnospiraceae | Blautia | obeum | 5.40E−02 (1.96E−02 to 5.43E−01) | 1.08E−02 (3.61E−03 to 2.24E−02) | 3.30 ± 0.97 | 7.18E−03 |
| Bacteroidetes | Bacteroidia | Bacteroidales | Bacteroidaceae | Bacteroides | mediterraneensis | 1.14E−03 (3.03E−04 to 2.57E−03) | 5.38E−05 (9.01E−06 to 1.01E−04) | 2.96 ± 1.08 | 3.41E−02 |
| Firmicutes | Clostridia | Clostridiales | Lachnospiraceae | Marvinbryantia | formatexigens | 3.58E−03 (8.07E−04 to 3.87E−03) | 2.23E−04 (5.25E−05 to 4.42E−04) | 2.78 ± 0.98 | 2.68E−02 |
| Bacteroidetes | Bacteroidia | Bacteroidales | Bacteroidaceae | Bacteroides | barnesiae | 7.33E−04 (2.28E−04 to 1.31E−03) | 2.80E−05 (0.00E+00 to 7.93E−05) | 2.75 ± 1.02 | 3.58E−02 |
| Firmicutes | Clostridia | Clostridiales | Ruminococcaceae | no data | no data | 3.05E−03 (7.17E−04 to 1.23E−02) | 4.25E−04 (7.09E−05 to 1.13E−03) | 2.43 ± 0.86 | 2.75E−02 |
| Lower in HR (97 species) | |||||||||
| Proteobacteria | Gammaproteobacteria | Enterobacterales | Hafniaceae | Hafnia | alvei | 0.00E+00 (0.00E+00 to 0.00E+00) | 1.32E−05 (0.00E+00 to 3.62E−04) | −26.49 ± 2.97 | 9.00E−17 |
| Proteobacteria | Gammaproteobacteria | Enterobacterales | Enterobacteriaceae | Citrobacter | braakii | 0.00E+00 (0.00E+00 to 0.00E+00) | 2.13E−03 (0.00E+00 to 8.85E−03) | −26.22 ± 2.42 | 7.87E−25 |
| Proteobacteria | Gammaproteobacteria | Enterobacterales | Yersiniaceae | Serratia | marcescens | 0.00E+00 (0.00E+00 to 0.00E+00) | 1.51E−04 (6.58E−06 to 4.23E−03) | −25.50 ± 2.22 | 9.94E−28 |
| Proteobacteria | Gammaproteobacteria | Pasteurellales | Pasteurellaceae | Haemophilus | sputorum | 0.00E+00 (0.00E+00 to 0.00E+00) | 2.80E−05 (0.00E+00 to 1.38E−03) | −24.56 ± 2.97 | 1.96E−14 |
| Proteobacteria | Gammaproteobacteria | Enterobacterales | Enterobacteriaceae | Citrobacter | sp MGH99 | 0.00E+00 (0.00E+00 to 0.00E+00) | 0.00E+00 (0.00E+00 to 9.63E−04) | −23.88 ± 2.97 | 1.05E−13 |
| Proteobacteria | Gammaproteobacteria | Enterobacterales | Hafniaceae | Hafnia | no data | 0.00E+00 (0.00E+00 to 0.00E+00) | 0.00E+00 (0.00E+00 to 1.97E−05) | −23.75 ± 2.97 | 1.24E−13 |
| Proteobacteria | Gammaproteobacteria | Enterobacterales | Enterobacteriaceae | Citrobacter | portucalensis | 0.00E+00 (0.00E+00 to 0.00E+00) | 0.00E+00 (0.00E+00 to 1.13E−04) | −23.27 ± 2.97 | 3.96E−13 |
| Proteobacteria | Gammaproteobacteria | Enterobacterales | Enterobacteriaceae | Enterobacter | cloacae complex sp ECNIH7 | 0.00E+00 (0.00E+00 to 0.00E+00) | 0.00E+00 (0.00E+00 to 0.00E+00) | −22.05 ± 2.97 | 8.72E−12 |
| Proteobacteria | Gammaproteobacteria | Enterobacterales | Hafniaceae | Edwardsiella | piscicida | 0.00E+00 (0.00E+00 to 0.00E+00) | 0.00E+00 (0.00E+00 to 1.97E−05) | −21.90 ± 2.97 | 1.14E−11 |
| Proteobacteria | Gammaproteobacteria | Enterobacterales | Enterobacteriaceae | Enterobacter | Cloaca complex sp TREC1 | 0.00E+00 (0.00E+00 to 0.00E+00) | 0.00E+00 (0.00E+00 to 4.54E−04) | −21.17 ± 2.97 | 6.51E−11 |
| Firmicutes | Bacilli | Lactobacillales | Enterococcaceae | Enterococcus | canintestini | 0.00E+00 (0.00E+00 to 0.00E+00) | 9.29E−03 (1.63E−05 to 2.42E−01) | −9.45 ± 2.53 | 3.12E−03 |
| Proteobacteria | Gammaproteobacteria | Enterobacterales | Enterobacteriaceae | Enterobacter | hormaechei | 0.00E+00 (0.00E+00 to 0.00E+00) | 2.04E−04 (0.00E+00 to 3.08E−03) | −9.31 ± 2.14 | 5.01E−04 |
| Firmicutes | Bacilli | Lactobacillales | Enterococcaceae | Enterococcus | dispar | 0.00E+00 (0.00E+00 to 0.00E+00) | 8.72E−04 (2.15E−04 to 6.38E−03) | −9.06 ± 1.73 | 8.87E−06 |
| Firmicutes | Bacilli | Lactobacillales | Enterococcaceae | Enterococcus | thailandicus | 0.00E+00 (0.00E+00 to 0.00E+00) | 2.71E−04 (5.50E−05 to 2.74E−03) | −8.92 ± 1.75 | 1.61E−05 |
| Firmicutes | Bacilli | Lactobacillales | Enterococcaceae | Enterococcus | sp FDAARGOS 163 | 0.00E+00 (0.00E+00 to 0.00E+00) | 1.32E−05 (0.00E+00 to 7.07E−04) | −8.85 ± 2.20 | 1.40E−03 |
| Firmicutes | Bacilli | Bacillales | Planococcaceae | Rummeliibacillus | stabekisii | 0.00E+00 (0.00E+00 to 5.24E−05) | 0.00E+00 (0.00E+00 to 4.72E−04) | −8.73 ± 2.93 | 2.00E−02 |
| Proteobacteria | Gammaproteobacteria | Enterobacterales | Enterobacteriaceae | Enterobacter | asburiae | 0.00E+00 (0.00E+00 to 0.00E+00) | 4.31E−04 (0.00E+00 to 1.06E−03) | −8.61 ± 2.13 | 1.40E−03 |
| Firmicutes | Bacilli | Lactobacillales | Enterococcaceae | Enterococcus | sp 4E1 DIV0656 | 0.00E+00 (0.00E+00 to 0.00E+00) | 1.80E−05 (0.00E+00 to 1.27E−04) | −8.48 ± 2.54 | 8.51E−03 |
| Firmicutes | Bacilli | Lactobacillales | Lactobacillaceae | Lactobacillus | sakei | 0.00E+00 (0.00E+00 to 6.11E−05) | 9.38E−05 (0.00E+00 to 3.41E−03) | −8.45 ± 2.03 | 9.81E−04 |
| Proteobacteria | Gammaproteobacteria | Enterobacterales | Enterobacteriaceae | Enterobacter | cloacae complex Hoffmann cluster III | 0.00E+00 (0.00E+00 to 0.00E+00) | 1.15E−04 (9.01E−06 to 1.22E−03) | −8.30 ± 1.93 | 6.02E−04 |
| Proteobacteria | Gammaproteobacteria | Enterobacterales | Enterobacteriaceae | Cronobacter | sakazakii | 0.00E+00 (0.00E+00 to 0.00E+00) | 1.01E−03 (3.61E−05 to 3.11E−03) | −8.03 ± 2.17 | 3.34E−03 |
| Proteobacteria | Gammaproteobacteria | Pseudomonadales | Moraxellaceae | Acinetobacter | indicus | 0.00E+00 (0.00E+00 to 0.00E+00) | 5.33E−05 (0.00E+00 to 8.20E−04) | −7.91 ± 2.27 | 5.56E−03 |
| Proteobacteria | Gammaproteobacteria | Enterobacterales | Enterobacteriaceae | Enterobacter | sp ODB01 | 0.00E+00 (0.00E+00 to 0.00E+00) | 0.00E+00 (0.00E+00 to 0.00E+00) | −7.82 ± 2.97 | 3.96E−02 |
| Firmicutes | Bacilli | Lactobacillales | Enterococcaceae | Enterococcus | sp HMSC058D07 | 0.00E+00 (0.00E+00 to 0.00E+00) | 6.00E−05 (0.00E+00 to 1.67E−03) | −7.80 ± 2.18 | 4.39E−03 |
| Firmicutes | Bacilli | Bacillales | Staphylococcaceae | Staphylococcus | epidermidis | 0.00E+00 (0.00E+00 to 0.00E+00) | 4.53E−04 (6.70E−05 to 2.18E−03) | −7.76 ± 1.94 | 1.40E−03 |
| Firmicutes | Bacilli | Lactobacillales | Enterococcaceae | Enterococcus | faecalis | 0.00E+00 (0.00E+00 to 2.24E−04) | 7.52E−03 (8.40E−05 to 3.24E−01) | −7.57 ± 2.15 | 5.26E−03 |
| Proteobacteria | Gammaproteobacteria | Enterobacterales | Enterobacteriaceae | Klebsiella | quasipneumoniae | 0.00E+00 (0.00E+00 to 0.00E+00) | 1.05E−04 (3.75E−05 to 9.22E−04) | −7.43 ± 1.99 | 3.12E−03 |
| Proteobacteria | Gammaproteobacteria | Enterobacterales | Enterobacteriaceae | Citrobacter | sp KTE151 | 0.00E+00 (0.00E+00 to 0.00E+00) | 0.00E+00 (0.00E+00 to 3.29E−04) | −7.27 ± 2.70 | 3.58E−02 |
| Proteobacteria | Gammaproteobacteria | Enterobacterales | Enterobacteriaceae | Citrobacter | freundii complex s CFNIH3 | 0.00E+00 (0.00E+00 to 0.00E+00) | 3.29E−05 (0.00E+00 to 6.20E−04) | −7.25 ± 2.48 | 2.32E−02 |
| Firmicutes | Clostridia | Clostridiales | Clostridiaceae | Clostridium | sp CL-2 | 0.00E+00 (0.00E+00 to 1.01E−04) | 2.67E−05 (0.00E+00 to 2.68E−04) | −7.16 ± 2.25 | 1.32E−02 |
| Proteobacteria | Gammaproteobacteria | Enterobacterales | Enterobacteriaceae | Citrobacter | sp S-77 | 0.00E+00 (0.00E+00 to 0.00E+00) | 0.00E+00 (0.00E+00 to 4.98E−04) | −7.14 ± 2.67 | 3.58E−02 |
| Proteobacteria | Gammaproteobacteria | Enterobacterales | Erwiniaceae | Pantoea | sesami | 0.00E+00 (0.00E+00 to 0.00E+00) | 8.43E−05 (0.00E+00 to 1.47E−03) | −7.05 ± 2.64 | 3.58E−02 |
| Proteobacteria | Gammaproteobacteria | Enterobacterales | Enterobacteriaceae | Franconibacter | helveticus | 0.00E+00 (0.00E+00 to 0.00E+00) | 2.50E−04 (9.01E−06 to 4.04E−04) | −6.90 ± 1.99 | 5.78E−03 |
| Proteobacteria | Gammaproteobacteria | Enterobacterales | Enterobacteriaceae | Citrobacter | freundii complex sp CFNIH2 | 0.00E+00 (0.00E+00 to 0.00E+00) | 2.99E−04 (6.31E−05 to 5.02E−04) | −6.88 ± 1.94 | 4.73E−03 |
| Proteobacteria | Gammaproteobacteria | Enterobacterales | Enterobacteriaceae | Citrobacter | werkmanii | 0.00E+00 (0.00E+00 to 0.00E+00) | 5.38E−05 (9.01E−06 to 3.96E−04) | −6.70 ± 1.82 | 3.43E−03 |
| Proteobacteria | Gammaproteobacteria | Enterobacterales | Enterobacteriaceae | Enterobacter | cloacae complex Hoffmann cluster IV | 0.00E+00 (0.00E+00 to 0.00E+00) | 3.91E−04 (4.80E−05 to 8.27E−04) | −6.70 ± 1.83 | 3.56E−03 |
| Firmicutes | Bacilli | Lactobacillales | Lactobacillaceae | Lactobacillus | curvatus | 1.14E−04 (0.00E+00 to 1.79E−04) | 1.64E−04 (0.00E+00 to 3.71E−03) | −6.69 ± 1.71 | 1.80E−03 |
| Proteobacteria | Gammaproteobacteria | Enterobacterales | Enterobacteriaceae | Klebsiella | michiganensis | 0.00E+00 (0.00E+00 to 0.00E+00) | 6.77E−04 (1.45E−04 to 2.32E−03) | −6.60 ± 1.65 | 1.40E−03 |
| Proteobacteria | Gammaproteobacteria | Enterobacterales | Enterobacteriaceae | Pluralibacter | gergoviae | 0.00E+00 (0.00E+00 to 0.00E+00) | 6.58E−05 (8.17E−06 to 5.18E−04) | −6.56 ± 1.75 | 3.12E−03 |
| Proteobacteria | Gammaproteobacteria | Enterobacterales | Enterobacteriaceae | Shigella | no data | 0.00E+00 (0.00E+00 to 0.00E+00) | 1.67E−01 (1.76E−02 to 1.01E+00) | −6.46 ± 2.31 | 2.88E−02 |
| Proteobacteria | Gammaproteobacteria | Enterobacterales | Erwiniaceae | Erwinia | teleogrylli | 0.00E+00 (0.00E+00 to 0.00E+00) | 9.93E−05 (8.17E−06 to 6.65E−04) | −6.45 ± 1.71 | 3.12E−03 |
| Proteobacteria | Gammaproteobacteria | Enterobacterales | Enterobacteriaceae | Escherichia | sp KTE96 | 0.00E+00 (0.00E+00 to 0.00E+00) | 4.75E−04 (9.01E−06 to 3.41E−03) | −6.43 ± 2.21 | 2.43E−02 |
| Proteobacteria | Gammaproteobacteria | Enterobacterales | Enterobacteriaceae | Escherichia | sp KTE11 | 0.00E+00 (0.00E+00 to 0.00E+00) | 1.40E−05 (0.00E+00 to 2.35E−03) | −6.38 ± 2.38 | 3.58E−02 |
| Proteobacteria | Gammaproteobacteria | Enterobacterales | Enterobacteriaceae | Shigella | sonnei | 0.00E+00 (0.00E+00 to 0.00E+00) | 9.59E−02 (9.56E−03 to 2.82E−01) | −6.38 ± 2.21 | 2.52E−02 |
| Firmicutes | Bacilli | Lactobacillales | Enterococcaceae | Enterococcus | sp FDAARGOS 375 | 0.00E+00 (0.00E+00 to 0.00E+00) | 6.27E−05 (0.00E+00 to 4.75E−04) | −6.31 ± 2.28 | 3.09E−02 |
| Proteobacteria | Gammaproteobacteria | Enterobacterales | Enterobacteriaceae | Cronobacter | malonaticus | 0.00E+00 (0.00E+00 to 0.00E+00) | 6.41E−05 (1.05E−05 to 1.06E−03) | −6.27 ± 1.99 | 1.42E−02 |
| Proteobacteria | Betaproteobacteria | Burkholderiales | Alcaligenaceae | Achromobacter | sp ATCC35328 | 0.00E+00 (0.00E+00 to 0.00E+00) | 9.52E−03 (1.18E−03 to 1.99E−02) | −6.16 ± 2.04 | 1.89E−02 |
| Proteobacteria | Gammaproteobacteria | Enterobacterales | Enterobacteriaceae | Klebsiella | oxytoca | 0.00E+00 (0.00E+00 to 0.00E+00) | 7.20E−04 (2.11E−05 to 3.25E−03) | −6.16 ± 1.88 | 1.04E−02 |
| Proteobacteria | Gammaproteobacteria | Enterobacterales | Enterobacteriaceae | Escherichia | sp KTE159 | 0.00E+00 (0.00E+00 to 0.00E+00) | 1.01E−02 (2.82E−04 to 3.19E−02) | −6.16 ± 2.14 | 2.54E−02 |
| Proteobacteria | Gammaproteobacteria | Enterobacterales | Enterobacteriaceae | Citrobacter | no data | 0.00E+00 (0.00E+00 to 0.00E+00) | 6.56E−03 (2.91E−04 to 3.21E−02) | −6.15 ± 2.21 | 3.05E−02 |
| Firmicutes | Bacilli | Lactobacillales | Enterococcaceae | Enterococcus | massiliensis | 0.00E+00 (0.00E+00 to 9.71E−05) | 1.97E−04 (3.94E−05 to 8.56E−04) | −6.06 ± 1.79 | 7.55E−03 |
| Proteobacteria | Gammaproteobacteria | Enterobacterales | Enterobacteriaceae | no data | no data | 2.28E−04 (9.71E−05 to 4.19E−04) | 8.92E+00 (5.93E−01 to 3.02E+01) | −6.05 ± 1.81 | 8.53E−03 |
| Firmicutes | Bacilli | Lactobacillales | Enterococcaceae | Enterococcus | hirae | 8.42E−05 (0.00E+00 to 2.62E−04) | 3.64E−04 (4.34E−05 to 4.62E−03) | −5.98 ± 1.67 | 4.37E−03 |
| Firmicutes | Bacilli | Lactobacillales | Streptococcaceae | Streptococcus | equinus | 4.55E−04 (1.94E−04 to 1.50E−03) | 1.76E−03 (1.06E−04 to 8.90E−01) | −5.94 ± 1.93 | 1.61E−02 |
| Firmicutes | Bacilli | Lactobacillales | Enterococcaceae | Enterococcus | raffinosus | 0.00E+00 (0.00E+00 to 0.00E+00) | 8.85E−05 (0.00E+00 to 6.18E−04) | −5.90 ± 2.19 | 3.58E−02 |
| Proteobacteria | Gammaproteobacteria | Enterobacterales | Enterobacteriaceae | Escherichia | sp KTE52 | 0.00E+00 (0.00E+00 to 0.00E+00) | 2.20E−03 (1.54E−04 to 1.79E−02) | −5.90 ± 1.97 | 1.94E−02 |
| Actinobacteria | Actinobacteria | Propionibacteriales | Propionibacteriaceae | Propionibacterium | freudenreichii | 1.11E−04 (0.00E+00 to 2.02E−04) | 6.80E−05 (1.05E−05 to 2.17E−03) | −5.89 ± 1.84 | 1.29E−02 |
| Firmicutes | Bacilli | Bacillales | Paenibacillaceae | Paenibacillus | sp VT-16-81 | 0.00E+00 (0.00E+00 to 0.00E+00) | 3.73E−05 (0.00E+00 to 1.08E−04) | −5.87 ± 2.04 | 2.54E−02 |
| Proteobacteria | Gammaproteobacteria | Enterobacterales | Enterobacteriaceae | Shigella | boydii | 0.00E+00 (0.00E+00 to 0.00E+00) | 8.74E−02 (7.11E−03 to 2.18E−01) | −5.87 ± 2.18 | 3.58E−02 |
| Firmicutes | Bacilli | Lactobacillales | Carnobacteriaceae | Carnobacterium | gallinarum | 0.00E+00 (0.00E+00 to 0.00E+00) | 3.77E−05 (0.00E+00 to 7.99E−04) | −5.85 ± 2.17 | 3.58E−02 |
| Firmicutes | Bacilli | Lactobacillales | Streptococcaceae | Streptococcus | lutetiensis | 8.42E−05 (0.00E+00 to 4.62E−03) | 1.49E−04 (6.23E−05 to 3.44E+00) | −5.85 ± 2.30 | 4.89E−02 |
| Firmicutes | Bacilli | Lactobacillales | Enterococcaceae | Enterococcus | sp HMSC34G12 | 0.00E+00 (0.00E+00 to 0.00E+00) | 7.47E−05 (0.00E+00 to 2.38E−04) | −5.83 ± 2.08 | 2.88E−02 |
| Firmicutes | Bacilli | Lactobacillales | Streptococcaceae | Streptococcus | no data | 3.68E−02 (8.00E−03 to 5.84E−01) | 1.91E−01 (1.39E−02 to 2.36E+01) | −5.81 ± 1.55 | 3.12E−03 |
| Fusobacteria | Fusobacteria | Fusobacteriales | Leptotrichiaceae | Streptobacillus | moniliformis | 0.00E+00 (0.00E+00 to 0.00E+00) | 3.73E−03 (6.84E−04 to 1.09E−02) | −5.78 ± 1.92 | 1.91E−02 |
| Proteobacteria | Gammaproteobacteria | Enterobacterales | Enterobacteriaceae | Escherichia | sp 1 1 43 | 0.00E+00 (0.00E+00 to 0.00E+00) | 8.41E−03 (8.32E−04 to 9.78E−03) | −5.68 ± 1.83 | 1.52E−02 |
| Firmicutes | Bacilli | Lactobacillales | Streptococcaceae | Streptococcus | infantarius | 8.55E−04 (0.00E+00 to 1.39E−03) | 6.33E−04 (1.34E−04 to 8.77E−01) | −5.65 ± 2.00 | 2.75E−02 |
| Firmicutes | Bacilli | Lactobacillales | Enterococcaceae | Enterococcus | canis | 0.00E+00 (0.00E+00 to 0.00E+00) | 3.32E−04 (9.01E−06 to 1.50E−03) | −5.59 ± 2.16 | 4.44E−02 |
| Firmicutes | Bacilli | Lactobacillales | Enterococcaceae | Enterococcus | sp HMSC035C10 | 0.00E+00 (0.00E+00 to 9.12E−05) | 5.28E−04 (4.21E−05 to 9.66E−04) | −5.59 ± 1.77 | 1.42E−02 |
| Firmicutes | Bacilli | Lactobacillales | Enterococcaceae | Enterococcus | villorum | 0.00E+00 (0.00E+00 to 8.42E−05) | 2.35E−05 (0.00E+00 to 1.47E−04) | −5.56 ± 2.06 | 3.58E−02 |
| Firmicutes | Bacilli | Lactobacillales | Enterococcaceae | Enterococcus | sp 255 ESPC | 0.00E+00 (0.00E+00 to 0.00E+00) | 1.52E−04 (9.01E−06 to 4.48E−03) | −5.54 ± 1.92 | 2.47E−02 |
| Proteobacteria | Gammaproteobacteria | Enterobacterales | Enterobacteriaceae | Lelliottia | amnigena | 0.00E+00 (0.00E+00 to 0.00E+00) | 9.27E−05 (1.89E−05 to 3.69E−04) | −5.53 ± 1.84 | 1.91E−02 |
| Firmicutes | Bacilli | Lactobacillales | Streptococcaceae | Streptococcus | anginosus | 0.00E+00 (0.00E+00 to 8.42E−05) | 7.61E−04 (1.17E−05 to 3.15E−03) | −5.46 ± 1.77 | 1.58E−02 |
| Proteobacteria | Gammaproteobacteria | Enterobacterales | Erwiniaceae | Erwinia | gerundensis | 0.00E+00 (0.00E+00 to 0.00E+00) | 9.82E−05 (0.00E+00 to 1.26E−04) | −5.45 ± 1.82 | 1.92E−02 |
| Proteobacteria | Gammaproteobacteria | Enterobacterales | Enterobacteriaceae | Enterobacter | no data | 0.00E+00 (0.00E+00 to 0.00E+00) | 3.09E−03 (3.87E−04 to 1.20E−02) | −5.39 ± 2.00 | 3.58E−02 |
| Firmicutes | Bacilli | Lactobacillales | Enterococcaceae | Enterococcus | sp HMSC072F02 | 0.00E+00 (0.00E+00 to 5.05E−04) | 5.25E−04 (8.41E−05 to 6.68E−03) | −5.29 ± 1.68 | 1.42E−02 |
| Proteobacteria | Gammaproteobacteria | Enterobacterales | Enterobacteriaceae | no data | bacterium ENNIH1 | 0.00E+00 (0.00E+00 to 0.00E+00) | 5.49E−05 (0.00E+00 to 1.18E−04) | −5.28 ± 1.85 | 2.60E−02 |
| Proteobacteria | Gammaproteobacteria | Enterobacterales | Enterobacteriaceae | Raoultella | planticola | 0.00E+00 (0.00E+00 to 0.00E+00) | 1.89E−05 (0.00E+00 to 1.16E−04) | −5.17 ± 2.03 | 4.79E−02 |
| Firmicutes | Bacilli | Lactobacillales | Enterococcaceae | Enterococcus | gallinarum | 0.00E+00 (0.00E+00 to 5.55E−05) | 2.51E−03 (1.32E−03 to 1.13E−02) | −5.12 ± 1.57 | 1.04E−02 |
| Proteobacteria | Gammaproteobacteria | Enterobacterales | Yersiniaceae | Yersinia | no data | 0.00E+00 (0.00E+00 to 0.00E+00) | 1.41E−04 (9.01E−06 to 2.87E−04) | −5.08 ± 1.86 | 3.41E−02 |
| Proteobacteria | Gammaproteobacteria | Enterobacterales | Enterobacteriaceae | Raoultella | ornithinolytica | 0.00E+00 (0.00E+00 to 0.00E+00) | 9.13E−05 (9.44E−06 to 7.79E−04) | −5.06 ± 1.90 | 3.62E−02 |
| Proteobacteria | Gammaproteobacteria | Enterobacterales | Enterobacteriaceae | Escherichia | no data | 6.11E−05 (0.00E+00 to 2.10E−04) | 1.21E+00 (5.58E−01 to 7.20E+00) | −5.02 ± 1.99 | 4.99E−02 |
| Proteobacteria | Gammaproteobacteria | Enterobacterales | Enterobacteriaceae | Citrobacter | sp MGH 55 | 0.00E+00 (0.00E+00 to 0.00E+00) | 5.88E−05 (9.01E−06 to 2.40E−04) | −5.00 ± 1.77 | 2.75E−02 |
| Actinobacteria | Actinobacteria | Corynebacteriales | Nocardiaceae | Rhodococcus | no data | 5.55E−05 (0.00E+00 to 3.14E−04) | 2.03E−04 (0.00E+00 to 7.70E−04) | −4.89 ± 1.50 | 1.04E−02 |
| Firmicutes | Bacilli | Lactobacillales | Streptococcaceae | Streptococcus | thermophilus | 1.82E−04 (6.11E−05 to 6.81E−04) | 1.08E−02 (5.86E−04 to 2.09E−02) | −4.67 ± 1.35 | 6.07E−03 |
| Firmicutes | Bacilli | Lactobacillales | Streptococcaceae | Streptococcus | macedonicus | 1.01E−04 (0.00E+00 to 1.48E−02) | 2.99E−03 (4.25E−04 to 6.15E−02) | −4.62 ± 1.70 | 3.52E−02 |
| Firmicutes | Bacilli | Lactobacillales | Streptococcaceae | Streptococcus | pasteurianus | 8.73E−04 (5.69E−04 to 3.33E−03) | 6.32E−03 (4.42E−04 to 4.98E−02) | −4.60 ± 1.17 | 1.80E−03 |
| Firmicutes | Bacilli | Lactobacillales | Streptococcaceae | Streptococcus | suis | 3.88E−04 (3.19E−04 to 9.27E−04) | 8.34E−04 (2.27E−04 to 3.00E−03) | −4.10 ± 1.03 | 1.40E−03 |
| Firmicutes | Bacilli | Lactobacillales | Enterococcaceae | Enterococcus | durans | 1.26E−04 (0.00E+00 to 3.19E−04) | 7.94E−04 (4.20E−05 to 2.29E−03) | −4.04 ± 1.53 | 3.96E−02 |
| Firmicutes | Bacilli | Lactobacillales | Lactobacillaceae | Lactobacillus | no data | 5.92E−04 (2.53E−04 to 1.92E−03) | 3.83E−03 (1.86E−03 to 1.66E−02) | −4.00 ± 1.07 | 3.12E−03 |
| Firmicutes | Bacilli | Lactobacillales | Streptococcaceae | Lactococcus | lactis | 1.26E−03 (8.88E−04 to 3.54E−03) | 2.40E−02 (3.15E−03 to 2.71E−02) | −3.96 ± 0.95 | 9.52E−04 |
| Firmicutes | Clostridia | Clostridiales | Clostridiales | Emergencia | timonensis | 3.05E−04 (1.37E−04 to 7.34E−04) | 4.46E−04 (2.25E−04 to 1.29E−03) | −3.84 ± 1.16 | 9.41E−03 |
| Actinobacteria | Actinobacteria | Bifidobacteriales | Bifidobacteriaceae | Bifidobacterium | breve | 3.05E−03 (1.65E−03 to 3.41E−03) | 1.63E−03 (6.32E−04 to 4.35E−03) | −3.79 ± 0.99 | 2.64E−03 |
| Firmicutes | Bacilli | no data | no data | no data | no data | 8.66E−04 (1.34E−04 to 4.72E−03) | 4.48E−03 (1.65E−03 to 3.28E−02) | −3.73 ± 1.28 | 2.34E−02 |
| Proteobacteria | Gammaproteobacteria | no data | no data | no data | no data | 5.24E−05 (4.21E−05 to 1.14E−04) | 1.39E−02 (3.37E−03 to 3.15E−02) | −3.73 ± 1.29 | 2.47E−02 |
| Actinobacteria | Actinobacteria | Micrococcales | Microbacteriaceae | Microbacterium | no data | 5.55E−05 (0.00E+00 to 2.91E−04) | 9.61E−05 (3.85E−05 to 3.39E−04) | −2.94 ± 1.14 | 4.61E−02 |
| Firmicutes | Clostridia | Clostridiales | Lachnospiraceae | no data | bacterium 3 1 46FAA | 1.14E−02 (2.69E−03 to 2.41E−02) | 1.05E−02 (1.24E−03 to 6.32E−02) | −2.78 ± 0.99 | 2.75E−02 |
| Firmicutes | Bacilli | Lactobacillales | Streptococcaceae | Streptococcus | parasanguinis | 7.76E−04 (6.72E−04 to 1.21E−03) | 8.33E−04 (3.19E−04 to 1.59E−03) | −2.19 ± 0.71 | 1.58E−02 |
Notes:
FC, fold change; SE, standard error.
Bacteroidales and Clostridiales dominated the gut of high-responders
Among 40 bacterial species whose abundance were higher in HR, 20 (50%) belonged to the Bacteroidales order (Table 6, Fig. S8A). They included 9 Bacteroides species and 7 Prevotella species. Seven species (18%) of the Clostridiales order and 5 Megamonas species (13%) were also observed to dominate the gut of the HR at baseline.
Enterobacterales and Lactobacillales dominated the gut of low-responders
On the other hand, 97 species had lower abundances in the guts of HR as compared to LR dogs (Table 6, Fig. S8A). Forty seven of these species (48%) were in the Enterobacterales order. Species in the Lactobacillales order were also underrepresented in the guts of HR and accounted for 35% of the 97 species. It is worth noting that the abundances of many Enterobacterales and Lactobacillales species increased as a result of diet change when all subjects were included in the analysis (Table 4).
Given the enrichment of Enterobacterales and Lactobacillales in LR as compared to HR, correlative analysis was performed in all dogs. The read counts and the relative abundances of total Enterobacteriales were negatively correlated with the magnitude of PCo1 change (read count: Spearman’s ρ = −0.74, p = 6.66E−06, relative abundance: Spearman’s ρ = −0.69, p = 6.77E−05). Significant correlation was not observed with total Lactobacillales.
Changes in the gut microbiome abundance from baseline to week 4 in high- and low-responders
Not only was the GM of HR and LR different at baseline, HR and LR also responded differently to the diet transition (Table S4, Figs. 7A and 7B).
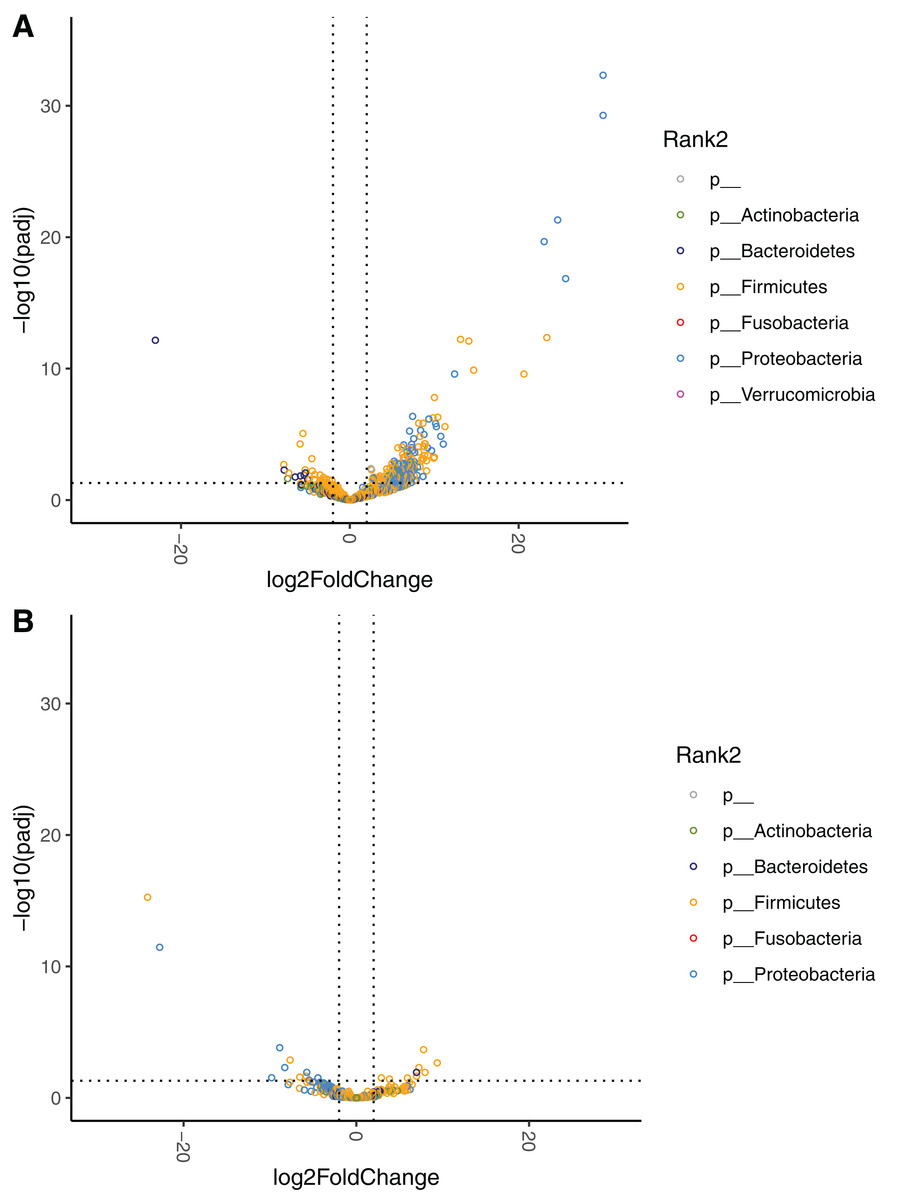
Figure 7: Volcano plots demonstrating fold-change (FC) of species abundance between week 4 and baseline in (A) high-responders (n = 9) and (B) low-responders (n = 10).
Vertical dashed lines show log2FC at 1 and −1 (i.e. FC at 2 and −2). Horizontal dashed line shows adjusted p = 0.05. Adjustment of p values is performed with false discovery rate. Points are colored by phylum.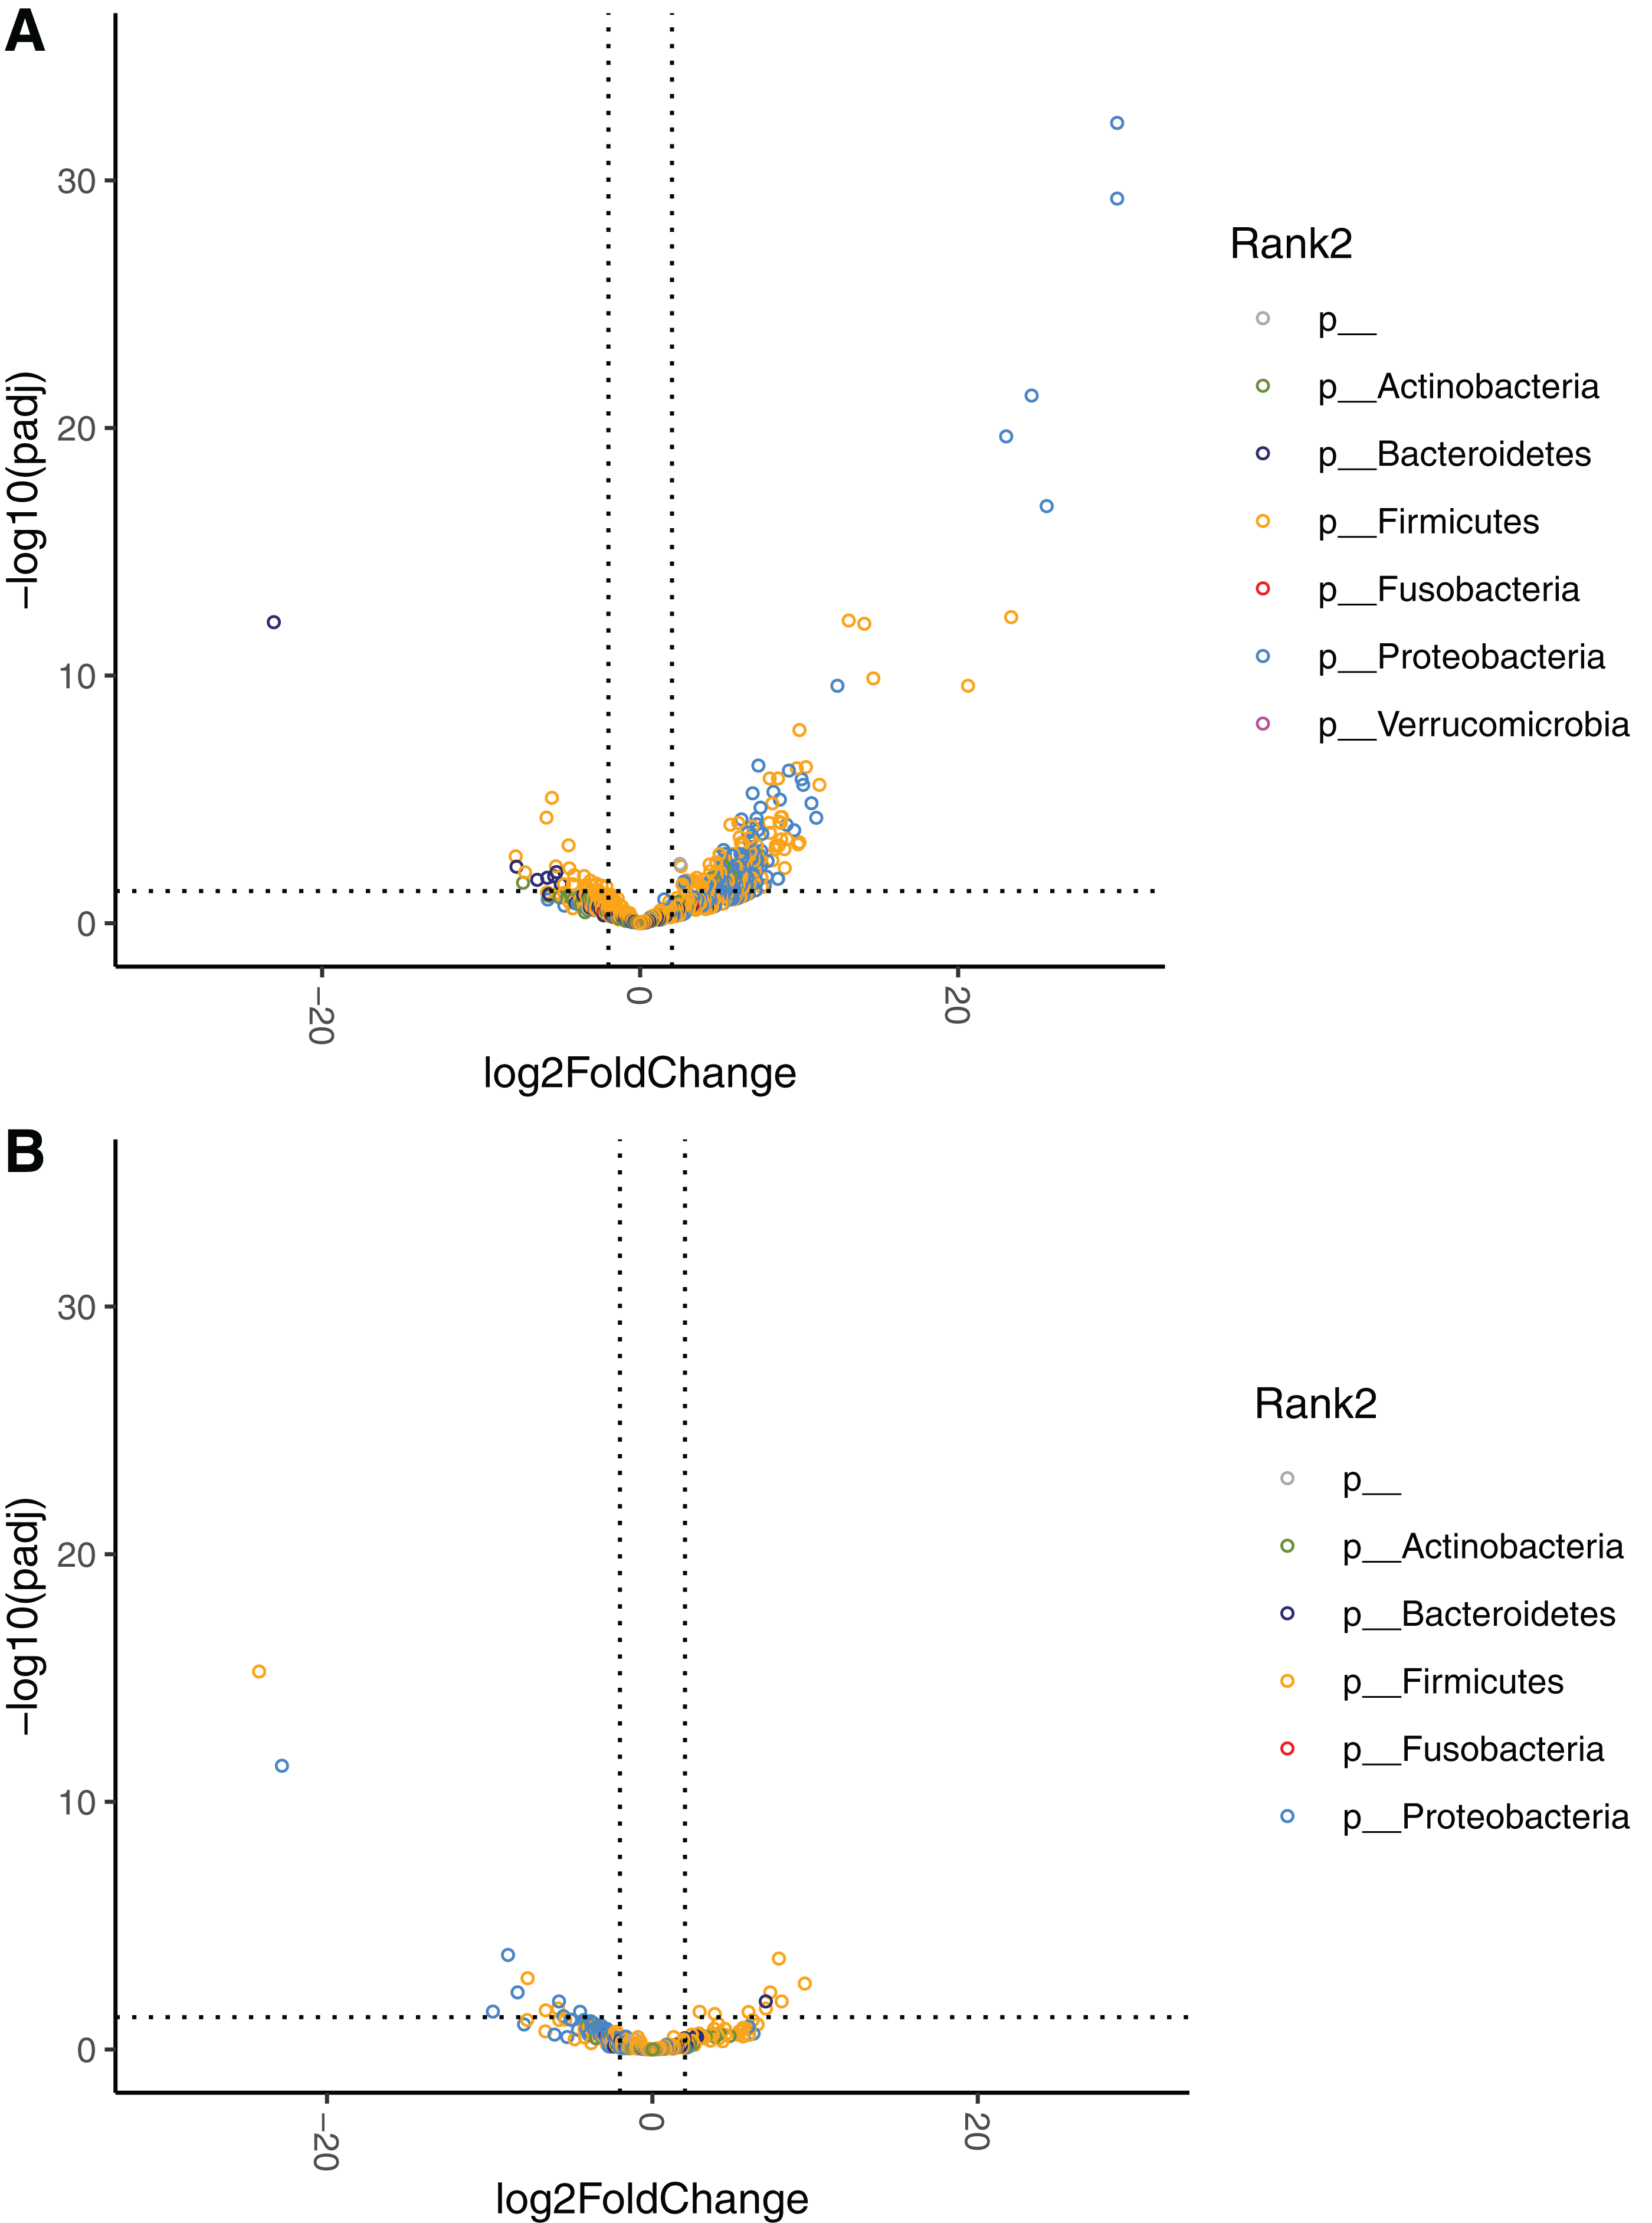
Enterobacterales and Lactobacillales increased predominantly in high-responders
Over the 4 week period in HR the abundances of 97 species of Enterobacterales increased and none decreased (Table S4 and Fig. 7A). Whereas in LR no increase in abundance of any Enterobacterales species was observed, but rather seven Enterobacterales species were reduced (Fig. 7B). Similarly, the abundances of 77 species in the Lactobacillales order significantly increased and none decreased at week 4 in HR, whereas only five species of Lactobacillales increased and one decreased in LR.
Clostridiales and Bacteroidales had distinctive responses in high- vs. low-responders
A distinctive pattern of change in the Clostridiales and Bacteroidales orders was also noted between HR and LR. In HR, the abundances of 17 species of Clostridiales were reduced whereas there were increased abundances of five species (three of which were members of the genus Clostridium) (Table S4 and Fig. 7A). In LR the abundances of only three species of Clostridiales increased and one species decreased (Fig. 7B). Additionally, the abundance of any Bacteroidales did not significantly change in LR, while seven species of Bacteroidales (six of which were in the genus Prevotella) were reduced in HR.
Gut microbiome relative abundance at week 4 in high- and low-responders
Consistent with a distinctive GM profile at baseline and differential changes between HR and LR, the microbial profiles of HR and LR at week 4 also differed (Table 7, Fig. 6B). A summary of overall GM profile and changes in the abundance of Bacteroidales, Clostridiales, Lactobacillales, and Proteobacteria is also provided in Table 8.
| Phylum | Class | Order | Family | Genus | Species | Relative abundance, in % Median (IQR) |
Week 4 HR vs LR | ||
|---|---|---|---|---|---|---|---|---|---|
| HR (n = 9) |
LR (n = 10) |
Log 2 FC mean ± SE |
Adjusted P−value1 | ||||||
| Higher in HR (68 species) | |||||||||
| Proteobacteria | Gammaproteobacteria | Enterobacterales | Hafniaceae | Hafnia | alvei | 1.88E−03 (1.47E−03 to 1.06E+00) | 4.81E−05 (0.00E+00 to 6.65E−05) | 10.37 ± 2.02 | 1.56E−04 |
| Proteobacteria | Gammaproteobacteria | Enterobacterales | Hafniaceae | Hafnia | no data | 3.57E−04 (1.66E−04 to 1.54E−01) | 0.00E+00 (0.00E+00 to 3.58E−05) | 10.30 ± 2.26 | 7.33E−04 |
| Proteobacteria | Gammaproteobacteria | Enterobacterales | Morganellaceae | Morganella | sp HMSC11D09 | 0.00E+00 (0.00E+00 to 4.86E−03) | 0.00E+00 (0.00E+00 to 0.00E+00) | 9.07 ± 2.50 | 8.16E−03 |
| Proteobacteria | Gammaproteobacteria | Enterobacterales | Hafniaceae | Hafnia | sp HMSC23F03 | 3.96E−03 (2.77E−05 to 2.24E−02) | 0.00E+00 (0.00E+00 to 1.06E−04) | 7.84 ± 2.12 | 7.29E−03 |
| Firmicutes | Bacilli | Bacillales | Listeriaceae | Listeria | monocytogenes | 3.24E−05 (0.00E+00 to 2.65E−04) | 0.00E+00 (0.00E+00 to 5.61E−05) | 7.67 ± 2.27 | 1.43E−02 |
| Firmicutes | Erysipelotrichia | Erysipelotrichales | Erysipelotrichaceae | Solobacterium | moorei | 0.00E+00 (0.00E+00 to 1.95E−04) | 0.00E+00 (0.00E+00 to 0.00E+00) | 7.64 ± 2.77 | 4.71E−02 |
| Proteobacteria | Gammaproteobacteria | Enterobacterales | Enterobacteriaceae | Enterobacter | sp MGH 7 | 0.00E+00 (0.00E+00 to 5.95E−04) | 0.00E+00 (0.00E+00 to 0.00E+00) | 7.46 ± 2.68 | 4.51E−02 |
| Proteobacteria | Gammaproteobacteria | Enterobacterales | Enterobacteriaceae | Klebsiella | sp AA405 | 0.00E+00 (0.00E+00 to 1.33E−04) | 0.00E+00 (0.00E+00 to 0.00E+00) | 7.36 ± 2.59 | 4.18E−02 |
| Proteobacteria | Gammaproteobacteria | Enterobacterales | Enterobacteriaceae | Cronobacter | dublinensis | 1.94E−04 (1.47E−04 to 9.28E−04) | 0.00E+00 (0.00E+00 to 0.00E+00) | 7.28 ± 1.56 | 5.73E−04 |
| Proteobacteria | Gammaproteobacteria | Pseudomonadales | Pseudomonadaceae | Pseudomonas | sp Ep R1 | 0.00E+00 (0.00E+00 to 6.63E−04) | 0.00E+00 (0.00E+00 to 0.00E+00) | 7.22 ± 2.61 | 4.71E−02 |
| Firmicutes | Bacilli | Bacillales | Paenibacillaceae | Paenibacillus | sp VT-16-81 | 1.19E−04 (0.00E+00 to 3.01E−03) | 0.00E+00 (0.00E+00 to 4.34E−05) | 7.11 ± 1.97 | 8.34E−03 |
| Proteobacteria | Gammaproteobacteria | Enterobacterales | Hafniaceae | Edwardsiella | hoshinae | 2.08E−05 (0.00E+00 to 5.27E−04) | 0.00E+00 (0.00E+00 to 0.00E+00) | 6.91 ± 2.13 | 2.12E−02 |
| Firmicutes | Clostridia | Clostridiales | Clostridiaceae | Clostridium | sp CL-2 | 3.97E−04 (5.54E−05 to 1.66E−03) | 0.00E+00 (0.00E+00 to 0.00E+00) | 6.70 ± 1.56 | 1.70E−03 |
| Firmicutes | Clostridia | Clostridiales | Clostridiaceae | Clostridium | tertium | 6.77E−05 (0.00E+00 to 7.83E−04) | 0.00E+00 (0.00E+00 to 0.00E+00) | 6.65 ± 2.01 | 1.83E−02 |
| Firmicutes | Bacilli | Lactobacillales | Enterococcaceae | Enterococcus | sp HMSC072H05 | 2.65E−04 (0.00E+00 to 7.83E−04) | 0.00E+00 (0.00E+00 to 0.00E+00) | 6.59 ± 1.84 | 9.15E−03 |
| Firmicutes | Clostridia | Clostridiales | Ruminococcaceae | Ruminiclostridium | josui | 0.00E+00 (0.00E+00 to 1.81E−03) | 0.00E+00 (0.00E+00 to 0.00E+00) | 6.37 ± 2.37 | 4.97E−02 |
| Proteobacteria | Gammaproteobacteria | Enterobacterales | Enterobacteriaceae | Klebsiella | no data | 1.06E−02 (7.68E−03 to 1.80E−01) | 1.36E−03 (3.94E−04 to 6.31E−03) | 6.14 ± 1.39 | 1.08E−03 |
| Firmicutes | Bacilli | Lactobacillales | Carnobacteriaceae | Carnobacterium | maltaromaticum | 1.08E−03 (2.66E−05 to 3.65E−03) | 1.31E−04 (5.01E−05 to 4.23E−04) | 6.06 ± 1.54 | 4.09E−03 |
| Firmicutes | Bacilli | Lactobacillales | Enterococcaceae | Enterococcus | avium | 1.77E−04 (0.00E+00 to 2.88E−02) | 0.00E+00 (0.00E+00 to 4.11E−04) | 5.99 ± 2.00 | 3.24E−02 |
| Proteobacteria | Gammaproteobacteria | Enterobacterales | Enterobacteriaceae | Escherichia | sp KTE11 | 2.54E−03 (1.06E−03 to 6.28E−03) | 0.00E+00 (0.00E+00 to 6.79E−05) | 5.94 ± 1.50 | 4.09E−03 |
| Proteobacteria | Gammaproteobacteria | Enterobacterales | Erwiniaceae | Pantoea | ananatis | 4.52E−04 (2.28E−04 to 6.10E−04) | 0.00E+00 (0.00E+00 to 0.00E+00) | 5.91 ± 1.56 | 6.66E−03 |
| Firmicutes | Clostridia | Clostridiales | Clostridiaceae | Clostridium | sp 7 2 43FAA | 1.62E−04 (0.00E+00 to 7.34E−04) | 0.00E+00 (0.00E+00 to 3.58E−05) | 5.88 ± 1.87 | 2.46E−02 |
| Firmicutes | Bacilli | Lactobacillales | Streptococcaceae | Streptococcus | minor | 3.48E−03 (5.75E−04 to 6.97E−03) | 9.53E−04 (1.21E−04 to 3.04E−03) | 5.77 ± 1.43 | 3.54E−03 |
| Proteobacteria | Gammaproteobacteria | Enterobacterales | Enterobacteriaceae | Klebsiella | sp MS 92-3 | 3.97E−05 (0.00E+00 to 2.21E−04) | 0.00E+00 (0.00E+00 to 0.00E+00) | 5.72 ± 2.03 | 4.28E−02 |
| Firmicutes | Clostridia | Clostridiales | Clostridiaceae | Clostridium | no data | 6.10E−03 (5.07E−03 to 1.04E−02) | 1.36E−03 (3.72E−04 to 3.53E−03) | 5.64 ± 1.16 | 3.04E−04 |
| Firmicutes | Clostridia | Clostridiales | Peptostreptococcaceae | Terrisporobacter | glycolicus | 1.22E−03 (0.00E+00 to 3.90E−03) | 0.00E+00 (0.00E+00 to 4.39E−05) | 5.57 ± 1.90 | 3.59E−02 |
| Firmicutes | Erysipelotrichia | Erysipelotrichales | Erysipelotrichaceae | Erysipelatoclostridium | ramosum | 4.70E−03 (1.30E−04 to 2.69E−02) | 8.23E−05 (1.32E−05 to 1.54E−03) | 5.57 ± 1.62 | 1.27E−02 |
| Firmicutes | Clostridia | Clostridiales | Clostridiaceae | Clostridium | sartagoforme | 9.73E−05 (0.00E+00 to 9.12E−04) | 0.00E+00 (0.00E+00 to 2.42E−05) | 5.44 ± 1.75 | 2.66E−02 |
| Proteobacteria | Gammaproteobacteria | Enterobacterales | Enterobacteriaceae | Raoultella | no data | 2.66E−05 (0.00E+00 to 3.72E−04) | 0.00E+00 (0.00E+00 to 5.18E−05) | 5.35 ± 1.77 | 3.10E−02 |
| Firmicutes | Clostridia | Clostridiales | Clostridiaceae | Clostridium | celatum | 2.41E−04 (1.45E−04 to 4.40E−04) | 0.00E+00 (0.00E+00 to 0.00E+00) | 5.22 ± 1.63 | 2.16E−02 |
| Firmicutes | Clostridia | Clostridiales | Clostridiaceae | Clostridium | paraputrificum | 7.33E−03 (1.55E−03 to 3.41E−02) | 2.06E−03 (5.15E−04 to 9.22E−03) | 5.01 ± 1.20 | 2.54E−03 |
| Firmicutes | Erysipelotrichia | Erysipelotrichales | Erysipelotrichaceae | Coprobacillus | sp 3 3 56FAA | 3.47E−03 (1.95E−04 to 4.56E−02) | 1.39E−03 (2.32E−04 to 4.99E−03) | 4.92 ± 1.34 | 7.51E−03 |
| Firmicutes | Bacilli | Lactobacillales | Leuconostocaceae | Leuconostoc | mesenteroides | 2.21E−03 (2.70E−04 to 1.31E−01) | 2.38E−04 (4.92E−05 to 1.15E−02) | 4.92 ± 1.75 | 4.28E−02 |
| Firmicutes | Erysipelotrichia | Erysipelotrichales | Erysipelotrichaceae | Coprobacillus | no data | 1.54E−02 (1.10E−03 to 4.62E−02) | 5.15E−04 (1.98E−05 to 7.03E−03) | 4.91 ± 1.60 | 2.85E−02 |
| Proteobacteria | Gammaproteobacteria | Enterobacterales | Enterobacteriaceae | Klebsiella | quasipneumoniae | 3.91E−04 (3.45E−04 to 4.74E−03) | 9.33E−05 (0.00E+00 to 2.56E−04) | 4.83 ± 1.65 | 3.59E−02 |
| Proteobacteria | Gammaproteobacteria | Enterobacterales | Erwiniaceae | Erwinia | gerundensis | 1.77E−04 (1.11E−04 to 2.71E−04) | 0.00E+00 (0.00E+00 to 4.76E−05) | 4.83 ± 1.25 | 5.40E−03 |
| Firmicutes | Erysipelotrichia | Erysipelotrichales | Erysipelotrichaceae | Turicibacter | sanguinis | 8.27E−04 (5.54E−05 to 1.52E−03) | 2.39E−05 (0.00E+00 to 2.95E−04) | 4.76 ± 1.63 | 3.59E−02 |
| Firmicutes | Erysipelotrichia | Erysipelotrichales | Erysipelotrichaceae | no data | no data | 3.08E−01 (1.35E−02 to 2.33E+00) | 1.07E−01 (1.37E−02 to 1.31E−01) | 4.73 ± 1.28 | 7.46E−03 |
| Proteobacteria | Gammaproteobacteria | Enterobacterales | Enterobacteriaceae | Raoultella | ornithinolytica | 1.86E−04 (4.89E−05 to 3.96E−03) | 3.45E−05 (0.00E+00 to 1.38E−04) | 4.68 ± 1.67 | 4.40E−02 |
| Proteobacteria | Gammaproteobacteria | Enterobacterales | Enterobacteriaceae | Citrobacter | no data | 9.48E−03 (8.22E−03 to 7.28E−02) | 1.61E−03 (2.52E−04 to 8.19E−03) | 4.61 ± 1.41 | 2.02E−02 |
| Proteobacteria | Gammaproteobacteria | Enterobacterales | Enterobacteriaceae | Escherichia | sp KTE172 | 1.67E−02 (9.42E−03 to 1.64E−01) | 4.98E−03 (8.28E−04 to 1.45E−02) | 4.57 ± 1.29 | 9.85E−03 |
| Proteobacteria | Gammaproteobacteria | Enterobacterales | Enterobacteriaceae | Escherichia | sp 1 1 43 | 1.57E−02 (5.90E−03 to 2.83E−02) | 1.07E−03 (3.16E−04 to 5.30E−03) | 4.54 ± 1.15 | 4.09E−03 |
| Firmicutes | Erysipelotrichia | Erysipelotrichales | Erysipelotrichaceae | Turicibacter | no data | 1.03E−03 (3.09E−04 to 2.31E−03) | 2.11E−04 (0.00E+00 to 1.64E−03) | 4.32 ± 1.54 | 4.35E−02 |
| Proteobacteria | Gammaproteobacteria | Enterobacterales | Enterobacteriaceae | Shigella | no data | 9.74E−01 (2.15E−01 to 1.97E+00) | 4.37E−02 (1.42E−02 to 1.51E−01) | 4.29 ± 1.15 | 7.29E−03 |
| Proteobacteria | Gammaproteobacteria | Enterobacterales | Enterobacteriaceae | Klebsiella | pneumoniae | 2.68E−03 (9.12E−04 to 1.63E−02) | 5.40E−04 (8.12E−05 to 1.14E−03) | 4.09 ± 1.36 | 3.19E−02 |
| Proteobacteria | Gammaproteobacteria | Pseudomonadales | Moraxellaceae | Acinetobacter | indicus | 1.14E−03 (1.33E−04 to 1.81E−03) | 0.00E+00 (0.00E+00 to 1.26E−04) | 3.99 ± 1.48 | 4.97E−02 |
| Proteobacteria | Gammaproteobacteria | Enterobacterales | Enterobacteriaceae | Escherichia | sp KTE96 | 1.83E−03 (4.83E−04 to 3.30E−03) | 9.68E−05 (0.00E+00 to 7.69E−04) | 3.98 ± 1.45 | 4.76E−02 |
| Proteobacteria | Gammaproteobacteria | Enterobacterales | Enterobacteriaceae | Citrobacter | freundii complex sp CFNIH2 | 2.13E−04 (1.66E−04 to 7.21E−04) | 4.00E−05 (0.00E+00 to 9.02E−05) | 3.94 ± 1.45 | 4.81E−02 |
| Proteobacteria | Gammaproteobacteria | Enterobacterales | Enterobacteriaceae | Enterobacter | cloacae | 1.49E−03 (3.42E−04 to 1.95E−03) | 1.08E−04 (0.00E+00 to 3.00E−04) | 3.92 ± 1.23 | 2.26E−02 |
| Proteobacteria | Gammaproteobacteria | Enterobacterales | Enterobacteriaceae | Shigella | flexneri | 3.42E−01 (2.39E−01 to 7.99E−01) | 4.10E−02 (7.24E−03 to 1.49E−01) | 3.90 ± 1.14 | 1.30E−02 |
| Proteobacteria | Gammaproteobacteria | Enterobacterales | Enterobacteriaceae | Siccibacter | turicensis | 1.96E−04 (1.33E−04 to 2.08E−04) | 4.84E−05 (0.00E+00 to 1.21E−04) | 3.89 ± 1.12 | 1.21E−02 |
| Proteobacteria | Gammaproteobacteria | Enterobacterales | Enterobacteriaceae | no data | bacterium strain FGI 57 | 3.05E−03 (9.31E−04 to 8.49E−03) | 7.14E−04 (1.58E−04 to 1.31E−03) | 3.86 ± 1.20 | 2.15E−02 |
| Proteobacteria | Gammaproteobacteria | Enterobacterales | Enterobacteriaceae | Citrobacter | freundii | 5.34E−03 (9.58E−04 to 2.11E−02) | 6.44E−04 (2.16E−04 to 1.19E−03) | 3.83 ± 1.42 | 4.97E−02 |
| Firmicutes | Erysipelotrichia | Erysipelotrichales | Erysipelotrichaceae | Coprobacillus | sp 8 2 54BFAA | 5.63E−03 (5.86E−04 to 2.25E−02) | 2.28E−03 (2.22E−04 to 5.50E−03) | 3.72 ± 1.15 | 2.15E−02 |
| Proteobacteria | Gammaproteobacteria | Enterobacterales | Enterobacteriaceae | Yokenella | regensburgei | 5.32E−04 (3.33E−04 to 9.28E−04) | 9.74E−05 (4.14E−05 to 2.38E−04) | 3.71 ± 1.16 | 2.16E−02 |
| Proteobacteria | Gammaproteobacteria | no data | no data | no data | no data | 2.66E−02 (6.47E−03 to 1.03E−01) | 2.62E−03 (7.30E−04 to 9.95E−03) | 3.70 ± 1.29 | 4.11E−02 |
| Proteobacteria | Gammaproteobacteria | Enterobacterales | Enterobacteriaceae | Citrobacter | werkmanii | 3.72E−04 (5.32E−05 to 2.93E−03) | 5.87E−05 (3.61E−05 to 2.19E−04) | 3.63 ± 1.20 | 3.19E−02 |
| Proteobacteria | Gammaproteobacteria | Enterobacterales | Enterobacteriaceae | Shigella | sonnei | 2.11E−01 (1.90E−01 to 4.21E−01) | 2.15E−02 (5.35E−03 to 1.19E−01) | 3.58 ± 1.15 | 2.66E−02 |
| Actinobacteria | Actinobacteria | Corynebacteriales | Corynebacteriaceae | Corynebacterium | striatum | 5.55E−04 (4.42E−04 to 6.65E−04) | 1.20E−04 (1.73E−05 to 2.52E−04) | 3.46 ± 1.02 | 1.40E−02 |
| Proteobacteria | Gammaproteobacteria | Enterobacterales | Enterobacteriaceae | no data | no data | 2.40E+01 (1.57E+01 to 3.93E+01) | 3.26E+00 (3.15E−01 to 1.05E+01) | 3.34 ± 1.17 | 4.11E−02 |
| Actinobacteria | Actinobacteria | Corynebacteriales | Nocardiaceae | Rhodococcus | opacus | 6.19E−04 (4.44E−04 to 7.18E−04) | 7.17E−05 (0.00E+00 to 3.01E−04) | 3.32 ± 1.13 | 3.53E−02 |
| Firmicutes | Erysipelotrichia | Erysipelotrichales | Erysipelotrichaceae | Coprobacillus | sp D7 | 3.57E−03 (4.86E−04 to 1.51E−02) | 2.00E−03 (4.98E−04 to 5.34E−03) | 3.29 ± 1.15 | 4.11E−02 |
| Proteobacteria | Gammaproteobacteria | Enterobacterales | Enterobacteriaceae | Escherichia | albertii | 3.53E−01 (1.71E−01 to 5.09E−01) | 6.62E−02 (1.44E−02 to 1.43E−01) | 3.29 ± 1.15 | 4.16E−02 |
| Proteobacteria | Gammaproteobacteria | Enterobacterales | Enterobacteriaceae | Citrobacter | sp MGH110 | 1.66E−04 (1.45E−04 to 6.09E−04) | 6.33E−05 (0.00E+00 to 1.34E−04) | 3.26 ± 1.15 | 4.28E−02 |
| Proteobacteria | Gammaproteobacteria | Enterobacterales | Enterobacteriaceae | Kluyvera | cryocrescens | 1.04E−03 (7.06E−04 to 1.46E−03) | 1.46E−04 (8.05E−06 to 5.91E−04) | 3.25 ± 1.09 | 3.39E−02 |
| Proteobacteria | Gammaproteobacteria | Enterobacterales | Enterobacteriaceae | Enterobacter | no data | 5.65E−03 (4.07E−03 to 8.89E−03) | 7.39E−04 (1.65E−04 to 2.59E−03) | 3.09 ± 1.13 | 4.81E−02 |
| Proteobacteria | Gammaproteobacteria | Enterobacterales | Enterobacteriaceae | Kosakonia | cowanii | 4.42E−04 (3.17E−04 to 4.79E−04) | 5.90E−05 (0.00E+00 to 3.21E−04) | 2.99 ± 1.10 | 4.90E−02 |
| Proteobacteria | Gammaproteobacteria | Enterobacterales | Enterobacteriaceae | Shigella | boydii | 2.11E−01 (7.81E−02 to 3.71E−01) | 2.20E−02 (6.29E−03 to 7.84E−02) | 2.90 ± 1.07 | 4.90E−02 |
| Lower in HR (12 species) | |||||||||
| Actinobacteria | Coriobacteriia | Eggerthellales | Eggerthellaceae | Eggerthella | no data | 0.00E+00 (0.00E+00 to 0.00E+00) | 0.00E+00 (0.00E+00 to 9.63E−05) | −8.77 ± 2.94 | 3.39E−02 |
| Actinobacteria | Actinobacteria | Bifidobacteriales | Bifidobacteriaceae | Bifidobacterium | gallinarum | 0.00E+00 (0.00E+00 to 1.47E−04) | 0.00E+00 (0.00E+00 to 1.97E−02) | −7.36 ± 2.70 | 4.81E−02 |
| Firmicutes | Clostridia | Clostridiales | Lachnospiraceae | Anaerostipes | caccae | 0.00E+00 (0.00E+00 to 0.00E+00) | 2.42E−05 (0.00E+00 to 4.28E−03) | −6.45 ± 2.38 | 4.90E−02 |
| Firmicutes | Clostridia | Clostridiales | Lachnospiraceae | Anaerostipes | no data | 2.08E−05 (0.00E+00 to 1.33E−04) | 1.23E−04 (8.06E−06 to 4.72E−02) | −6.20 ± 2.01 | 2.76E−02 |
| Firmicutes | Bacilli | Lactobacillales | Enterococcaceae | Enterococcus | canintestini | 7.98E−05 (0.00E+00 to 2.92E−04) | 3.40E−04 (3.54E−05 to 1.04E−02) | −5.57 ± 1.62 | 1.27E−02 |
| Firmicutes | Erysipelotrichia | Erysipelotrichales | Erysipelotrichaceae | Catenibacterium | mitsuokai | 8.32E−05 (0.00E+00 to 7.59E−04) | 2.97E−02 (1.35E−03 to 5.00E−01) | −5.29 ± 1.71 | 2.66E−02 |
| Actinobacteria | Actinobacteria | Bifidobacteriales | Bifidobacteriaceae | Bifidobacterium | no data | 0.00E+00 (0.00E+00 to 2.22E−04) | 3.54E−04 (3.63E−05 to 1.07E−02) | −4.80 ± 1.75 | 4.76E−02 |
| Firmicutes | Bacilli | Lactobacillales | Streptococcaceae | Streptococcus | pasteurianus | 4.89E−04 (1.38E−04 to 3.65E−03) | 6.72E−03 (1.91E−03 to 2.25E−01) | −4.26 ± 1.55 | 4.76E−02 |
| Firmicutes | Clostridia | Clostridiales | Lachnospiraceae | Anaerostipes | sp 3 2 56FAA | 1.55E−03 (2.92E−04 to 1.01E−02) | 2.29E−02 (5.94E−03 to 4.40E−02) | −3.96 ± 1.07 | 7.29E−03 |
| Firmicutes | Clostridia | Clostridiales | Eubacteriaceae | no data | bacterium CHKCI004 | 0.00E+00 (0.00E+00 to 3.97E−05) | 1.54E−04 (5.61E−05 to 5.19E−04) | −3.63 ± 1.23 | 3.48E−02 |
| Firmicutes | Clostridia | Clostridiales | Lachnospiraceae | no data | bacterium 3 1 46FAA | 5.06E−04 (1.35E−04 to 3.67E−03) | 5.23E−03 (2.61E−03 to 3.45E−02) | −2.85 ± 1.03 | 4.71E−02 |
| Firmicutes | Clostridia | Clostridiales | Clostridiaceae | Clostridium | sp SS2/1 | 2.93E−04 (6.49E−05 to 6.85E−04) | 1.51E−03 (7.01E−04 to 4.71E−03) | −2.47 ± 0.85 | 3.59E−02 |
Notes:
FC, fold change; SE, standard error.
| Bacteria (Order) | Subjects | Baseline | Change in the abundance | Week 4 |
|---|---|---|---|---|
|
Bacteroidales 96 species compared |
All | – | ↑1 species (1.0%) ↓5 species (5.2%) |
– |
| HR | HR>LR: 20 species (20.8%) HR<LR: 0 species (0%) |
↓7 species (7.3%) | HR>LR: 0 species (0%) HR<LR: 0 species (0%) |
|
| LR | ↑1 species (1.0%) | |||
|
Clostridiales 205 species compared |
All | – | ↑3 species (1.5%) ↓13 species (6.3%) |
– |
| HR | HR>LR: 7 species (3.4%) HR<LR: 3 species (1.5%) |
↑5 species (2.4%) ↓17 species (8.3%) |
HR>LR: 9 species (4.4%) HR<LR: 6 species (2.9%) |
|
| LR | ↑3 species (1.5%) ↓1 species (0.5%) |
|||
|
Lactobacillales 205 species compared |
All | – | ↑47 species (22.9%) ↓2 species (1.0%) |
– |
| HR | HR<LR: 34 species (16.6%) HR>LR: 1 species (0.5%) |
↑77 species (37.6%) | HR>LR: 5 species (2.4%) HR<LR: 2 species (1.0%) |
|
| LR | ↑5 species (2.4%) ↓1 species (0.5%) |
|||
|
Enterobacteriales 205 species compared |
All | – | ↑17 species (8.3%) | – |
| HR | HR<LR: 47 species (22.9%) HR>LR: 0 species (0%) |
↑97 species (47.3%) | HR<LR: 0 species (0%) HR>LR: 38 species (18.5%) |
|
| LR | ↓7 species (3.4%) |
Notes:
Data expressed as numbers of species and percentages of all species being compared in each order.
Enterobacterales and Lactobacillales dominated the gut of high-responders
Among 68 bacterial species whose abundances were higher in HR, 38 (56%) were Enterobacterales (Table 7, Fig. S8B). No Enterobacterales species was observed to be higher in LR at week 4. This was the opposite of baseline GM where 47 species of Enterobaterales were higher in LR (Table 6). For Lactobacillales, five species were enriched in the gut of HR while two species were enriched in the gut of LR at week 4.
Clostridiales in the gut of high- and low-responders
Nine (13%) out of 68 species with higher abundances among HR were in the Clostridiales order, while six (50%) out of 12 species with higher abundances among LR were in the Clostridiales order (Table 7, Fig. S8B).
Bacteroidales was no longer different in high- vs low-responders
The 20 species in the Bacteroidales order observed to have higher abundances in HR at baseline were no longer different between HR and LR at week 4 (Table 7, Fig. S8B).
Protein content of the baseline diet associated with the magnitude of PCo1 change
In addition to baseline GM, the magnitude of PCo1 change was also associated with baseline diet composition. Data on the baseline extruded kibble diets were assembled; however, guaranteed nutrient analysis could only be determined for 15 dogs whose specific formula was provided (Table S5). Protein content of the baseline diet statistically differed among HR, MR, and LR, when expressed as either % dry matter (p = 0.040) or gram per 1,000 kcal diet (p = 0.027, Kruskal–Wallis test). In addition, % protein dry matter was also negatively correlated with PCo1 score at baseline (Spearman’s ρ = −0.54, p = 0.039) (Fig. S9A), and positively correlated with PCo1 score change over the 4 week (Spearman’s ρ = 0.67, p = 0.006) (Fig. S9B). A similar finding was seen when protein content was expressed as g/1000 kcal (Spearman’s ρ = −0.59, p = 0.024 for correlation with PCo1 score at baseline; Spearman’s ρ = 0.78, p = 9.9E−04 for correlation with PCo1 score change) (Figs. S9C, S9D). No association with PCo1 score was observed for fat, fiber, or calorie density. Changes in PCo1 score were also not associated with any of the four different recipes of the intervention diet.
Subject characteristics and α-diversity in high-, mid- and low-responders
Other subject characteristics among the HR, MR, and LR are summarized in Table S6A. Age, sex, body weight, BCS and other subject characterisitics at baseline were not significantly different among the groups. Likewise, health outcomes reported at week 4 were also not associated with the magnitude of PCo1 score change (Table S6B). Additionally, no measure of α-diversity was different among HR, MR, and LR at baseline or at week 4 at a sequencing coverage of 470,000 reads (Table S7).
Gut microbiome and change in overall health
To investigate the association between changes in the microbial profile and overall health, the GM of dogs with reported “better” (n = 19) and “no change” (n = 12) in overall health were compared at the species level at week 4 (Tables 3, 9, Fig. 8). Dogs whose owners reported improved health had higher abundances of 35 species, 24 (69%) of which are in the Lactobacillales order and two of which are in the Enterobacterales order. Five (14%) species of the Erysipelotrichaceae family were also higher in dogs reported as having better overall health. Two species, both Bacteroides, were lower in those reported as having better overall health.
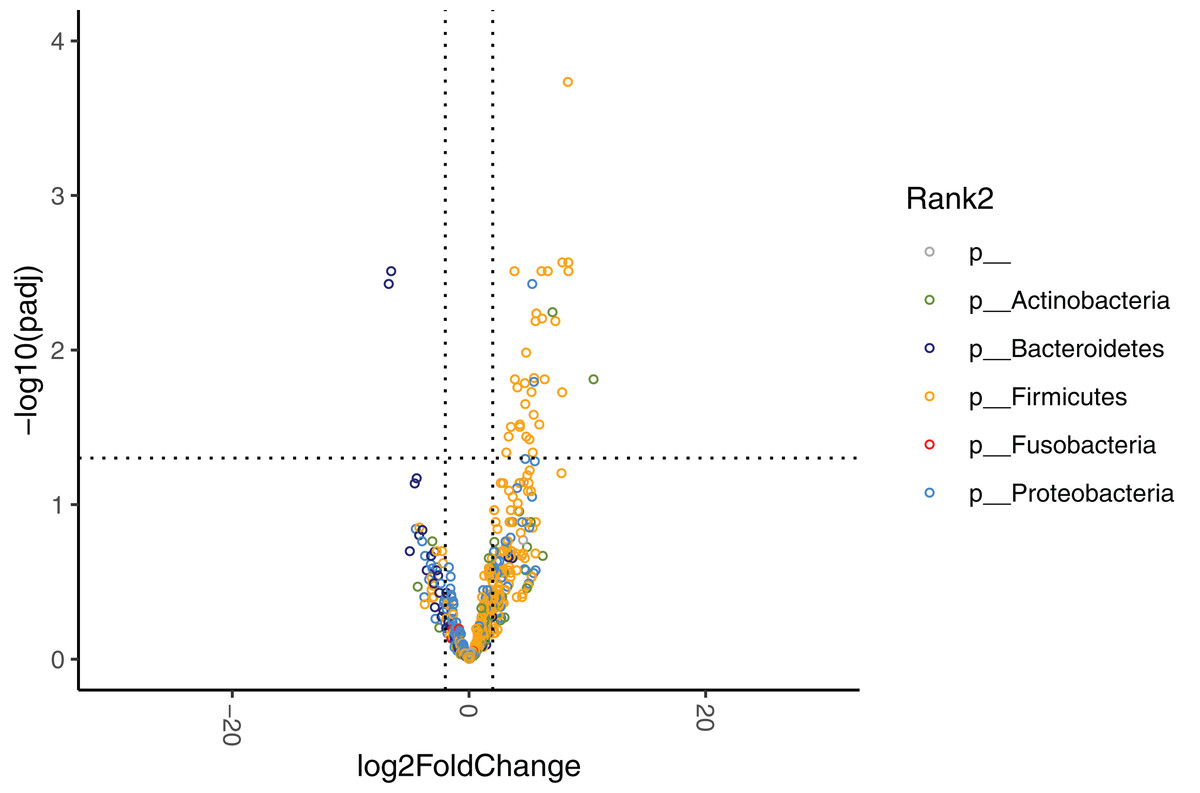
Figure 8: Volcano plot demonstrating fold-change (FC) of species abundance between week 4 and baseline in those reporting better overall health (n = 16) compared to those reporting about the same overall health (n = 10).
Vertical dashed lines show log2FC at 1 and −1 (i.e. FC at 2 and −2). Horizontal dashed line shows adjusted p = 0.05. Adjustment of p values is performed with false discovery rate. Points are colored by phylum.
| Phylum | Class | Order | Family | Genus | Species | Relative abundance, in % Median (IQR) |
Better vs About the same health Week 4 |
||
|---|---|---|---|---|---|---|---|---|---|
| Better overall health (n = 16) | About the same overall health (n = 10) | Log 2 FC mean ± SE |
Adjusted P-value1 |
||||||
| Higher in “better overall health” (35 species) | |||||||||
| Firmicutes | Bacilli | Bacillales | Bacillaceae | Lysinibacillus | sphaericus | 0.00E+00 (0.00E+00 to 0.00E+00) | 0.00E+00 (0.00E+00 to 0.00E+00) | 25.39 ± 3.04 | 3.41E−14 |
| Actinobacteria | Actinobacteria | Bifidobacteriales | Bifidobacteriaceae | Bifidobacterium | animalis | 0.00E+00 (0.00E+00 to 2.94E−05) | 0.00E+00 (0.00E+00 to 0.00E+00) | 10.52 ± 3.04 | 1.54E−02 |
| Firmicutes | Bacilli | Lactobacillales | Enterococcaceae | Enterococcus | avium | 1.85E−04 (0.00E+00 to 9.98E−04) | 0.00E+00 (0.00E+00 to 3.11E−05) | 8.40 ± 2.03 | 3.09E−03 |
| Firmicutes | Bacilli | Lactobacillales | Enterococcaceae | Enterococcus | sp 3C7 DIV0644 | 6.49E−05 (0.00E+00 to 2.20E−03) | 0.00E+00 (0.00E+00 to 0.00E+00) | 8.39 ± 1.94 | 2.71E−03 |
| Firmicutes | Bacilli | Lactobacillales | Lactobacillaceae | Lactobacillus | plantarum | 3.25E−04 (8.20E−05 to 1.99E−03) | 1.18E−04 (0.00E+00 to 1.64E−03) | 8.35 ± 1.68 | 1.84E−04 |
| Firmicutes | Bacilli | Lactobacillales | Enterococcaceae | Enterococcus | sp 3G6 DIV0642 | 8.56E−04 (0.00E+00 to 6.13E−03) | 0.00E+00 (0.00E+00 to 0.00E+00) | 7.89 ± 1.84 | 2.71E−03 |
| Firmicutes | Bacilli | Lactobacillales | Enterococcaceae | Enterococcus | sp HMSC072H05 | 1.33E−05 (0.00E+00 to 2.88E−04) | 0.00E+00 (0.00E+00 to 0.00E+00) | 7.87 ± 2.36 | 1.88E−02 |
| Firmicutes | Bacilli | Lactobacillales | Enterococcaceae | Enterococcus | sp FDAARGOS 163 | 1.35E−04 (0.00E+00 to 3.44E−03) | 0.00E+00 (0.00E+00 to 0.00E+00) | 7.30 ± 1.95 | 6.49E−03 |
| Actinobacteria | Actinobacteria | Micrococcales | Micrococcaceae | Arthrobacter | no data | 8.09E−05 (0.00E+00 to 3.75E−04) | 0.00E+00 (0.00E+00 to 3.29E−05) | 7.05 ± 1.83 | 5.68E−03 |
| Firmicutes | Bacilli | Lactobacillales | Enterococcaceae | Enterococcus | sp 5B3 DIV0040 | 4.23E−04 (0.00E+00 to 5.17E−03) | 0.00E+00 (0.00E+00 to 2.42E−05) | 6.66 ± 1.64 | 3.09E−03 |
| Firmicutes | Bacilli | Lactobacillales | Enterococcaceae | Enterococcus | sp CR-Ec1 | 7.63E−05 (0.00E+00 to 1.59E−03) | 0.00E+00 (0.00E+00 to 0.00E+00) | 6.39 ± 1.85 | 1.54E−02 |
| Firmicutes | Bacilli | Lactobacillales | Enterococcaceae | Enterococcus | sp kppr-6 | 5.33E−05 (0.00E+00 to 4.47E−03) | 0.00E+00 (0.00E+00 to 2.42E−05) | 6.17 ± 1.63 | 6.25E−03 |
| Firmicutes | Bacilli | Lactobacillales | Enterococcaceae | Enterococcus | sp FDAARGOS 375 | 9.02E−04 (2.08E−05 to 1.91E−02) | 4.83E−05 (0.00E+00 to 2.76E−04) | 6.12 ± 1.50 | 3.09E−03 |
| Firmicutes | Bacilli | Lactobacillales | Streptococcaceae | Streptococcus | orisratti | 1.02E−04 (0.00E+00 to 7.83E−04) | 0.00E+00 (0.00E+00 to 0.00E+00) | 5.94 ± 1.88 | 3.03E−02 |
| Firmicutes | Bacilli | Lactobacillales | Enterococcaceae | Enterococcus | casseliflavus | 4.22E−03 (3.18E−04 to 5.93E−02) | 5.53E−05 (6.27E−06 to 4.45E−04) | 5.68 ± 1.49 | 5.79E−03 |
| Firmicutes | Bacilli | Lactobacillales | Lactobacillaceae | Lactobacillus | brevis | 2.64E−04 (0.00E+00 to 8.82E−04) | 5.09E−05 (3.45E−05 to 5.27E−04) | 5.61 ± 1.49 | 6.49E−03 |
| Firmicutes | Bacilli | Lactobacillales | Enterococcaceae | Enterococcus | pseudoavium | 7.17E−05 (0.00E+00 to 3.14E−04) | 0.00E+00 (0.00E+00 to 0.00E+00) | 5.49 ± 1.57 | 1.51E−02 |
| Proteobacteria | Gammaproteobacteria | Enterobacterales | Hafniaceae | Hafnia | alvei | 8.40E−04 (5.64E−05 to 1.16E−01) | 3.45E−05 (0.00E+00 to 4.21E−04) | 5.48 ± 1.60 | 1.60E−02 |
| Firmicutes | Erysipelotrichia | Erysipelotrichales | Erysipelotrichaceae | Catenibacterium | mitsuokai | 4.69E−03 (3.99E−05 to 7.00E−01) | 7.95E−04 (1.71E−04 to 2.00E−02) | 5.46 ± 1.69 | 2.62E−02 |
| Firmicutes | Bacilli | Lactobacillales | Enterococcaceae | Enterococcus | sp 6D12 DIV0197 | 2.71E−04 (0.00E+00 to 9.29E−03) | 0.00E+00 (0.00E+00 to 6.22E−05) | 5.38 ± 1.81 | 4.60E−02 |
| Proteobacteria | Gammaproteobacteria | Enterobacterales | Enterobacteriaceae | Raoultella | ornithinolytica | 1.96E−04 (0.00E+00 to 3.51E−03) | 5.90E−05 (8.27E−06 to 1.22E−04) | 5.34 ± 1.34 | 3.73E−03 |
| Firmicutes | Bacilli | Lactobacillales | Enterococcaceae | Enterococcus | sp HMSC05C03 | 1.11E−04 (0.00E+00 to 8.99E−04) | 0.00E+00 (0.00E+00 to 0.00E+00) | 5.28 ± 1.58 | 1.87E−02 |
| Firmicutes | Bacilli | Lactobacillales | Streptococcaceae | Streptococcus | canis | 1.46E−04 (0.00E+00 to 1.36E−03) | 3.45E−05 (0.00E+00 to 1.93E−04) | 5.11 ± 1.67 | 3.78E−02 |
| Firmicutes | Clostridia | Clostridiales | Lachnospiraceae | Anaerostipes | no data | 1.82E−04 (0.00E+00 to 2.27E−02) | 4.25E−05 (5.19E−06 to 3.35E−03) | 4.83 ± 1.57 | 3.63E−02 |
| Firmicutes | Bacilli | Lactobacillales | Enterococcaceae | Enterococcus | gallinarum | 1.84E−03 (2.06E−04 to 8.66E−03) | 8.58E−05 (0.00E+00 to 1.66E−03) | 4.82 ± 1.34 | 1.04E−02 |
| Firmicutes | Bacilli | Lactobacillales | Enterococcaceae | Enterococcus | dispar | 7.80E−05 (0.00E+00 to 1.00E−03) | 0.00E+00 (0.00E+00 to 6.09E−05) | 4.75 ± 1.45 | 2.23E−02 |
| Firmicutes | Bacilli | Lactobacillales | Enterococcaceae | Enterococcus | malodoratus | 1.66E−04 (3.32E−05 to 5.32E−04) | 0.00E+00 (0.00E+00 to 3.67E−05) | 4.72 ± 1.38 | 1.64E−02 |
| Firmicutes | Bacilli | Lactobacillales | Carnobacteriaceae | Carnobacterium | maltaromaticum | 2.01E−04 (9.79E−05 to 3.96E−03) | 2.93E−05 (0.00E+00 to 9.28E−04) | 4.30 ± 1.36 | 3.03E−02 |
| Firmicutes | Bacilli | Lactobacillales | Lactobacillaceae | Lactobacillus | fermentum | 3.96E−04 (0.00E+00 to 1.01E−03) | 6.09E−05 (0.00E+00 to 2.59E−04) | 4.29 ± 1.37 | 3.14E−02 |
| Firmicutes | Bacilli | Lactobacillales | Streptococcaceae | Lactococcus | garvieae | 4.12E−04 (1.69E−04 to 1.80E−03) | 1.88E−04 (0.00E+00 to 4.24E−04) | 4.09 ± 1.21 | 1.74E−02 |
| Firmicutes | Bacilli | Lactobacillales | Streptococcaceae | Lactococcus | lactis | 2.18E−02 (2.76E−03 to 1.32E−01) | 6.68E−03 (3.89E−03 to 2.35E−02) | 3.88 ± 1.12 | 1.54E−02 |
| Firmicutes | Erysipelotrichia | Erysipelotrichales | Erysipelotrichaceae | Erysipelatoclostridium | innocuum | 6.12E−04 (2.26E−04 to 3.63E−03) | 1.46E−04 (3.54E−05 to 2.50E−04) | 3.83 ± 0.94 | 3.09E−03 |
| Firmicutes | Erysipelotrichia | Erysipelotrichales | Erysipelotrichaceae | Coprobacillus | sp 3 3 56FAA | 4.90E−03 (8.45E−04 to 1.62E−02) | 8.80E−04 (1.98E−05 to 3.02E−03) | 3.54 ± 1.13 | 3.14E−02 |
| Firmicutes | Erysipelotrichia | Erysipelotrichales | Erysipelotrichaceae | no data | no data | 2.01E−01 (1.77E−02 to 1.16E+00) | 2.66E−02 (4.94E−03 to 2.53E−01) | 3.35 ± 1.09 | 3.63E−02 |
| Firmicutes | Erysipelotrichia | Erysipelotrichales | Erysipelotrichaceae | Coprobacillus | sp 8 2 54BFAA | 6.89E−03 (2.25E−03 to 1.77E−02) | 5.31E−04 (5.01E−05 to 4.51E−03) | 3.15 ± 1.06 | 4.60E−02 |
| Lower in “better overall health” (2 species) | |||||||||
| Bacteroidetes | Bacteroidia | Bacteroidales | Bacteroidaceae | Bacteroides | stercoris | 7.21E−05 (0.00E+00 to 1.05E−03) | 1.43E−03 (0.00E+00 to 1.59E−01) | −6.79 ± 1.71 | 3.73E−03 |
| Bacteroidetes | Bacteroidia | Bacteroidales | Bacteroidaceae | Bacteroides | coprocola | 1.50E−05 (0.00E+00 to 5.17E−04) | 2.17E−04 (2.38E−05 to 5.16E−02) | −6.58 ± 1.60 | 3.09E−03 |
Notes:
FC, fold change; SE, standard error; NS, not significant.
Since the overall health status at baseline was comparable between these two groups of dogs, as a control the same analysis was performed on the sample collected at baseline. Only 8 species were identified to be differentially present between the two groups (Table S8). None of the identified species were a Lactobacillales, an Enterobacterales, or an Erysipelotrichaceae.
The magnitude of change in PCo1 score was not significantly different between dogs reported as having improved versus no change in overall health. Species evenness, richness, and Shannon’s diversity index were not different between these two groups at baseline at the sequencing coverage of 470,000 reads. At week 4, however, the species evenness in those reporting improved overall health was significantly higher than those reporting no change in overall health (0.59 ± 0.10 vs 0.52 ± 0.11, p = 0.023, Kruskal–Wallis test). Likewise, Shannon’s diversity index at week 4 was higher in those reported to have improved overall health (2.39 ± 0.39 vs 2.10 ± 0.44, p = 0.023, Kruskal–Wallis test).
Discussion
We describe GM composition and owner-reported health perception of dogs switching from various brands of kibble to commercial MC diets. To our knowledge, this is the first MC diet study performed in household dogs, including male and female dogs of various breeds across a broad age range. As a result of this diverse and free-living study population these findings may be more generalizable to the dog population than other studies that focus on a single breed or a single diet. Two previously published studies using a similar diet comparison were conducted, however they consisted of eight and 12 Beagles in a laboratory setting (Algya et al., 2018; Do et al., 2021). Dogs in the present study maintained their body weight throughout the study period, therefore changes in health and GM were independent of weight change. Finally, the characterization of gut bacteria in this study was performed with metagenomic sequencing, a powerful technique enabling enhanced taxonomic resolution and accuracy, as well as increased detection of diversity and functional genes, a technique that has not yet been widely used in canine research (Ranjan et al., 2016; Salas-Mani et al., 2018; Xu et al., 2019; Alessandri et al., 2019; Connelly et al., 2019; Do et al., 2021).
All dogs were perceived by their owners as having either better or no change in overall health after diet transition. It is possible that this observation could be subject to bias and may not directly correlate to more objective health outcomes, but as argued by Yeates & Main (2009), owner-reported health assessment is a separate and independent outcome that is especially important in this type of research study. A chance of bias may also derive from the willingness of participants to report the health impact associated with the diet transition, and the observation that a significant portion of participants (24%) did not complete the study. However the association between a MC diet and positive health perception has been previously reported using a survey administered to a group of dog owners after a veterinarian formulated MC diets for the dogs (Johnson et al., 2016). Dogs accepted MC diets well and remained healthy in two additional feeding trials (Algya et al., 2018; Do et al., 2021).
Incidents of vomiting and diarrhea were recorded over the four weeks after diet transition. Currently there is not much data on the prevalence and frequency of these symptoms in household dogs, regardless of diet transition. A 2005 survey collecting responses from 772 dog owners in England found that the rate of spontaneous vomiting and diarrhea was one case per 10.6 dog-weeks and one case per 13.4 dog-weeks, respectively (Hubbard et al., 2007). A diet change was suggested to be a cause of diarrhea in some dogs. These are slightly higher than the rates in this present study. Likewise, 27% of dogs experienced diarrhea within seven weeks after boiled minced beef replaced 75% of the calories in an extruded diet (one case per 25.6 dog-weeks) (Herstad et al., 2017, 2018). Other diet transition studies using a raw or MC diet did not report cases of diarrhea or vomiting (Sandri et al., 2017; Algya et al., 2018; Do et al., 2021). Therefore, the rates of vomiting and diarrhea appear to be consistent with data available from other household dog populations.
Fifty eight percent of owners reported lower defecation frequency upon diet transition in this study, although this proportion was not significantly different from those reporting no change. Fecal output has been reported to be significantly lower in dogs fed MC diets compared to extruded diets, despite dogs maintaining the same body weight on different diets (Oba et al., 2020; Do et al., 2021). The extremely high nutrient and energy digestibility of MC diets is suggested to be the main driver of the reduction in fecal output (Do et al., 2021). There was also a non-significant trend towards firmer stool when dogs switched to the test diets in our study. In studies using veterinarian-assessed data or an objective analysis of fecal moisture, fecal consistency was reported to be firmer (Sandri et al., 2017; Bermingham et al., 2017) or comparable (Algya et al., 2018; Schmidt et al., 2018; Do et al., 2021) among healthy dogs fed MC or raw diets compared to those fed a traditional extruded diet.
The intervention diet in this study consisted of many nutrients and dietary components that may have an influence on both health and GM composition, including water (Cameron et al., 2011; Deng et al., 2014; Alexander, Colyer & Morris, 2014), prebiotic fibers (Middelbos et al., 2010; Panasevich et al., 2015; Alexander et al., 2018; Eisenhauer et al., 2019), omega-3 fatty acids (Bauer, 2011), carotenoids, and polyphenols (Kolchin et al., 1991; Kim et al., 2000; Chew et al., 2000; Massimino et al., 2003; Hall et al., 2006; Carrera-Quintanar et al., 2018; Lyu et al., 2018), although high-quality extruded diets may include these nutrients and compounds as well. Nutrient and energy digestibility has also been observed to be different between extruded kibble and MC diets (Algya et al., 2018), and it may facilitate differential impacts on health and GM. Due to the study design, it is impossible to pinpoint which component(s) of the MC diets contributed to the change in health and GM profile. Similarly, the four MC dietrecipes were different in nutrient and in ingredient composition, adding an additional confounding factor.
Changes in α-diversity in response to dietary interventions have varied between studies, likelybecause they are dependent on the diets being compared. Similar to Do et al. (2021), we did not observe any change in the GM α-diversity between kibble and MC diets. A cross-sectional study performed in household dogs also reported no differences in α-diversity between those fed raw and extruded diets (Schmidt et al., 2018). However these findings contrast with previous reports that demonstrate reduced α-diversity upon transitioning to a MC diet in 8 or 11 dogs (Herstad et al., 2017; Algya et al., 2018), or increased α-diversity upon transitioning to a raw food diet in eight dogs (Sandri et al., 2017). α-Diversity was also higher in six household dogs fed raw diets as compared to five household dogs fed commercial extruded diets (Kim et al., 2017). Herstad et al. argued that decreased α-diversity with a cooked beef diet may be due to higher fat content inducing bile production (Herstad et al., 2017), which has been shown to be antimicrobial (Yokota et al., 2012; Herstad et al., 2017). As the fat and protein content in the baseline extruded diets were not statistically different from the intervention diet in this present study, it is possible that the lack of macronutrient composition difference is responsible for the lack of a change in α-diversity. The variety of baseline diets and the utilization of four different MC recipes may also mask the effect of diet transition on α-diversity. Often, the α-diversity is observed to be lower in diseased populations (Wernimont et al., 2020). In this study the Shannon’s diversity index in a subgroup of dogs whose overall health reported to be improved at week four was significantly higher than those that remained unchanged. However, the use of α-diversity and its clinical importance have been recently challenged (Moya & Ferrer, 2016).
Consistent with previous shotgun metagenomic sequencing studies in household dogs (Alessandri et al., 2019; Jha et al., 2020), four phyla, Firmicutes, Proteobacteria, Actinobacteria, and Bacteroidetes, dominated the GM. A variety of taxonomic differences in the microbiome were observed after dietary transition, including increased abundances of many LAB. The abundances of the Lactobacillaceae and Leuconostocaceae families and the Lactobacillus genus were similarly reported to be higher in dogs fed a raw diet compared to a kibble diet (Bermingham et al., 2017; Schmidt et al., 2018). On the contrary, Do et al. (2021) reported lower levels of Lactobacillus in dogs fed MC diets compared to an extruded kibble, but the kibble contained an L. acidophilus fermentation product and high chicory content which were postulated to contribute to the growth of LAB. In many mammals LAB have been suggested to be allochthonous, meaning they are ingested through their natural occurrence on food rather than being true habitants of the distal part of the host GI tract (Walter, 2008). Owing to their demonstrated ability to improve GI health (Grześkowiak et al., 2015; Jensen & Bjørnvad, 2019), selective LAB are often included in probiotic food or supplements. We also observed a significant association between increased abundances of Lactobacillales and dogs reported as having better health after four weeks of the intervention diet.
An increase of Enterobacterales was also observed with diet transition. Similar increases were previously observed in healthy dogs fed either a MC or a raw diet (Sandri et al., 2017; Algya et al., 2018; Schmidt et al., 2018). While there are pathogens within this order, many species of Enterobacterales, such as Salmonella and E. coli, are also members of the healthy human and canine GM, and only opportunistically cause disease in humans, for instance, when an immune system is compromised (Moon et al., 2018). Frequently, only specific strains are pathogenic. It is unknown whether some species of Enterobacterales are also associated with increased disease risk in dogs, particularly since some known human pathogens (e.g. Escherichia/Shigella spp. (Sandri et al., 2017), β-lactamase producing E. coli (Baede et al., 2015), Salmonella (Reimschuessel et al., 2017), and Campylobacter spp. (Bojanić et al., 2017)) are present in the GI tract of healthy dogs. Additionally, Enterobacterlaes are diverse and have a considerably wide range of abundances in the present study. A wide range of Proteobacteria, whose members predominantly include Enterobacterales, have been previously reported in other cohorts of healthy dogs using metagenomic sequencing (IQR: 3–52% in (Jha et al., 2020)) or 16S rRNA sequencing (range: 0–22% in (Hand et al., 2013), range: 0–17% in (Garcia-Mazcorro et al., 2012)). Therefore the impact of an increased abundance of Enterobacterales on canine health remains to be determined.
Switching to the MC diet also resulted in reduced abundances of some taxa, including species in the order Clostridiales and certain genera, including Blautia, Prevotella, Peptostreptococcus, and Faecalibacterium. This result shares some similarities with previous reports with a transition from an extruded kibble to a raw diet (Sandri et al., 2017; Bermingham et al., 2017; Algya et al., 2018; Schmidt et al., 2018). A MC diet also decreased Prevotella in dogs switching from an extruded kibble diet (Do et al., 2021), but not Clostridium, Blautia, or Faecalibacterium. Many of these bacteria are present in a healthy human GI tract, but their relevance is unknown in dogs. F. prausnitzii, which was lower after the intervention diet, was also shown to be lower in dogs fed minced beef than those fed an extruded diet (Herstad et al., 2017). This bacterium is thought to be beneficial because of its ability to produce butyrate, a short-chain fatty acid that serves as an energy source for colonocytes (Louis & Flint, 2009; Donohoe et al., 2011). However, its reduced abundance in MC diets may be due to other butyrate-producing bacteria becoming more abundant (e.g. Firmicutes (Macfarlane & Macfarlane, 2003)), as it has been shown with increased levels of Roseburia and butyrate in dogs fed minced beef (Herstad et al., 2017), but not in the previous trial (Do et al., 2021), or in the present study. This is further supported by the observation that the KO terms related to short-chain fatty acid metabolism remained unchanged upon diet transition in this study.
Our results indicate a differential microbiomic response to dietary transition based on the magnitude of change in β-diversity (i.e. HR, MR and LR). While similar analytical approaches have been adopted in human research (Salonen et al., 2014; Mills et al., 2019), to our knowledge this is the first study to report distinct varied microbial responses in dogs in response to diet change. Using assorted multivariate analyses, the GM at baseline was demonstrated to be different among HR, MR and LR. Specifically, HRs had lower abundances of Lactobacillales and Enterobacterales, and higher abundances of Bacteroidales than the LRs, and they responded to the MC diet differently and more robustly. We hypothesize that the niche occupied by Bacteroidales at baseline becomes more favorable for Enterobacterales and LAB growth upon diet transition. This may explain why the lower abundance of Enterobacterales at baseline was associated with greater PCo1 score change. Moreover, the protein content of the baseline diet was positively correlated with the magnitude of PCo1 change, although we acknowledge the small sample size (n = 15) as well as a previous analysis of 750 commercial dry pet foods demonstrating 1.6% difference between the guaranteed and actual analysis of crude protein (Hill et al., 2009). Given that the protein content of the baseline and the intervention diets were statistically comparable, and that Enterobacterales are able to thrive on proteins, carbohydrates, or lipids (Moon et al., 2018), the observed correlation may be explained by the change in the ingredients despite an unmodified macronutrient profile. For example, replacing chicken with whole cricket meal led to a small change in the GM profile in dogs (Jarett et al., 2019), and replacing cellulose and brewer’s rice with potato fiber up to 6% also led to an increase of Faecalibacterium (Panasevich et al., 2015). Such associative findings between baseline characteristics and magnitude of responses to the intervention can serve as a basis for future studies that aim to construct predictive models, and ultimately, dietary plans tailored to each individual based on existing microbiome composition and function for optimized health outcomes (Zmora et al., 2018).
Changes in GM function characterized by KEGG were detected with a multivariate analysis (PCoA), but remained less defined with univariate analysis (negative binomial GLM with DESeq2) in this study. The univariate method is inferior in terms of its ability to capture small changes cumulatively. GM functional redundancy under different dietary environments has been demonstrated (Moya & Ferrer, 2016), and changes in GM profile in healthy dogs may not reflect a drastic change in the functionality as compared to those with improved or worsened health status after an intervention (Guard et al., 2015). Thus the lack of any drastic change in functionality is likely at least partially reflective of dogs being healthy at both baseline and week 4. Availability of data from other platforms such as transcriptional profiling or targeted metabolomics may complement metagenomic sequencing in capturing finer changes in GM functionality.
In conclusion, we have demonstrated significant changes in the GM profile of healthy dogs transitioning from a variety of kibble diets to MC diets. The magnitude of shift is associated with baseline GM profile and protein content of the baseline diet. The test diets were well accepted throughout the study, and the majority of dog owners report an improvement or no change in specific health outcomes. Despite its novelty, there are some limitations to the study. A control group where dogs remained on the baseline diet for four weeks was not included, thus any direct causal relationship cannot be established between diet transition and outcomes. However, observed changes in the GM were likely to be caused by diet change as minimal changes were expected if baseline diets were maintained for four weeks. While the four different MC diet recipes may have dampened the signal, most dogs were on a mixed-recipe diet and a wide variety of baseline diets may have provided an opportunity to investigate the wide range of diets and responses among subjects. Finally, while no clinical measures were available, the health data do reflect the owner’s perceptions of health.
Supplemental Information
Number of dogs on different combinations of the intervention diet (n = 33).
Blue is single recipe, gray is two recipes, and red is four recipes. B: Beef, C: Chicken, P: Pork, T: Turkey.
Metagenomic sequencing data used for microbiome analysis.
Plots show the abundance (x-axis, as count) and the prevalence (y-axis, as percentage of all samples) of each read for all phyla post-filtering. Each point represents a read.
Rarefaction curves demonstrating sequencing coverage to calculate species (A) richness and (B) Shannon’s diversity index in samples at baseline (red) and week 4 (blue).
Species richness was calculated from 10,000 to 470,000 reads. Each point represents the mean and each error bar represents standard deviation at each rarefaction depth.
Scree plot showing eigenvalues of the first 25 principal coordinate axes of the microbiota at the species level.
Principal coordinate analysis and Partitioning Around Medoids (PAM) cluster analysis of the microbiota at species level.
PAM cluster analysis using Bray–Curtis distance and multidimensional scaling predicts two clusters (red and blue). A significantly higher proportion of subjects had their baseline samples assigned to cluster 1 (C1) and their week 4 samples assigned to cluster 2 (C2) than the null hypothesis (p = 0.009, McNemar’s Chi-squared test).
Scree plot showing eigenvalues of the first 25 principal coordinate axes of the Kyoto Encyclopedia of Genes and Genomes Orthology (KO) terms.
Principal coordinate analysis and Partitioning Around Medoids (PAM) cluster analysis of the microbiota at species level in samples collected at baseline.
Dot plots demonstrating fold-change (FC) in the abundances of gut bacteria between HR (high-responders, n=9) and LR (low-responders, n=10) at (A) baseline and (B) week 4.
Only species that were significantly different are shown (significance was determined by a negative binomial generalized linear model [GLM] using the differential expression analysis for sequence count data version 2 [DESeq2] package with log2FC at 1 and -1 [i.e. FC at 2 and -2] and adjusted p = 0.05). Each point represents a different species, points are colored by order. The error bars represent the standard error of the mean.
The relationship between protein content of the baseline extruded kibble diets and PCo1 score.
(A) Correlation between %protein per dry matter and PCo1 score at baseline (Spearman’s ρ = -0.54, p = 0.039). (B) Correlation between %protein per dry matter and change in PCo1 score upon diet transition (Spearman’s ρ = 0.67, p = 0.006). (C) Correlation between protein as g/1000 kcal and PCo1 score at baseline (Spearman’s ρ = -0.59, p = 0.024). (D) Correlation between protein as g/1000 kcal and change in PCo1 score upon diet transition (Spearman’s ρ = 0.78, p = 9.9E−04).
Bacteria with significantly different abundances at the order, family, and genus levels between baseline and four weeks (n = 28, log2|fold change| ≥ 2 and FDR-adjusted p < 0.05).
Bacterial species whose abundance significantly increased or decreased (|fold change| ≥ 2 and FDR-adjusted p < 0.05) over 4 weeks in high-responders (HR, n = 9) and low-responders (LR, n = 10).
Nutrient levels derived from guaranteed analysis (mean ± SD) of baseline extruded kibble diets in high- (HR), mid- (MR), and low-responders (LR), as well as the intervention diet.
Characteristics of high- (HR), mid- (MR), and low-responders (LR).
Data are expressed as mean ± SD or n (%).