
The gut microbiome of the Sunda pangolin (Manis javanica) reveals its adaptation to specialized myrmecophagy
- Published
- Accepted
- Received
- Academic Editor
- Valeria Souza
- Subject Areas
- Microbiology, Molecular Biology, Zoology
- Keywords
- 16S rRNA sequencing, Gut microbiome, Pholidota, Convergence, Myrmecophage
- Copyright
- © 2021 Zhang et al.
- Licence
- This is an open access article distributed under the terms of the Creative Commons Attribution License, which permits using, remixing, and building upon the work non-commercially, as long as it is properly attributed. For attribution, the original author(s), title, publication source (PeerJ) and either DOI or URL of the article must be cited.
- Cite this article
- 2021. The gut microbiome of the Sunda pangolin (Manis javanica) reveals its adaptation to specialized myrmecophagy. PeerJ 9:e11490 https://doi.org/10.7717/peerj.11490
Abstract
Background
The gut microbiomes of mammals are closely related to the diets of their hosts. The Sunda pangolin (Manis javanica) is a specialized myrmecophage, but its gut microbiome has rarely been studied.
Methods
Using high-throughput Illumina barcoded 16S rRNA amplicons of nine fecal samples from nine captive Sunda pangolins, we investigated their gut microbiomes.
Results
The detected bacteria were classified into 14 phyla, 24 classes, 48 orders, 97 families, and 271 genera. The main bacterial phyla were Firmicutes (73.71%), Proteobacteria (18.42%), Actinobacteria (3.44%), and Bacteroidetes (0.51%). In the PCoA and neighbor-net network (PERMANOVA: pangolins vs. other diets, weighted UniFrac distance p < 0.01, unweighted UniFrac distance p < 0.001), the gut microbiomes of the Sunda pangolins were distinct from those of mammals with different diets, but were much closer to other myrmecophages, and to carnivores, while distant from herbivores. We identified some gut microbiomes related to the digestion of chitin, including Lactococcus, Bacteroides, Bacillus, and Staphylococcus species, which confirms that the gut microbiome of pangolins may help them to digest chitin.
Significance
The results will aid studies of extreme dietary adaption and the mechanisms of diet differentiation in mammals, as well as metagenomic studies, captive breeding, and ex situ conservation of pangolins.
Introduction
The mammalian gut houses a complex community of microbes, which have maintained symbiotic relationships with their hosts for millennia (Schmidt, Mykytczuk & Schulte-Hostedde, 2019). Many studies have investigated the relationships between hosts and their microbial communities, focusing on topics such as diet (Turnbaugh et al., 2009; Hale et al., 2018), phylogenetics (Ley et al., 2008; Walker et al., 2014), health (Du Toit, 2019), the environment (Xie et al., 2016), and the immune system (Tilg, Schmiderer & Djanani, 2018). Diet appears to be a major factor shaping mammalian gut microbiomes, which have evolved convergently in mammals sharing the same feeding habits (Ley et al., 2008; Muegge et al., 2011). In other words, myrmecophages, carnivores, herbivores, folivores, and omnivores have their own specific gut microbial communities, especially specialized myrmecophages and hindgut fermenter herbivores (Delsuc et al., 2014). Many studies have used the 16S rRNA gene to investigate the composition of mammalian gut microbiomes and to study diets in an evolutionary context (Kau et al., 2011; Muegge et al., 2011; Zhu et al., 2011).
The Sunda pangolin (Manis javanica; Mammalia: Pholidota: Manidae) is listed as critically endangered on the International Union for the Conservation of Nature’s Red List of Threatened Species (Challender et al., 2019). It is a specialized myrmecophage. More than 90% of the prey is ants and termites, and the exoskeletons of ants and termites consist mainly of chitin, which has high nutritive value (Redford & Dorea, 1984). Myrmecophagous mammals include anteaters, aardvarks, and aardwolves (Redford, 1987; Reiss, 2001). Some studies have suggested that the gut microbiomes of myrmecophages have evolved convergently (Delsuc et al., 2014). However, few studies have examined the gut microbiomes of the Sunda pangolin; two recent studies have investigated host and gut bacterial associations in Sunda pangolins. A study of the gut microbiomes of wild Sunda pangolins from Laos revealed that Firmicutes (41%), Proteobacteria (24%), and Bacteroidetes (18%) were the three main phyla (Yang, 2017), while Ma et al. (2018) found that Bacteroidetes (49.9%), Proteobacteria (32.2%), and Firmicutes (12.6%) were the three main phyla in captive Sunda pangolins, which is similar to the microbiomes of herbivores. It is not clear why these two results differ; this will require further investigation.
In this study, we used Illumina MiSeq analyses to sequence amplicons generated from the V3 and V4 regions of the 16S rRNA gene to study the gut microbiomes of nine captive Sunda pangolins and compared them with those of other myrmecophages, carnivores, herbivores, folivores, insectivores, and omnivores to assess convergent evolution. This study improves our understanding of the gut microbiomes associated with extreme dietary adaptation and mechanisms of diet differentiation in mammals. This may have practical value for captive breeding programs, including feed formulations, disease diagnosis, and ex situ conservation.
Materials & Methods
Sample collection
Fecal samples were collected from nine Sunda pangolins kept in captivity at the Pangolin Research Base for Artificial Rescue and Conservation Breeding of South China Normal University (PRB-SCNU). The sample details are shown in Table 1. Their artificial diet consists of mealworms (58.94%), silkworms (20%), dry ants (15%), yeast powder (2%), vitamin complex (0.06%), crushed stone or coarse sand (4%), and vinegar (0.85 mL/100 g) (Zou, 2016). We performed comparative analyses of myrmecophages, carnivores, herbivores, folivores, insectivores, and omnivores using 47 samples that were originally sequenced by Muegge et al. (2011) and Delsuc et al. (2014) (Table S1). We first used a sterile swab to obtain a small amount of fecal material and transferred it to a vial containing a lysis and stabilization buffer that preserved the DNA for transport at ambient temperatures (Almonacid et al., 2017). The samples were then frozen in liquid nitrogen and stored at −80 °C until DNA extraction.
| ID | Gender | Weight (kg) | Time in captivity (year) | Physiological state |
|---|---|---|---|---|
| FS-02A | Female | 3.5 | 2 | Health |
| FS-06A | Female | 4.8 | 4.5 | Health |
| FS-06B | Male | 3.8 | 3.5 | Health |
| FS-06BF | Female | 3.75 | 7 | Health |
| FS-15M | Male | 3.9 | 3.5 | Health |
| FS-16 | Male | 4.2 | 3 | Health |
| FS-18 | Male | 4.5 | 5 | Health |
| FS-18A | Male | 4.07 | 3 | Health |
| FS-18B | Female | 3.6 | 2.5 | Health |
Data acquisition
Bacterial genomic DNA was extracted from the feces samples using the QIAamp DNA Stool Mini Kit (Qiagen, Hilden, Germany). The concentration of each sample was tested with a Qubit 2.0 Fluorometer (Invitrogen, Carlsbad, CA, USA). The hypervariable V3 and V4 regions of the 16S rRNA gene were amplified with target-specific primers (338F and 806R) that specifically amplify bacterial and archaeal 16S genes (Caporaso et al., 2012; Allali et al., 2017). Three replicate PCRs were performed for each DNA sample. After amplification, the PCR products from the same sample were mixed, purified using the Agencourt AMPure XP system (Beckman Coulter Genomics, Brea, CA, USA), and examined by 2% agarose gel electrophoresis. DNA was extracted from the gels using the AxyPrep DNA Gel Extraction Kit (Axygen, Tewksbury, MA, USA) and examined by 2% agarose gel electrophoresis. Illumina sequencing adapters and dual-index barcodes [index 1(i7) and index 2(i5)] (Illumina, San Diego, CA, USA) were added to each amplicon in a subsequent limited cycle PCR. The final libraries were repurified using the Agencourt AMPure XP system, quantified with a Quant-iT™ PicoGreen® kit (Invitrogen/Life Technologies, Green Islands, NY, USA), and normalized before pooling. The DNA library pool was denatured with NaOH and diluted with hybridization buffer. The libraries were validated using an Agilent 2100 biological analyzer (Agilent Technologies, Palo Alto, CA, USA) and quantified with a Qubit 2.0 Fluorometer (Invitrogen, Carlsbad, CA, USA). Finally, the libraries were multiplexed and loaded on an Illumina MiSeq instrument according to the manufacturer’s instructions (Illumina). Sequencing was performed using a 2 ×250 paired-end (PE) configuration and MiSeq Control Software embedded in the MiSeq instrument did the image analysis and base calling. Our data were submitted to the NCBI sequence read archive under accession number PRJNA558047.
Sequence processing and analysis
Clean reads were obtained after paired-end reads assembly and quality control from raw data. Initially, the PE reads were merged using FLASH (Magoc & Salzberg, 2011) and quality filtering was performed using Trimmomatic (ver. 0.39) (Bolger, Lohse & Usadel, 2014). Potential chimeras were moved using the UCHIME algorithm (Rognes et al., 2016). Then, the clean reads were aligned and clustered into operational taxonomic units (OTUs) with a sequence similarity threshold of 97% using Usearch (ver. 10) (Edgar et al., 2011). Chimeras and singletons were removed in the clustering process. The Ribosomal Database Project (RDP) (ver. 2.2) classifier was used to assign taxonomic categories to all OTUs at a confidence threshold of 0.7 (Wang et al., 2007). The RDP classifier uses the Silva 119 database, which has taxonomic categories predicted to the species level (Quast et al., 2013).
Sequences were rarefied before calculating the alpha and beta diversity statistics. We calculated the OTU abundance and Ace, Chao1, Simpson, and Shannon indices using the Mothur software package (ver. 1.30.1) to measure alpha diversity based on the number of different data categories and their respective abundances in the dataset (Schloss, Gevers & Westcott, 2011). All statistical analyses were conducted in R 3.5.1 (R Core Team, 2015). We calculated Good’s coverage (Good, 1952) and plotted rarefaction and rank abundance curves using Mothur to determine whether the sequencing effort was sufficient to describe bacterial communities. We compared the beta diversity to identify differences in the microbial communities between each sample. Principal coordinates analyses (PCoA) and non-metric multidimensional scaling (NMDS) were performed using the Bray–Curtis distance (Bray & Curtis, 1957). To explore whether pangolins underwent convergent evolution with other groups, we performed PCoA on the UniFrac distance (Jiang et al., 2013) and constructed a neighbor-net network based on the UniFrac distance (Huson & Bryant, 2006). Permutational MANOVA (PERMANOVA) was performed to identify significant differences between these groups (“Adonis” in the R package “vegan”).
Results
Analysis of the sequencing data
We generated 16S rRNA gene sequences from nine fecal samples from nine Sunda pangolins. All samples were sequenced. Initially, we generated 735,783 PE reads. After all quality filtering steps, we had 704,251 clean reads with an average read length of 412.10 bp and an average of 78,250 sequences per sample (Table S2). Figure 1 shows the distribution of the lengths of the clean sequences. Using a minimum identity of 97% as the threshold for any sequence pair, we identified 536 OTUs (Table S3). The rarefaction curve for the OTUs flattened gradually, almost plateauing, indicating that the number of OTUs for each sample was sufficient and reasonable (Fig. 2A). The rank abundance curves indicated the evenness and abundance of species in fecal samples horizontally and vertically (Fig. 2B). Good’s coverage was nearly 99.9% for all samples, showing that most bacterial species in the samples were detected (Table 2). We generated a gene clustering heatmap using the 50 most abundant OTUs (Fig. 3).
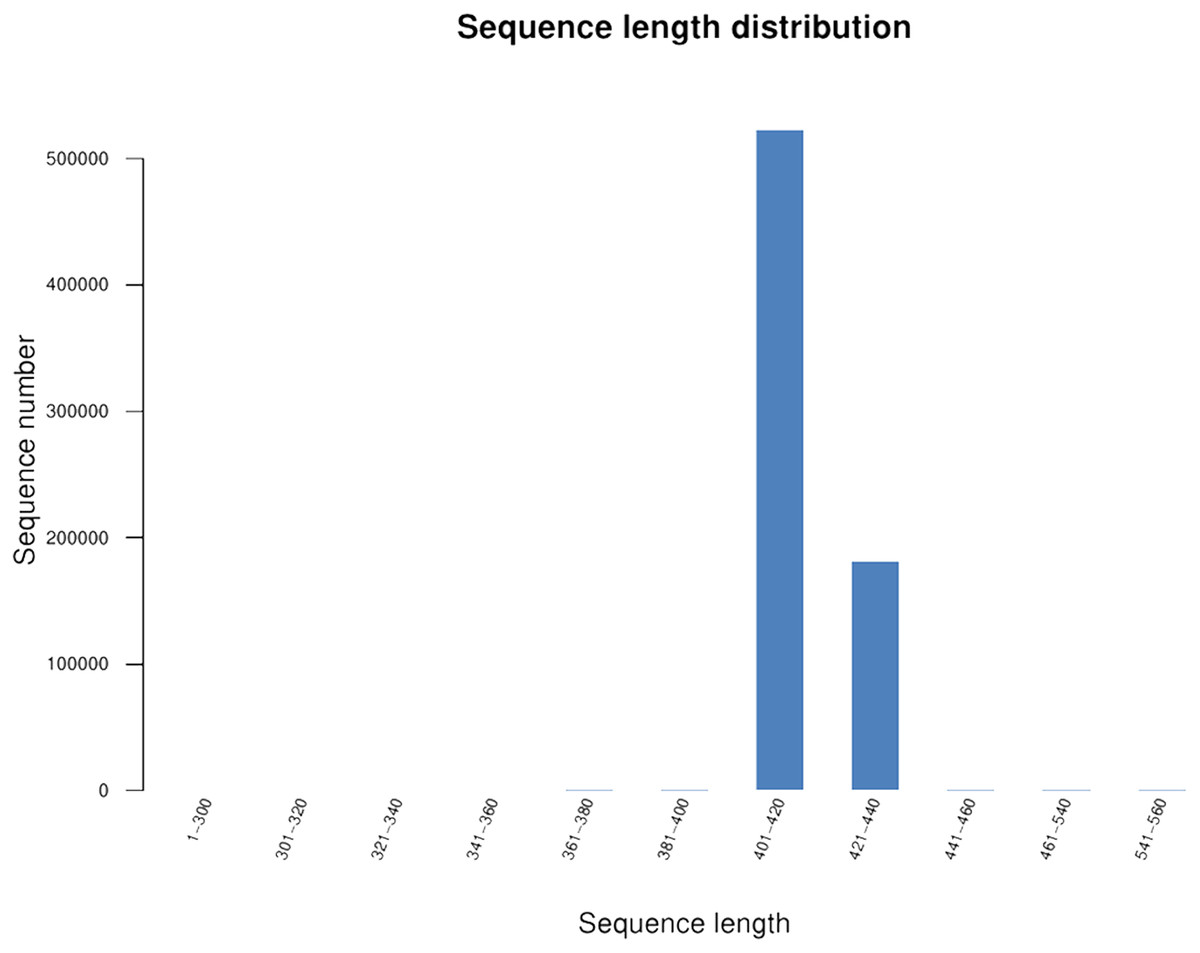
Figure 1: Length distribution of the clean sequences.
The x-axis indicates the sequence lengths and the y-axis represents the sequence numbers.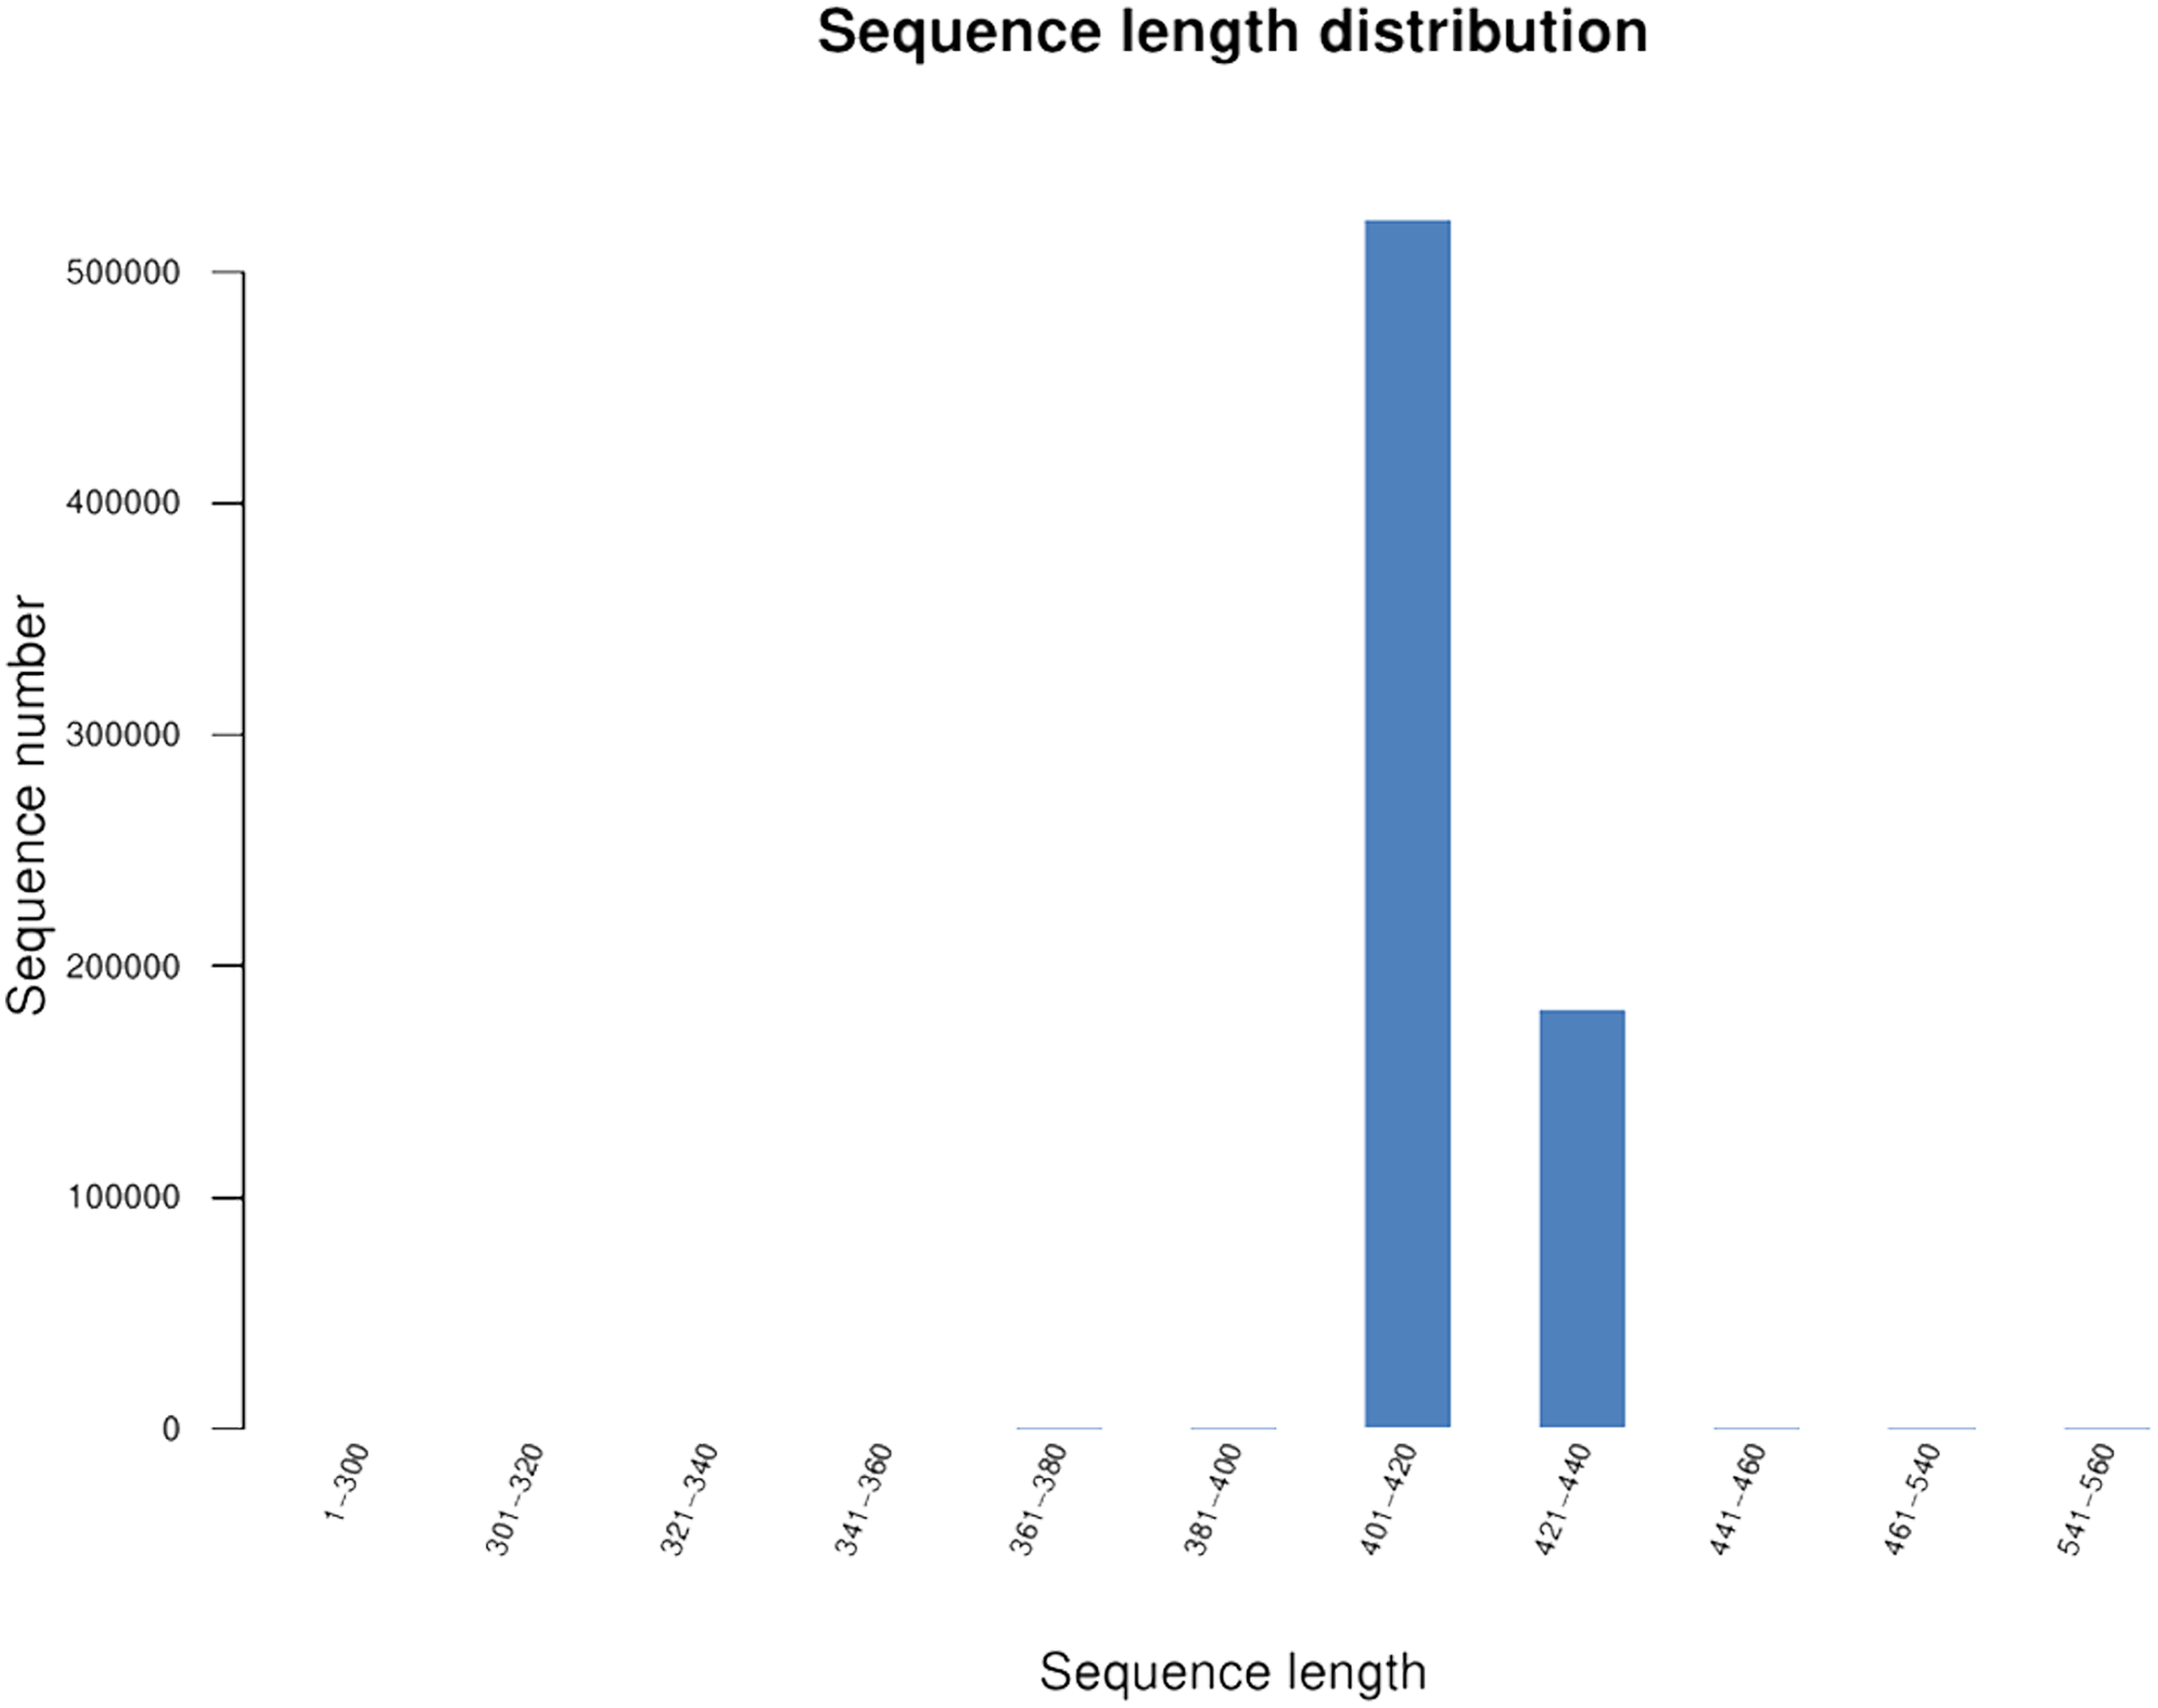
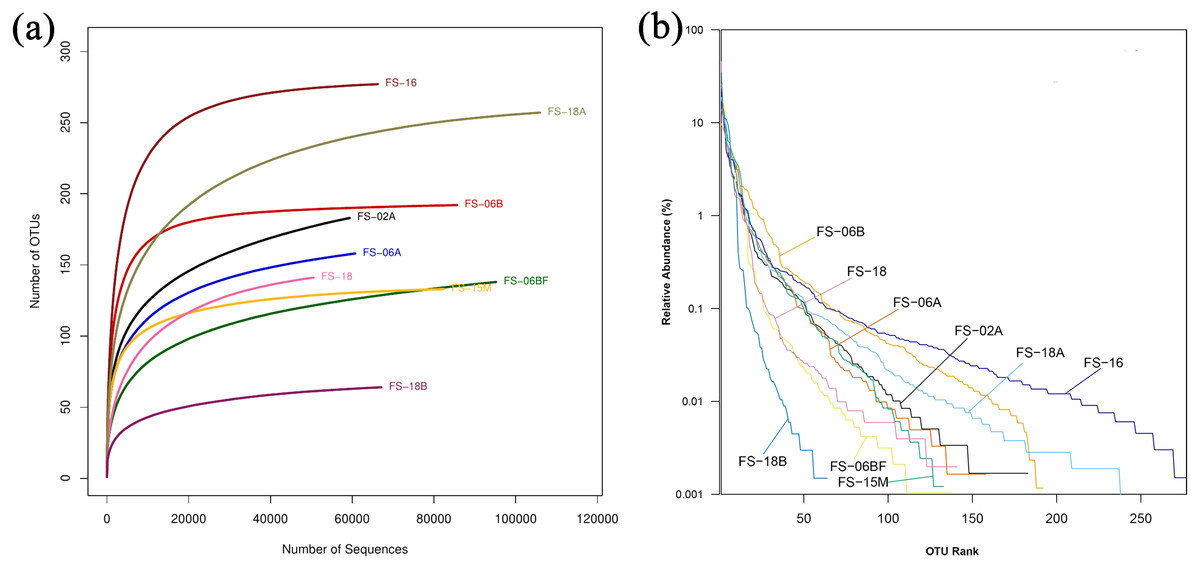
Figure 2: Rarefaction curves and rank abundance curves for the nine samples.
Different colored lines are different samples. (A) Rarefaction curves reflect the rationality of the sequencing data size and abundance. (B) Rank abundance curves reflect the evenness and abundance horizontally and vertically.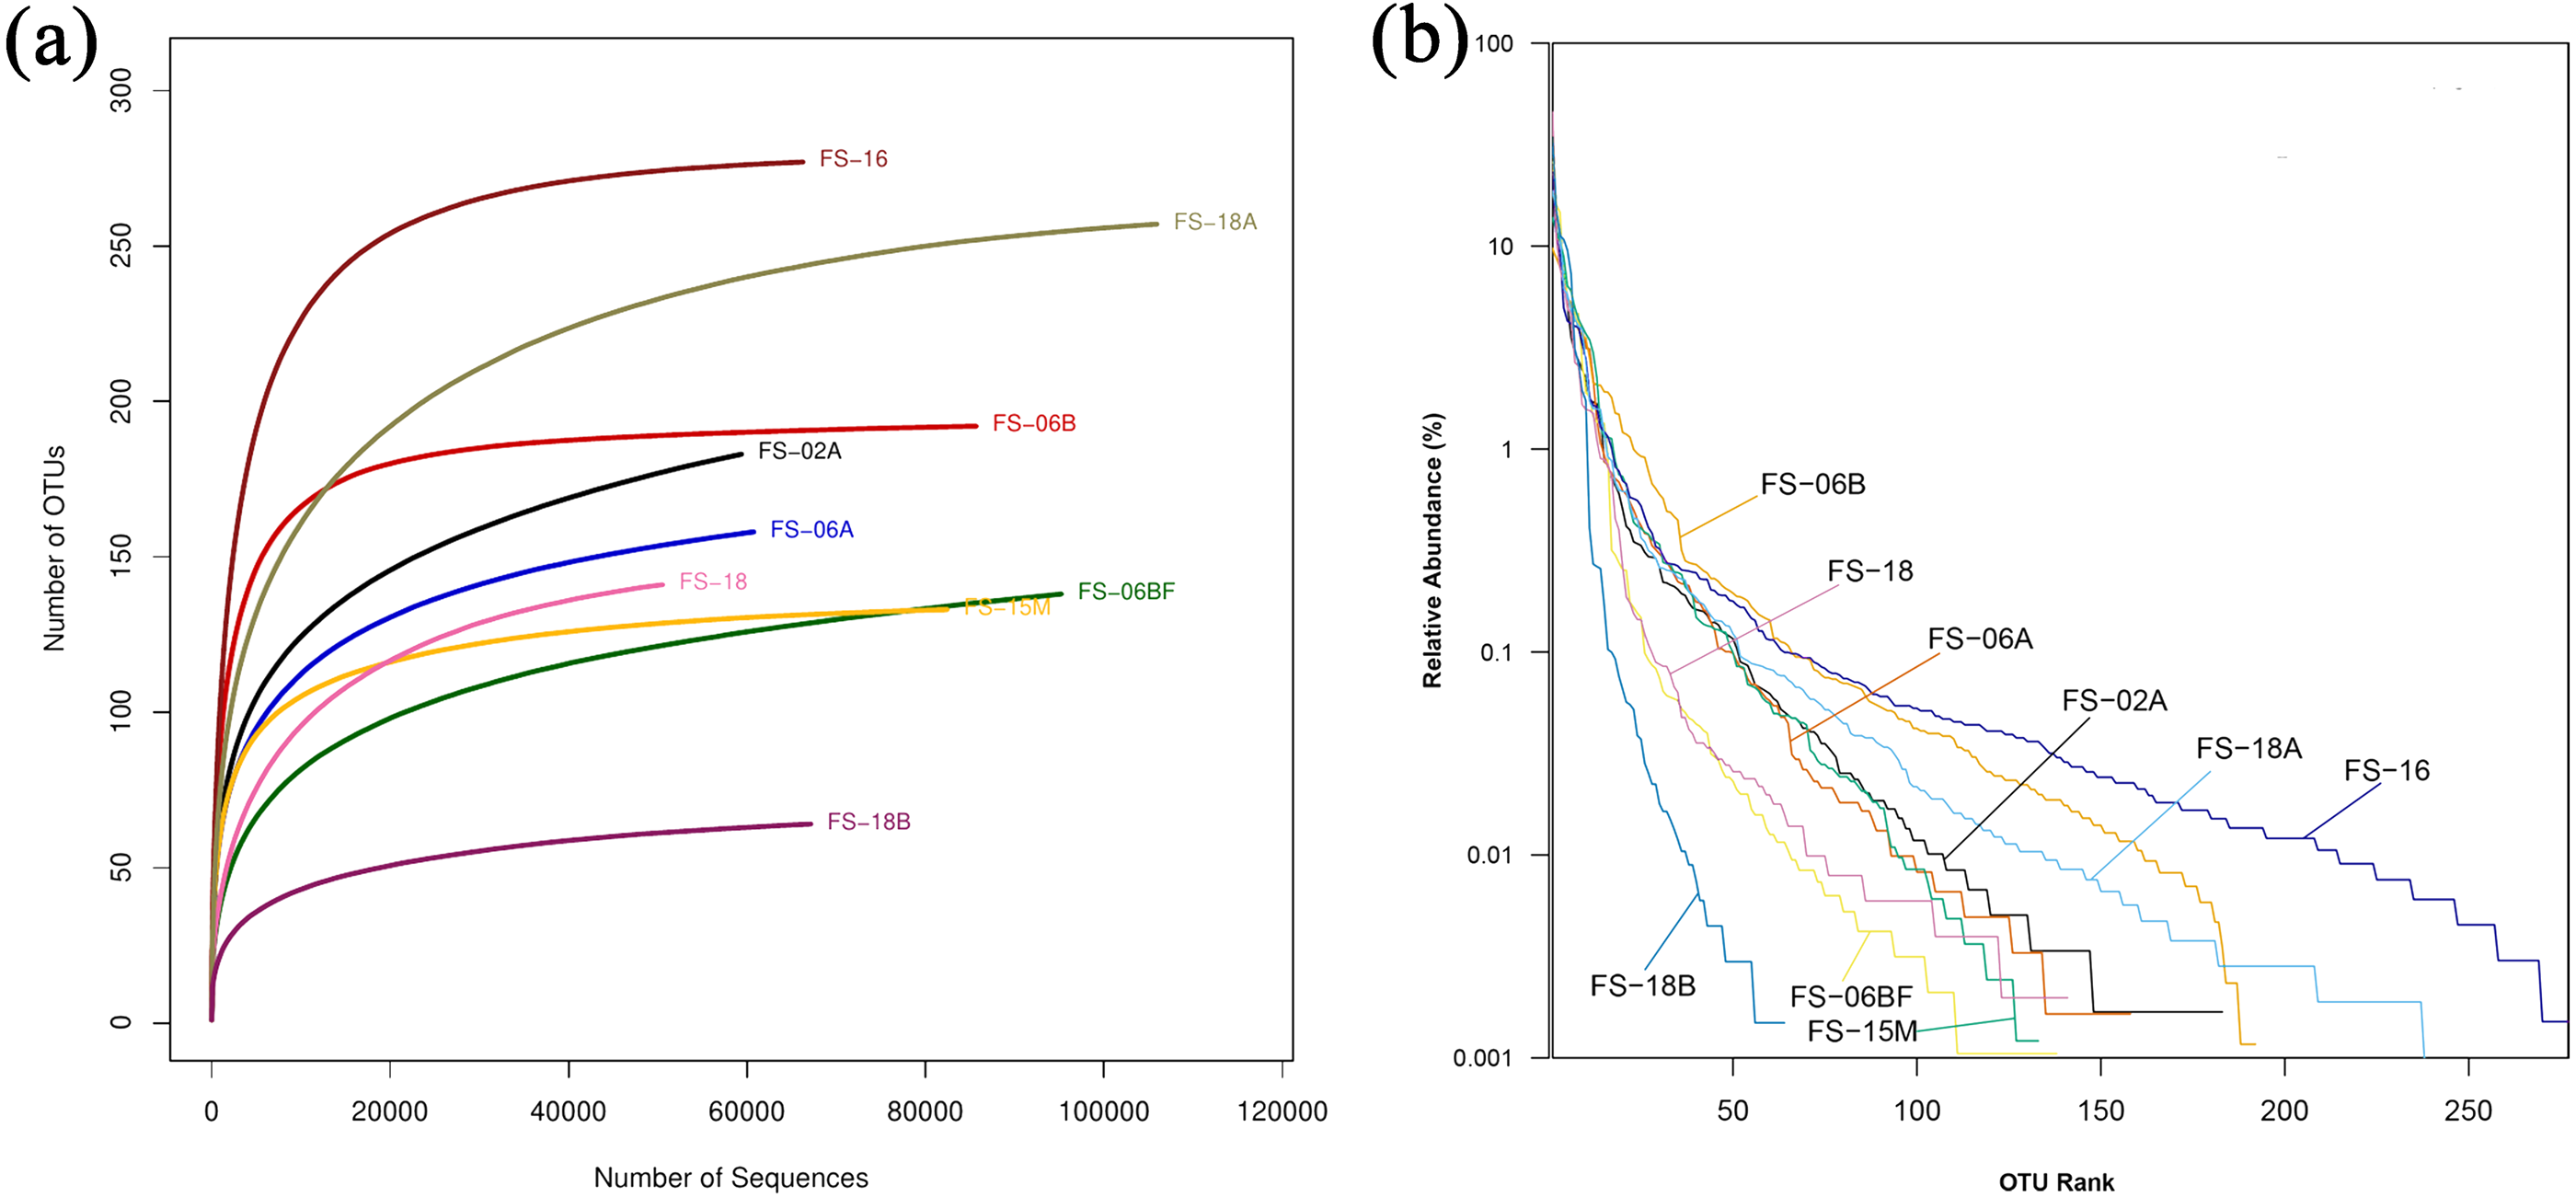
| Sample | Ace | Chao1 | Shannon | Simpson | coverage |
|---|---|---|---|---|---|
| FS-02A | 219 | 218 | 2.72 | 0.1509 | 0.999394 |
| FS-06A | 176 | 186 | 2.92 | 0.1023 | 0.999605 |
| FS-06B | 194 | 194 | 3.61 | 0.0455 | 0.999942 |
| FS-06BF | 180 | 180 | 2.49 | 0.1313 | 0.999706 |
| FS-15M | 135 | 135 | 3.09 | 0.0709 | 0.999915 |
| FS-16 | 279 | 279 | 3.33 | 0.0869 | 0.999879 |
| FS-18 | 153 | 150 | 2.21 | 0.2365 | 0.999624 |
| FS-18A | 268 | 263 | 3.07 | 0.0882 | 0.999811 |
| FS-18B | 71 | 68 | 2.06 | 0.1817 | 0.999866 |
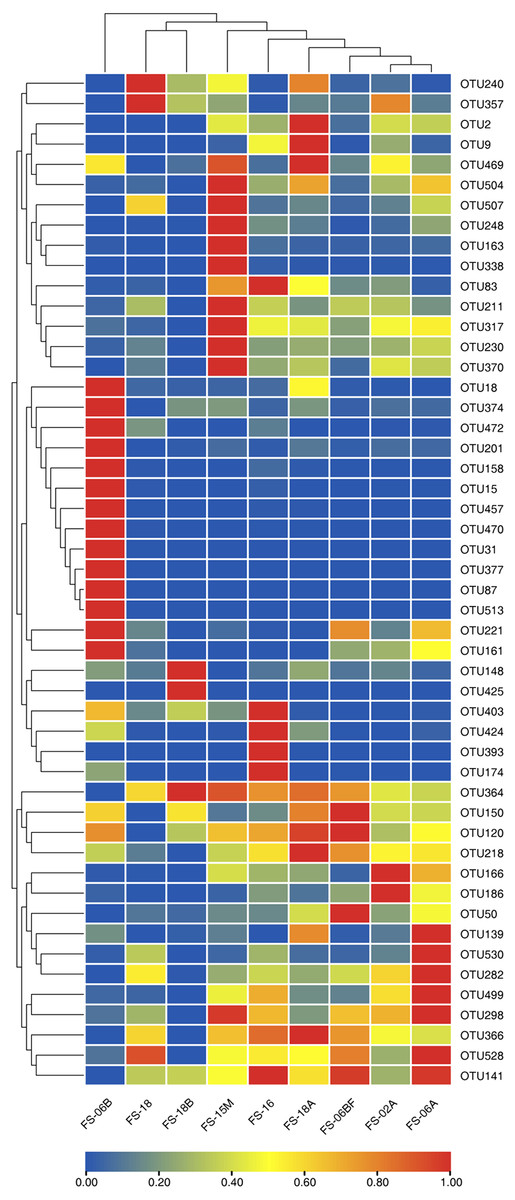
Figure 3: Clustering heatmap showing the 50 most abundant operational taxonomic units (OTUs).
The x-axis indicates the nine samples and the y-axis represents the 50 most abundant OTUs. Each color in the middle heatmap represents the relative abundance of the OTU in that row after normalization. The redder the color, the greater the abundance of the OTU in the sample.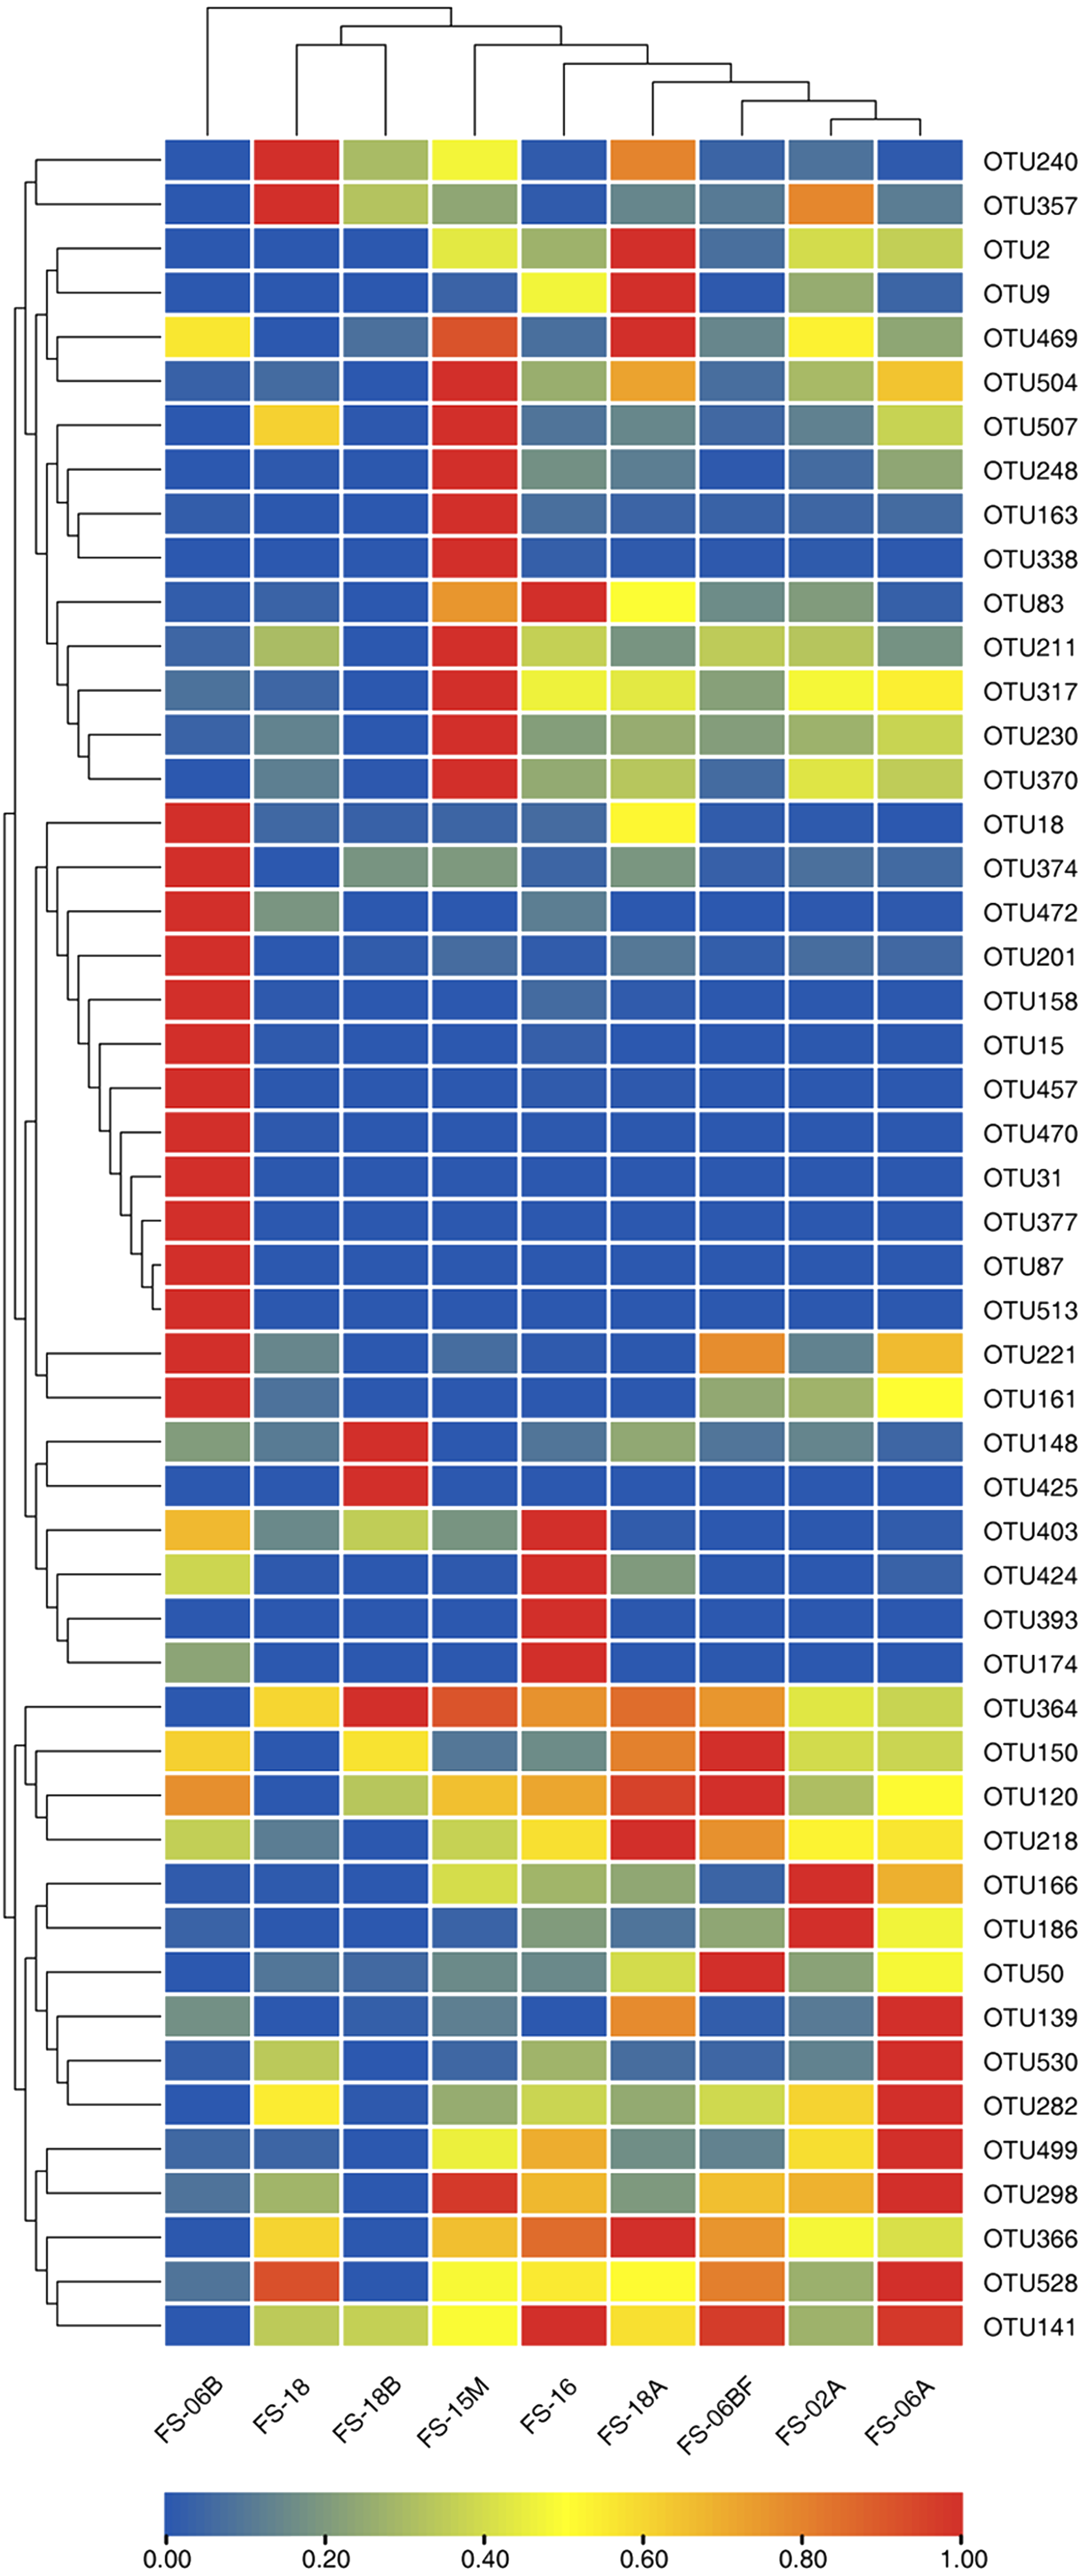
Composition of Sunda pangolin gut microbiota
The detected bacteria were classified into 14 phyla, 24 classes, 48 orders, 97 families, and 271 genera. The gut microbiomes were dominated by bacteria in the phylum Firmicutes (73.71%), followed by Proteobacteria (18.42%), Actinobacteria (3.44%), and Bacteroidetes (0.51%) (Fig. 4A). It was rich in the families Clostridiaceae (31.97%), Peptostreptococcaceae (21.68%), Enterobacteriaceae (15.34%), Lachnospiraceae (7.58%), Streptococcaceae (4.96%), Planococcaceae (1.47%), Ruminococcaceae (1.43%), Lactobacillaceae (1.39%), and Nocardiaceae (1.2%), followed by Erysipelotrichaceae, Enterococcaceae, Bacillaceae, Xanthomonadaceae, Rhodobacteraceae, Corynebacteriaceae, and Brucellaceae. The principal genera were Clostridium_sensu_stricto_1 (29.42%), Escherichia-Shigella (13.57%), Terrisporobacter (10.39%), Lactococcus (4.92%), Epulopiscium (4.41%), Clostridium_sensu_stricto_13 (1.78%), and Morganella (1.73%), followed by Lactobacillus, Sporosarcina, Cellulosilyticum, Staphylococcus, Bacteroides, and Bacillus (Fig. 4B). We also identified several genera that are likely involved in chitin digestion. Lactococcus (Vaaje-Kolstad et al., 2009) and Bacteroides (Borrelli et al., 2017) were abundant (Fig. 5), followed by Bacillus (Gooday, 1990) and Staphylococcus (Wadström, 1971).
Table 2 shows the alpha-diversity indices (including Chao1, Ace, Shannon, and Simpson). These indices reflected the number of OTUs and the diversity in the nine samples was high. Two-dimensional PCoA and NMDS based on the Bray–Curtis distance suggested that seven of the nine Sunda pangolin gut microbiomes cluster, which means that the results are reliable and have statistical significance (Fig. 6).
Comparison of the Sunda pangolin with mammals with different diets
To explore whether pangolins underwent convergent evolution with other groups, we compared them to mammals with various diets, including myrmecophages, carnivores, herbivores, folivores, insectivores, and omnivores. Using PCoA and the neighbor-net network of weight UniFrac distance, these data confirmed that Sunda pangolins form a group (PERMANOVA: pangolins vs. other diets, p<0.01), which was close to myrmecophages (aardvarks, anteaters, aardwolves, and armadillos), and distant from carnivores and herbivores (Figs. 7A, 8A). In addition, beta diversity analysis of 56 samples by PCoA of unweighted UniFrac distance revealed that the gut microbiomes of Sunda pangolins formed a distinct cluster clearly separated from other diets (PERMANOVA: pangolins vs. other diets, p<0.001) (Fig. 7B). Moreover, the network reconstructed from the unweighted UniFrac distances also showed that Sunda pangolins differed from other diets (Fig. 8B). These findings all demonstrate that Sunda pangolin gut microbiomes are close to those of myrmecophages and carnivores, and distant from herbivores.
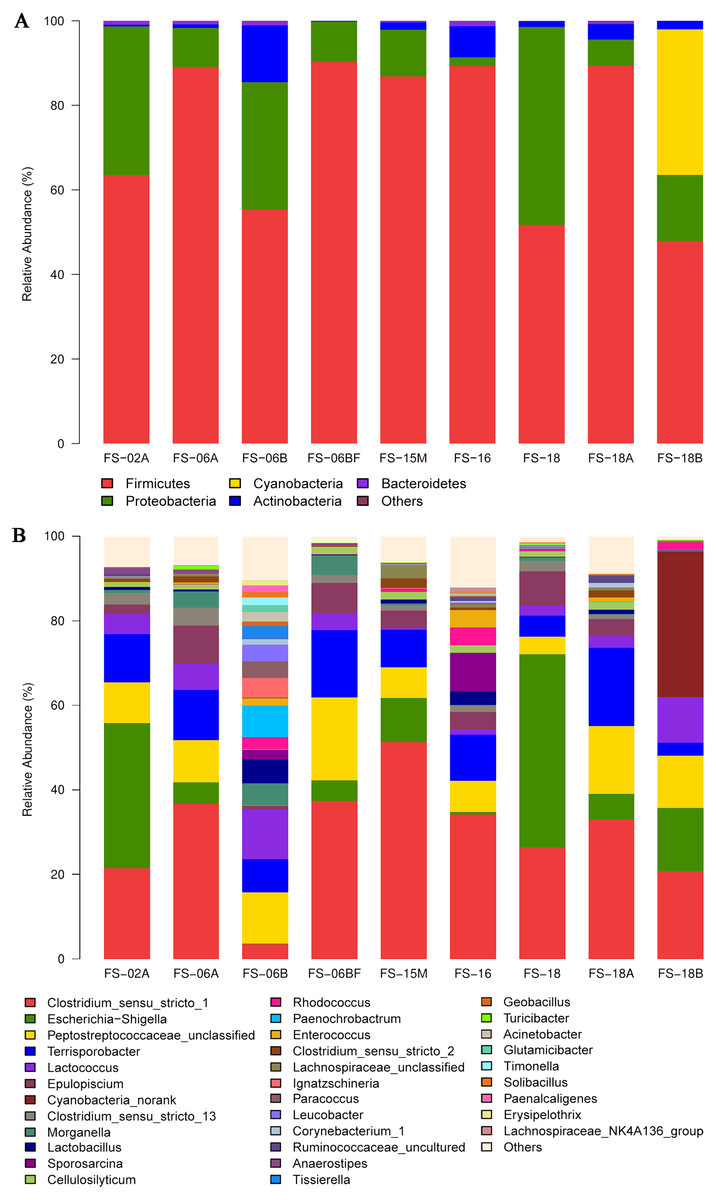
Figure 4: Sunda pangolin gut microbial composition.
(A) The phylum levels. (B) The genus levels. The x-axis indicates the nine samples and the y-axis represents the relative abundance.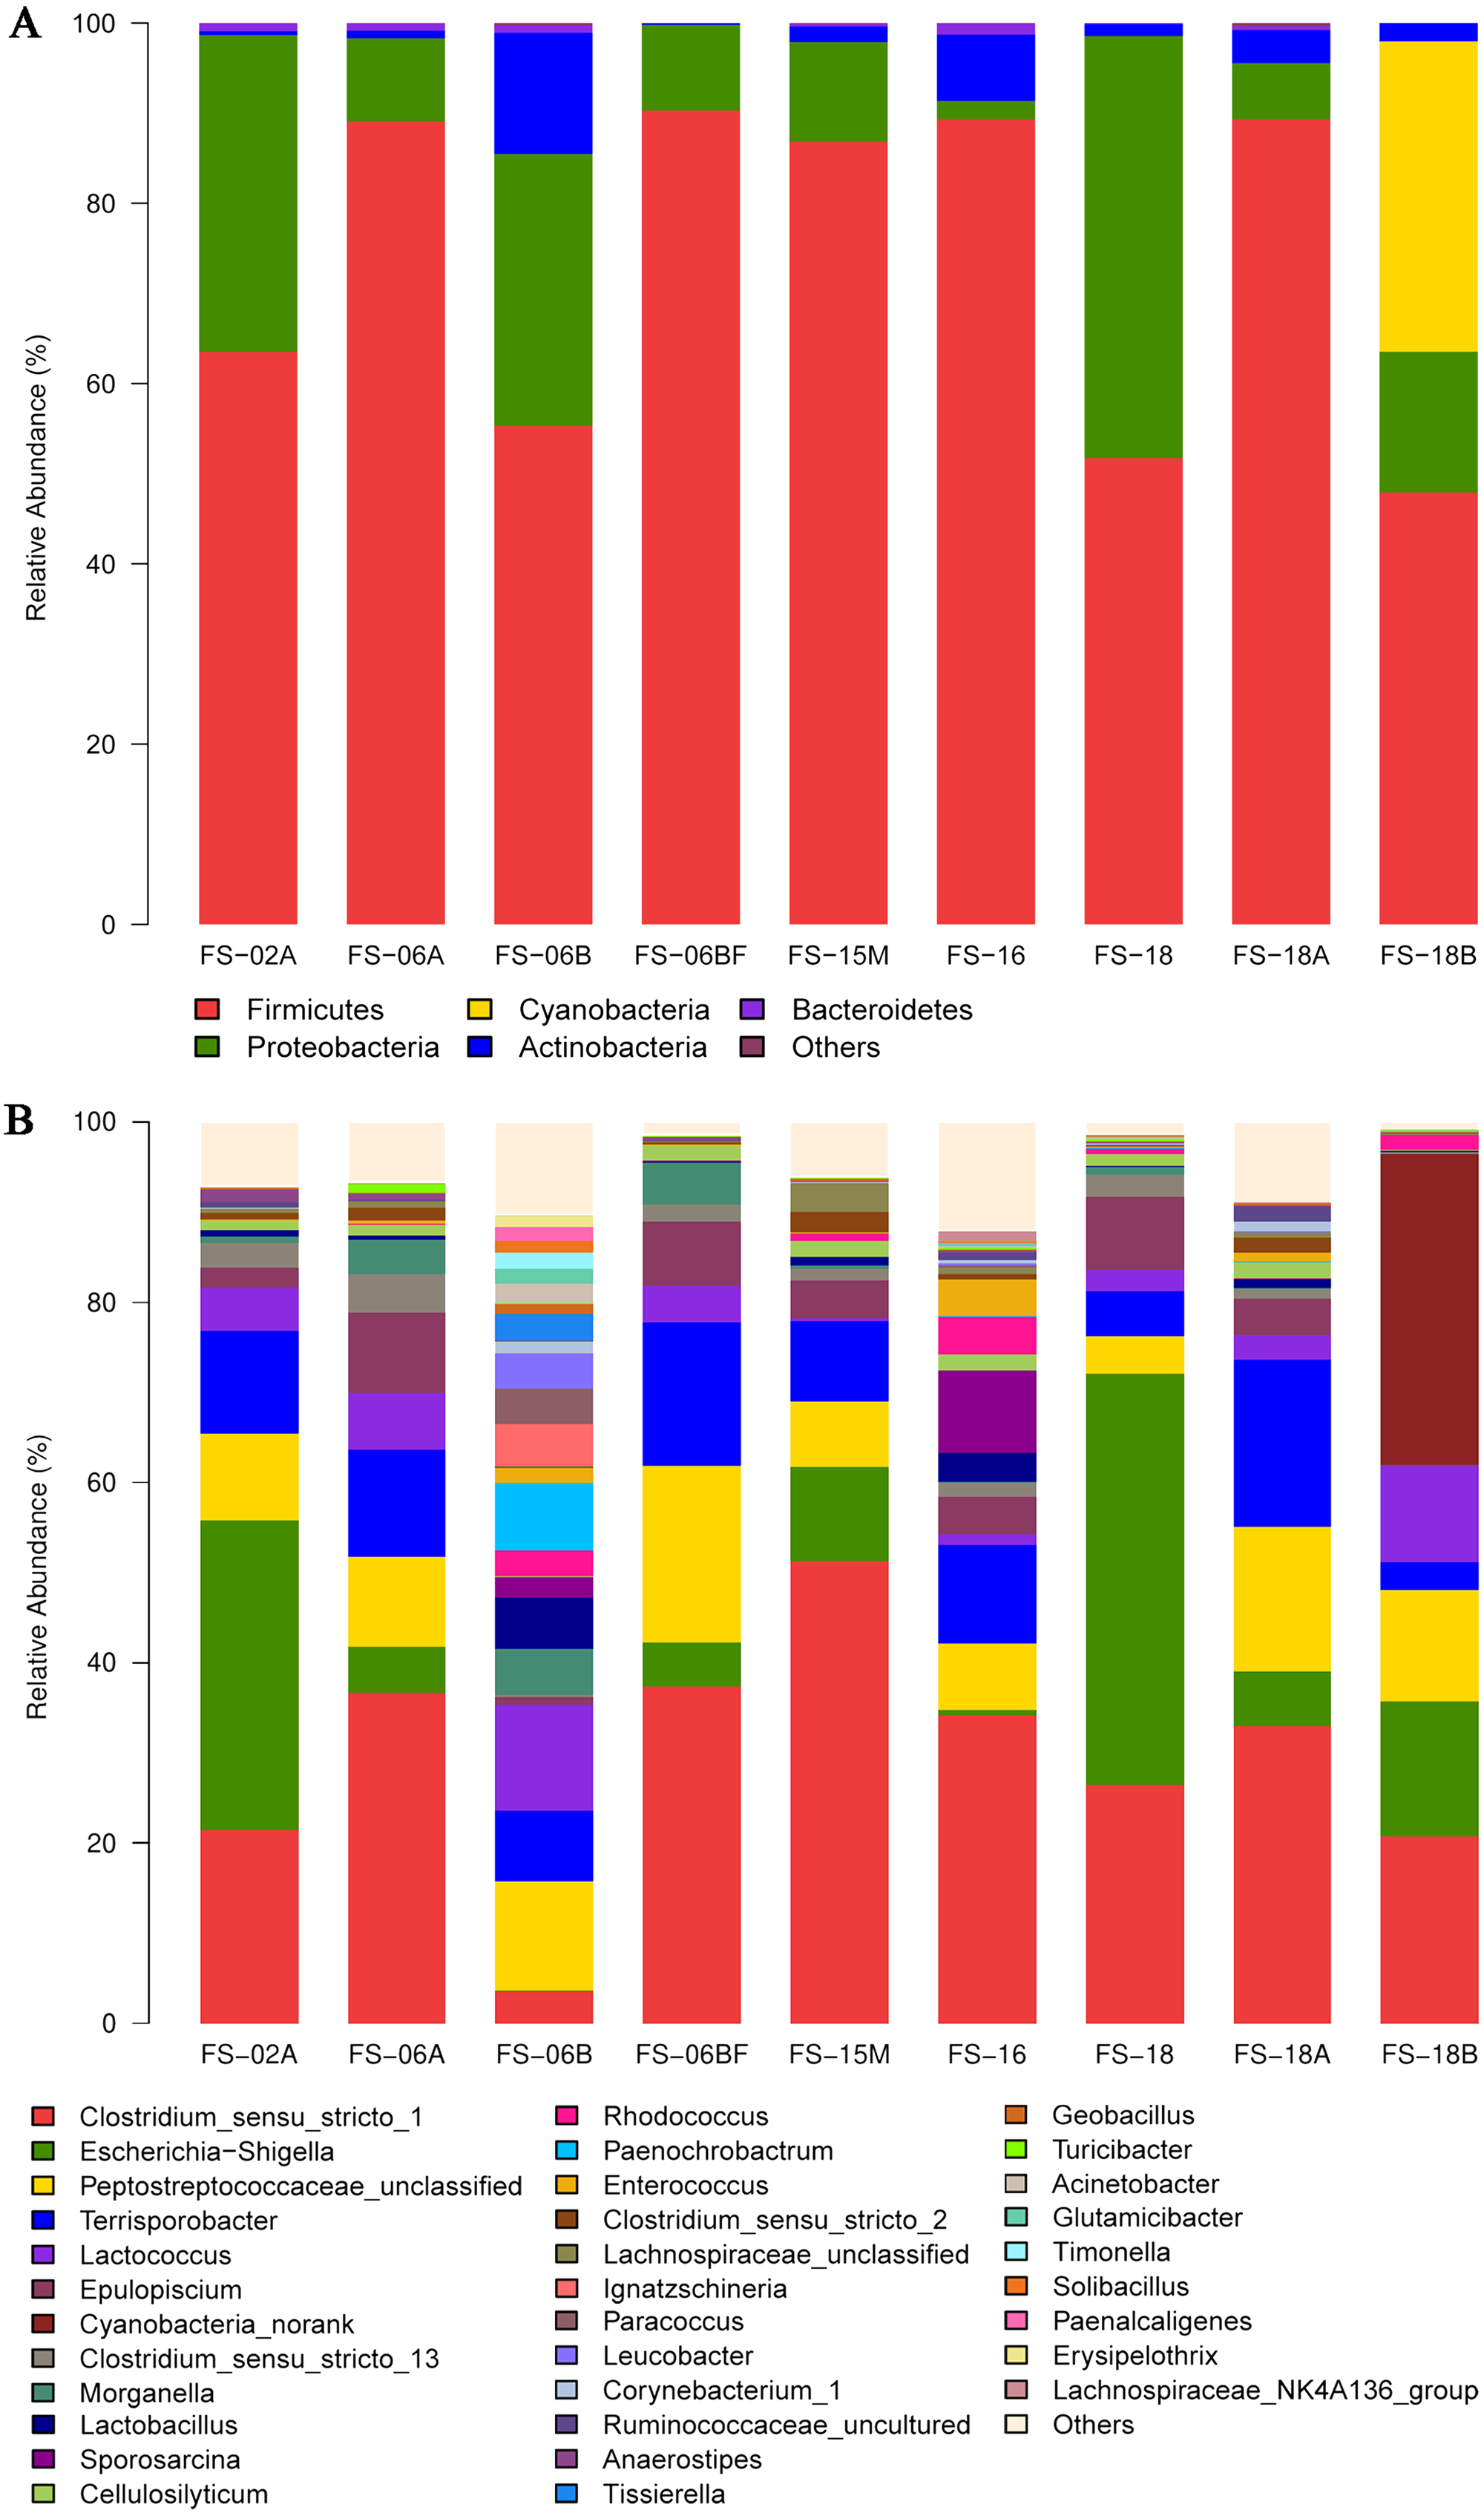
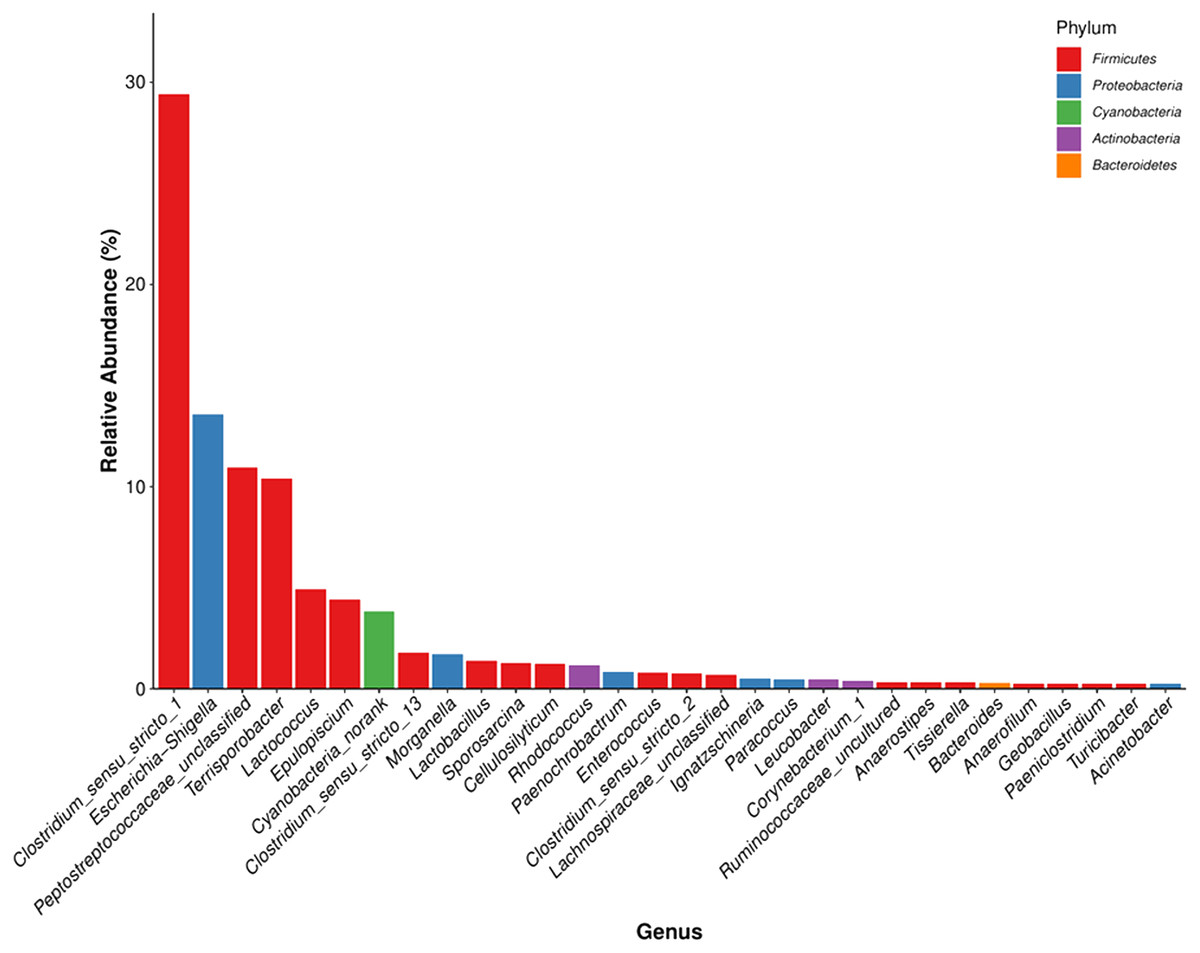
Figure 5: The microbial community with the greatest abundance of all samples at the genus level. The corresponding phylum level classification of the microbiomes is also shown.
The same color represents the same phylum. The x-axis indicates the genus level and the y-axis represents relative abundance.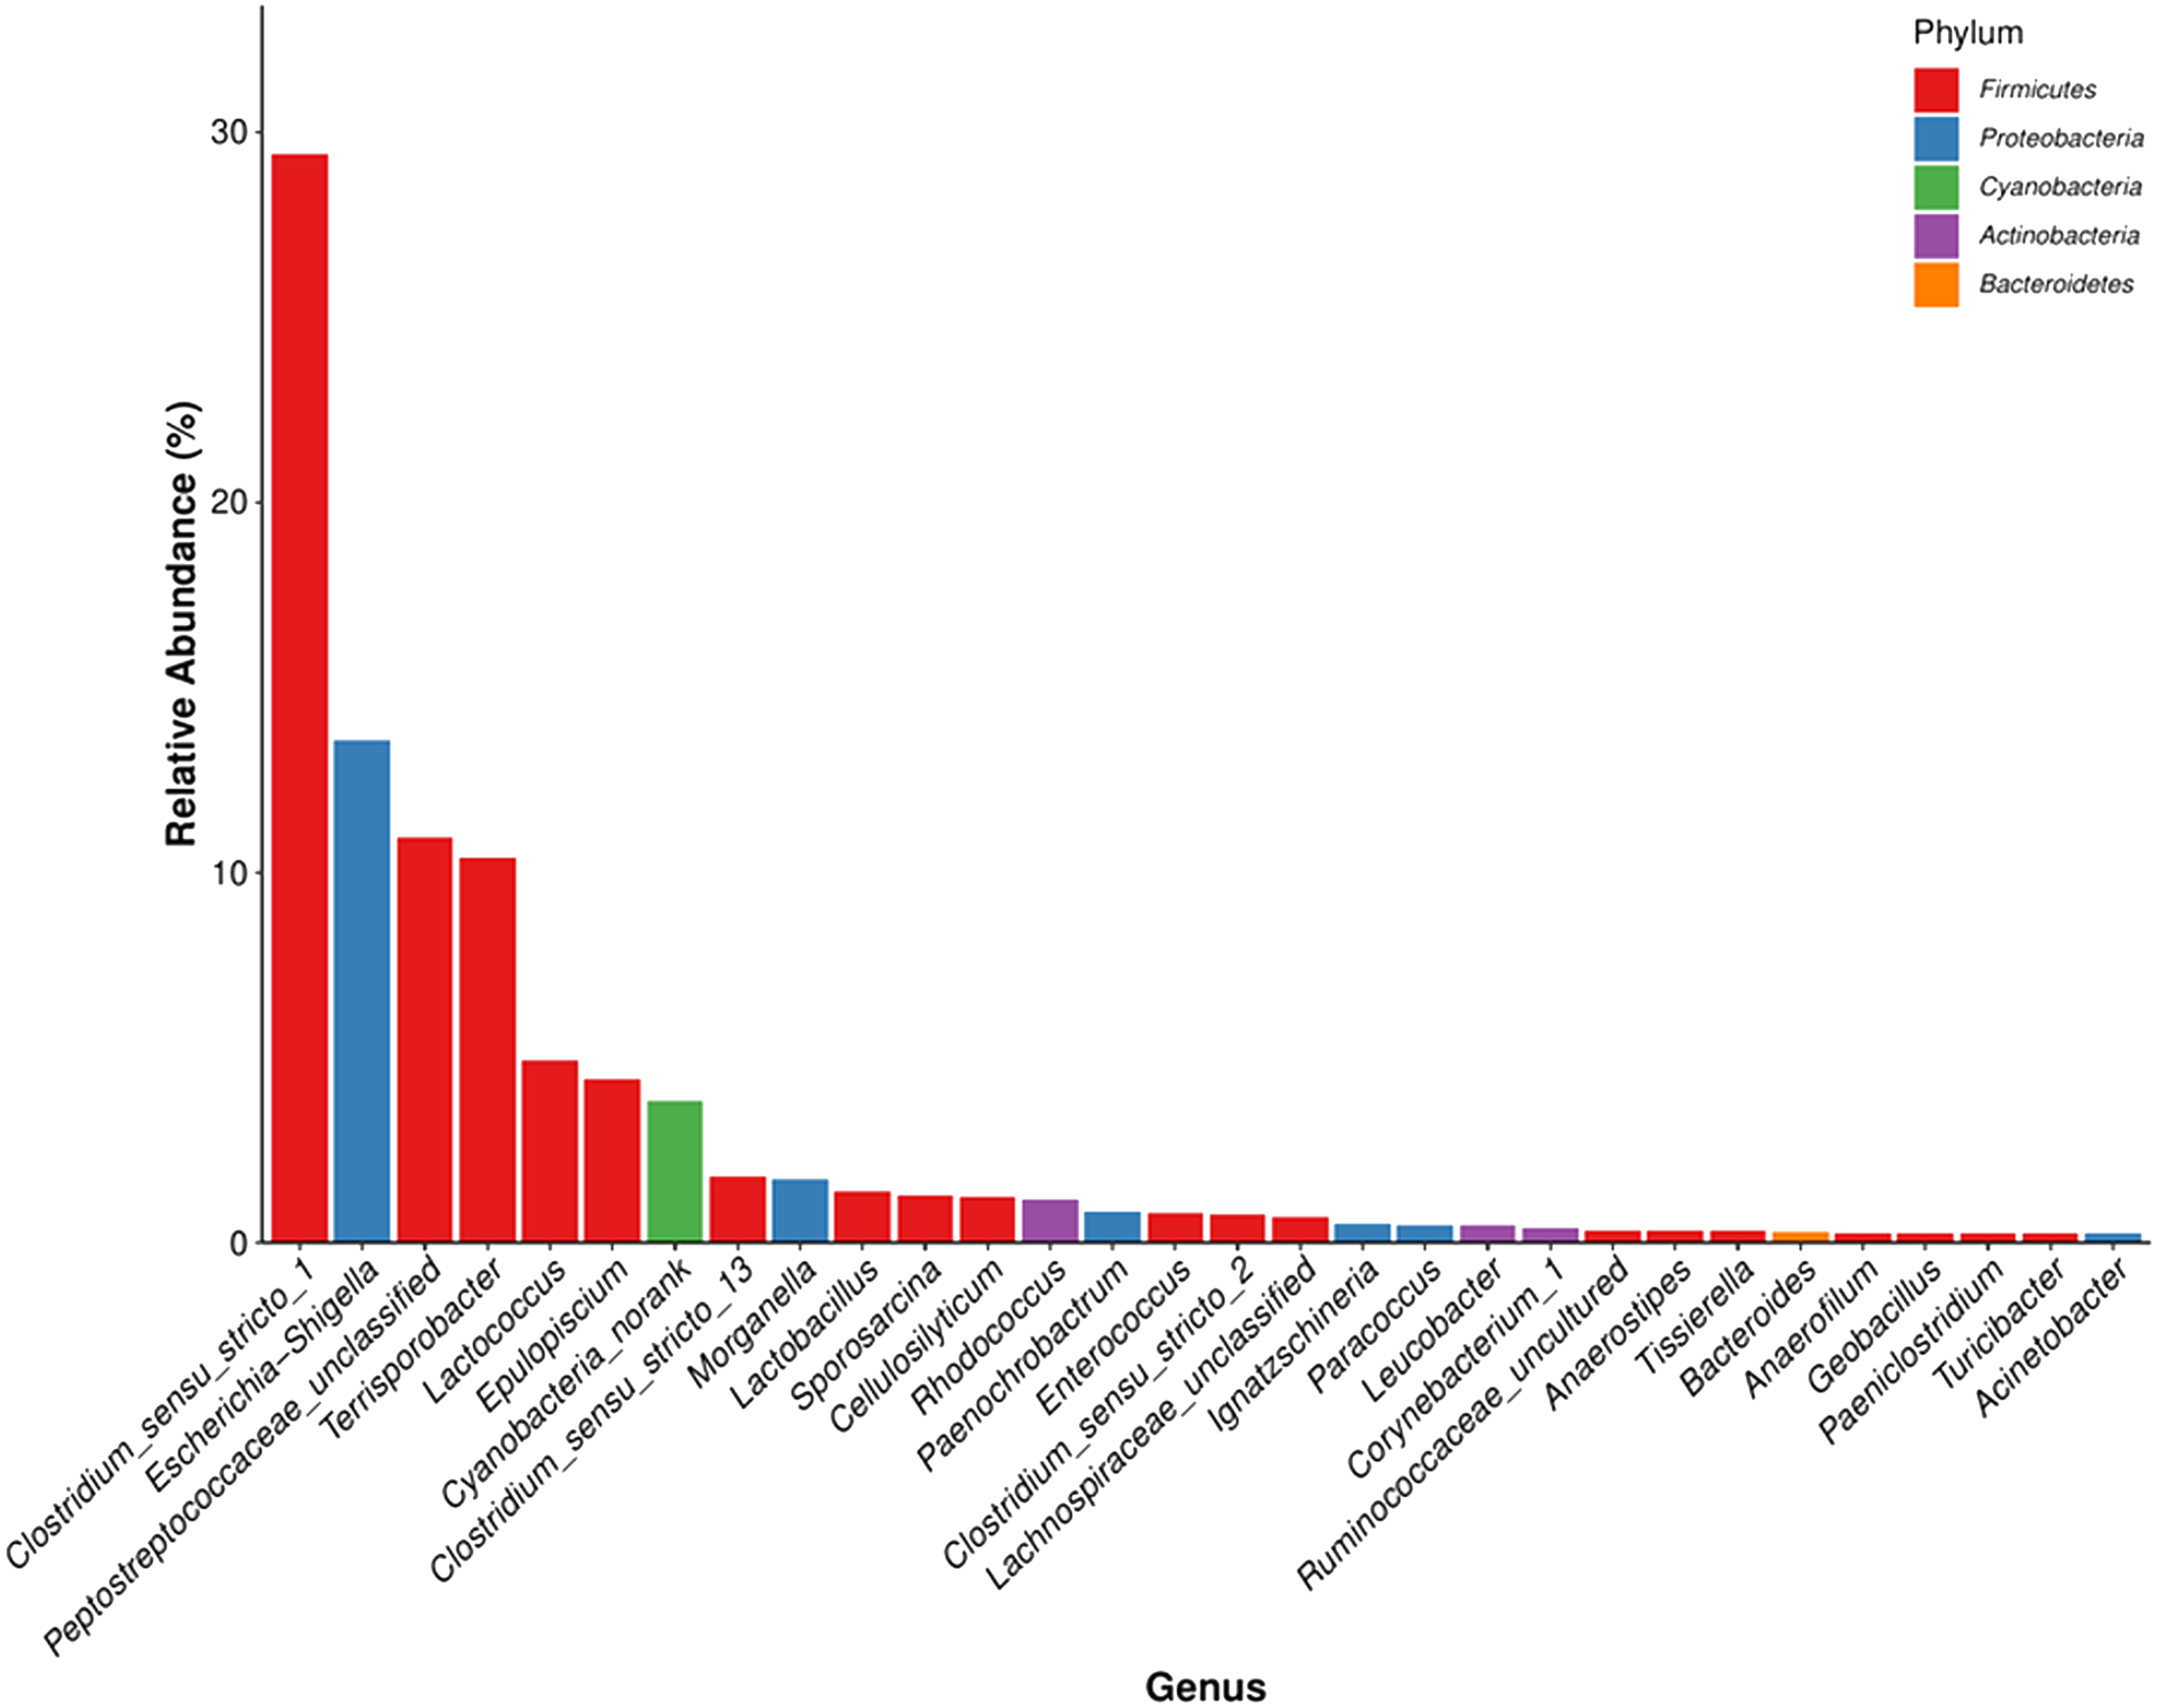
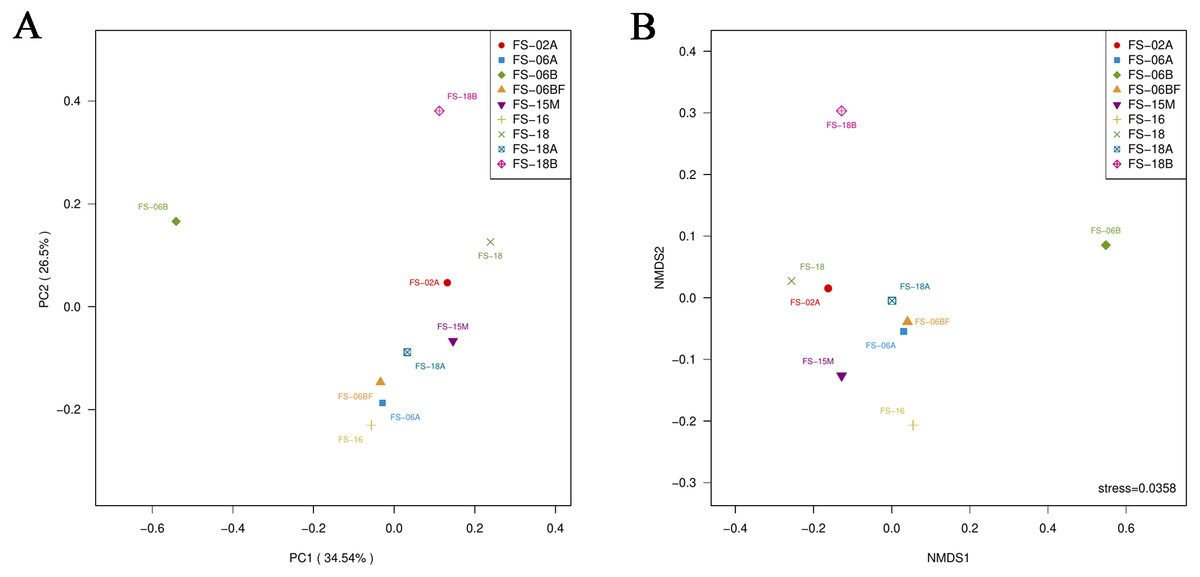
Figure 6: Principal coordinates analysis plot (A) and nonmetric multidimensional scaling (B) of the nine samples based on Bray–Curtis distances.
The distances between the sample points represent the similarity of the microbiota in the samples. A closer distance represents greater similarity and samples that cluster together have a similar microbiota.
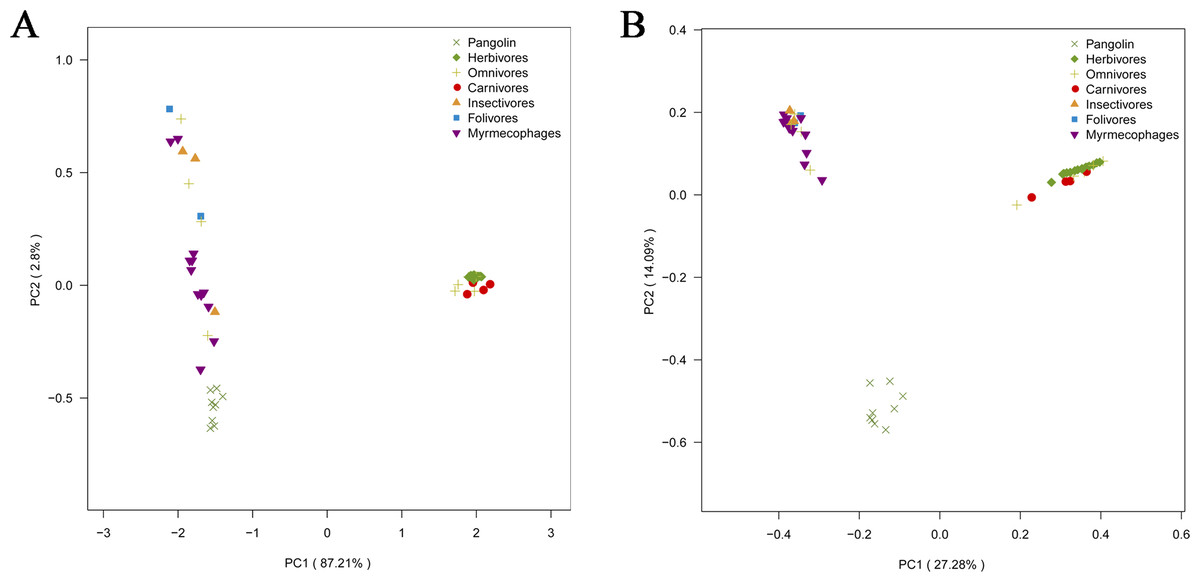
Figure 7: Principal coordinates analysis plot of 56 samples.
(A) Based on weighted UniFrac distances. (B) Based on unweighted UniFrac distances. These samples were divided into seven categories. Samples in the same group are represented by the same color and shape. PC1_vs_PC2 is the PCoA plot obtained from the first and second main coordinates; the x- and y-axis represent the first and second main coordinates, respectively. The distances between the sample points represent the similarity of their microbiotas. A closer distance represents greater similarity and samples that cluster together have a similar microbiota.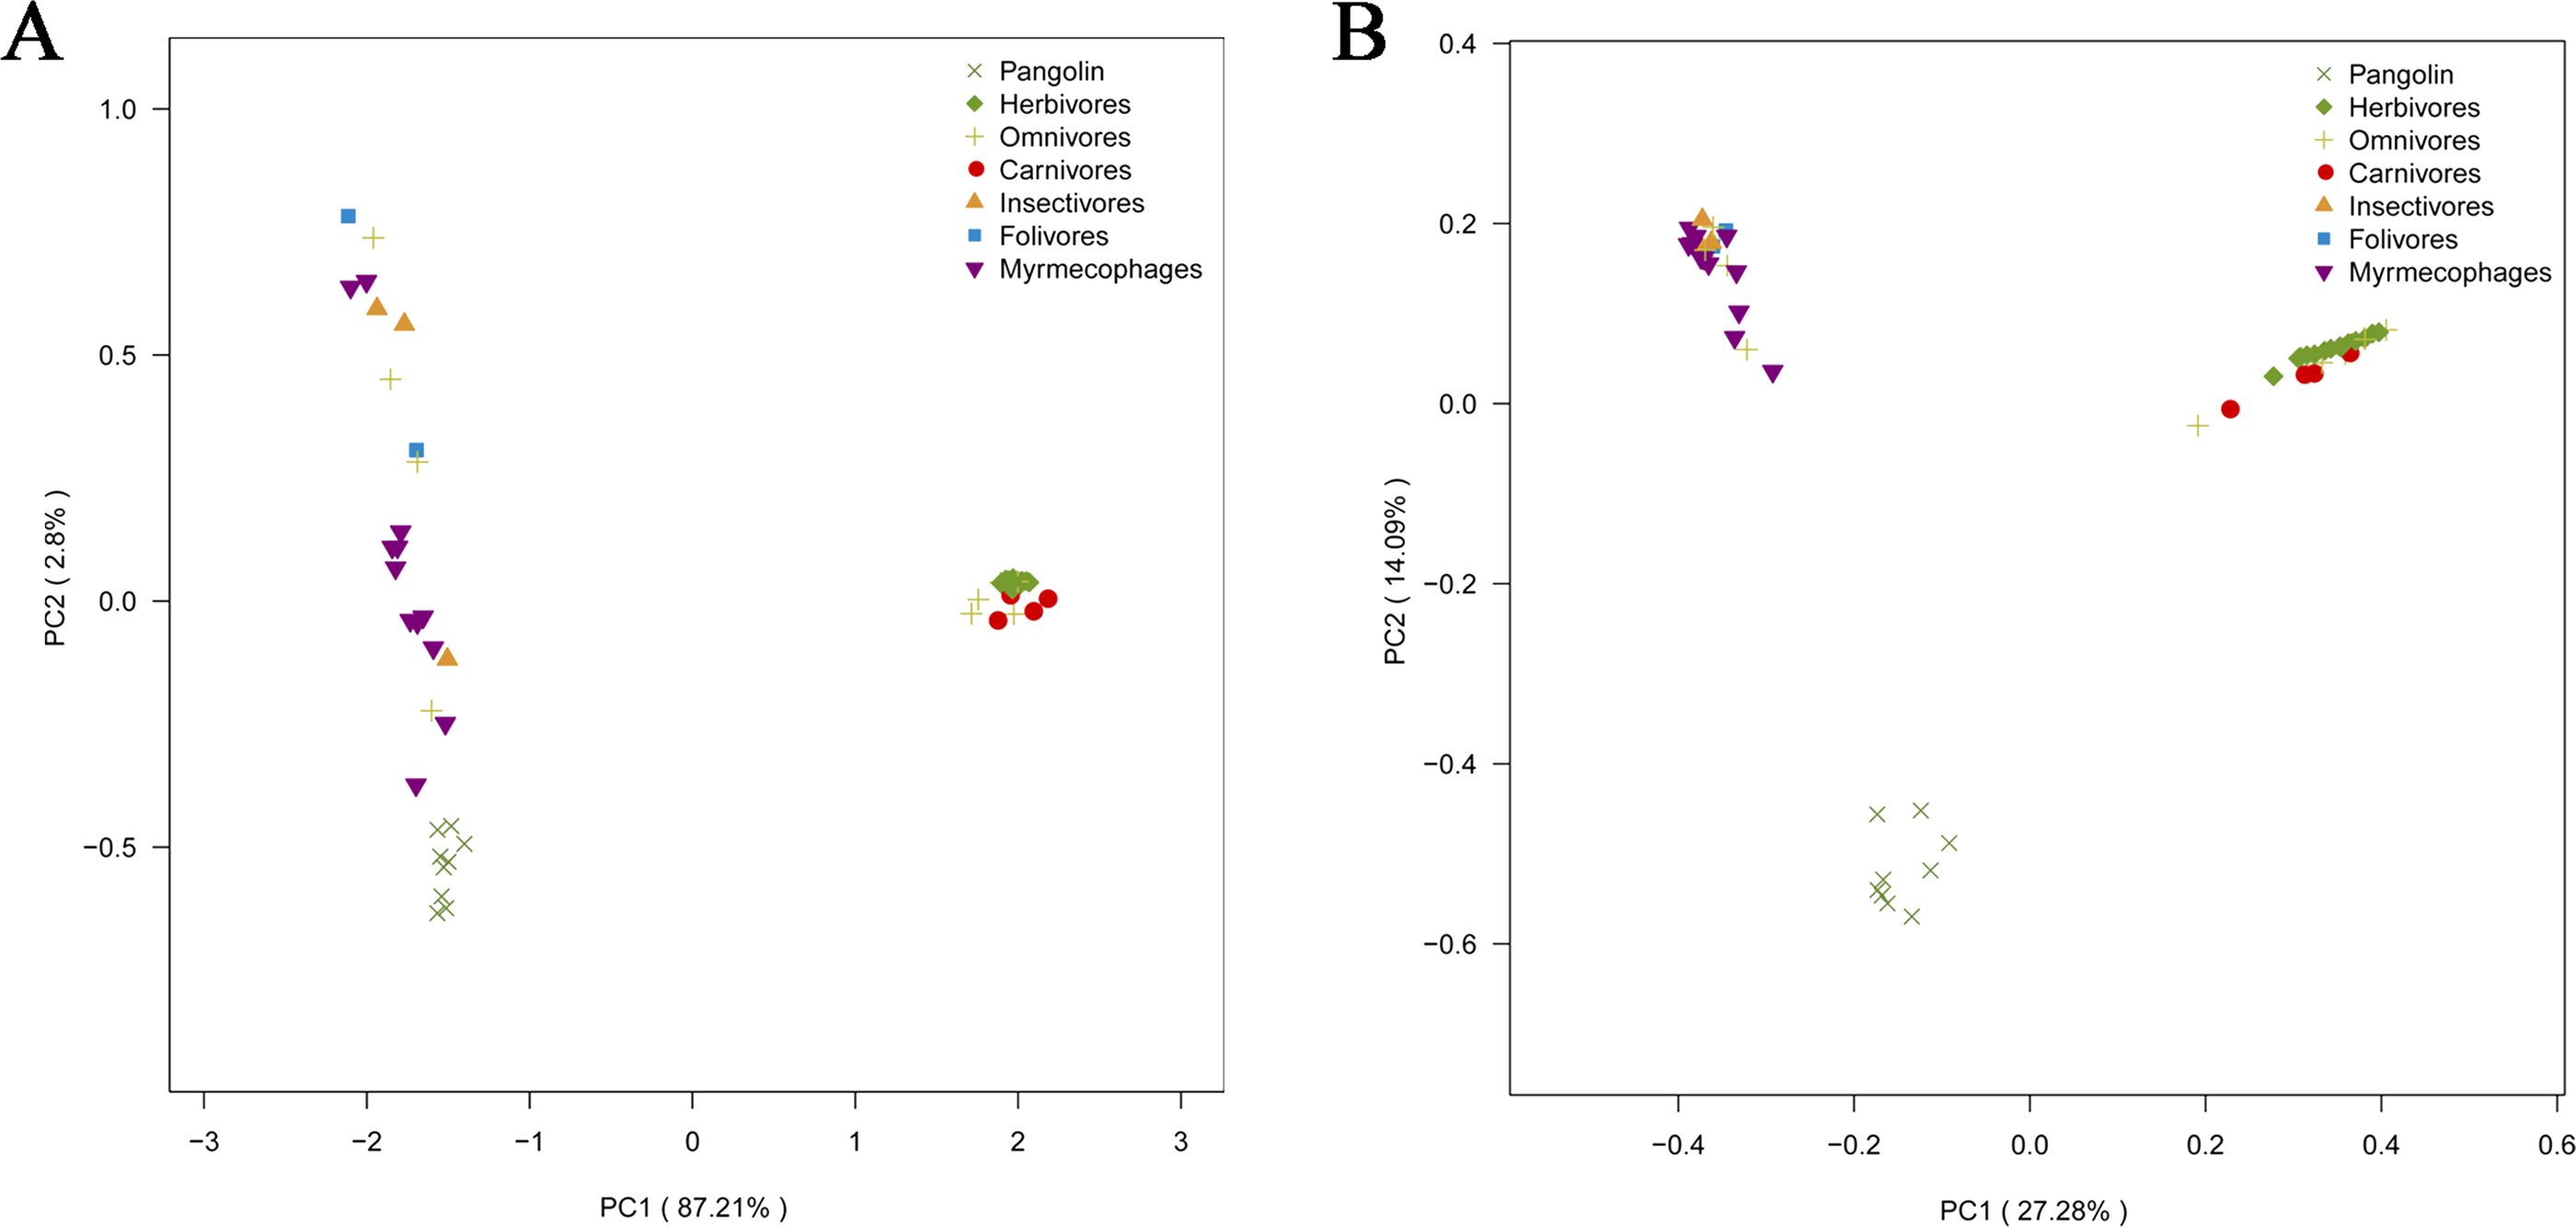
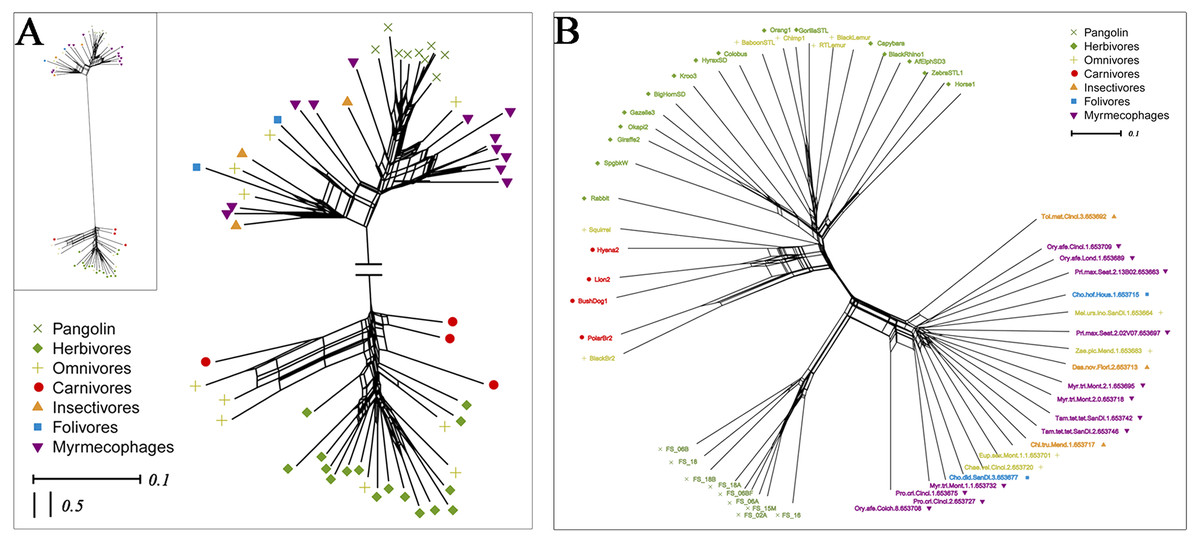
Figure 8: Neighbor-net network of 56 samples.
(A) Based on weighted UniFrac distances. (B) Based on unweighted UniFrac distances. These samples were divided into seven categories. Samples in the same group are represented by the same color and shape.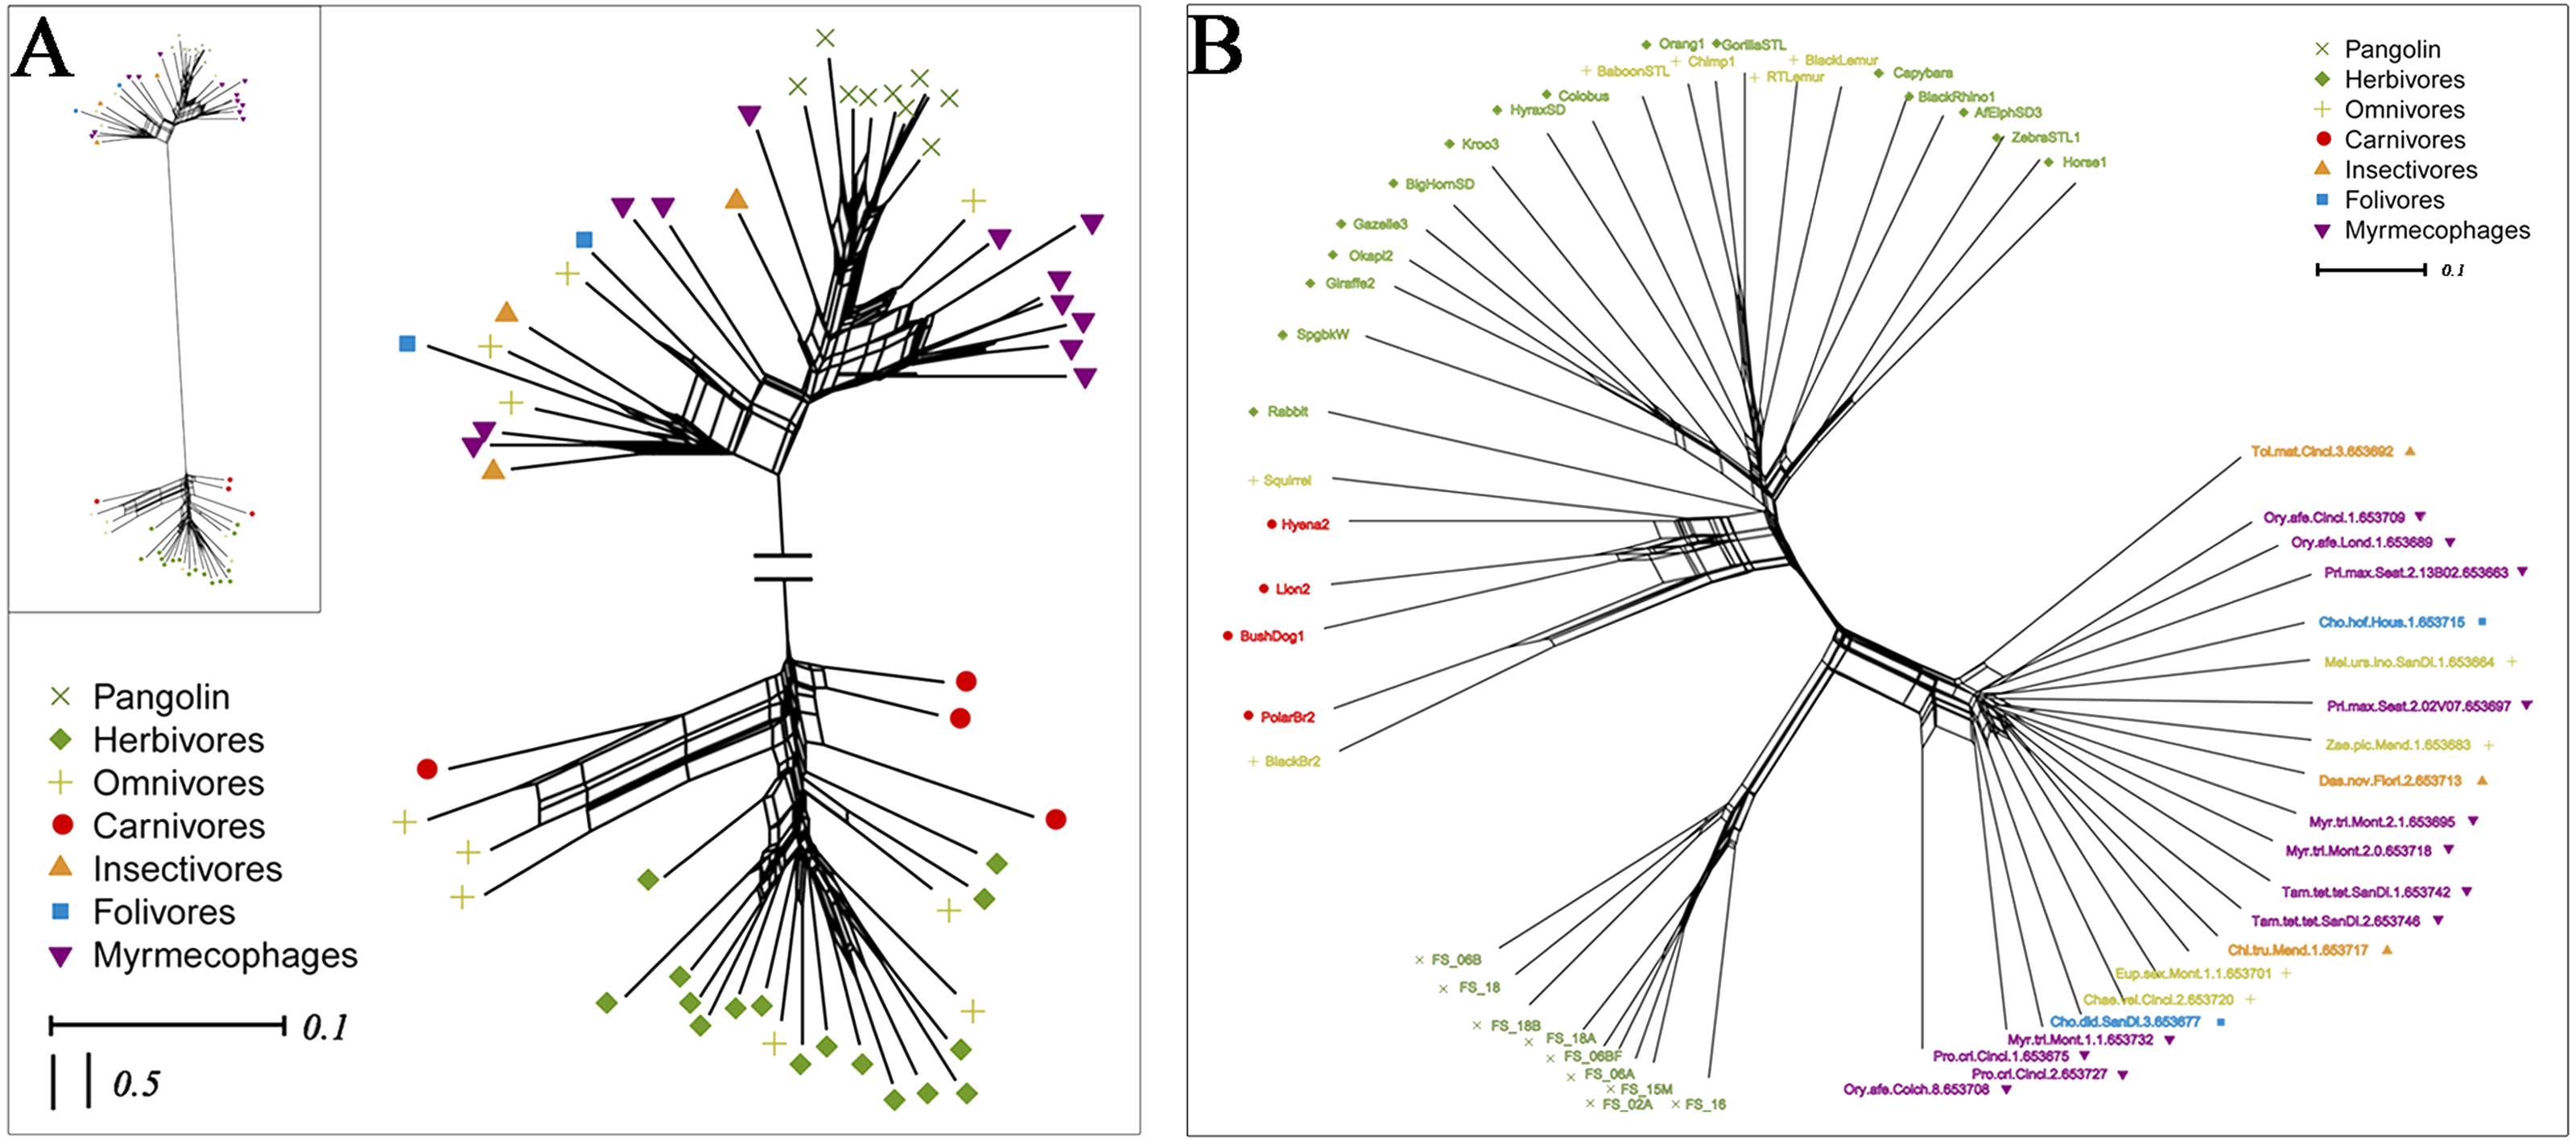
Discussion
This work investigated the composition of the gut microbiomes of nine captive Sunda pangolins. Their microbial communities were dominated by Firmicutes (73.71%), Proteobacteria (18.42%), Actinobacteria (3.44%), and Bacteroidetes (0.51%), which is similar to the three wild Sunda pangolins gut microbiomes [Firmicutes (41%), Proteobacteria (24%), and Bacteroidetes (18%)] (Yang, 2017). The wild Sunda pangolins gut microbiomes were enriched in Lactobacillaceae (20%), Bacteroidaceae (17%), Enterobacteriaceae (14%), and Clostridiaceae (12%), followed by Streptococcaceae, Ruminococcaceae, and Lachnospiraceae, which is similar to our results (Yang, 2017). At the genus level, wild Sunda pangolin gut microbiomes were enriched in Lactobacillus (20%), Bacteroides (17%), Clostridium (12%), and Escherichia (6%), followed by Streptococcus, Faecalibacterium, and Prevotella (Yang, 2017), which is also similar to our results. However, Ma et al. (2018) suggested that the gut microbiomes of captive Sunda pangolins, which consisted of Bacteroidetes (49.9%), Proteobacteria (32.2%), and Firmicutes (12.6%), were similar to the microbiomes of herbivores, which differed from our results and those of Yang (2017). Captive Sunda pangolin gut microbiomes in genus level had high proportions of Bacteroides, Clostridium, Bacillus, Streptococcus, Lactobacillus, Prevotella, and Enterococcus (Ma et al., 2018). We postulate that this discrepancy was related to the captive environment of the animals because animals living in captivity experience many changes that may influence gut bacteria, including changes in diet, feeding method, captive lifestyle, and the environment (Hyde et al., 2016; Li et al., 2017; McKenzie et al., 2017; Schmidt, Mykytczuk & Schulte-Hostedde, 2019). Compared to wild Sunda pangolins, that captive environment (especially diet) of our Sunda pangolins may be more similar to that in the wild. Our artificial diet appears to be better for Sunda pangolins, and provides good nutrition.
Although the Sunda pangolin is a specialized myrmecophage, our results revealed that their gut microbiomes didn’t converge with those of other myrmecophages, which was similar to the results of Yang (2017), who found that wild Sunda pangolins differed from giant anteaters (Myrmecophaga tridactyla) and the tamandua (Tamandua tetradactyla). Although Sunda pangolins appear to form a distinct group, they were close to myrmecophages and carnivores. This is because pangolins, anteaters, aardvarks, and giant armadillos can be considered specialized myrmecophages with the same feeding habits (Redford, 1987; Reiss, 2001). Moreover, they have similar morphological characteristics, such as loss of teeth, an elongated, sticky tongue used to extract their prey, and powerful claws used to dig into ant and termite nests (Nowak, 1991). Finally, pangolins are the sister group to carnivores and have a close genetic relationship (Miyamoto & Goodman, 1986; Madsen et al., 2001; Murphy et al., 2001; Vanghan, Ryan & Czaplewski, 2015).
Pangolins eat mainly ants and termites that contain chitin in their exoskeletons (Redford & Dorea, 1984). Bacteria are major mediators of chitin degradation in nature (Beier & Bertilsson, 2013). We detected chitinolytic bacteria in Sunda pangolins, including Lactococcus (Vaaje-Kolstad et al., 2009), Bacteroides (Borrelli et al., 2017), Bacillus (Gooday, 1990), and Staphylococcus (Wadström, 1971). Other studies of the gut microbiomes of specialized myrmecophages have found chitinolytic bacteria. For example, the gut microbiome of the wild Sunda pangolin was enriched with Bacteroides and Clostridium (Gooday, 1990; Borrelli et al., 2017; Yang, 2017). Sunda pangolins also contain chitinolytic bacteria such as Staphylococcus (Wadström, 1971), Lactococcus (Vaaje-Kolstad et al., 2009), Enterobacter (Brzezinska, 2006), and Klebsiella (Anand et al., 2010) and so on (Ma et al., 2018). Aardwolf gut microbiomes are enriched in Staphylococcus and Klebsiella (Wadström, 1971; Anand et al., 2010; Delsuc et al., 2014). Further research using shotgun metagenomic approaches is required to elucidate the functional roles of these chitinolytic bacteria.
Conclusions
We studied the composition of the gut microbiomes of the myrmecophagous Sunda pangolin. This revealed that it was distinct from those of mammals with different feeding habits, but much closer to other myrmecophages (aardvarks, anteaters, aardwolves, and armadillos), and distant from herbivores. We also found some chitinolytic bacteria, including Lactococcus, Bacteroides, Bacillus, and Staphylococcus, which may help the Sunda pangolin to digest chitin. Diet may drive the evolution of the Sunda pangolin gut microbiome. The other seven pangolin species should be studied to understand their extreme dietary adaptation better.