
Air pollutants and outpatient visits for influenza-like illness in Beijing, China
- Published
- Accepted
- Received
- Academic Editor
- Hong Yang
- Subject Areas
- Epidemiology, Infectious Diseases, Respiratory Medicine
- Keywords
- Air pollution, ILI, PM2.5, China
- Copyright
- © 2021 Li et al.
- Licence
- This is an open access article distributed under the terms of the Creative Commons Attribution License, which permits using, remixing, and building upon the work non-commercially, as long as it is properly attributed. For attribution, the original author(s), title, publication source (PeerJ) and either DOI or URL of the article must be cited.
- Cite this article
- 2021. Air pollutants and outpatient visits for influenza-like illness in Beijing, China. PeerJ 9:e11397 https://doi.org/10.7717/peerj.11397
Abstract
Background
Air pollution leads to many adverse health conditions, mainly manifested by respiratory or cardiac symptoms. Previous studies are limited as to whether air pollutants were associated to influenza-like illness (ILI). This study aimed to explore the association between air pollutants and outpatient visits for ILI, especially during an outbreak of influenza.
Methods
Daily counts of hospital visits for ILI were obtained from Peking University Third Hospital between January 1, 2015, and March 31, 2018. A generalized additive Poisson model was applied to examine the associations between air pollutants concentrations and daily outpatient visits for ILI when adjusted for the meteorological parameters.
Results
There were 35862 outpatient visits at the fever clinic for ILI cases. Air quality index (AQI), PM2.5, PM10, CO and O3 on lag0 days, as well as nitrogen dioxide (NO2) and sulfur dioxide (SO2) on lag1 days, were significantly associated with an increased risk of outpatient visits for ILI from January 2015 to November 2017. From December 2017 to March 2018, on lag0 days, air pollutants PM2.5 [risk ratio (RR) = 0.971, 95% CI: 0.963-0.979], SO2 (RR = 0.892, 95% CI: 0.840–0.948) and CO (RR = 0.306, 95% CI: 0.153–0.612) were significantly associated with a decreased risk of outpatient visits for ILI. Interestingly, on the lag2 days, all the pollutants were significantly associated with a reduced risk of outpatient visits for ILI except for O3. We did not observe the linear correlations between the outpatient visits for ILI and any of air pollutants, which were instead associated via a curvilinear relationship.
Conclusions
We found that the air pollutants may be associated with an increased risk of outpatient visits for ILI during the non-outbreak period and with a decreased risk during the outbreak period, which may be linked with the use of disposable face masks and the change of outdoor activities. These findings expand the current knowledge of ILI outpatient visits correlated with air pollutants during an influenza pandemic.
Background
Outdoor fine particulate matter (particulate matter with an aerodynamic diameter less than 2.5 µm, PM2.5) exposure causes 4.2 million deaths and a loss of greater than 100 million disability-adjusted life years each year (Schraufnagel et al., 2018). In China, over 1.3 billion people are exposed to high amounts of ambient fine particulate matter and subsequently have high health risks (Song et al., 2017). Concentrations of air pollutants are much higher in winter than those in summer, and the average concentrations in northern China are higher than those in southern China (Chen et al., 2018).
Air pollution leads to many adverse health conditions, mainly manifested by respiratory or cardiac symptoms (Schraufnagel et al., 2018). In China, many studies have already demonstrated that exposure to PM2.5, PM10 and other air pollutants, such as nitrogen dioxide (NO2) and sulfur dioxide (SO2), can induce great adverse impacts on human health, such as ischemic heart disease, cerebrovascular disease, chronic obstructive pulmonary disease (COPD), and lung cancer (Chen et al., 2018; Li et al., 2017; Song et al., 2017; Xia et al., 2017; Zhang et al., 2015). One study reported that PM2.5 and PM10 levels were associated with an increased risk of arrhythmia admissions among 26 Chinese cities, especially in elderly and diabetic patients (Zheng et al., 2018).
Airborne pollution particles may provide “condensation nuclei” to which virus droplets attach, suggesting that the air pollutants may be related to the risk of influenza-like illnesses (ILIs) or pneumonia caused by influenza virus. However, few studies have shown how ambient PM2.5 concentrations might increase the risk of exposure and subsequent transmission of influenza in China (Chen et al., 2017; Liang et al., 2014; Lu et al., 2020). It has been demonstrated ambient PM2.5 concentrations increased the number of ILIs during the flu season in Beijing, China (Feng et al., 2016). Air pollutants, especially PM2.5, PM10, CO and SO2, can increase the risk of ILI in Jinan, China (Su et al., 2019). In the USA, short-term exposure to elevated PM2.5 concentrations have induced greater healthcare utilization for acute lower respiratory infections in children and adults (Horne et al., 2018; Strosnider et al., 2018), which has also been associated with increased rates of culture-negative pneumonia and influenza (Croft et al., 2018). In another study in Hefei, China, PM10 was negatively associated with clinical ILI, while PM2.5 were positively associated with clinical ILI (Liu et al., 2019). There were no associations between air pollutants (PM2.5, PM10 and NO2) and ILI risk for people aged over 25 years old in Nanjing (Huang et al., 2016). Conflicting results were observed and these studies are limited as to whether air pollutants contribute to the number of ILI cases and did not adjust for the potential confounding biases by meteorological parameters. In addition, there was no outbreak of influenza virus during the time series described above. It is necessary to further confirm the effects of influenza outbreaks on the associations between air pollutants and the risks of ILI outpatient visits.
The purpose of this study was to explore the associations between air pollutants and outpatient visits for ILI, especially during an outbreak of ILI, which may provide a scientific basis for objectively evaluating air pollution effects and preventing acute respiratory tract infections.
Methods
Data collection
The counts of daily outpatient visits for ILI were obtained from Peking University Third Hospital, Beijing, China. Daily outpatient visits at fever clinics with a primary diagnosis of ILI (ICD-10 J11.101) between January 1, 2015, and March 31, 2018 were extracted from hospital database. Peking University Third Hospital severed more than 4.22 million outpatients and 300,000 emergency patients every year. Fever outpatients have been ranked top two in the general hospitals in Beijing, which can cover patients in urban and suburban areas. The research protocol was approved by the human ethics committee of Peking University Third Hospital (IRB00006761-M2018221). Informed consent was not needed, as this article only uses quantitative data from hospital systems that use unique identifiers and not patient names or contact information.
Patients less than 15 years old were excluded from this analysis. The concentrations of air pollutants, including air quality index (AQI), PM2.5, PM10, SO2, CO, NO2 and O3, were collected between January 1, 2015 and March 31, 2018, from the Data Center in the Ministry of Ecological Environment of the People’s Republic of China. Daily mean temperature, mean relative humidity, mean wind speed and sunshine time were provided by the National Meteorological Information Center. Twenty-four-hour means were used for all air pollutants except O3, which is conventionally measured at a maximum interval of eight hours.
The higher the AQI value, the greater the level of air pollution and the greater the health concern. AQI is divided into six categories, including good (0–50), moderate (51–100), unhealthy for sensitive groups (101–150), unhealthy (151–200), very unhealthy (221–300) and hazardous (>300).
Statistical analysis
Correlations between air pollutant concentrations and meteorological parameters during the study period were estimated using Spearman’s correlation coefficients due to the abnormal distributions of all these variables.
The study course was classified into two periods: a non-outbreak period from January 2015 to November 2017 and an outbreak period from December 2017 to March 2018 according the distribution of the number of ILI outpatient visits.
Daily outpatient visits for ILI, air pollutant concentrations and meteorological parameters were merged by date to be analyzed with a time-series design. A generalized additive Poisson model was applied to examine the associations between each air pollutant concentration and the counts of daily outpatient visits for ILI adjusted for daily mean temperature, mean relative humidity, mean speed wind and sunshine time and days of the week. The meteorological parameters were controlled using natural spline smoothing functions. Dummy variables were used for days of the week to control for potential confounding factors. To control for any lag effect, the concentrations of air pollutants on the current day (lag0) and the previous five days (lag1–5) were incorporated into the model.
Associations were expressed as the percent change and 95% confidence interval (CI) in the count of daily outpatient visits associated with a per-10 mg/m3 increase in the air pollutant concentrations. All analyses were performed using R Programming Language V.3.2.2 (R Development Core Team) with the “mgcv” and “nlme” packages and Stata 14.0 (Stata Corp LP, College Station, TX, United States).
Results
Outpatient visits
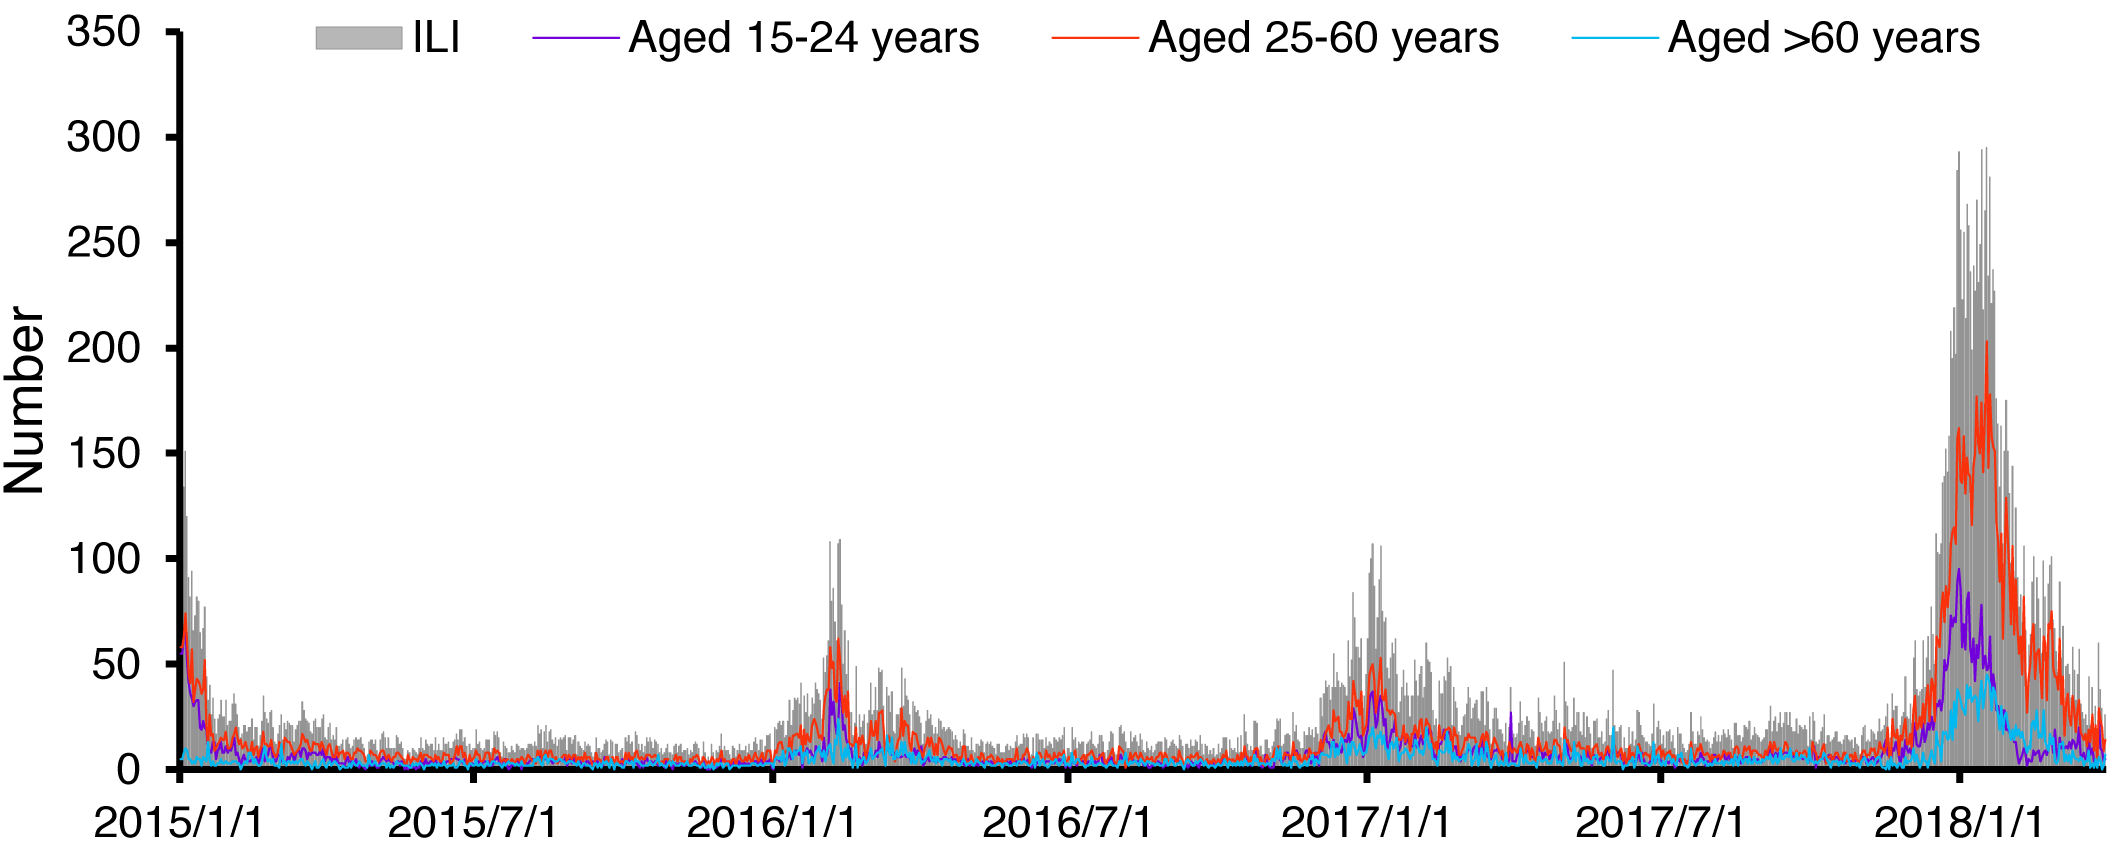
There were 35,862 outpatient visits at the fever clinic for ILI cases from January 2015 to March 2018 in the study (Table 1). Among all the ILI cases, 53.9% of the patients were 25–60 years old. The median (interquartile range) count of daily ILI-attributed outpatient visits was 17 (12–28). The yearly outpatient visits at the fever clinic are shown in Table S1. The number of ILI cases increased rapidly along with the year, especially in the first three months of 2018. From Fig. 1, four peaks were observed in January-February 2015, 2016, 2017 and 2018. It is noteworthy that the number of ILI cases at the abnormal peak in 2018 was nearly three times as large as those at the other three peaks.
| Variable | No. | Median | IQR | Range |
|---|---|---|---|---|
| ILI cases | 35862 | 17 | 12–28 | 1–295 |
| 15–24 years | 9963 | 5 | 3–8 | 0–95 |
| 25–60 years | 19324 | 8 | 5–14 | 1–203 |
| >60 years | 6575 | 4 | 2–6 | 0–45 |
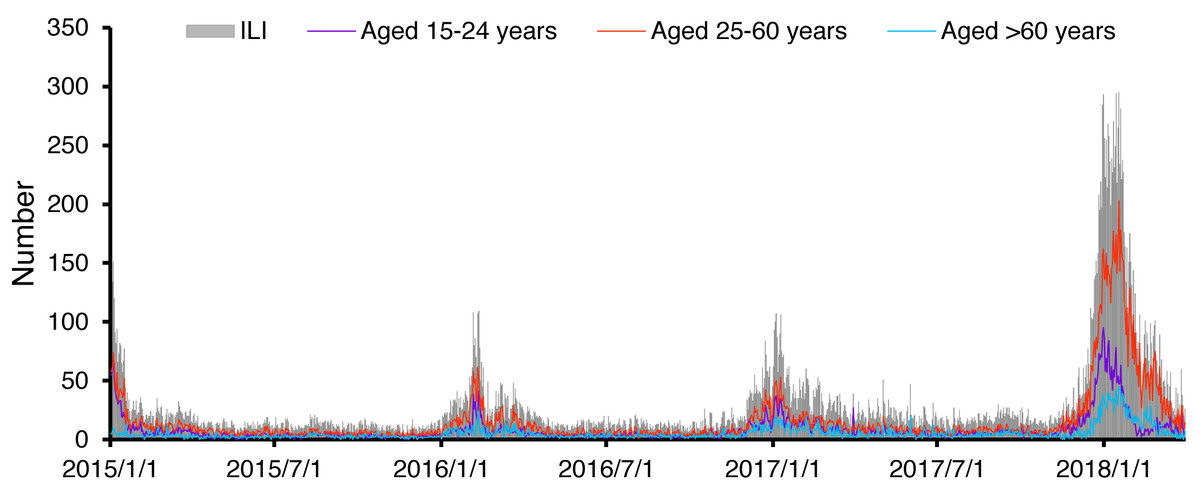
Figure 1: Time series of outpatient visits for influenza like illness (number of daily cases) at fever clinics in Peking University Third Hospital, Beijing during the study period.
| Parameters | AQI | PM2.5 | PM10 | SO2 | CO | NO2 | O3 | Mean temperature | Mean relative humidity | Mean wind speed |
|---|---|---|---|---|---|---|---|---|---|---|
| PM2.5 | 0.896 | |||||||||
| PM10 | 0.795 | 0.800 | ||||||||
| SO2 | 0.440 | 0.553 | 0.558 | |||||||
| CO | 0.709 | 0.855 | 0.630 | 0.627 | ||||||
| NO2 | 0.612 | 0.720 | 0.649 | 0.654 | 0.782 | |||||
| O3 | 0.181 | −0.044a | 0.041a | −0.313 | −0.301 | −0.366 | ||||
| Mean temperature | 0.191 | −0.022a | 0.001a | −0.519 | −0.225 | −0.276 | 0.796 | |||
| Mean relative humidity | 0.449 | 0.502 | 0.196 | −0.169 | 0.501 | 0.262 | −0.001a | 0.304 | ||
| Mean wind speed | −0.363 | −0.411 | −0.275 | −0.145 | −0.516 | −0.570 | 0.232 | 0.019a | −0.484 | |
| Sunshine time | −0.191 | −0.392 | −0.145 | −0.132 | −0.494 | −0.286 | 0.400 | 0.207 | −0.553 | 0.303 |
Notes:
Description of exposure and meteorological parameters
The time series of AQI and six air pollutants, PM2.5, PM10, SO2, CO, NO2, and O3, are shown in Fig. 2. The day-distribution of AQI grades was significantly different across the four years (P < 0.001), as shown in Fig. S1. The AQI value in 2018 was lower than in other years, showing no peak. The number of days of hazardous pollution were 15, 9, 7 and 0 in 2015, 2016, 2017 and 2018, respectively. Air pollutants PM2.5, PM10, SO2, CO and NO2 had overall higher concentrations in the cold periods and lower concentrations in the warm periods. The peaks of these air pollutants were not evident in the cold period from 2017–2018. The concentrations of O3 were higher in the warm periods than in the cold periods. The time series of the meteorological parameters of mean temperature, mean relative humidity, mean wind speed and sunshine time are shown in Fig. S2.
The correlations between the air pollutants and meteorological parameters are shown in Table 2. Strong correlations were detected between any two of the air pollutants except for O3 (all r > 0.600, P < 0.001), while weak correlations were detected between the air pollutants and the meteorological parameters or between any two meteorological parameters except for between the mean temperature and the concentration of O3.
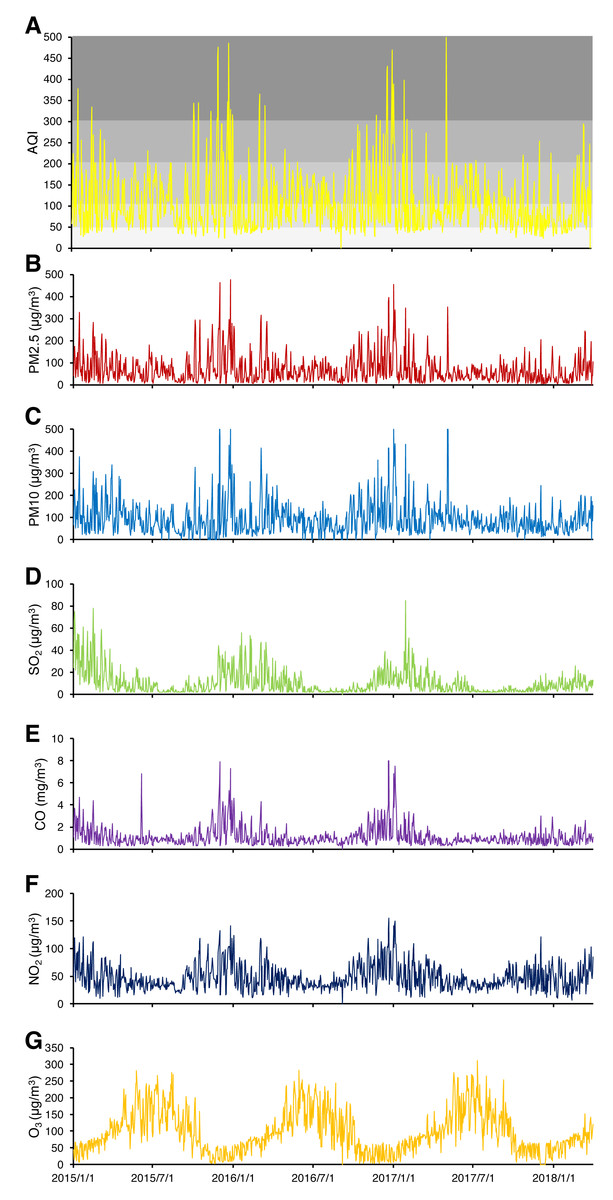
Figure 2: Time series of air pollutants (daily mean values) in Beijing during the study period.
(A-G) The air pollutants involved were AQI, PM2.5, PM10, SO2, CO, NO2, and O3, respectively.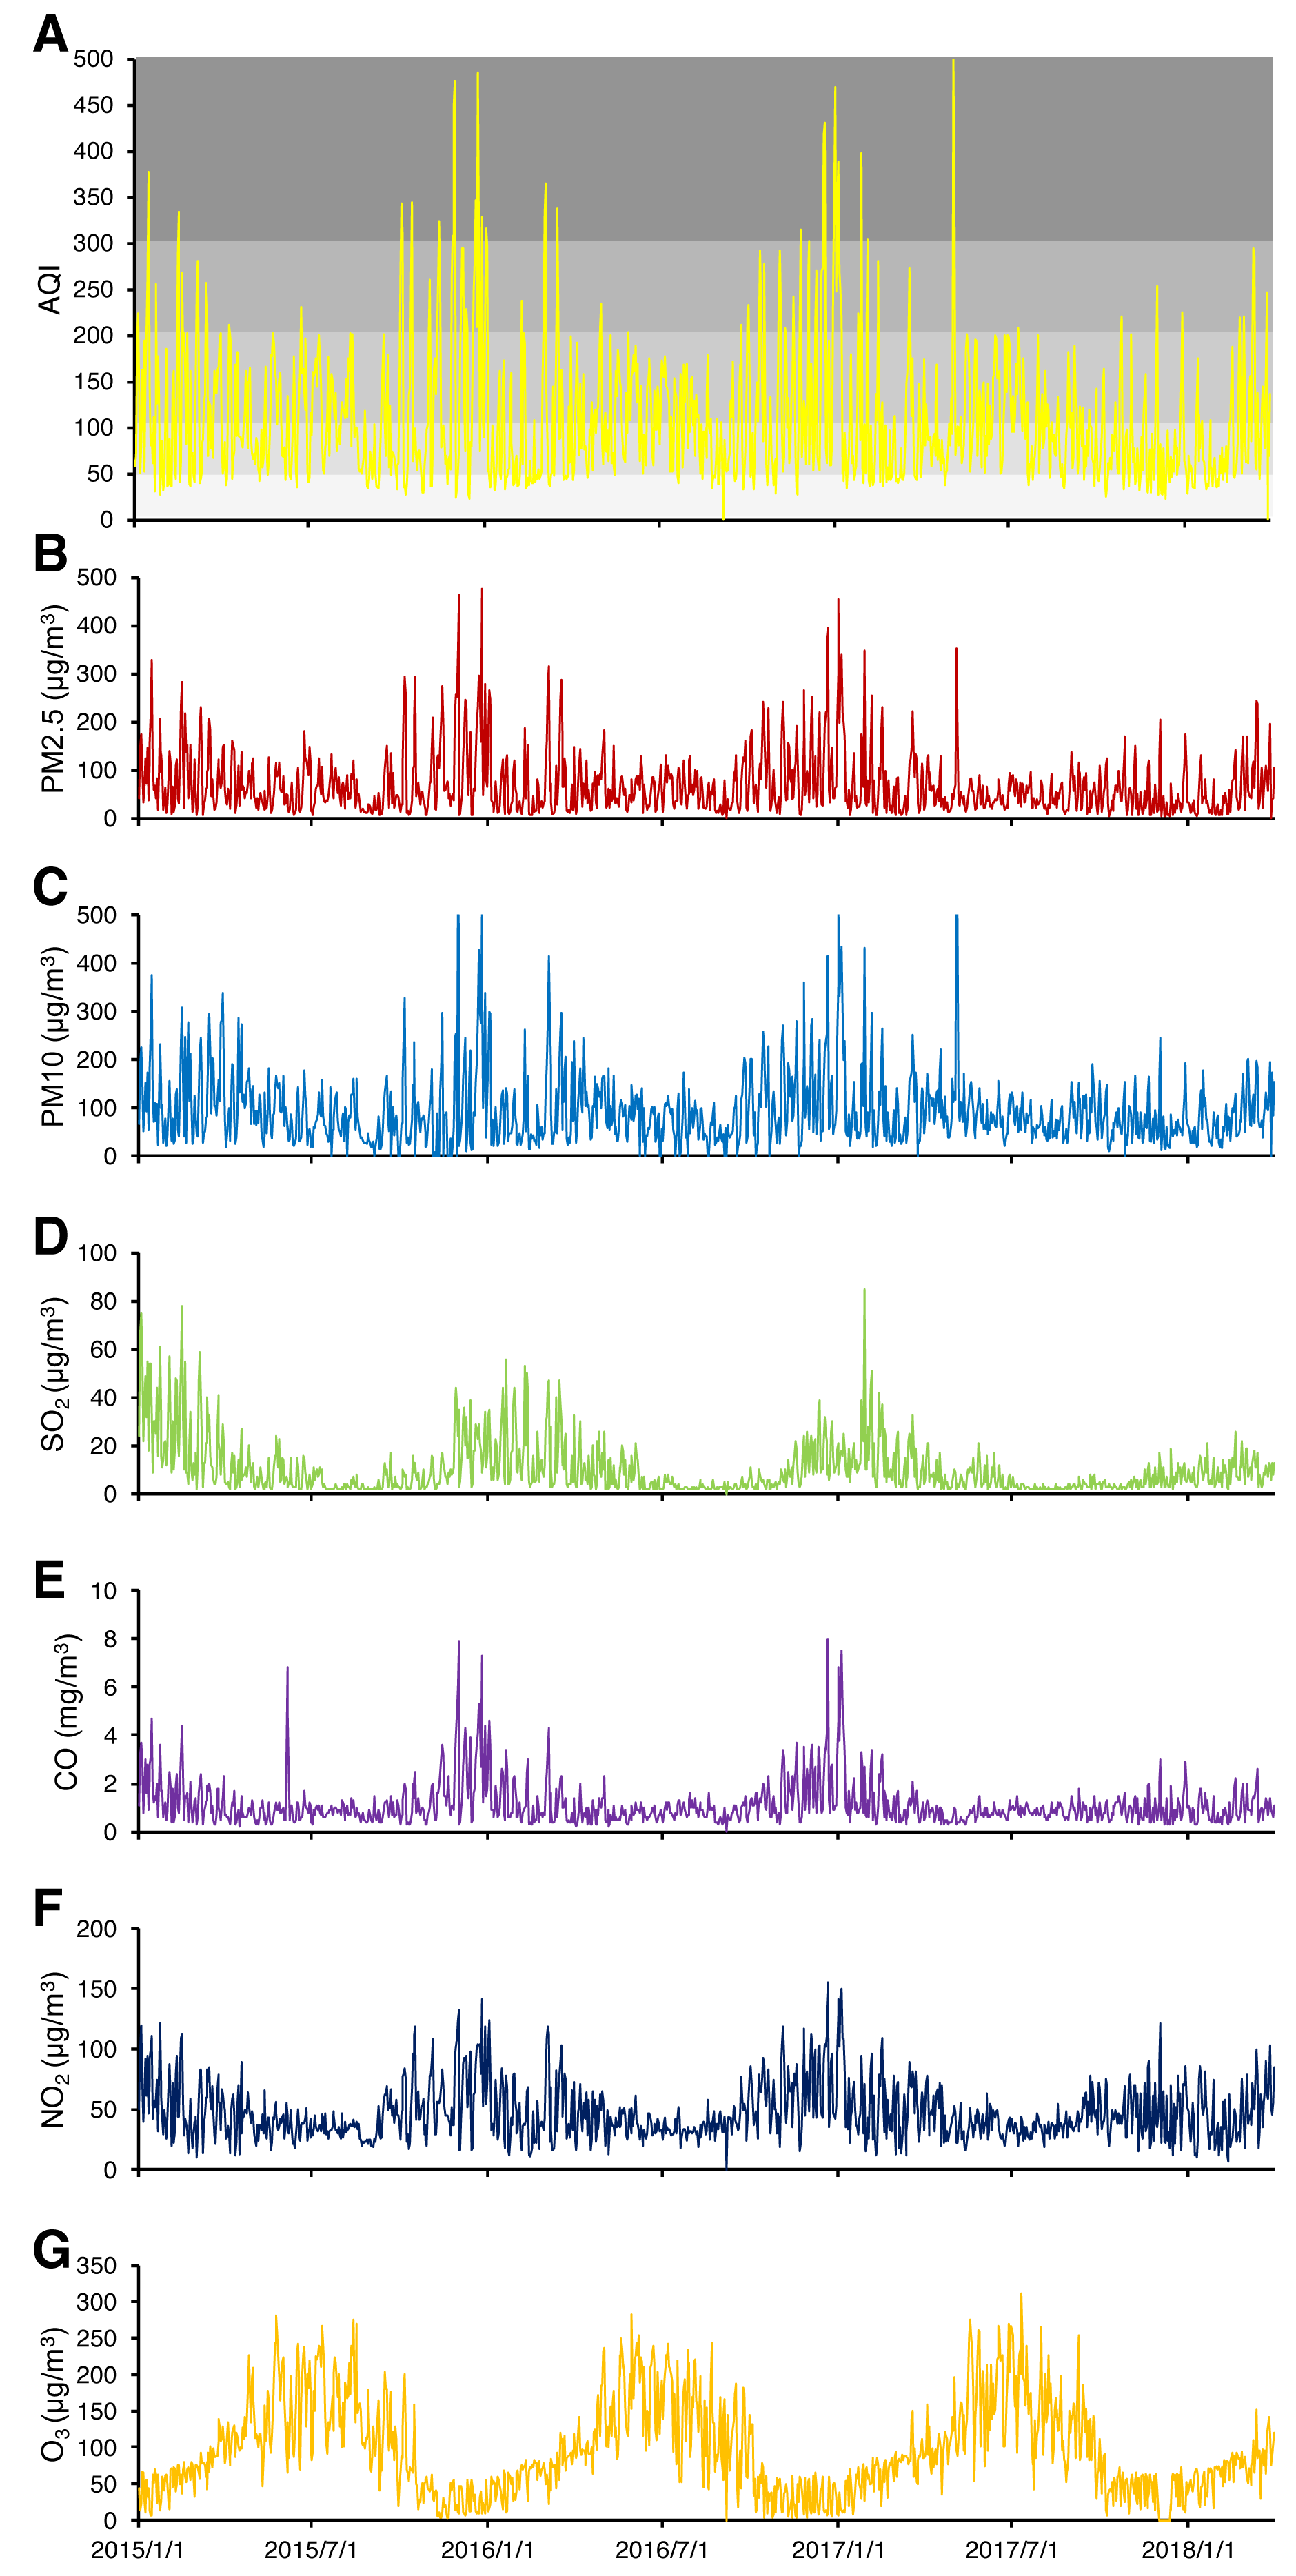
Exposure-response analysis
A single-pollutant model was applied to investigate the association between a single air pollutant concentration and the number of outpatient visits for ILI when adjusted for the meteorological parameters due to the multicollinearity among the various air pollutants and the sample size during December 2017 to March 2018. Considering the abnormal peak of ILI cases during the cold period from 2017–2018, two models were constructed, one based on the time series from January 2015 to November 2017 (non-outbreak period) and the other based on the time series from December 2017 to March 2018 (outbreak period).
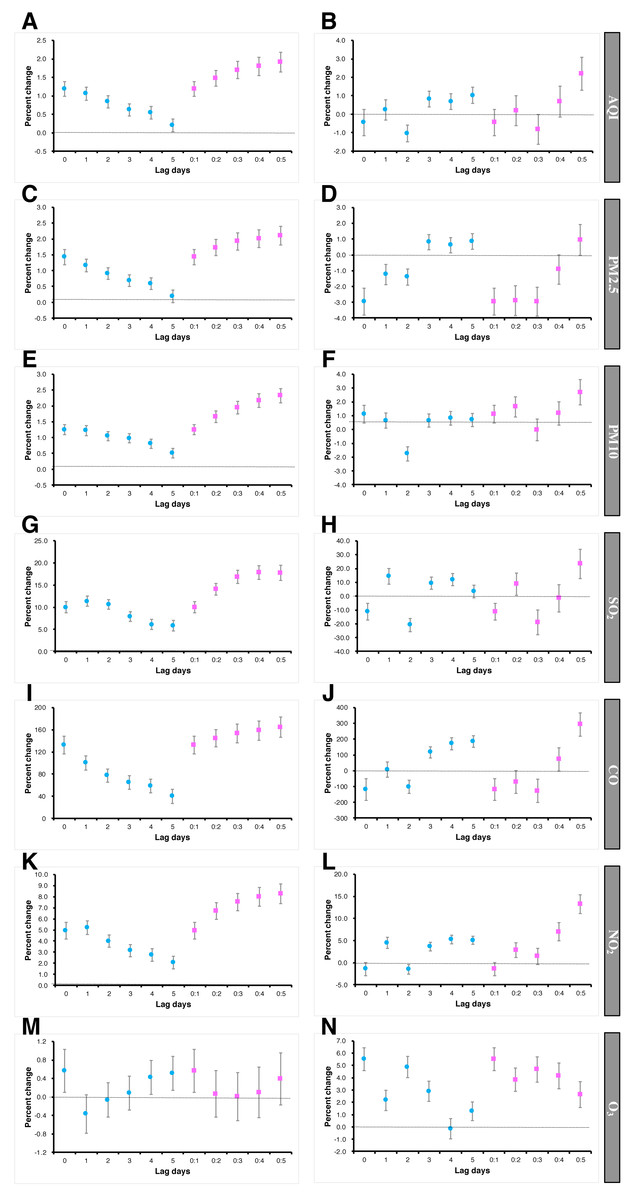
Figure 3: Percent change of outpatient visits for ILI under different day-specific lags for a 10 mg/m3 increase in air pollutants during the non-outbreak period and during the outbreak period.
(A) AQI during the non-outbreak period; (B) AQI during the outbreak period; (C) PM2.5 during the non-outbreak period; (D), PM2.5 during the outbreak period; (E), PM10 during the non-outbreak period; (F), PM10 during the outbreak period; (G), SO2 during the non-outbreak period; (H), SO2 during the outbreak period; (I), CO during the non-outbreak period; (J), CO during the outbreak period; (K) NO2 during the non-outbreak period; (L) NO2 during the outbreak period; G, SO2 during the non-outbreak period; (H) SO2 during the outbreak period; (M) O3 during the non-outbreak period; (N) O3 during the outbreak period. The study course was classified into two periods: a non-outbreak period from January 2015 to November 2017 and an outbreak period from December 2017 to March 2018.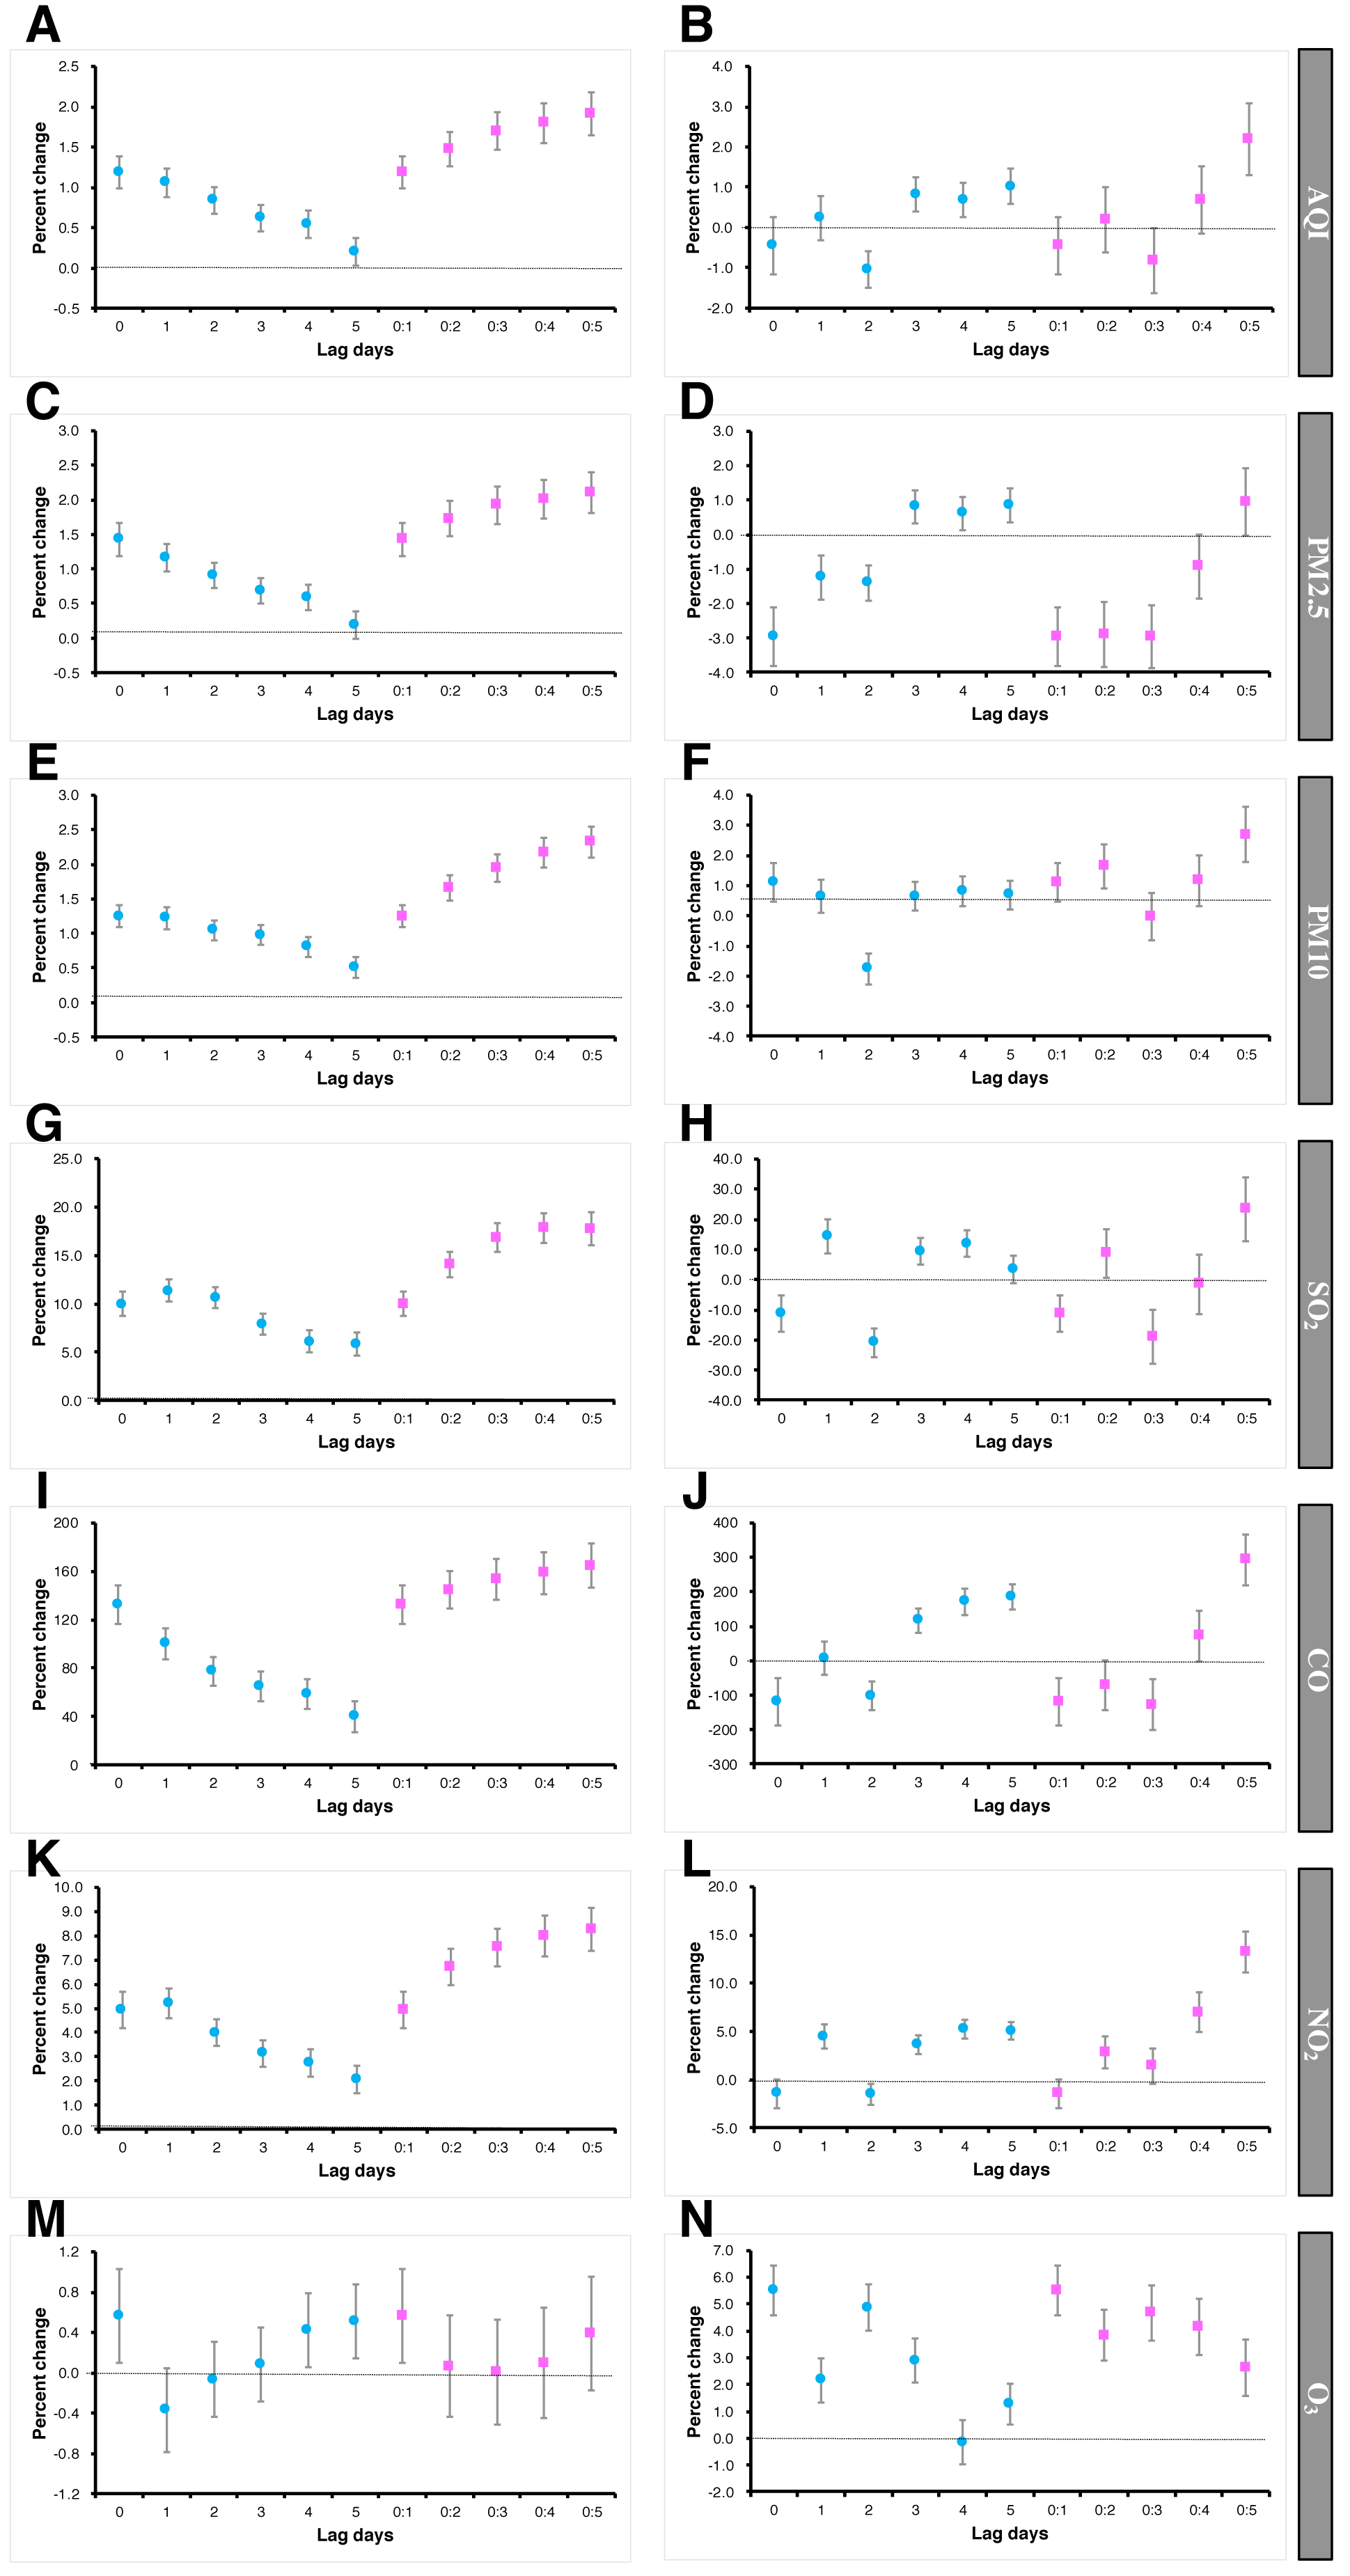
The associations between the outpatient visits for ILI and air pollutants analyzed by the generalized additive Poisson regression model are shown in Fig. 3. AQI, PM2.5, PM10, CO and O3 on lag0 days, as well as SO2 and NO2 on lag1 days, were significantly associated with an increased risk of outpatient visits for ILI, which increased by 1.19% (RR = 1.012, 95% CI [1.010–1.014]), 1.44% (RR = 1.014, 95% CI [1.012–1.017]), 1.26% (RR = 1.012, 95% CI [1.011–1.014]), 132.58% (RR = 3.765, 95% CI [3.216–4.408]), 10.01% (RR = 1.105, 95% CI [1.092–1.119]) and 4.94% (RR = 1.051, 95% CI [1.043–1.059]), respectively, for a 10 µg/m3 increase in the non-outbreak period. During the outbreak period, the associations changed. For most air pollutants, the association between air pollutant and the number of ILI visits was weakened compared to the non-outbreak period. On lag0 days, the associations between the concentrations of PM2.5 (RR = 0.971, 95% CI [0.963–0.979]), SO2 (RR = 0.892, 95% CI [0.840–0.948]) and CO (RR = 0.306, 95% CI [0.153–0.612]) and the decreased risk of ILI outpatient visits was significant. Interestingly, on lag2 days, all the pollutants were significantly associated with a reduced risk of outpatient visits for ILI except for O3.
The results of the exposure-response analysis for outpatient visits for ILI associated with continuous air pollutants (lag1 for AQI, PM2.5, PM10, SO2, NO2, and CO; lag0 for O3) as spline functions are presented in Fig. 4. We did not observe the linear correlations between the number of outpatient visits for ILI and any of air pollutants, which were instead represented by curvilinear relationship. For AQI, PM2.5, SO2, and CO, the risk of outpatient visits for ILI decreased with higher concentrations of air pollutants. The curve for PM10 oscillated at a concentration of 0 µg/m3, which means that the number of outpatient visits for ILI was not associated with PM10 concentration. The number of outpatient visits for ILI was associated with an increase of NO2 and O3 concentrations.
The associations between AQI and the number of outpatient visits for ILI in the non-outbreak period were similar among the three age groups, while for PM2.5, PM10, SO2, NO2 and CO, patients aged 15–24 years old and 25–60 years old had higher RRs than patients aged more than 60 years old (Table 3 and Figs. S3–S8). All the air pollutants except O3 showed the significant associations in the outbreak period with the decreased risk of outpatient visits of for ILI on lag2 days and higher RRs in patients aged 25–60 years old (except for SO2). The O3 concentration was associated with the risk of outpatient visits for ILI both in the non-outbreak period and in the outbreak period (Table 3 and Fig. S9).
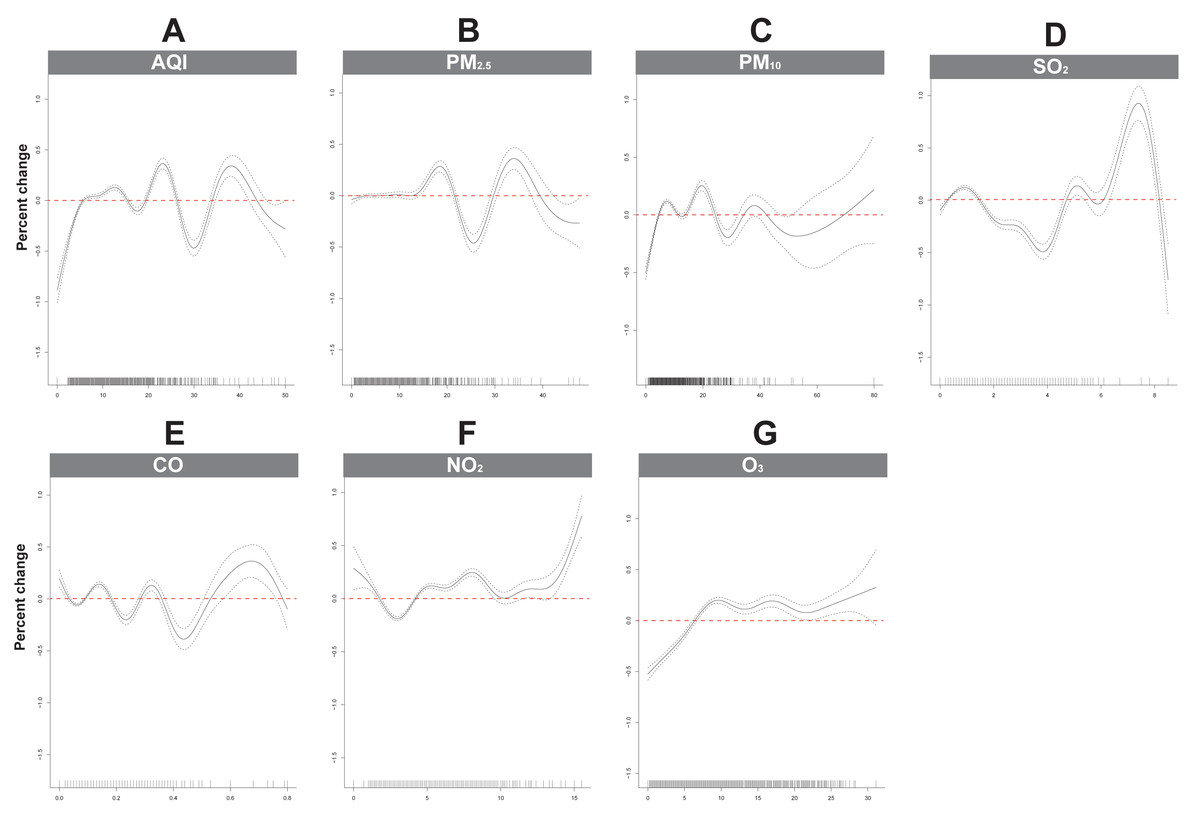
Figure 4: (A-G) The response-exposure curve of the relationship between air pollutants and outpatient visits for influenza-like illness on the concurrent day by GAM analysis.
The solid line indicates the estimated mean percentage change in daily outpatient visits, and the dotted lines represent twice the standard error.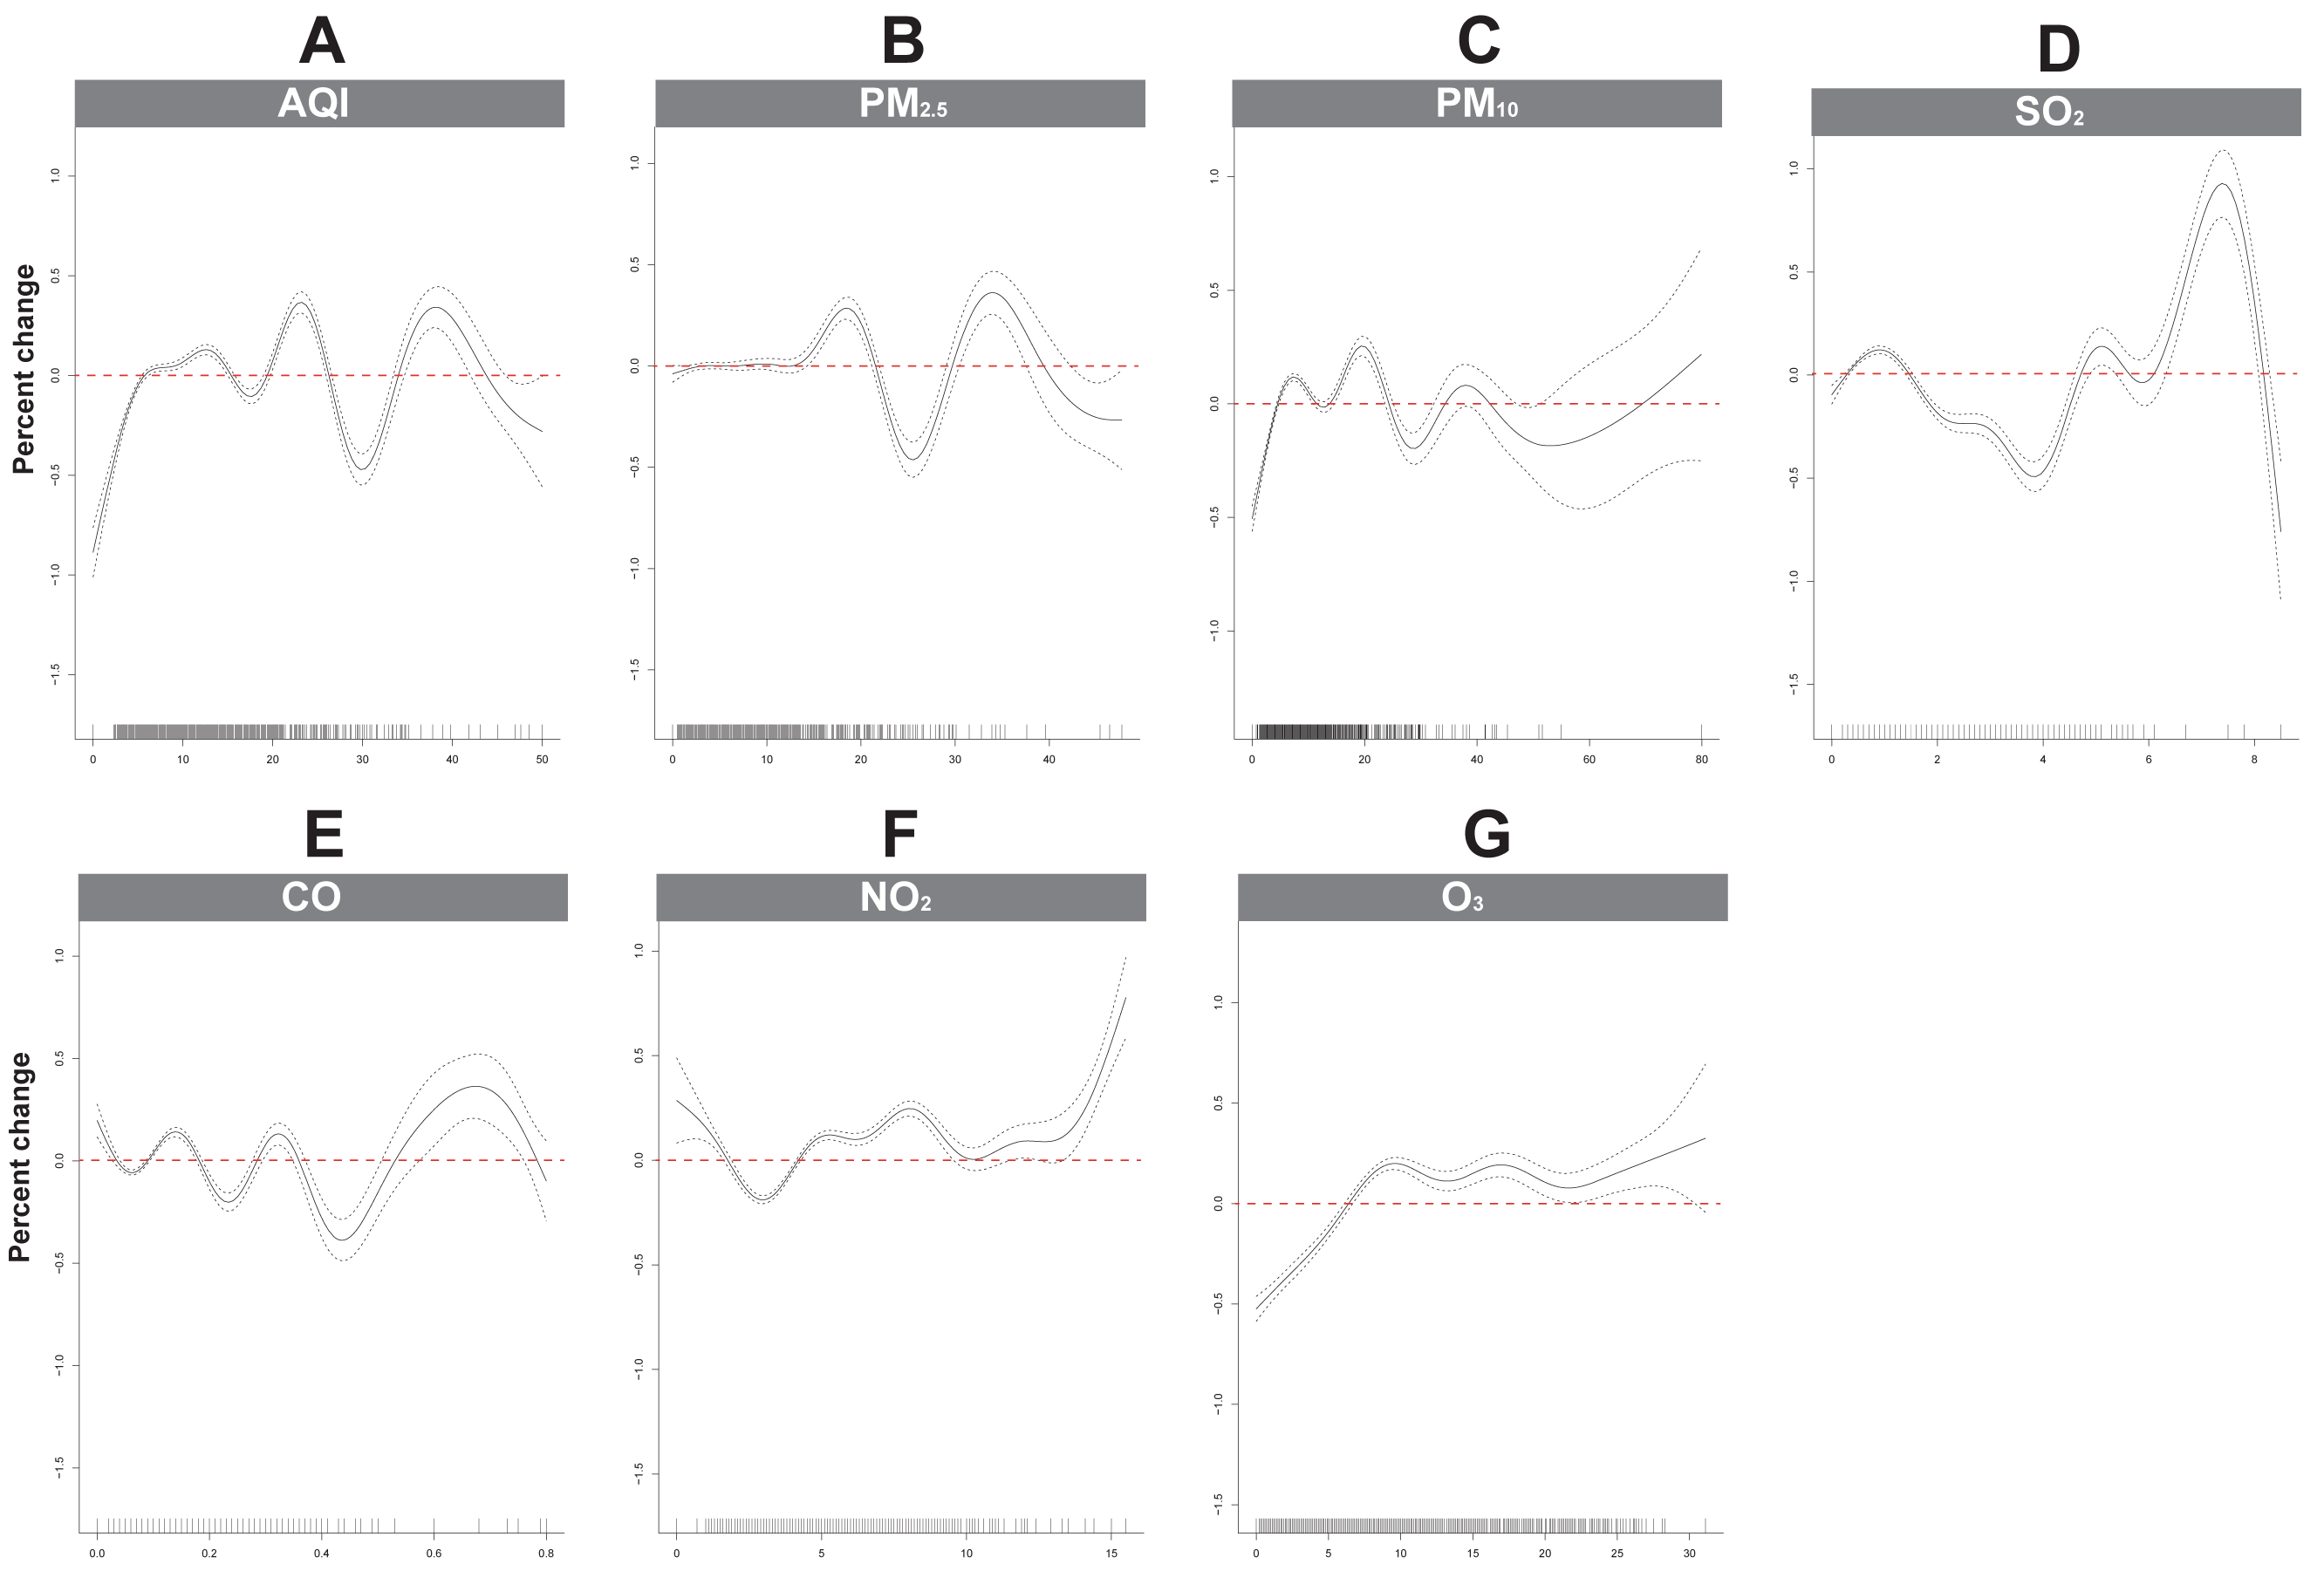
| Air pollutants | RR (95% CI) | ||
|---|---|---|---|
| 15–24 years old | 25–60 years old | >60 years old | |
| AQI | |||
| First period (Lag0) | 1.013 (1.009–1.017) | 1.014 (1.011–1.017) | 1.014 (1.011-1.017) |
| Second period (Lag0) | 0.992 (0.978–1.006) | 0.995 (0.986–1.004) | 1.005 (0.986-1.024) |
| Second period (Lag2) | 0.984 (0.975–0.994) | 0.992 (0.986–0.998) | 0.988 (0.975-1.000) |
| PM2.5 | |||
| First period (Lag0) | 1.015 (1.010–1.019) | 1.017 (1.014–1.020) | 1.009 (1.003-1.014) |
| Second period (Lag0) | 0.969 (0.953–0.985) | 0.969 (0.959–0.980) | 0.986 (0.965-1.009) |
| Second period (Lag2) | 0.981 (0.971–0.992) | 0.988 (0.982–0.995) | 0.984 (0.970-0.998) |
| PM10 | |||
| First period (Lag0) | 1.013 (1.011–1.014) | 1.014 (1.011–1.016) | 1.009 (1.006-1.013) |
| Second period (Lag0) | 1.011 (1.005–1.018) | 1.016 (1.008–1.025) | 1.023 (1.006-1.04) |
| Second period (Lag2) | 0.983 (0.978–0.987) | 0.987 (0.98–0.993) | 0.983 (0.97-0.997) |
| SO2 | |||
| First period (Lag1) | 1.152 (1.13–1.174) | 1.133 (1.115–1.151) | 0.920 (0.897-0.944) |
| Second period (Lag1) | 0.977 (0.866–1.102) | 1.193 (1.111–1.28) | 1.028 (1.001-1.056) |
| Second period (Lag2) | 0.672 (0.607–0.743) | 0.854 (0.806–0.905) | 1.044 (1.017-1.072) |
| NO2 | |||
| First period (Lag1) | 1.064 (1.053–1.076) | 1.055 (1.046–1.064) | 1.033 (1.019-1.047) |
| Second period (Lag1) | 1.066 (1.039–1.094) | 1.044 (1.027–1.06) | 1.024 (0.991-1.059) |
| Second period (Lag2) | 0.993 (0.97–1.016) | 0.986 (0.972–1.000) | 0.977 (0.95-1.005) |
| CO | |||
| First period (Lag0) | 4.556 (3.45–6.018) | 4.205 (3.36–5.263) | 3.765 (3.216-4.408) |
| Second period (Lag0) | 1.067 (0.28–4.065) | 0.222 (0.091–0.54) | 0.306 (0.153-0.612) |
| Second period (Lag2) | 0.345 (0.148–0.801) | 0.382 (0.228–0.641) | 0.361 (0.24-0.543) |
| O3 | |||
| First period (Lag0) | 1.002 (0.993–1.01) | 1.010 (1.003–1.016) | 1.004 (0.995-1.014) |
| Second period (Lag0) | 1.009 (0.99–1.028) | 1.067 (1.054–1.08) | 1.099 (1.071-1.128) |
Notes:
First period, January 2015 to November 2017; second period, from December 2017 to March 2018.
Discussion
Many human diseases, especially in cardiovascular and respiratory systems, are associated with short and long-term exposure to the air pollutants (Rajagopalan, Al-Kindi & Brook, 2018; Schraufnagel et al., 2018; Schraufnagel et al., 2019). The correlations between air mass trajectories and pollution conditions in Beijing reinforce the necessity of interregional cooperation and control (Li et al., 2018). Air quality has been improved by strengthening of pollution control in recent years. At the same time, the numbers of ILI cases and outbreaks increased during the winter of 2017–2018 and surpassed levels from previous years observed from weekly surveillance reports of the Chinese National Influenza Center. Therefore, it is vital to have the opportunity to assess the effects of air pollutants on the number of outpatient visits for ILI. In our study, we found that air pollutants were associated with an increased risk of outpatient visits for ILI during the non-outbreak period of the influenza virus and reduced the risk of outpatient visits during the outbreak period.
This study provides evidence for the associations between air pollutants and the risk of outpatient visits for ILI. It has been confirmed that exposure to ambient air pollutants is closely associated with localized transmission of influenza (Chen et al., 2017). It is estimated that 50–150 µg/m3 increases in PM2.5 concentration caused a nearly one-fold increase in the risk of lower respiratory tract infection (Cohen et al., 2017). In our study, air pollutants were associated with the risk of outpatient visits for ILI over a period without the influenza pandemic, which was consistent with most studies (Chen et al., 2017; Feng et al., 2016; Liang et al., 2014; Liu et al., 2018; Nhung et al., 2017; Zhang et al., 2015). Feng et al. (2016) suggested a strong positive relationship between PM2.5 and ILI risk during the flu season after adjusting for potential variables. Our findings for an association between ambient PM2.5 concentration and the incidence of influenza in Hefei is consistent with previous studies based on data from other individual cities in China. The study by Liu et al. suggested that SO2 and NO2 were not correlated with ILI (Liu et al., 2018), which was opposite to our results. There is no consensus on the effects of NO2 and SO2 on ILI for many reasons, such as regional differences, population specificities (herd susceptibility and age-sex composition), and a component of the complicated mixture (the proportions of NO2 and SO2 in the air pollutants). These associations need to be analyzed and confirmed in the further studies.
Air pollutants have adverse effects on the outpatient visits for ILI during the non-outbreak periods, but this effect was not observed during the outbreak period in our study. Liang et al. (2014) suggested that human influenza cases were correlated with PM2.5 concentrations in Beijing from 2008 and 2011 with a potentially long lag time between the peaks of PM2.5 levels and the peaks of influenza cases in 2009 and 2010. In one study from Australia, significant associations were reported between exposure to air pollution and the incidence of pediatric influenza at a longer lag time of ten days (Xu et al., 2013). However, the causality between PM2.5 concentrations and influenza cases during the outbreak of influenza in 2009 was questionable due to a lag time of over two or three months, which is difficult to explain biologically. A significantly increased risk for outpatient visits for ILI was not detected during the outbreak of influenza during the winter of 2017–2018 in our study. Rather, air pollutants reduced the risk of outpatient visits for ILI and demonstrated a “protective effect”. We think this may be related to the use of disposable face masks and reduced outdoor activities, which further reduces the possibility of pathogen transmission. In other words, the good air quality in the winter of 2017–2018 may increase possibility of transmitting along with reducing the use of disposable face masks and increasing outdoor activities. Some studies have supported the reduction in influenza incidence through public use of face masks at a population level (Rainwater-Lovett, Chun & Lessler, 2014; Uchida et al., 2017).
People with other illnesses or less social support are more vulnerable to air pollution. Women and people aged more than or equal to 60 years demonstrated a higher risk of respiratory disease after PM2.5 exposure (Xu et al., 2016). PM2.5 was strongly associated with ILI risk across all age groups during the flu season, but the association was most pronounced among adults aged 25–59 years old, followed by young adults aged 15–24 years old and elderly individuals aged more than or equal to 60 years old (Feng et al., 2016). In our study, air pollutants were not more associated with ILI patients aged more than 60 years old compared to other age groups. Previous studies on elderly populations reported associations between PM2.5 concentrations and hospitalizations for respiratory diseases, including respiratory tract infections, COPD, and pneumonia (Dominici et al., 2006). The reason may be that elderly people are more likely to suffer from chronic diseases, such as asthma, COPD, diabetes, and cardiovascular disease, which may determine their susceptibility to the short-term exposure to elevated levels of air pollutants (Simoni et al., 2015). During the outbreak of the influenza virus in our study, young and elderly patients had stronger protective effects compared to the patients aged 25–60 years old. This might be related to the fact that young children and elderly individuals would be better protected and spend less time outdoors, which means less exposure to air pollutants. Then they reduced their exposure to each other, especially with the ILI cases and thereby reduced the risk of ILI. At the same time, individuals aged 25–60 years were more likely to be exposed to a substantial portion of their daily dose of air pollution during commuting activities (de Nazelle et al., 2011).
One study reported that PM2.5 was nonlinearly associated with daily ILI risk based on a generalized additive Poisson model, after adjusting for meteorological parameters and seasonal and yearly trends (Feng et al., 2016), which was consistent with our result. This may be related to preventative measures issued by the government and carried out by individuals themselves.
Some limitations exist in our study. First, we only used the data from one hospital, which may be a poor representation of the population and thus introduce selective bias, although the trends of outpatient visits for ILI in our study were similar to the data in the weekly surveillance reports of the Chinese National Influenza Center, which may affect the observed negative association on some lag days during some special periods. Second, periods of more unusual outbreaks of influenza may be required to further confirm the associations between air pollutants and outpatient visits for ILI or influenza, especially in situations involving heavy air pollution. Third, the study used an ecological design, which may limit the ability to control for potentially relevant confounders, such as individual-level demographic or socio-economic factors.
Conclusions
We found that air pollutants increased the risk of outpatient visits for ILI during the non-outbreak period while revealing a protective effect during an outbreak period. These findings expand current knowledge of ILI outpatient visits correlated to air pollutants during the influenza pandemic, which are of great importance for the development of public health policy about air quality during influenza epidemics and pandemics. It is important to further evaluate the effectiveness of protective measures during an outbreak period and the associations between air pollutants and outpatient visits for ILI under other infectious situations such as COVID-19 in the future.
Supplemental Information
Demographic characteristics of outpatient visits of influenza like illness at fever clinic in the hospital from January 1, 2015 to March 31, 2018
The day-distribution of AQI grades in the four years
The higher the AQI value, the greater the level of air pollution and the greater the health concern. AQI is divided into six categories, including good (0–50), moderate (51–100), unhealthy for sensitive groups (101–150), unhealthy (151–200), very unhealthy (2201–300) and hazardous (>300).
The time series of meteorological parameters of mean temperature, mean relative humidity, mean wind speed and sunshine time
Percent change of outpatient visits for ILI under different day-specific lags for a 10 mg/m3 increase in AQI
(A), in the patients aged 15–24 years old from January 2015 to November 2017; (B), in the patients aged 15–24 years old from December 2017 to March 2018; (C), in the patients aged 25–60 years old from January 2015 to November 2017; (D), in the patients aged 25–60 years old from December 2017 to March 2018; (E), in the patients aged more than 60 years old from January 2015 to November 2017; (F), in the patients aged more than 60 years old from December 2017 to March 2018.
Percent change of outpatient visits for ILI under different day-specific lags for a 10 mg/m3 increase in PM2.5
(A) in the patients aged 15–24 years old from January 2015 to November 2017; (B) in the patients aged 15–24 years old from December 2017 to March 2018; (C) in the patients aged 25–60 years old from January 2015 to November 2017; (D), in the patients aged 25–60 years old from December 2017 to March 2018; (E) in the patients aged more than 60 years old from January 2015 to November 2017; (F) in the patients aged more than 60 years old from December 2017 to March 2018.
Percent change of outpatient visits for ILI under different day-specific lags for a 10 mg/m3 increase in PM10
(A) in the patients aged 15–24 years old from January 2015 to November 2017; (B) in the patients aged 15–24 years old from December 2017 to March 2018; (C) in the patients aged 25–60 years old from January 2015 to November 2017; (D) in the patients aged 25–60 years old from December 2017 to March 2018; (E), in the patients aged more than 60 years old from January 2015 to November 2017; (F), in the patients aged more than 60 years old from December 2017 to March 2018.
Percent change of outpatient visits for ILI under different day- specific lags for a 10 mg/m3 increase in SO2
(A), in the patients aged 15–24 years old from January 2015 to November 2017; (B), in the patients aged 15–24 years old from December 2017 to March 2018; (C), in the patients aged 25–60 years old from January 2015 to November 2017; (D), in the patients aged 25–60 years old from December 2017 to March 2018; (E), in the patients aged more than 60 years old from January 2015 to November 2017; (F), in the patients aged more than 60 years old from December 2017 to March 2018.
Percent change of outpatient visits for ILI under different day-specific lags for a 10 mg/m3 increase in NO2
(A) in the patients aged 15–24 years old from January 2015 to November 2017; (B), in the patients aged 15–24 years old from December 2017 to March 2018; (C) in the patients aged 25–60 years old from January 2015 to November 2017; (D) in the patients aged 25–60 years old from December 2017 to March 2018; (E) in the patients aged more than 60 years old from January 2015 to November 2017; (F) in the patients aged more than 60 years old from December 2017 to March 2018.
Percent change of outpatient visits for ILI under different day- specific lags for a 10 mg/m3 increase in CO
(A) in the patients aged 15–24 years old from January 2015 to November 2017; (B) in the patients aged 15–24 years old from December 2017 to March 2018; (C) in the patients aged 25–60 years old from January 2015 to November 2017; (D) in the patients aged 25–60 years old from December 2017 to March 2018; (E) in the patients aged more than 60 years old from January 2015 to November 2017; (F) in the patients aged more than 60 years old from December 2017 to March 2018.
Percent change of outpatient visits for ILI under different day- specific lags for a 10 mg/m3 increase in O3
(A) in the patients aged 15–24 years old from January 2015 to November 2017; (B) in the patients aged 15–24 years old from December 2017 to March 2018; (C), in the patients aged 25–60 years old from January 2015 to November 2017; (D), in the patients aged 25–60 years old from December 2017 to March 2018; E, in the patients aged more than 60 years old from January 2015 to November 2017; (F), in the patients aged more than 60 years old from December 2017 to March 2018.
Raw data
The counts of daily outpatient visits for ILI and corresponding concentrations of air pollutants. The counts of daily outpatient visits for ILI were obtained from Peking University Third Hospital, Beijing, China. Daily outpatient visits at fever clinics with a primary diagnosis of ILI (ICD-10 J11.101) between January 1, 2015, and March 31, 2018 were extracted from hospital database. Patients <15 years old were excluded from this analysis. The concentrations of air pollutants, including air quality index (AQI) , PM2.5, PM10, SO2, CO, NO2 and O3, were collected between January 1, 2015 and March 31, 2018, from the Data Center in the Ministry of Ecological Environment of the People’s Republic of China. Daily mean temperature, mean relative humidity, mean wind speed and sunshine time were provided by the National Meteorological Information Center. Twenty-four-hour means were used for all air pollutants except O3, which is conventionally measured at a maximum interval of eight hours.