
Compositional and functional profiling of the rhizosphere microbiomes of the invasive weed Ageratina adenophora and native plants
- Published
- Accepted
- Received
- Academic Editor
- Biao Zhu
- Subject Areas
- Ecology, Microbiology, Molecular Biology, Plant Science, Soil Science
- Keywords
- Plant-soil feedback, Exotic invasion, High throughput 16S rRNA and ITS fragment sequencing, Transcriptome analysis, Rhizosphere microbiome, Ageratina adenophora
- Copyright
- © 2021 Xia et al.
- Licence
- This is an open access article distributed under the terms of the Creative Commons Attribution License, which permits unrestricted use, distribution, reproduction and adaptation in any medium and for any purpose provided that it is properly attributed. For attribution, the original author(s), title, publication source (PeerJ) and either DOI or URL of the article must be cited.
- Cite this article
- 2021. Compositional and functional profiling of the rhizosphere microbiomes of the invasive weed Ageratina adenophora and native plants. PeerJ 9:e10844 https://doi.org/10.7717/peerj.10844
Abstract
The rhizosphere soil microbiome (RSM) plays an important role in the nutritional metabolism of the exotic weed Ageratina adenophora. However, our understanding of the composition and metabolic activity of this microbiome is limited. We used high-throughput sequencing of bacterial 16S rRNA genes and fungal internal transcribed spacer fragments in combination with transcriptome analysis to compare the composition and metabolic features of the RSMs of A. adenophora and the native plant species Artemisia indica and Imperata cylindrica. A. indica cohabitates with the weed and I. cylindrica grows in uninvaded soil areas. We found fungi belonging to the phyla Ascomycota and Basidiomycota and bacteria belonging to the phyla Proteobacteria, Acidobacteria and Bacteroidetes were highly abundant in the RSMs of A. adenophora and both native plant species. The RSM of A. adenophora differed to varying degrees in the relative abundances of bacterial and fungal phyla and genera, and in levels of expression of functional genes from those of both the native species. The RSM of A. adenophora was more metabolically active than both of these, as indicated by marked increases in the expression levels of genes associated with cell wall, membrane, and envelope biogenesis, energy production and conversion, and the transport and metabolism of carbohydrates, amino acids, coenzymes, nucleotides, and secondary metabolites. Ascomycota and Basidiomycota contributed most significantly to these differences. The composition and metabolic activities of A. adenophora RSM differed less to the RSM of A. indica than to the RSM of I. cylindrica. Fungal communities contributed most to the metabolic genes in the RSM of A. adenophora. These included the arbuscular mycorrhizal fungi Glomeromycota. The different relative abundances in the RSMs of these three plant populations may explain why A. adenophora is more successful in colonizing soils than the two native populations.
Introduction
Ageratina adenophora (Sprengel, also known as Eupatorium adenophorum Sprengel) is a weed originating in Mexico and Costa Rica that has invaded more than 40 tropical and subtropical countries in Asia, Oceania, Africa, and Europe (Poudel et al., 2019). Its dominance can interfere with nutritional cycles, hydrological conditions, and the energy budgets of the plant-soil ecosystem, causing severe economic losses to the agricultural, forestry, and livestock industries (Xu et al., 2006; Kong et al., 2017). Thus, A. adenophora is often used as a model organism to study the possible mechanisms of plant invasion (Datta et al., 2017; Chen et al., 2019; Fang et al., 2019; Poudel et al., 2019; Zhao et al., 2019). The impact of plant soil feedback is of interest to explain the successful exotic invasion of A. adenophora (Niu et al., 2007; Poudel et al., 2019; Zhao et al., 2019). The presence of A. adenophora may alter soil nutrient availability by modifying the composition and function of its soil microbiome, thus facilitating its growth and competitiveness (Niu et al., 2007; Zhao et al., 2019).
Most soil microbiological studies associated with the invasion of A. adenophora have examined the bulk soil beneath the plant. A. adenophora tends to have higher levels of available C, N, and P (Niu et al., 2007; Kong et al., 2017; Poudel et al., 2019; Zhao et al., 2019), higher nitrogen-cycling rates (Zhao et al., 2019), higher enzymatic (urase, phosphatase, and invertase) activities (Li et al., 2009), and a higher abundance of vesicular-arbuscular mycorrhizal fungi and fungi/bacteria ratio (Niu et al., 2007) than soils inhabited by native plant species. In previous studies, the composition of the bulk soil microbiomes beneath A. adenophora differed from those beneath native plant species (Niu et al., 2007; Kong et al., 2017; Zhao et al., 2019). However, there have been few studies conducted on the structure and function of the rhizosphere soil microbiome (RSM) of this weed. The soil immediately around the plant roots, known as the rhizosphere, is an area where plant soil feedback is important because it harbors an active and diverse microbiota consisting of both bacteria and fungi (Inderjit & Van der Putten, 2010; Van der Putten et al., 2013). These microorganisms receive 20%–50% of the plant host’s photosynthetically generated carbon (Drigo et al., 2010). However, the extent to which the composition and metabolism of the bacterial and fungal communities in the RSM of A. adenophora differ from those of native plant species is still unclear. In particular, the root leachate of A. adenophora contains structurally diverse phytochemicals including terpenoids, phenylpropanoids, flavonoids, coumarins, and alkaloids (He et al., 2008; Dong et al., 2017), and some of these have been shown to possess allelopathic, phytotoxic, and antifeedant activities, and have the potential to substantially alter the microbiota of invaded soils (Liu et al., 2010).
We investigated the composition and metabolic activities of the bacterial and fungal communities in the RSMs of A. adenophora and compared them to those of two native plant species, Artemisia indica and Imperata cylindrica, using 16S rRNA gene and internal transcribed spacer (ITS) fragment high-throughput sequencing combined with transcriptome analysis. The results of this study improve our understanding of the role of RSM in the growth and invasiveness of A. adenophora.
Materials & Methods
Site description and sampling strategy
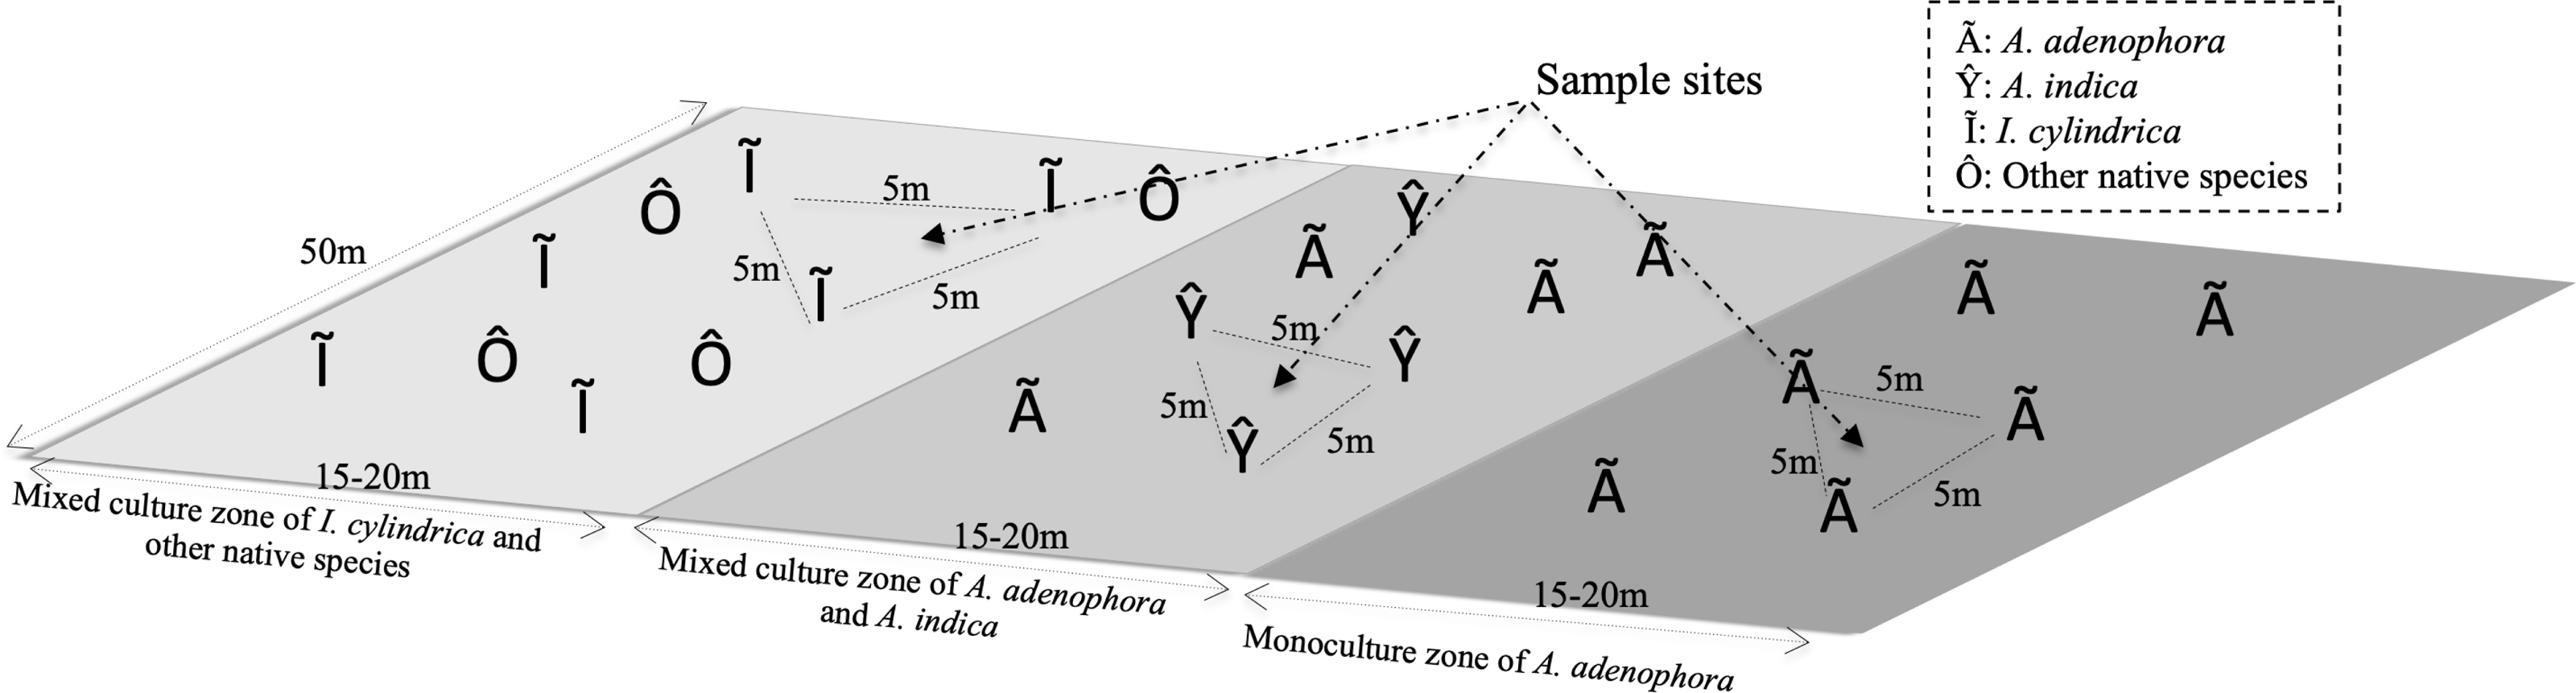
The study site was located in the foothills of Maomao Qing, Xishan, Kunming (24°55′29″N, 102°36′36″E), where the invasion of A. adenophora began in 1987. The vegetation of the study area consisted of a monoculture of A. adenophora, a mixture of A. adenophora (40%–50% coverage) and the native species A. indica, and I. cylindrica (Fig. 1). I. cylindrica was initially present in the sample site area but was outcompeted by A. adenophora and disappeared. The sample site was approximately 50 × 50 m2 with a mean altitude of 2,170 (±0.5) m above sea level and with no tree coverage. The site had mountain red soil, an average annual temperature of 15.2 °C (ranging from 14.3–16.1 °C), and an average annual rain precipitation of 975 mm ranging from 937–1,058 mm.
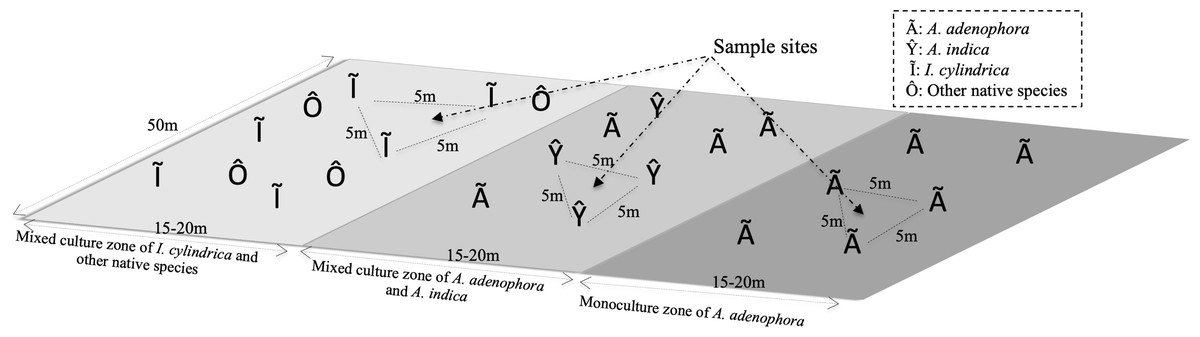
Figure 1: Diagram of the rhizosphere soil collection sites of weed Ageratina adenophora, and native species Artemisia indica and Imperata cylindrica.
To identify the rhizosphere microbial populations and to determine their roles in the metabolic activities of the RSM of A. adenophora, triplicate soil samples were collected from the rhizospheres of A. adenophora in the monoculture zone, A. indica in the mixed zone, and I. cylindrica where no invasion of A. adenophora had occurred (Fig. 1). Nine total rhizosphere samples were obtained. The individual sample sites in each zone were separated by at least 5 m. Sample sites in the different zones were separated by at least 10 m. To sample the rhizosphere soils of each species, individual plants were pulled up within an area of approximately 80 × 80 cm2 and shaken to remove the soil loosely attached to the roots, ensuring only soil firmly adhering to the roots was sampled. A subset of these soil samples was frozen in liquid nitrogen for RNA-seq analysis. Another set was placed separately into sterile Whirl-Pak sample bags (Nasco, Fort Atkinson, WI, USA) and transported to the laboratory within 1 h of collection where it was used for 16S rRNA gene and ITS fragment analyses. Approximately 500 g of each soil sample was homogenized (medium treatment for 1 min) in a Waring heavy-duty blender (Lab-Biogen, Kunming, China), which was carefully cleaned with 70% ethanol after each use, and immediately passed through a two mm sieve yielding samples used for subsequent physicochemical analysis and DNA extraction, as detailed below.
Physicochemical analysis of soil samples
Physiochemical analyses of soil samples were carried out according to the protocols described by Kong et al. (2017), with modifications. Briefly, soil mass water content was determined by measuring the percent weight loss after 24 h incubation at 105 °C. Soil organic matter composition was determined using the K2Cr2O7-H2SO4 oxidation method (Nelson & Sommers, 1996). Total nitrogen was measured using the Kjeldahl method. Soil inorganic N was extracted with 2 mol KCl, and the concentrations of NO3−-N and NH4+-N in the KCl extracts were determined using hydrazine sulfate colorimetry and indophenol blue colorimetry, respectively (Mulvaney, 1996). The total and available phosphorus levels were determined using the colorimetric Moblue-method (Kuo, 1996), while the total and available potassium levels were measured using the method described by Helmke & Sparks (1996). The pH values (1:2.5 solution of soil to water) were measured using a pH meter (Mettler-Toledo International Inc., Columbus, OH, USA).
DNA extraction, PCR amplification, and Illumina sequencing
DNA extraction, PCR amplification, and Illumina sequencing were carried out according to the protocols described by Kong et al. (2017) and Xia et al. (2019a) with modifications. Briefly, soil DNA was extracted using a PowerSoil DNA Isolation Kit (Anbiosci, Shenzhen, China) according to the manufacturer’s protocol. Crude DNA was purified on 1% (wt/vol) low melting point agarose gel in Tris Acetate-EDTA buffer to obtain genomic DNA. DNA bands were excised, extracted with QIAquick Gel Extraction Kits (Qiagen, Shanghai, China), and then used as templates for PCR amplification. The V4 hypervariable region of the 16S rRNA gene (Biddle et al., 2008) was amplified using 2 × KAPA HiFi HotStart ReadyMix (Shanghai Dobio, Shanghai, China) with the primer sets 515F (GTGCCAGCMGCCGCGGTAA) (Turner, Pryer & Miao, 1999) and 907R (CCGTCAATTCMTTTRAGTTT) (Lane, 1991) under the following PCR conditions: initial denaturation at 94 °C for 3 min, followed by five cycles of denaturation at 94 °C for 10 s, annealing at 55 °C for 15 s, and extension at 72 °C for 30 s before a final extension at 72 °C for 5 min. After cleanup with AMPure XP beads, the 16S rRNA gene amplicons were attached to dual indices and Illumina sequencing adapters using a Nextera XT Index Kit (Illumina, Inc., San Diego, CA, USA) under the following PCR (also prepared with 2 × KAPA HiFi HotStart ReadyMix) conditions: an initial denaturation at 95 °C for 30 s followed by eight cycles of denaturing at 95 °C for 30 s, annealing at 55 °C for 30 s, and extension at 72 °C for 30 s before a final extension at 72 °C for 5 min. The PCR amplifications were carried out in triplicate for each sample, and the PCR products were again cleaned with AMPure XP beads, quantified using an Agilent Technologies 2100 Bioanalyzer (Agilent Technologies Inc., Santa Clara, CA, USA), normalized, and pooled. These 16S rRNA gene amplicons were then diluted to 4 nM with 10 mM Tris (pH 8.5) before being denatured with NaOH and sequenced (with 5% PhiX as internal control) on a MiSeq IIlumina Platform (PE250) at Genergy Biotechnology (Shanghai, China).
The ITS2 regions of fungal rRNA were amplified using 2 × KAPA HiFi HotStart ReadyMix (Shanghai Dobio) and the primers ITS3_KYO2 (GATGAAGAACGYAGYRAA) and ITS4_KYO3 (TCCTCCGCTTATTGATATGC) (Toju et al., 2012). The PCR conditions were as follows: an initial denaturation of 15 min at 95 °C, followed by 30 cycles of 30 s at 95 °C, 30 s at either 51 °C or 55 °C, and 30 s at 72 °C, and a final elongation for 5 min at 72 °C. The ITS amplicons obtained were then treated and sequenced following the same procedures described earlier for the 16S rRNA gene amplicons.
Phylogenetic analyses
Phylogenetic analyses were carried out according to the methods described by Kong et al. (2017) and Xia et al. (2019a) with modifications. The V4 amplicons of the 16S rRNA genes and ITS fragments were pair-end assembled and checked using Flash software (Magoc & Salzberg, 2011) to ensure that their sequences matched perfectly with the index sequences, had no more than one mismatch error present in the forward primer sequences, and the trimmed sequences were longer than 200 bp. Then, QIIME (Caporaso et al., 2010) was used to analyze the 16S rRNA and ITS amplicons to generate OTU clusters and perform alpha diversity analyses. The V4 and ITS amplicon sequences were grouped into OTUs at the 97% identity threshold (3% dissimilarity levels) using the RDP classifier (Release 11.1 http://rdp.cme.msu.edu/) and Unite (Release 6.0 https://unite.ut.ee/index.php), respectively. Any OTU represented by ≤3 sequences was removed. The 16S rRNA and ITS amplicon sequences were deposited in the NCBI Sequence Read Archive under Submission ID SUB7457084 and BioProject ID PRJNA633422. Biodiversity indices, including the Chao1 index, Shannon index, and coverage ratios, were calculated with Mothur (Schloss et al., 2009) following the procedures provided and again applying a 97% identity threshold.
RNA extraction, library preparation, and sequencing
RNA extraction, library preparation, and sequencing were conducted according to the methods described by Xia et al. (2019b) with modifications. Briefly, total RNA was isolated using TRIzol reagent (Thermo Fisher Scientific, Waltham, MA, USA) after grinding the frozen soil samples to a fine powder in liquid nitrogen. Equimolar amounts of RNA extracted from three rhizosphere soil samples from each plant were pooled for transcriptomic analysis to determine the active microbial groups in the RSM and to screen the differentially expressed genes in the RSMs of the different plant species. The quality and quantity of the extracted RNAs were monitored using 1% agarose gel before rRNAs were removed using Ribo-Zero rRNA Removal Kits (Qiagen) following the manufacturer’s instructions. For each sample, a library of approximately 200 bp insert sizes was prepared with a TruSeq RNA Sample Prep Kit (Qiagen), and mRNAs were amplified with a bridge PCR using a HiSeq 3000/4000 Cluster Kit (Illumina, Inc.) according to the manufacturer’s instructions. The cDNAs obtained were subjected to 2 × 100 bp paired-end (PE100) sequencing on a HiSeq 2000 instrument using HiSeq 3000/4000 SBS Kits (Illumina, Inc.) on the HiSeq platform of Majorbio Bio-Pharm Technology Co., Ltd., Shanghai, China. The raw RNA sequence dataset supporting the conclusions of this article is available in the NCBI Short Reads Archive (SRA) under the submission ID PRJNA638694.
Sequence quality control and genome assembly
Sequence quality control and genome assembly were carried out according the protocols described in Xia et al. (2019b). Briefly, we truncated cDNA sequences at the 3′ and 5′ ends using SeqPrep (https://github.com/jstjohn/SeqPrep) and removed adapter contamination (at least 10 Ns from the raw data (FASTQ format)) using Sickle (https://github.com/najoshi/sickle). Then, we assembled them using SOAPdenovo (https://sourceforge.net/projects/soapfuse/, Version 1.06). Scaffolds over 500 bp were extracted and broken into contigs without gaps. Contigs were used for further gene prediction and annotation.
Gene prediction, taxonomy, and functional annotation
Gene prediction, taxonomy, and functional annotation were carried out according to the protocols described by Wang et al. (2019). Briefly, open reading frames (ORFs) from each soil sample were predicted using MetaGene (http://metagene.nig.ac.jp/metagene/download_mga.html). The predicted ORFs with lengths of more than 100 bp were retrieved and translated to amino acid sequences using the NCBI translation table (http://www.ncbi.nlm.nih.gov/Taxonomy/taxonomyhome.html/index.cgi?chapter=tgencodes#SG1). All sequences from gene sets with a 95% sequence identity (90% coverage) were clustered as a non-redundant gene catalog by CD-HIT (http://www.bioinformatics.org/cd-hit/). After quality control, reads were mapped to the representative genes with 95% identity using SOAPaligner (https://sourceforge.net/projects/soapfuse/), and gene abundances in each sample were evaluated. BLASTP (Version 2.2.28+, http://blast.ncbi.nlm.nih.gov/Blast.cgi) was employed for taxonomic annotations by aligning non-redundant gene catalogs against the NCBI NR database with an e-value cutoff of 1 e−5. Clustering of orthologous groups (COG) of proteins for ORF annotation was performed using BLASTP against the eggNOG database (v4.5) with an e-value cutoff of 1 e−5. Unigene expression heatmaps in the different rhizosphere soil samples were constructed using R package software (https://www.r-project.org).
Nitrogen metabolic enzyme annotations
The non-redundant genes obtained from each individual rhizosphere soil sample were matched with KEGG (Kyoto Encyclopedia of Genes and Genomes, http://www.genome.jp/kegg/) and orthologies related to nitrogen metabolism (metabolic pathway ko00910), including ammonification, nitrification, and denitrification, were retrieved from the KEGG database using BLASTP (BLAST Version 2.2.31+, http://blast.ncbi.nlm.nih.gov/Blast.cgi) with an e-value threshold of 1 e−5. The number of genes matching individual KEGG orthologies was enumerated.
Statistical analyses
Average values and relative abundances of bacterial and fungal phyla and genera were calculated using Excel (Version 2010). Significant differences in soil physiochemical parameters between the different plant species were determined using the Student’s t-test in Excel. Significant differences in the relative abundance of bacterial and fungal phyla and genera between the RSM of A. adenophora and either of the two native plant species were determined using the Kruskal–Wallis test with SPSS (version 16.0). Significant differences were established at P ≤ 0.05. Venn figures and gene expression profiles were calculated and drawn using R software (https://www.r-project.org).
Results
Physiochemical properties of rhizosphere soils
The physiochemical characteristics of the rhizosphere soil supporting the growth of A. adenophora and the two native species are listed in Table 1. The soil parameters supporting only A. adenophora differed from those in which the two native species were growing. Thus, levels of total organic matter, total nitrogen and P, available nitrogen and P, and NO3−-N detected in the rhizosphere soil samples with A. adenophora were significantly (P < 0.05) higher than those detected in the rhizosphere soil samples from both A. indica and I. cylindrica. However, total K levels detected in the rhizosphere soil samples from A. adenophora were significantly (P < 0.05) lower than in rhizosphere soil samples of A. indica and I. cylindrica. Values for soil pH, total P, available K, and NH4+-N did not differ significantly among all three rhizosphere soils. The moisture content of the soil samples from A. adenophora was higher (P < 0.05) than that detected in the rhizosphere soil samples of A. indica but was the same as that for I. cylindrica.
| Rhizospheric soil of plant species | Moisture % | pH | Organic C (g Kg−1) | NH4+-N (mg Kg−1) | NO3−-N (mg Kg−1) | Soluble N (mg Kg−1) | Total N (%) | Total P (mg Kg−1) | Available P (mg Kg−1) | Total K (mg Kg−1) | Available K (mg Kg−1) |
|---|---|---|---|---|---|---|---|---|---|---|---|
| Ag. adenophora 1 | 28.78 | 5.81 | 256.2 | 3.38 | 3.85 | 658.2 | 1.182 | 26.5 | 0.121 | 261 | 0.18 |
| Ag. adenophora 2 | 23.70 | 5.18 | 296.4 | 2.18 | 4.74 | 725.0 | 0.995 | 34.0 | 0.109 | 302 | 0.20 |
| Ag. adenophora 3 | 27.37 | 5.90 | 287.3 | 2.21 | 3.45 | 394.4 | 0.929 | 18.1 | 0.117 | 174 | 0.10 |
| Ar. indica 1 | 22.51 | 5.43 | 96.9 | 7.45 | 2.46 | 398.8 | 0.419 | 10.2 | 0.104 | 169 | 0.25 |
| Ar. indica 2 | 18.69 | 5.37 | 98.3 | 2.93 | 1.76 | 348.6 | 0.426 | 14.9 | 0.115 | 260 | 0.24 |
| Ar. indica 3 | 17.75 | 5.53 | 87.2 | 1.95 | 1.17 | 209.9 | 0.328 | 6.5 | 0.093 | 363 | 0.23 |
| I. cylindrica 1 | 25.76 | 5.79 | 41.0 | 6.33 | 1.07 | 163.4 | 0.173 | 4.0 | 0.114 | 38 | 0.33 |
| I. cylindrica 2 | 26.44 | 6.13 | 74.7 | 2.02 | 1.43 | 72.7 | 0.324 | 12.1 | 0.029 | 155 | 0.44 |
| I. cylindrica 3 | 27.51 | 5.81 | 81.9 | 3.37 | 1.15 | 145.2 | 0.299 | 8.5 | 0.110 | 169 | 0.29 |
Composition and biodiversity of bacterial and fungal communities
16S rRNA and ITS amplicon sequences (Table 2) retrieved from the nine rhizosphere samples of A. adenophora and the native species A. indica and I. cylindrica (three replicas for each) were used to characterize the composition and biodiversity of the bacterial and fungal communities. A total of 46,364 to 66,570 high-quality 16S rRNA sequence reads and 30,659 to 43,822 fungal ITS sequence reads were retrieved from individual samples taken from the nine rhizosphere soil samples. Phylogenetic analyses showed that the sequences retrieved from each of the nine samples belonged to 1,648 and 2,531 bacterial and archaeal OTUs, respectively, and 198 to 665 fungal OTUs, respectively (Figs. 2A and 2B). Chao1 analyses (Table 2) estimated that individually, the RSMs contained 1,860 and 2,842 bacterial and archaeal OTUs, respectively, with a coverage range of 0.98 to 0.99, and 231 to 739 fungal OTUs with a coverage of 0.99, demonstrating that the sequencing depths used in this study covered the diversity of the RSMs from the three plants. Archaeal sequences only accounted for 0–0.05% of the 16S rRNA sequences obtained from individual soil sample. They were not investigated further in this study.
| Sample description | Number of RSeq* | Number of HQSeq* | Number of OTUs | Chao1 richness | Shannon index | Coverage values | ||||||
|---|---|---|---|---|---|---|---|---|---|---|---|---|
| Fungi | Bacteria | Fungi | Bacteria | Fungi | Bacteria | Fungi | Bacteria | Fungi | Bacteria | Fungi | Bacteria | |
| Ag. adenophora 1 | 62764 | 44556 | 56875 | 43822 | 2202 | 617 | 2477 | 671 | 6.23 | 4.14 | 0.99 | 0.99 |
| Ag. adenophora 2 | 60046 | 39626 | 52712 | 39035 | 2143 | 592 | 2455 | 643 | 6.24 | 4.25 | 0.99 | 0.99 |
| Ag. adenophora 3 | 64165 | 33607 | 57701 | 33037 | 2198 | 497 | 2519 | 554 | 6.13 | 3.83 | 0.99 | 0.99 |
| Ar. indica 1 | 71454 | 44760 | 65216 | 43945 | 2120 | 665 | 2482 | 739 | 6.00 | 4.75 | 0.99 | 0.99 |
| Ar. indica 2 | 50721 | 30909 | 46364 | 30659 | 1655 | 435 | 2039 | 494 | 5.72 | 3.64 | 0.99 | 0.99 |
| Ar. indica 3 | 73284 | 35991 | 66570 | 35504 | 2531 | 523 | 2843 | 631 | 6.21 | 3.51 | 0.99 | 0.99 |
| I. cylindrica 1 | 61819 | 38371 | 57131 | 38115 | 1648 | 198 | 1860 | 231 | 5.48 | 1.84 | 0.99 | 0.99 |
| I. cylindrica 2 | 67419 | 33561 | 61994 | 35381 | 2027 | 262 | 2264 | 298 | 6.04 | 2.95 | 0.99 | 0.99 |
| I. cylindrica 3 | 51598 | 44432 | 46368 | 43788 | 2275 | 576 | 2598 | 660 | 6.25 | 3.71 | 0.98 | 0.99 |
Notes:
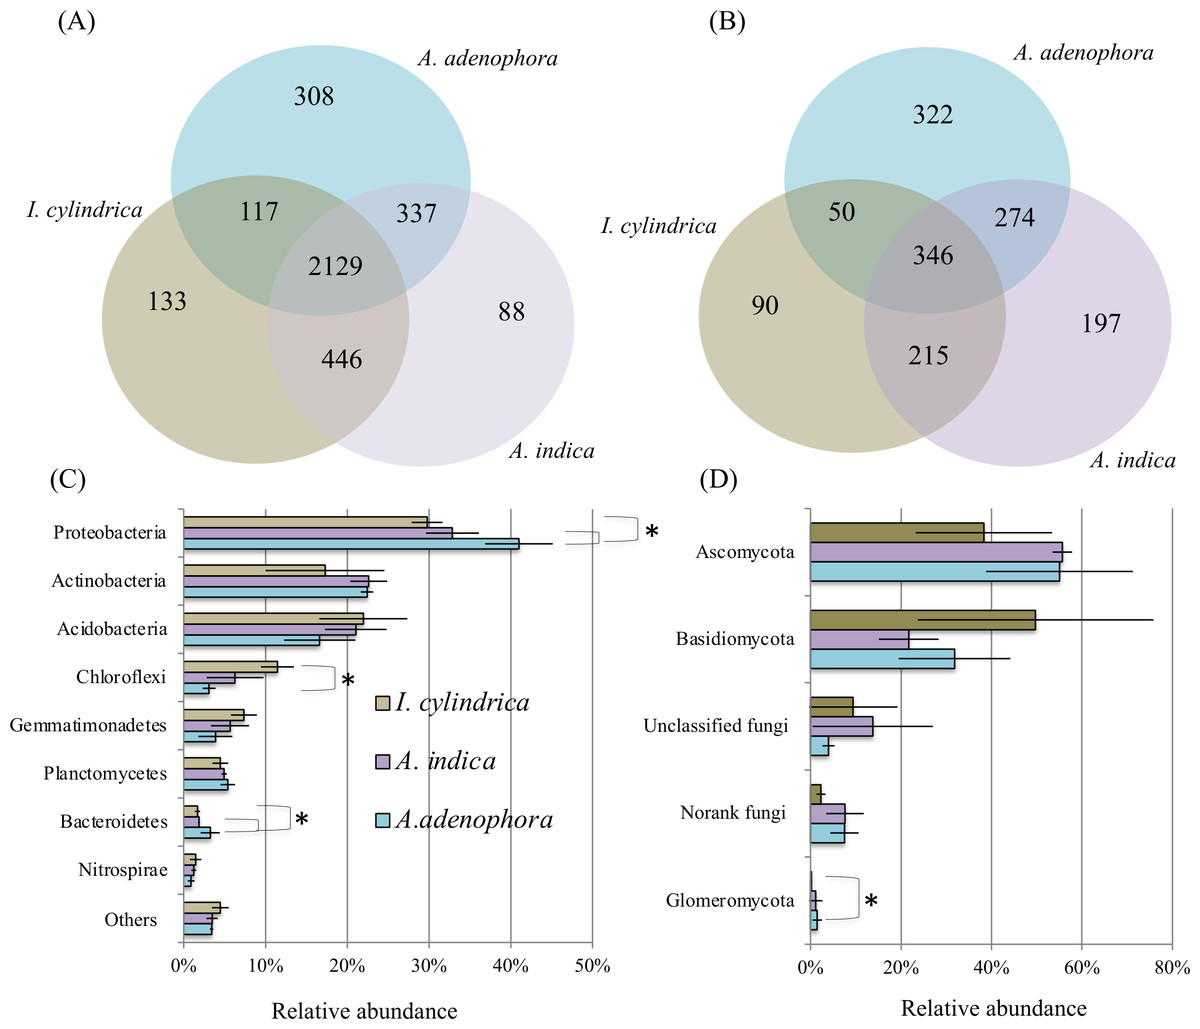
Figure 2: Diagrams of Venn (A & B) and phylum composition (C & D) of the rhizosphere soil microbiotas of invasive weed Ageratina adenophora, and native plant species Artemisia indica and Imperata cylindrica.
(A & B) showing the occurrence of bacterial (A) and fungal (B) OTUs identified using 16S rRNA gene and ITS fragment sequencing. (C & D) showing the phylum compositions of bacterial (C) and fungal (D) communities. The symbol labels in (C) apply to (D). An asterisk (*) indicates significant difference in phylum relative percentage abundance.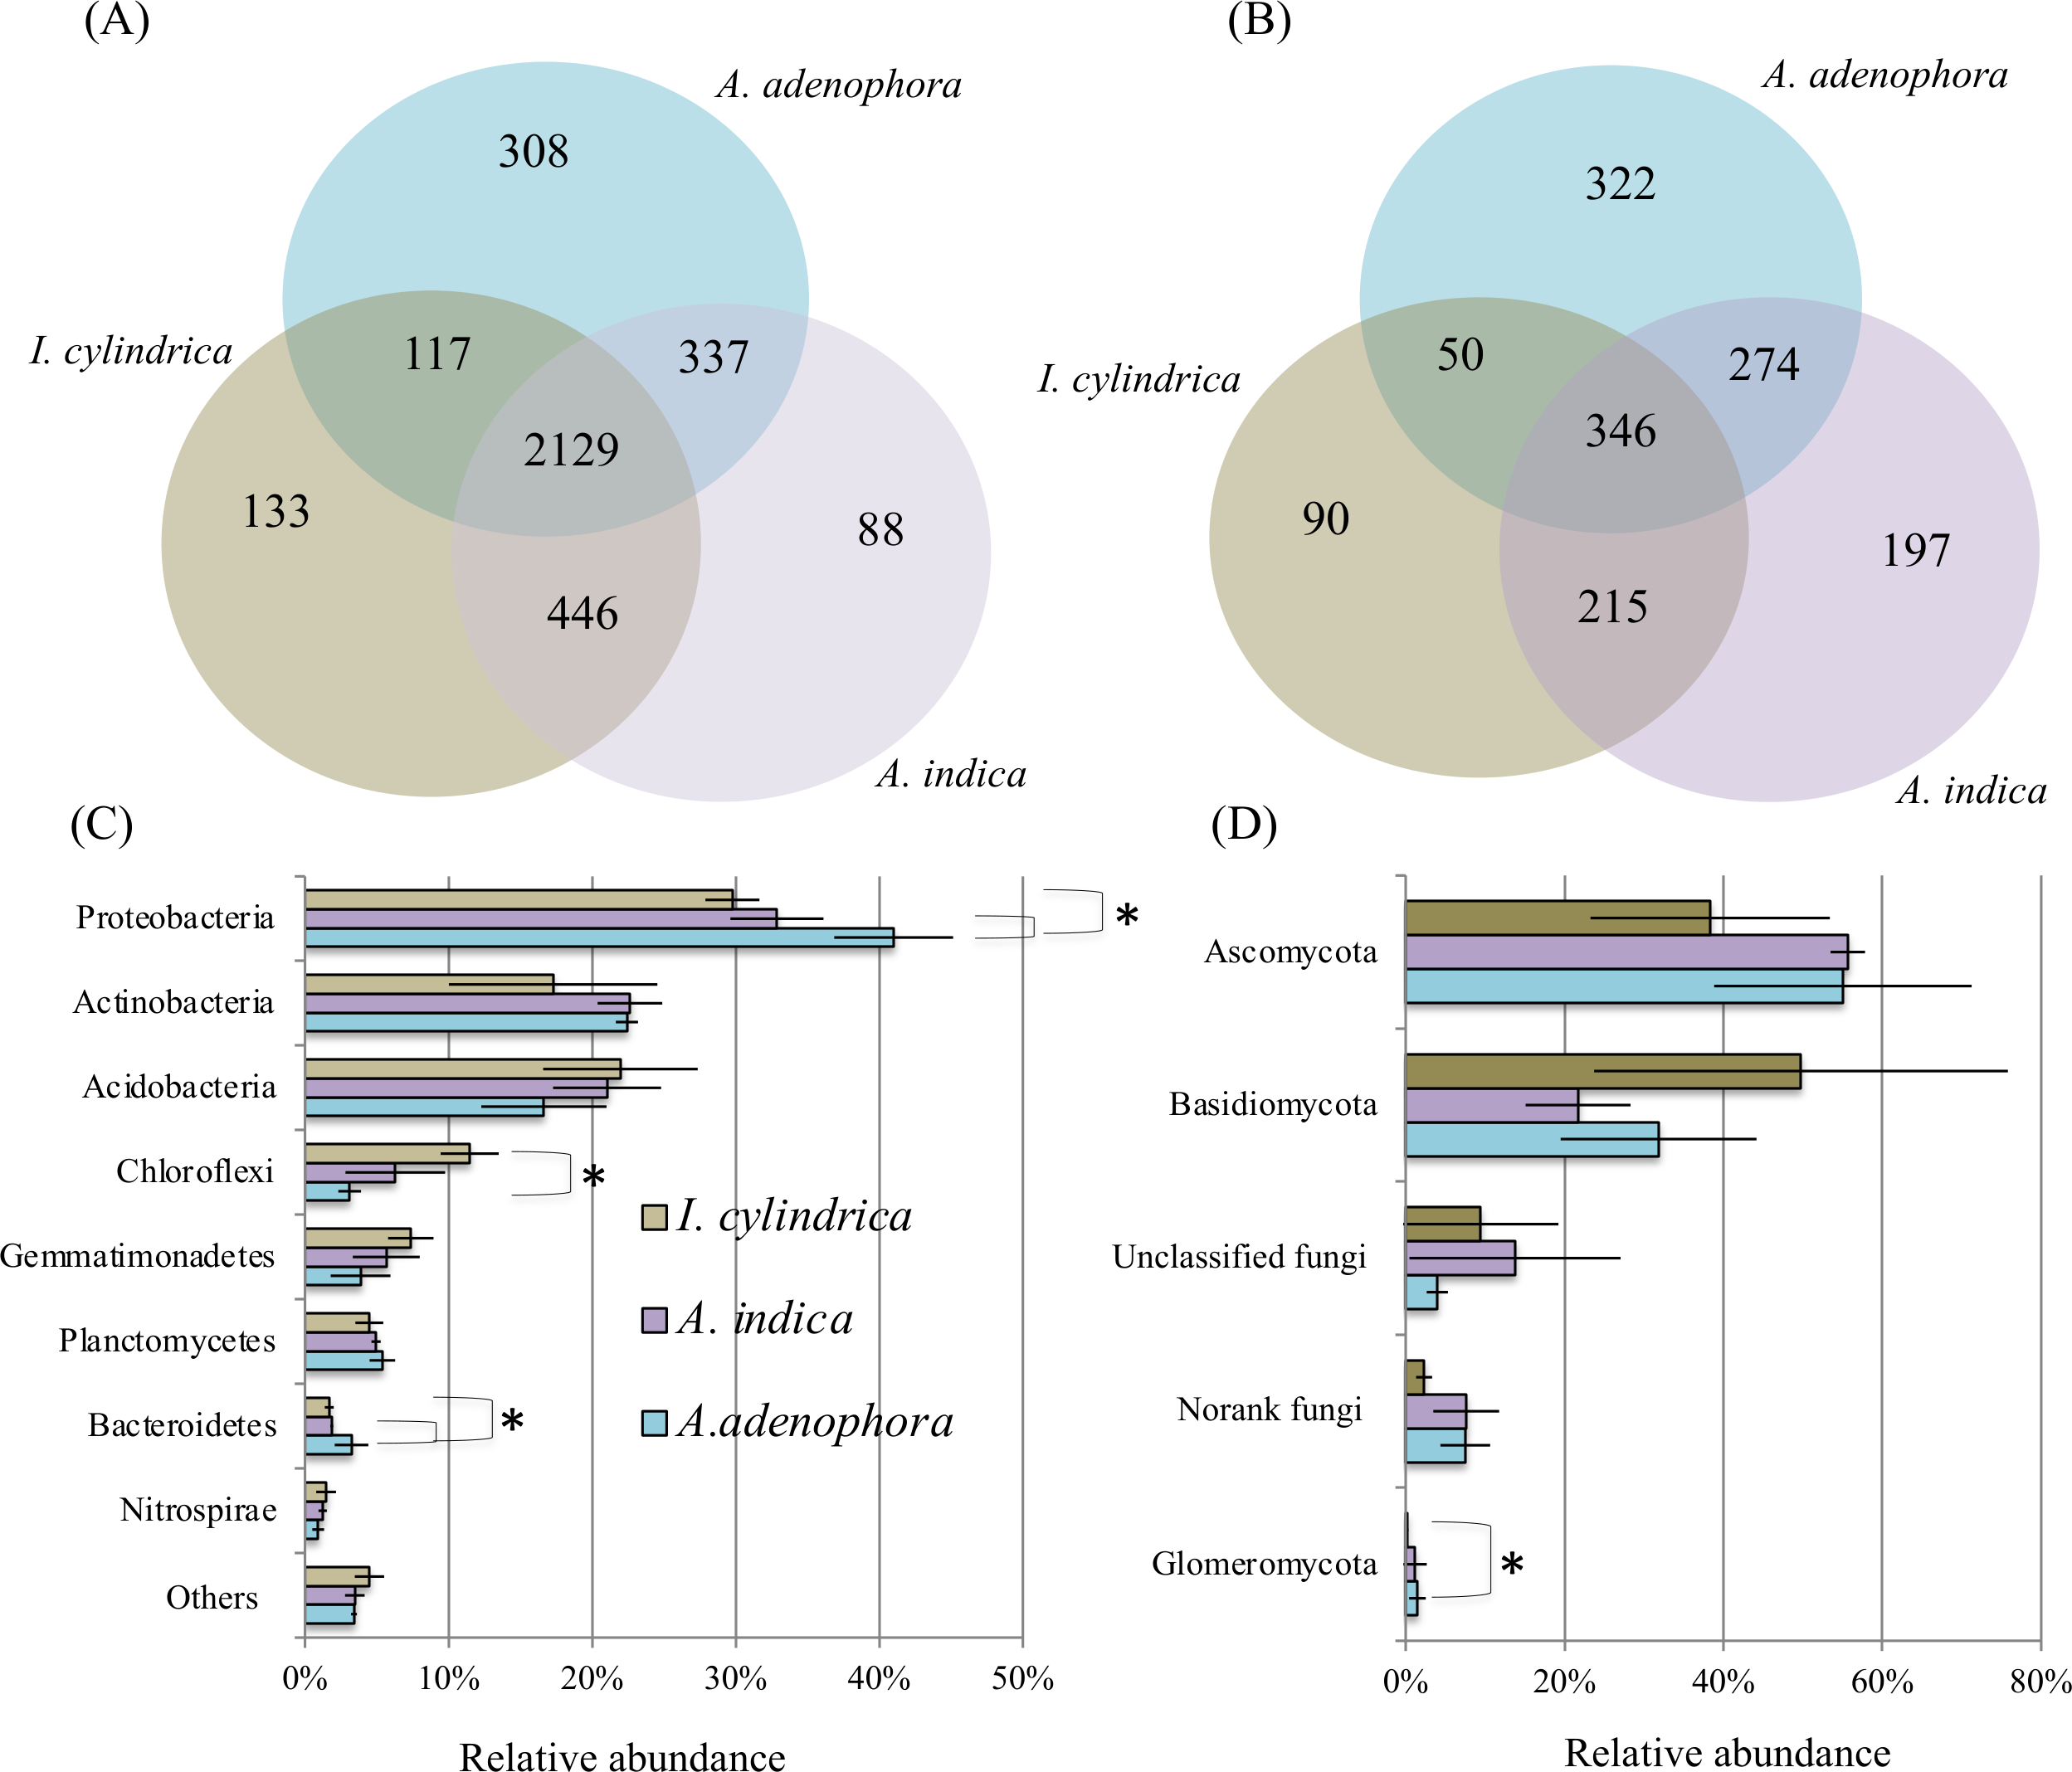
The composition of the bacterial community in the RSM of A. adenophora differed from those in the RSM of the two native species. At the phylum level, the 16S rRNA gene sequences identified from the nine rhizosphere samples belonged to members of 37 divisions and consisted of 34 bacterial phyla. The majority were members of the phyla Proteobacteria, Actinobacteria, Acidobacteria, Chloroflexi, Gemmatimonadetes, Planctomycetes, Bacteroidetes, and Nitrospirae, where each of their mean percentage abundances in all soil samples were >1.20% (Fig. 2C). The A. adenophora RSM contained a higher percentage abundance of members of Proteobacteria (P = 0.05) and Bacteroidetes (P = 0.05) than those of A. indica and I. cylindrica, and a lower (P = 0.05) percentage abundance of Chloroflexi than that of I. cylindrica (Fig. 2C).
29%–81% of the 16S rRNA sequences identified for each of the nine RSM samples could be classified reliably at the genus level, where 497 individual genera or taxa were seen. Forty-seven of these were assessed to be relatively abundant, with each accounting for an average of at least 0.5% of the total sequences detected in the combined rhizosphere soil samples (Table S1). Of these, the RSM of A. adenophora contained a higher (P = 0.05) percentage abundance of Norank 480-2, Norank Subgroup 7, Rhodoplanes, uncultured Xanthomonadales, and Variibacter, and a lower (P = 0.05) percentage abundance of unclassified Gemmatimonadaceae than that of A. indica. It also possessed a higher (P = 0.05) abundance of the denitrifying Haliangium, Acidibacter, Norank 480-2, Rhizomicrobium, Rhodoplanes, unclassified Comamonadaceae, uncultured Chitinophagaceae, uncultured Xanthomonadales, and Variibacter and a lower (P = 0.05) percentage abundance of uncultured Gemmatimonadaceae, Norank TK10, Anaeromyxobacter, Norank Subgroup 7, Norank JG37-AG-4, Norank Latescibacteria, and unclassified Gemmatimonadaceae than I. cylindrica (Table S1).
As with the bacterial communities, the fungal community of the A. adenophora RSM differed less from that of A. indica than from that of I. cylindrica. ITS sequences identified from the nine rhizosphere soil samples belonged to members of six fungal phyla. Most were members of Ascomycota and Basidiomycota (Fig. 2D), while the remainder were members of the phyla Glomeromycota, Chytridiomycota, Blastocladiomycota, and Entomophthoromycota. The percentage abundance of Glomeromycota in the RSM of A. adenophora was higher (P = 0.05) than that in the RSM of I. cylindrica (Fig. 2D). However the percentage abundance was not significantly (P > 0.05) different than those of the other phyla detected between the RSM of A. adenophora and those of either of the two native species. The identified fungal ITS sequences belonged to 348 genera. Thirty-five were assessed to be relatively abundant, with each accounting for an average of at least 0.5% of the total fungal ITS sequences detected in all the rhizosphere soil samples (Table S2). The RSM of A. adenophora contained a higher (P = 0.05) percentage abundance of Penicillium and a lower (P = 0.05) percentage abundances of Fusarium and Clavaria than that of A. indica, and a higher (P ≤ 0.05) percentage abundance of Mortierella, Penicilium, Cladophialophora, Metarhizium, Exophiala, Nectria, Pyrenochaeta, Oliveonia, Acremonium, and Hypomyces and a lower (P ≤ 0.05) percentage abundance of Gilophorus, Pyrenula, and Troposporella than that of I. cylindrica (Table S2).
Function and expression of unigenes identified in the rhizosphere microbiomes of A. adenophora and the two native species
Approximately 314 million raw paired-end RNA sequence reads were retrieved from the total rhizosphere soil samples of the three plants. Between 97 and 112 million high-quality reads were retrieved for each of the rhizosphere RNA samples. After the removal of rRNA reads, the rhizosphere soils of A. adenophora, A. indica, and I. cylindrica contained 6,922,157, 4,263,665, and 3,203,005 cDNA reads, respectively, for ORF prediction. Furthermore, 75,913, 55,826, and 39,458 unigenes were identified in their rhizosphere soils, respectively.
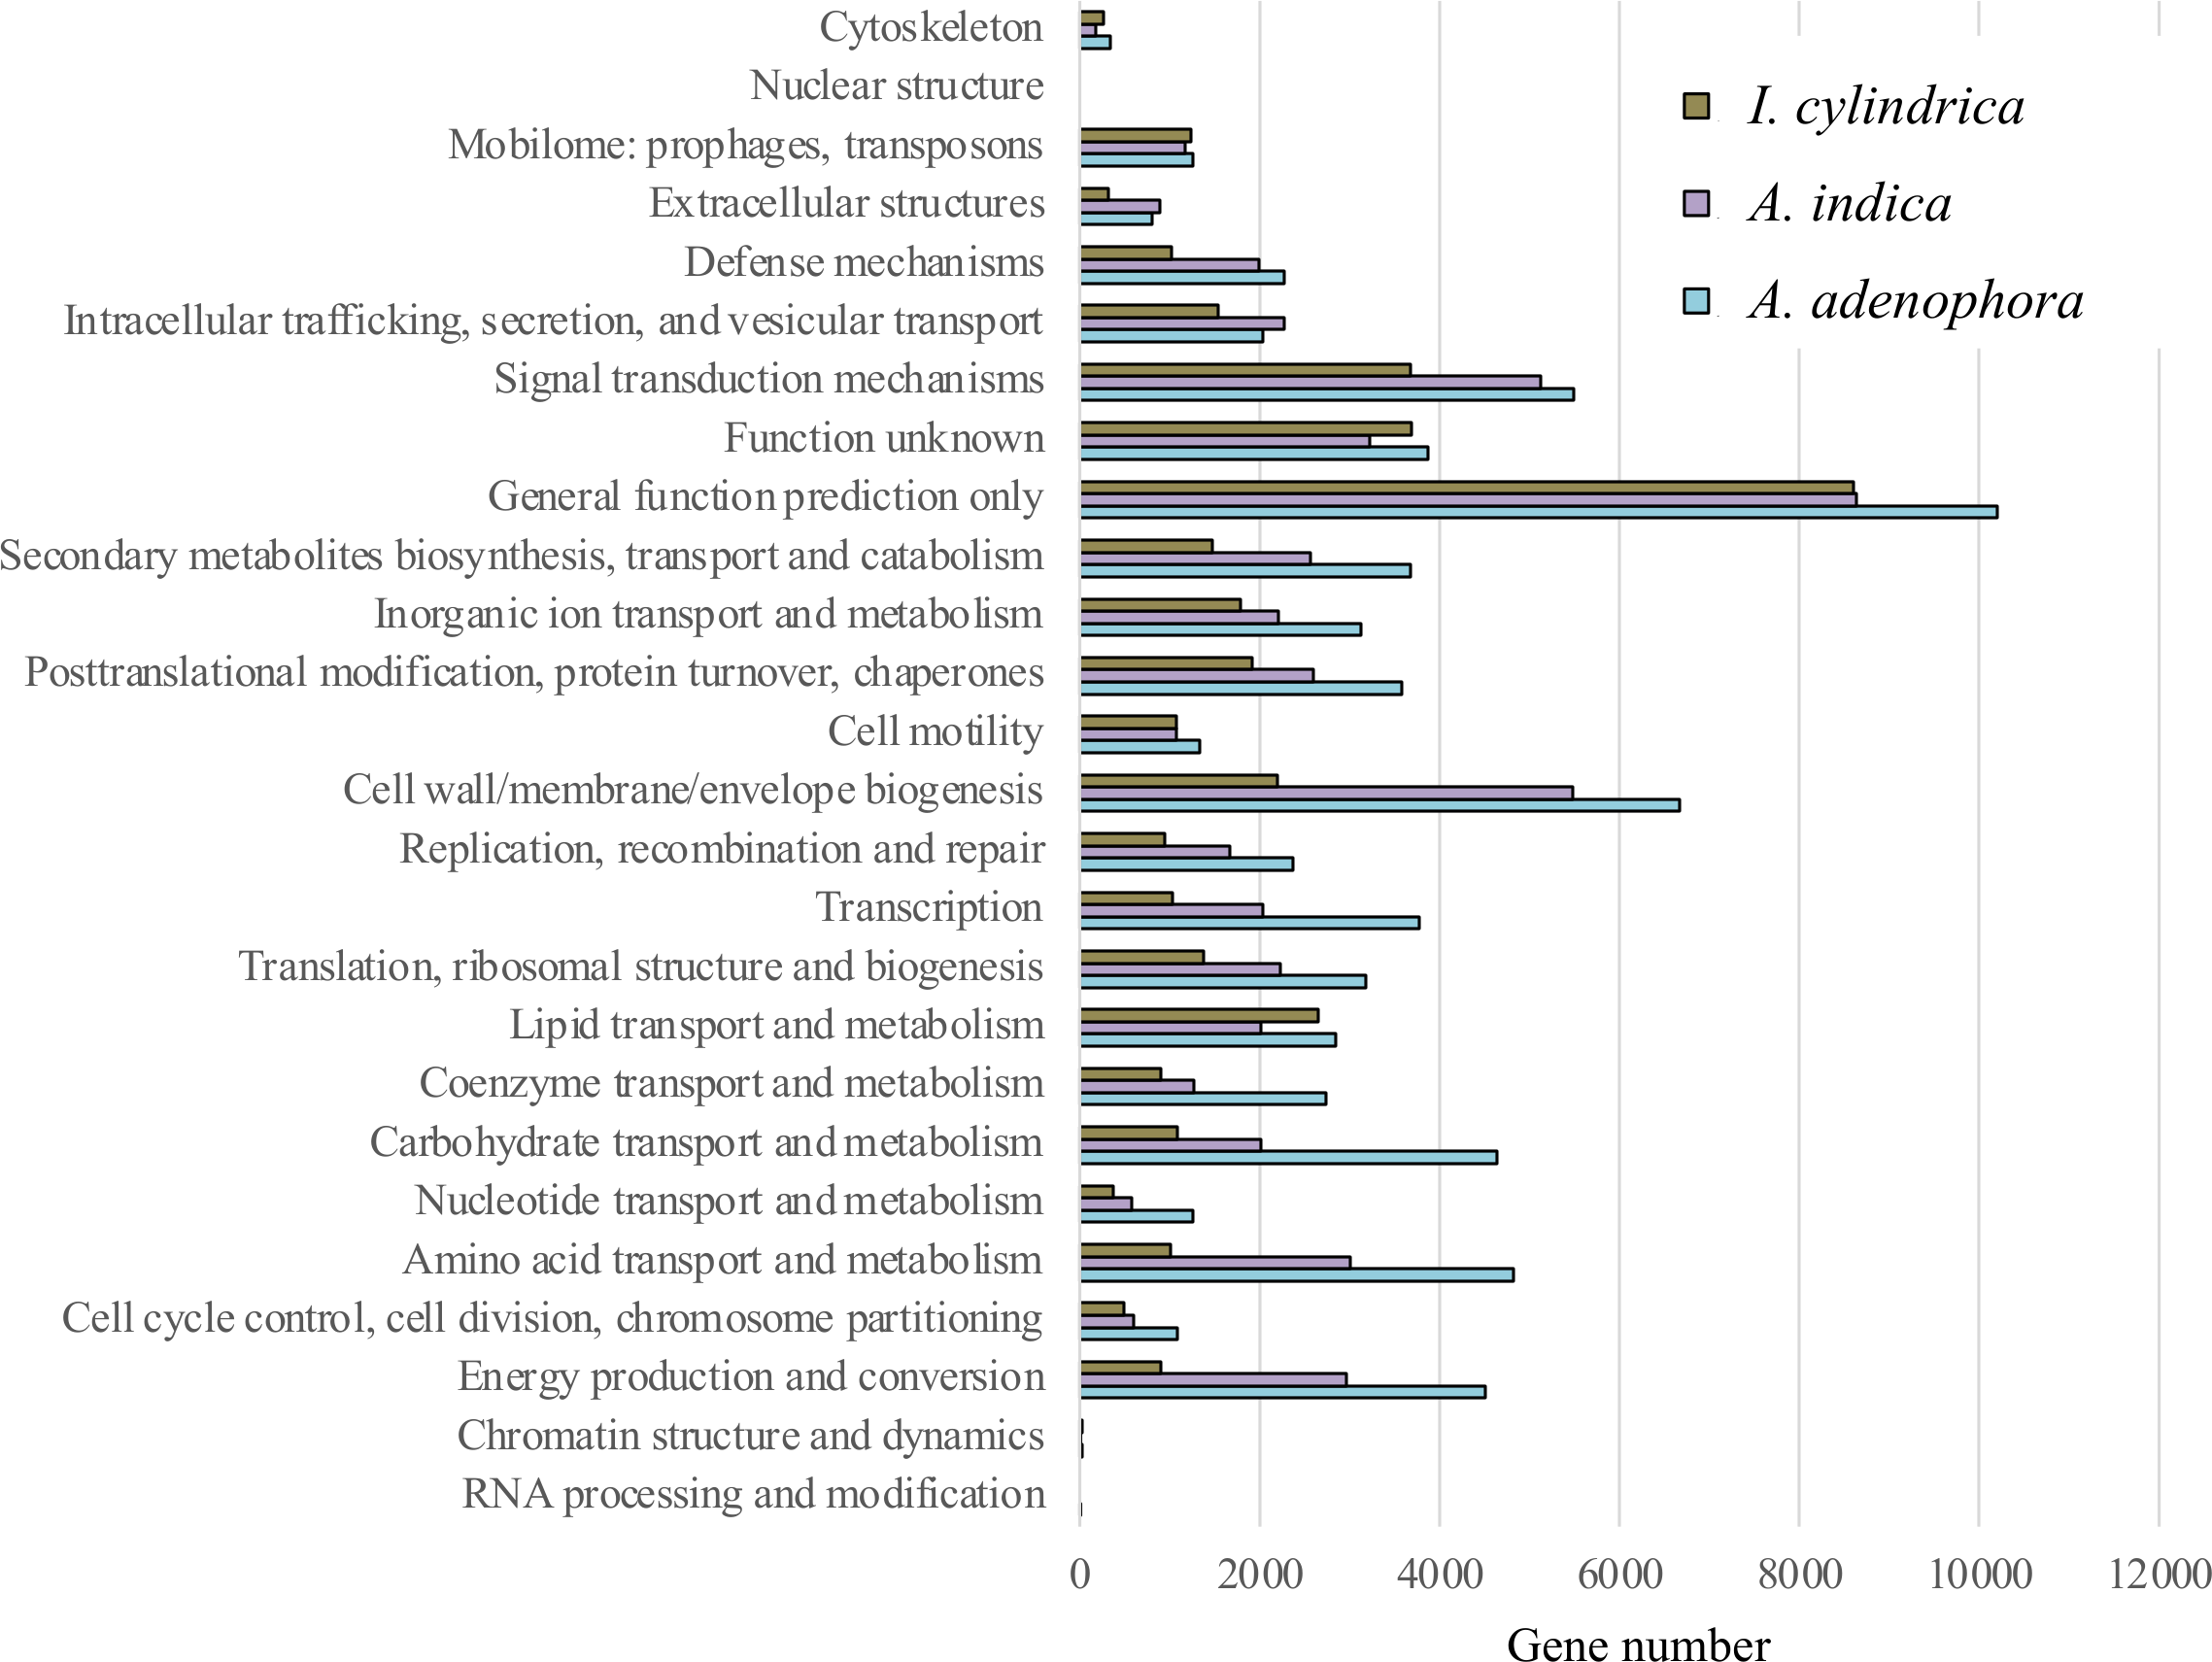
The expression numbers of the unigenes classified with COG function in each rhizosphere soil sample are shown in Fig. 3. Of those with known functions the abundant were: genes encoding polypeptides associated with cell wall, membrane, and envelope biogenesis; signal transduction mechanisms; amino acid transport and metabolism; energy production and conversion; posttranslational modification, protein turnover, and chaperones; carbohydrate transport and metabolism; secondary metabolites biosynthesis, transport, and catabolism; and lipid transport and metabolism (an average of between 2,505 and 4,782 genes each for all samples). The genes encoding polypeptides associated with inorganic transport and metabolism, transcription and translation, ribosomal structure, and biogenesis were less abundant (each contributing approximately 2,263 to 2,373 genes).
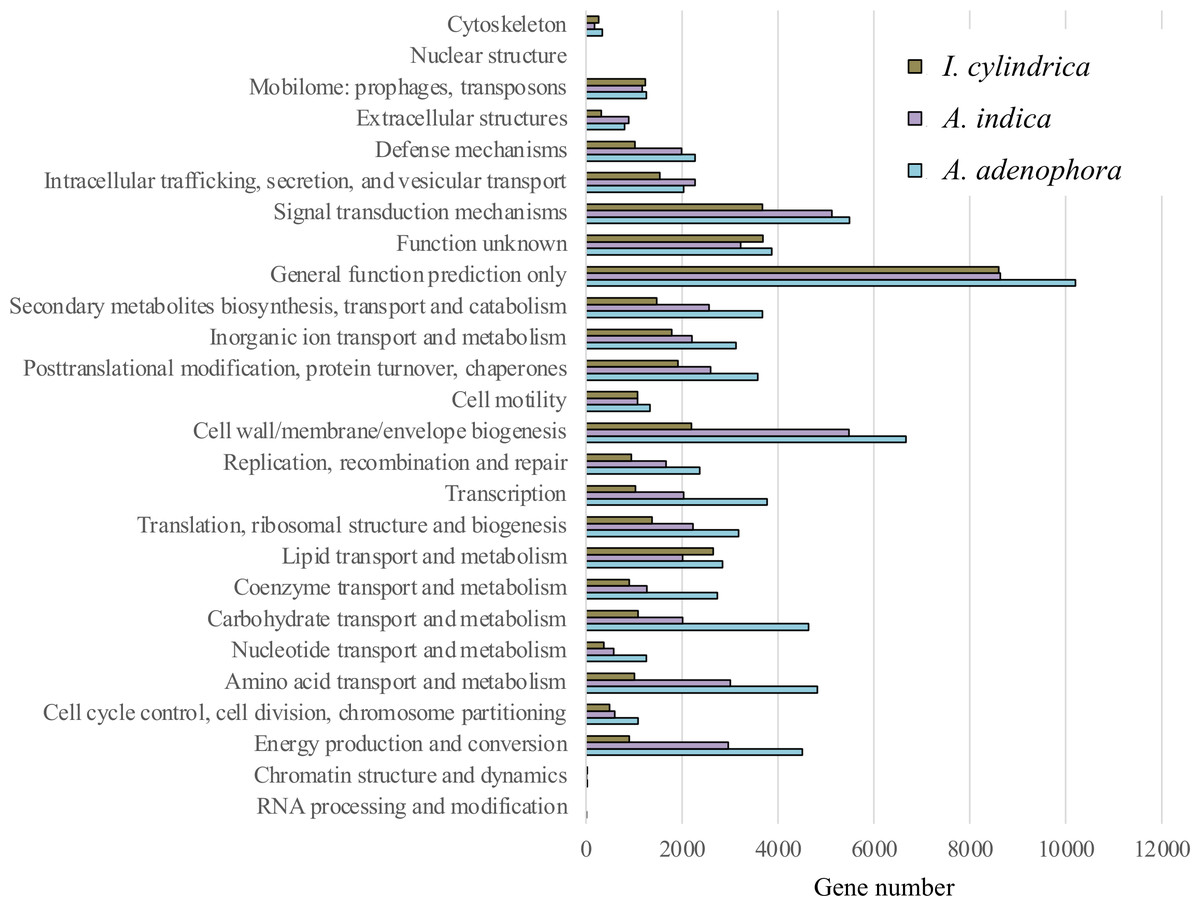
Figure 3: Expression of functional genes in the rhizosphere soils of weed Ageratina adenophora, and native plant species Artemisia indica and Imperata cylindrica based on cluster of orthologous groups.
The expression levels of functional genes in the RSM of A. adenophora differed from those in the RSMs of the two native plant species. Thus, the RSM of A. adenophora displayed 1.2 and 3.0 times the expression levels of genes encoding for cell wall, membrane, and envelope biogenesis; 1.6 and 4.8 times those of genes encoding amino acid transport and metabolism; 1.5 and 5.0 times those of genes encoding energy production and conversion; 2.3 and 4.3 times those of genes encoding carbohydrate transport and metabolism; 1.4 and 2.5 times those of genes encoding secondary metabolite biosynthesis, transport, and catabolism; 1.9 and 3.7 times those of genes encoding transcription; 1.4 and 2.3 times those of genes encoding translation, ribosomal structure, and biogenesis; 1.4 and 2.5 times those of genes encoding replication, recombination, and repair; 2.2 and 3.0 times those of genes encoding coenzyme transport and metabolism; and 2.2 and 3.4 times those of genes encoding nucleotide transport and metabolism compared to those of genes expressed in the RSMs of A. indica and I. cylindrica, respectively (Fig. 3).
Phylogenetic classification and relative abundance of functional genes identified in the rhizosphere microbiomes of A. adenophora and the two native plant species
The taxonomic relationships of the unigenes identified in the A. adenophora RSM were similar to those identified in the A. indica RSM, but differed markedly from those in the I. cylindrica RSM. Fungi contributed to most of the total genes expressed in the RSMs of both A. adenophora and A. indica at the kingdom level, while those from Bacteria and Archaea accounted for the majority of the genes expressed in the I. cylindrica RSM (Fig. 4A). Thus, fungal members from the phyla Ascomycota, Basidiomycota, and Glomeromycota accounted for the majority of the genes expressed in the RSMs of A. adenophora and A. indica, while prokaryote members belonging to Proteobacteria, Euryarchaeota, Acidobacteria, Bacteroidetes, Firmicutes, Verrucomirobia, and Cyanobacteria were the major contributors in the I. cylindrica RSM (Fig. 4B). Furthermore, at the gene level, the RSM of A. adenophora was closer in composition and relative expression level of unigenes to those in the RSM of A. indica than to those in the RSM of I. cylindrica (Fig. 4C).
Expression of nitrogen metabolism associated genes in the rhizosphere microbiomes of A. adenophora and both native plant species
The expression profiles of genes involved in nitrogen metabolism in the RSM of A. adenophora were similar to those in the RSMs of both native plant species (Fig. 5). Thus, the read numbers of genes encoding nitrogenase, nitrous oxide reductase, nitrite reductase, nitric oxide reductase, hydroxylamine reductase, hydroxylamine oxygenase, and hydroxylamine monooxygenase in the RSM of A. adenophora did not differ substantially from those in either of the two native plant species (Fig. 5). One exception was the nitrate reductase encoding gene, whose read number was markedly higher in the A. adenophora RSM.
Discussion
We compared the compositional and metabolic characteristics of the RSM of the highly invasive weed A. adenophora against those of two native species to elucidate the effects of A. adenophora root exudates on the composition and metabolism of its RSM and assessed the role of bacterial and fungal communities present in its nutrient cycles. We found that the composition of the bacterial and fungal communities of the A. adenophora RSM varied in differing degrees to those of the two native species (Tables S1& S2, Figs. 2C& 2D). More compositional differences were observed in the RSM of I. cylindrica in the uninvaded area than in that of A. indica co-existing with A. adenophora. The RSM of A. adenophora had a higher (P ≤ 0.05) percentage of bacterial Norank 480-2, Rhodoplanes, uncultured Xanthomonadales, Variibacter, and fungal Penicillium than those of the native plant species. In an earlier study, Zhao et al. (2019) found members of the genera Gp6 (Acidobacteria), together with Sphingomonas, and Spartobacteria contributed most to the dissimilarities between rhizosphere soils of the weed A. adenophora and other different native plant species. Such a striking discrepancy probably reflects differences in the native plant species and soil types used in the two studies.
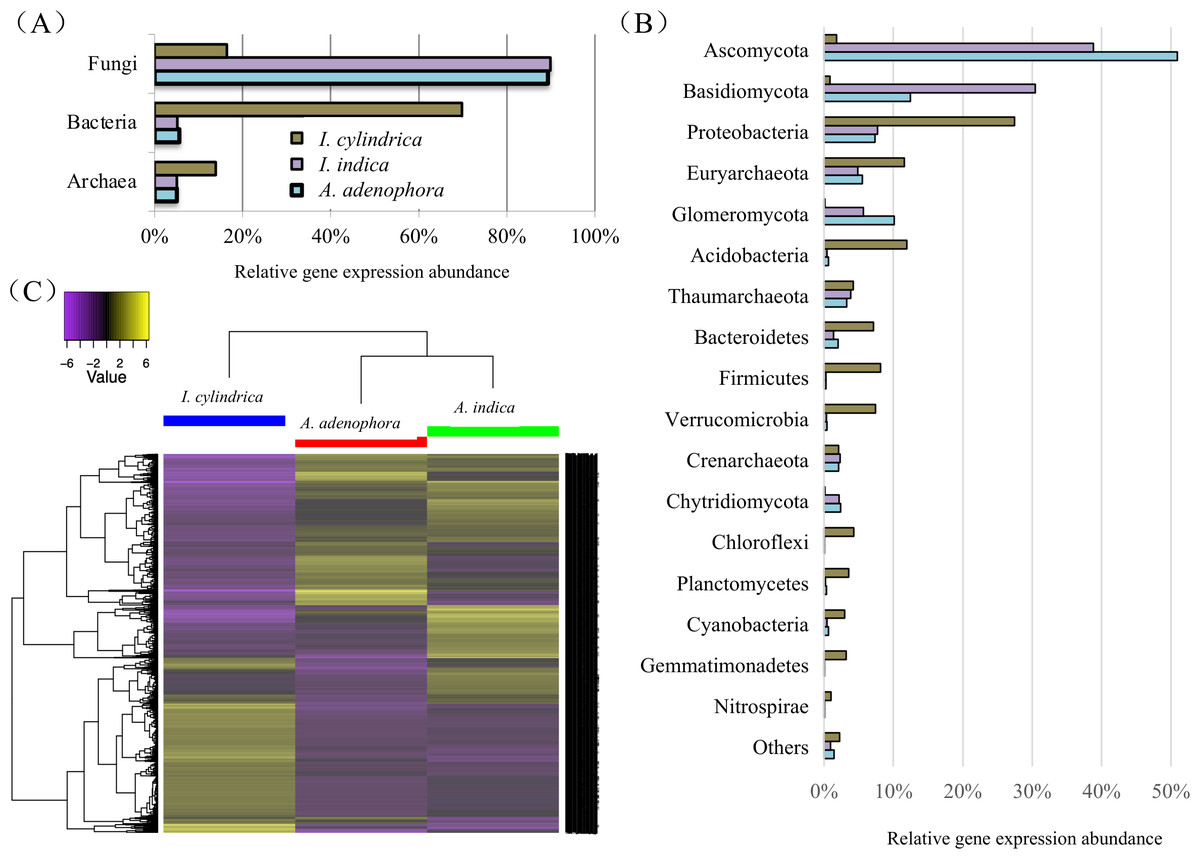
Figure 4: Taxonomic classification and heatmap of unigenes identified in the rhizosphere soils of weed Ageratina adenophora, and native plant species Artemisia indica and Imperata cylindrica.
(A & B) Taxonomic classification at kingdom (A) and phylum (B) levels and relative abundances of the classifiable unigenes. (C) Heatmap of unigenes showing composition and relative abundances of the unigenes. The symbol labels in (A) apply to (B).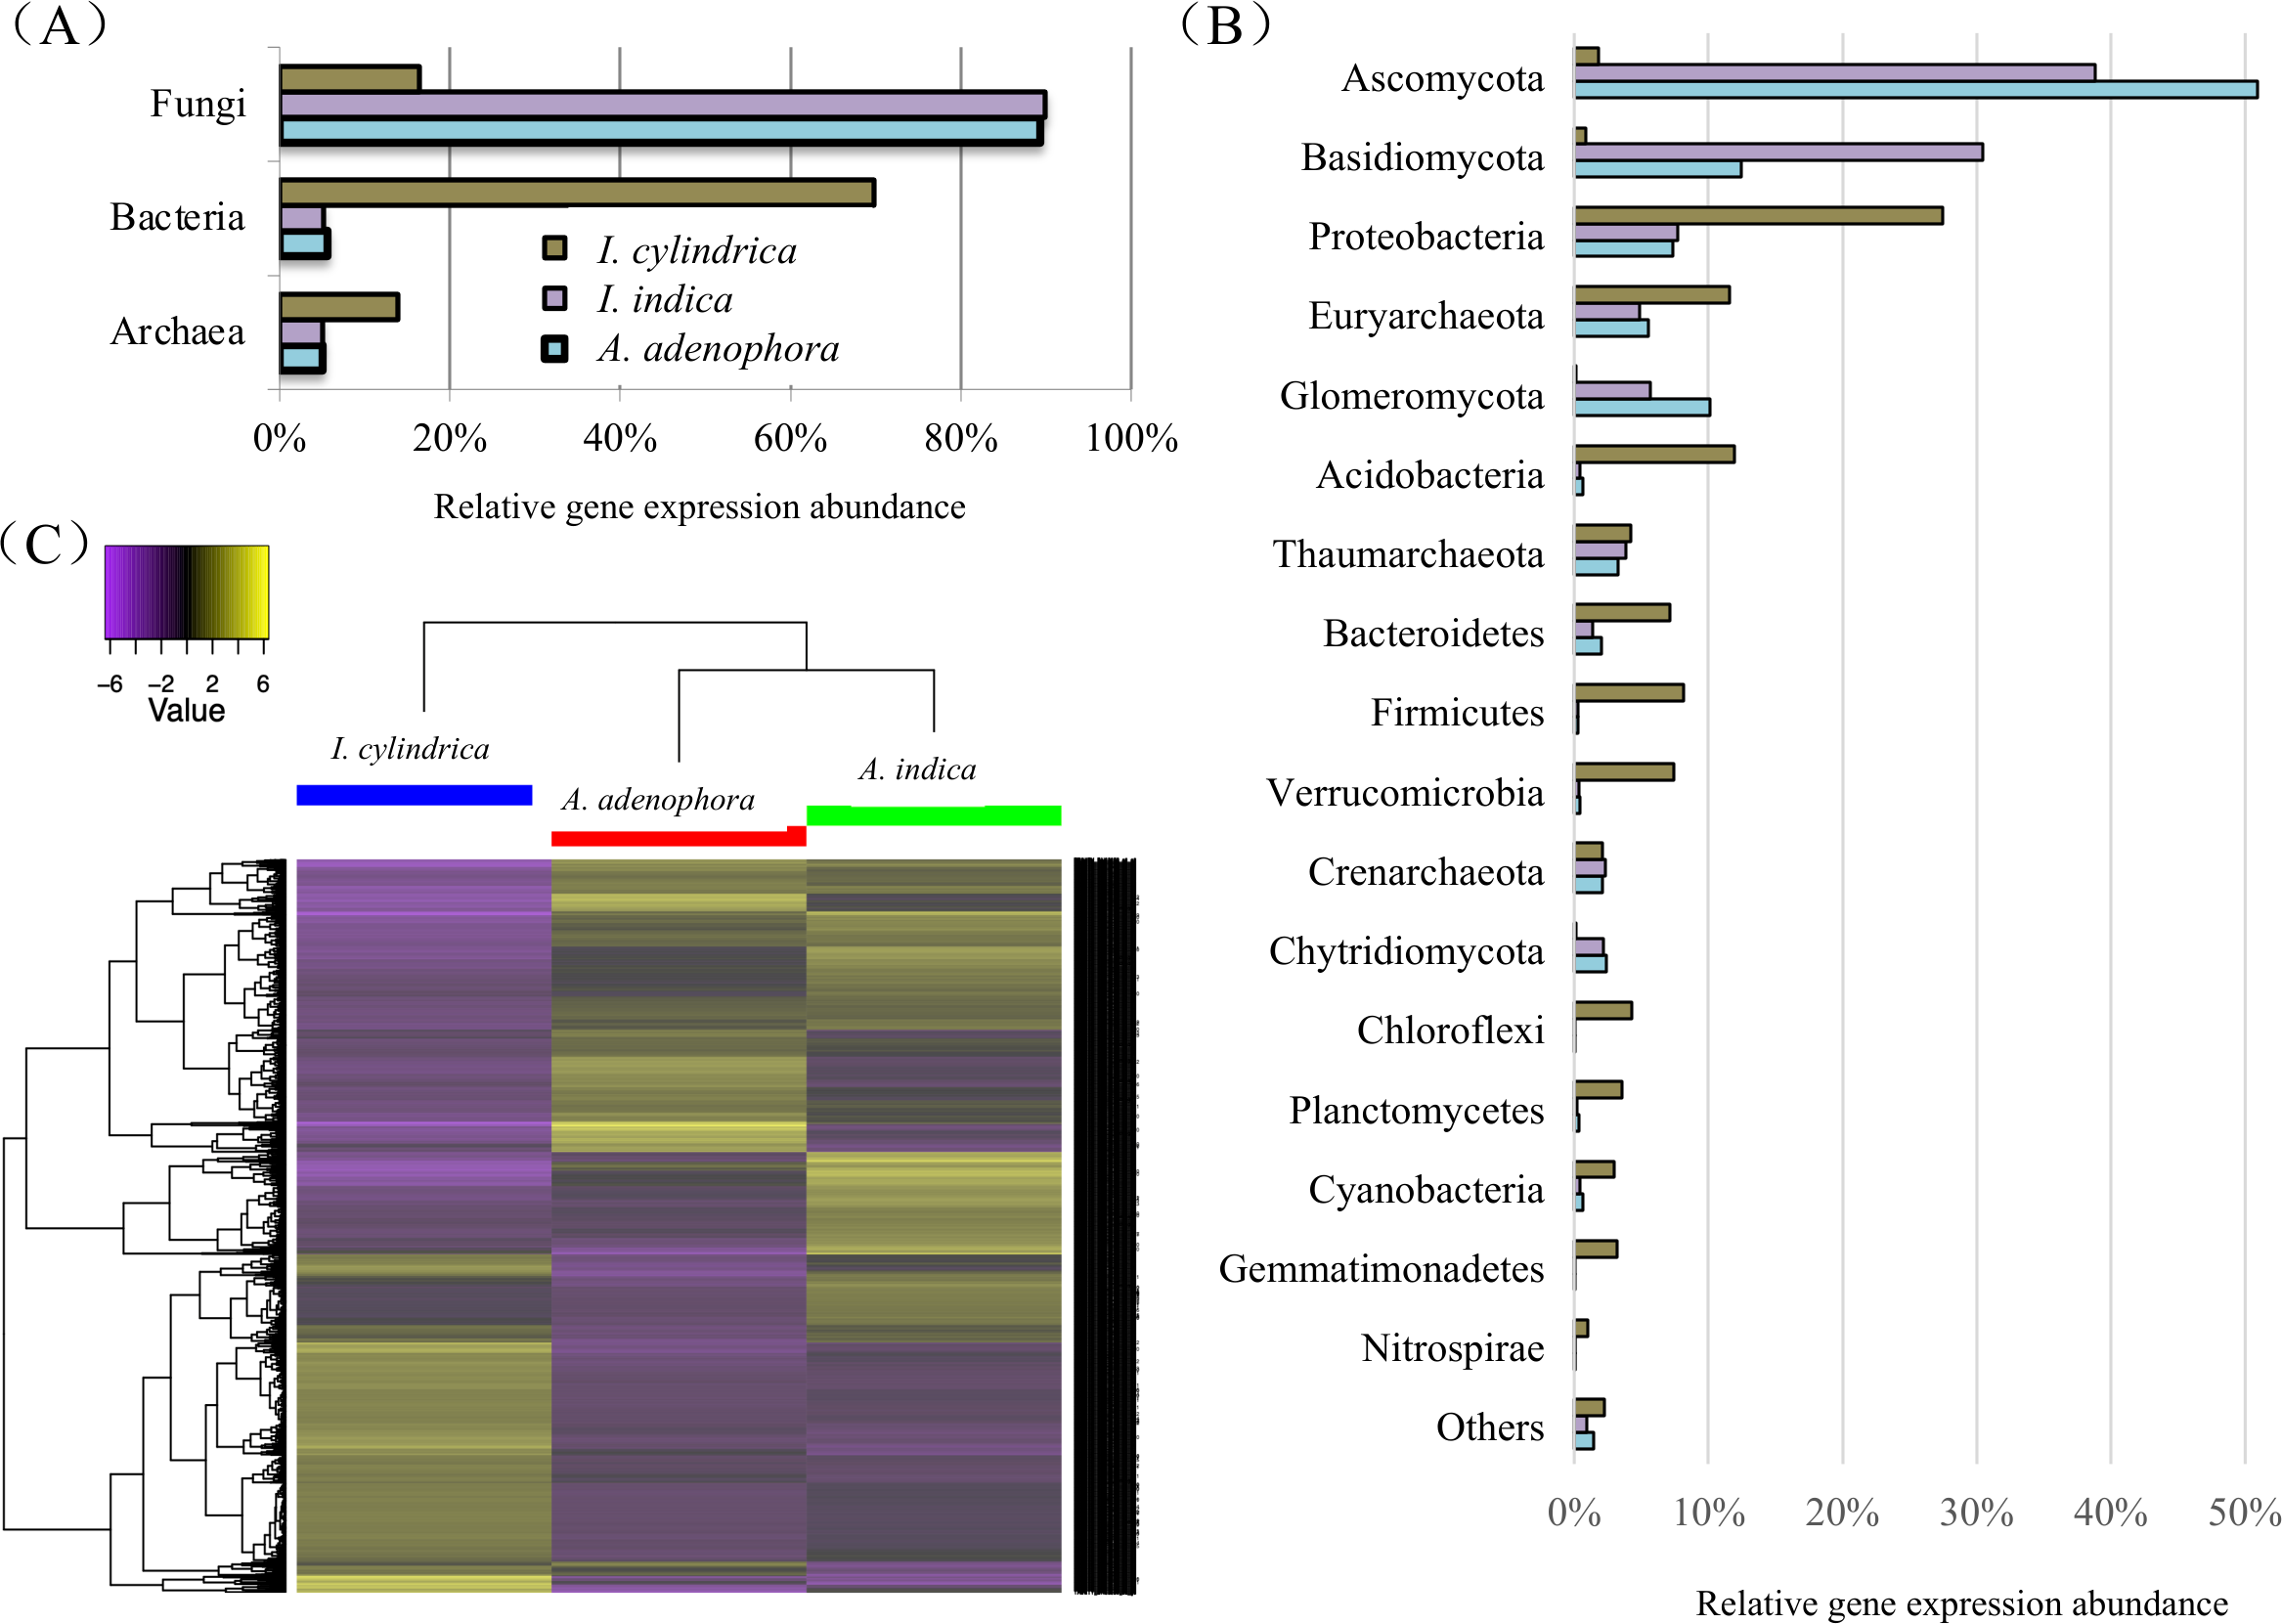
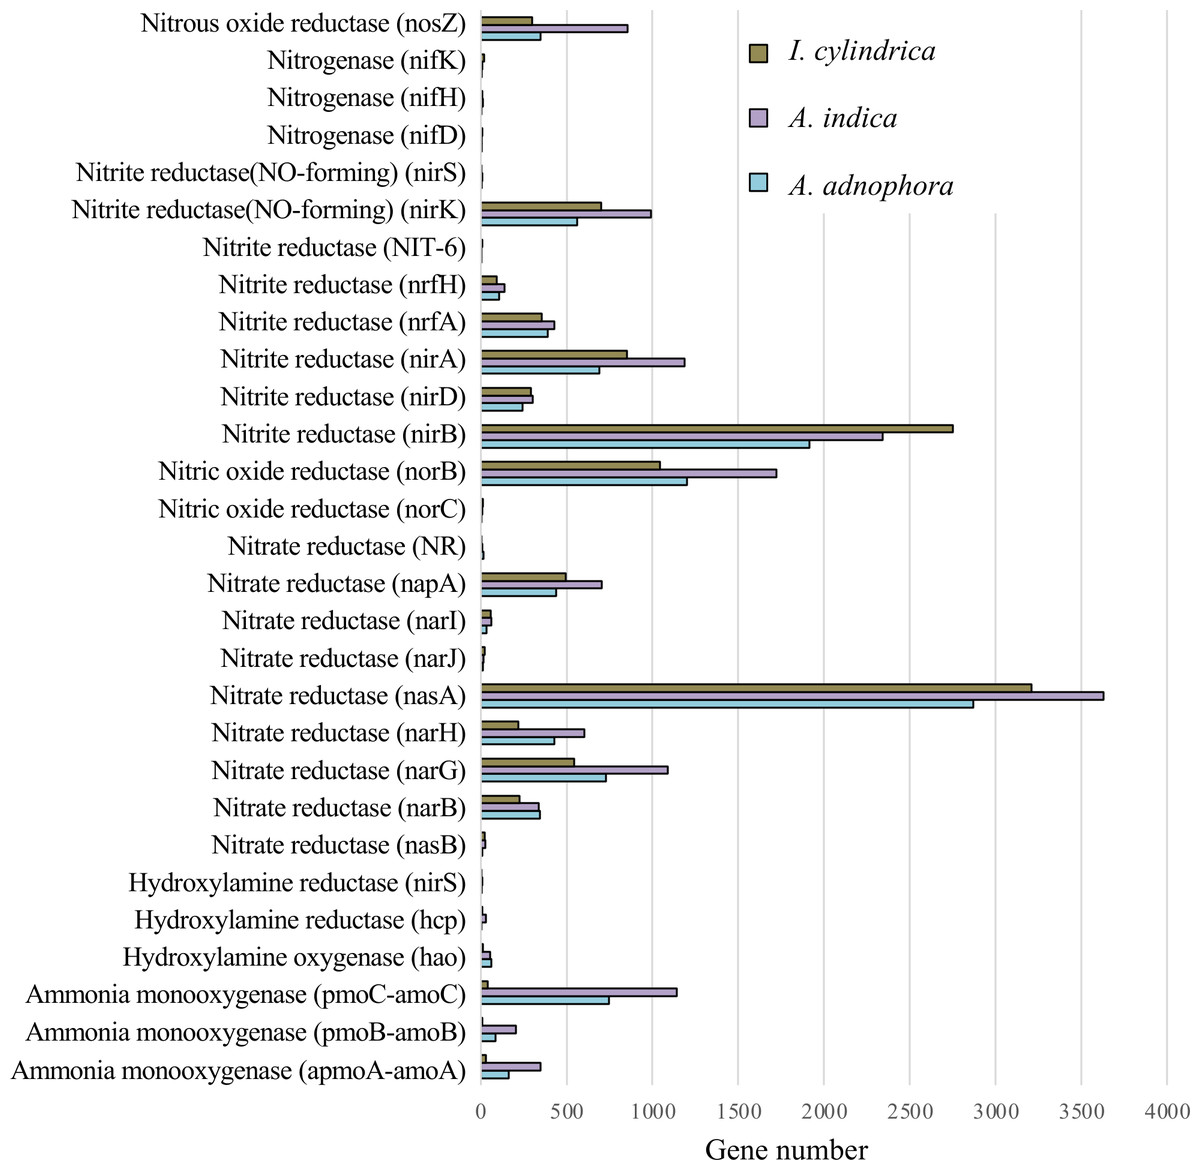
Figure 5: Expression of nitrogen metabolism genes in the rhizosphere soils of invasive weed Ageratina adenophora, and native plant species Artemisia indica and Imperata cylindrica.
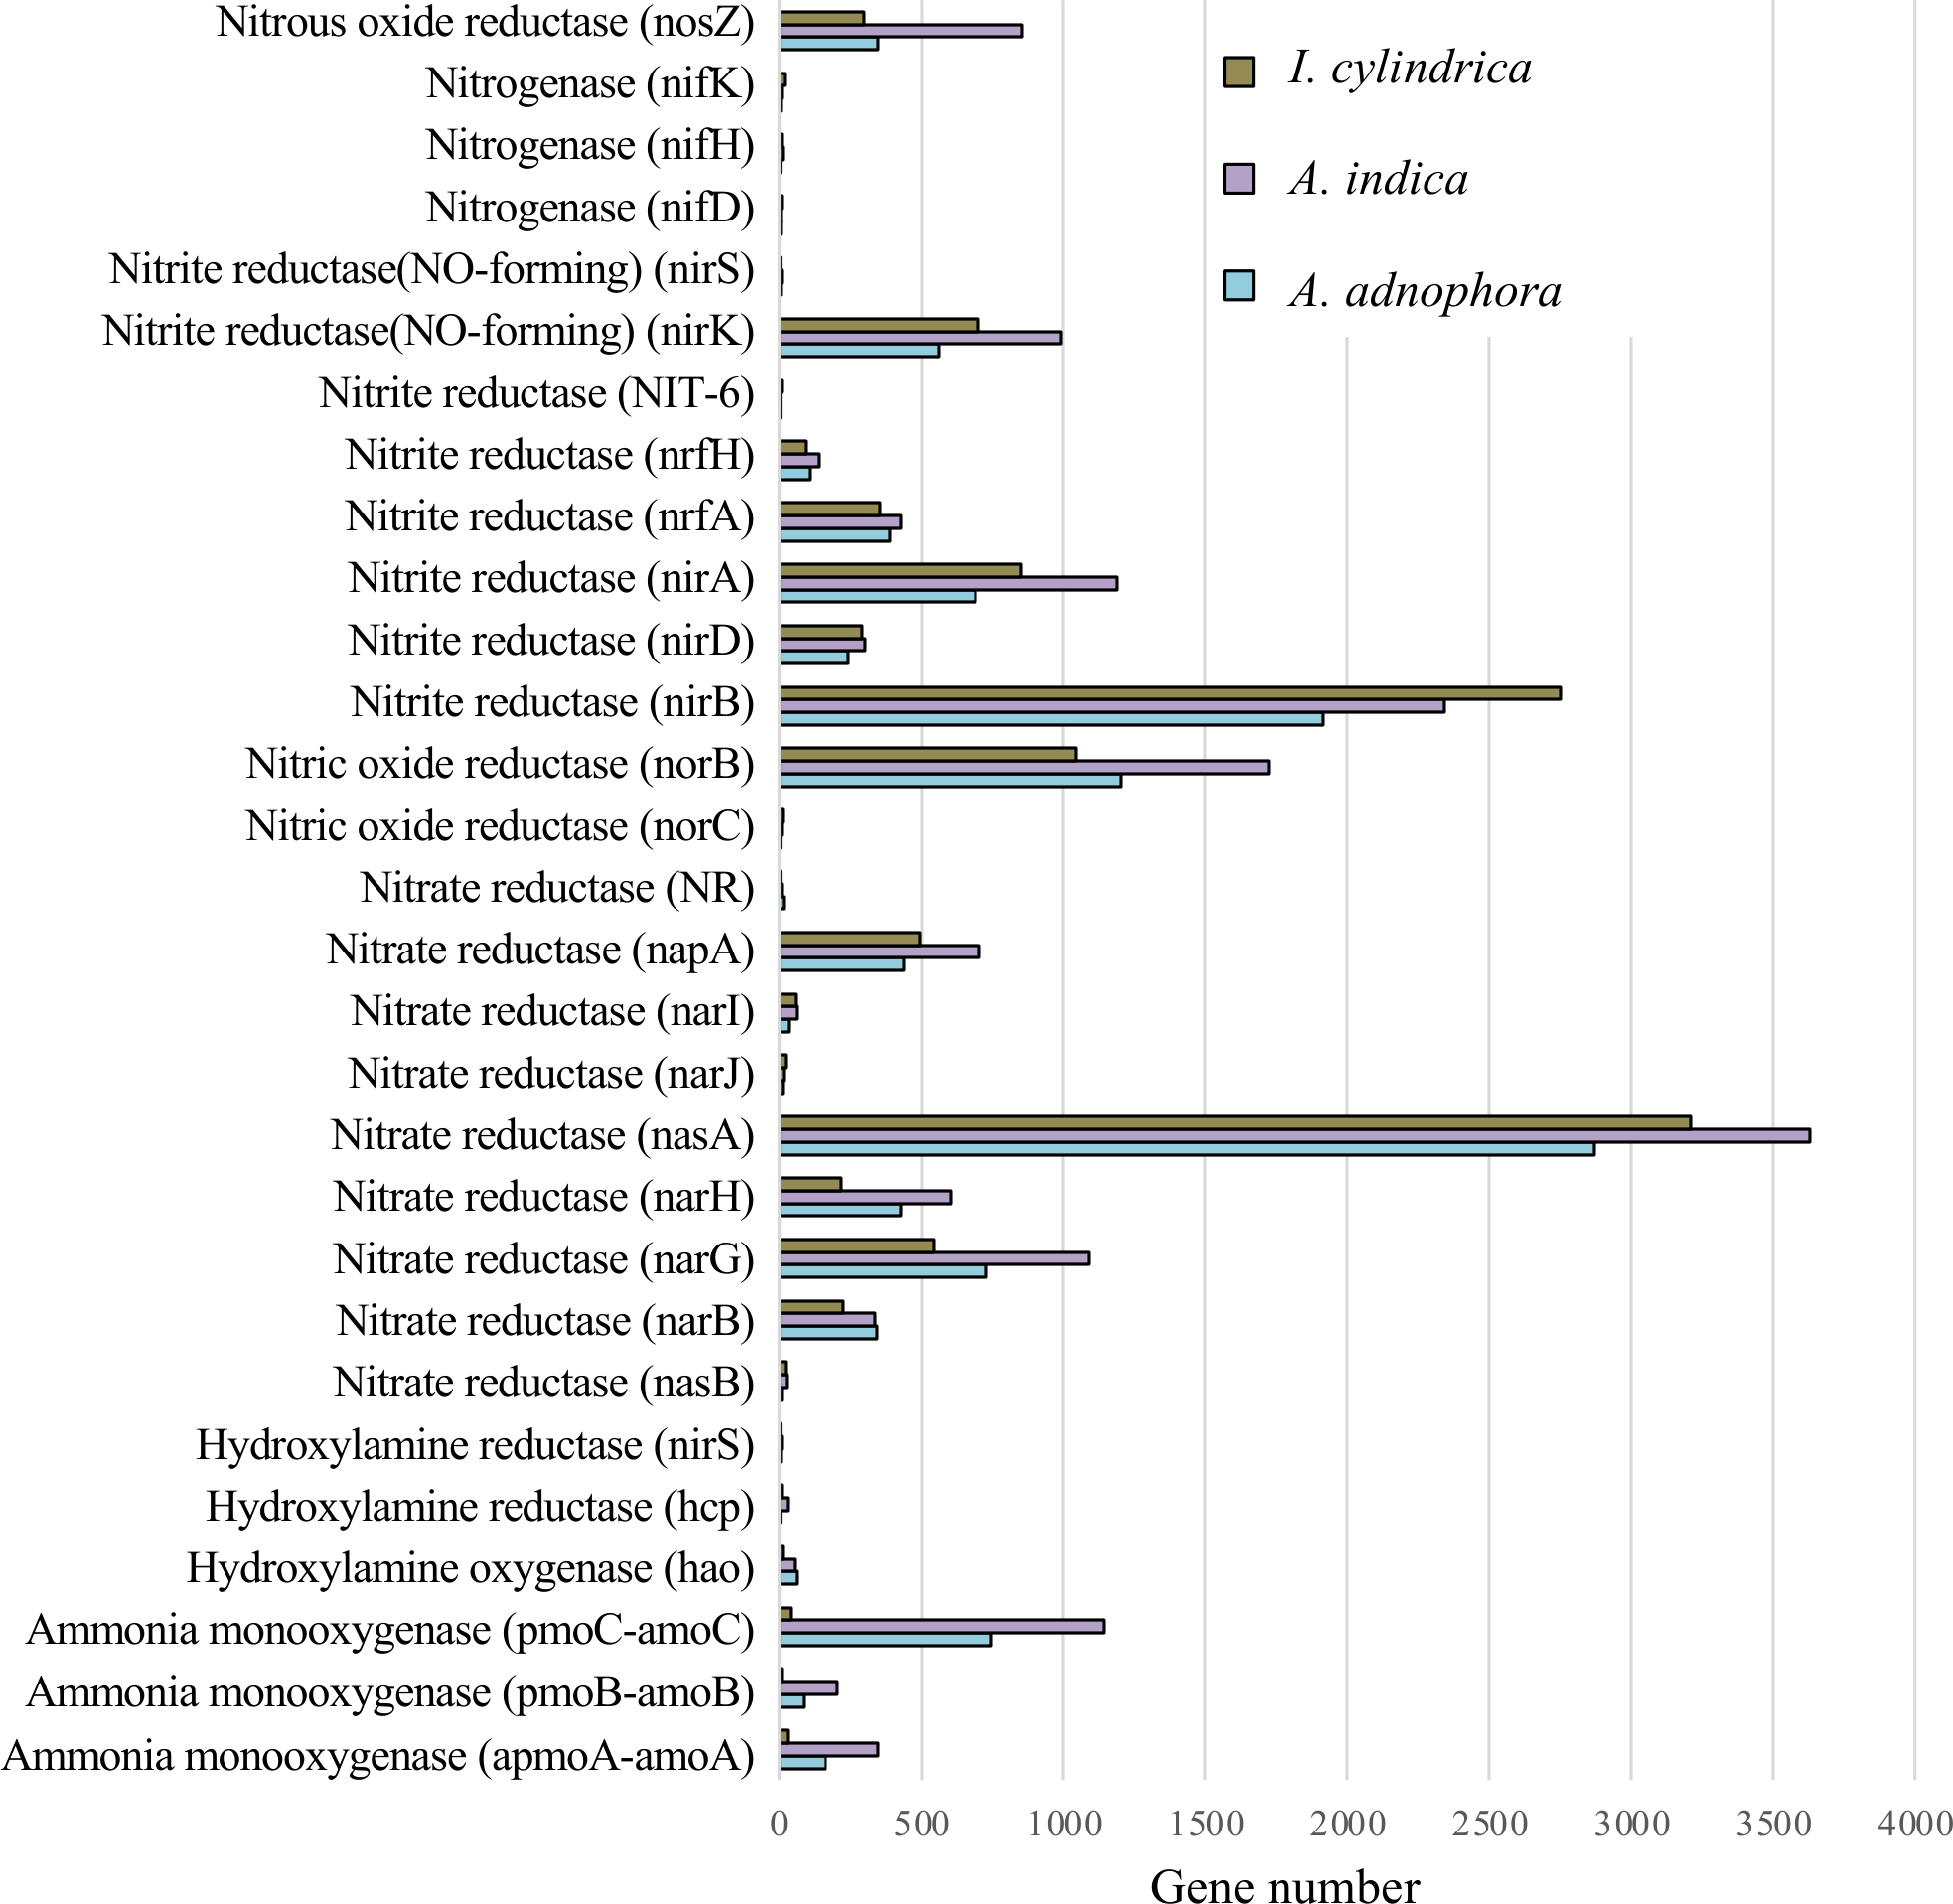
Our 16S rRNA gene and ITS fragment sequencing (Figs. 2C & 2D) and transcriptome data (Fig. 4B) are in agreement in showing fungi belonging to phyla Ascomycota and Basidiomycota, and bacteria belonging to phyla Proteobacteria, Acidobacteria, and Bacteroidetes are important players in the RSMs of A. adenophora and the two native plant species. The RSM fungal community of A. adenophora is thought to play a major role in its nutrition. The fungal community contributed 89.3% of the expressed genes (Fig. 4A) and most (71.2%) were from members of Ascomycota and Basidiomycota (Fig. 4B). Of these, Ascomycota constituted more than half of ITS total reads (55%) and expressed genes (51%) in the A. adenophora RSM. Saprotrophic fungi are known to be highly abundant active organisms in the rhizosphere, where they metabolize root exudates (Denef et al., 2007; Bueé et al., 2009) even more successfully than the rhizosphere soil bacteria under certain conditions (Rudnick, Van Veen & De Boer, 2015).
Glomeromycota contributed 10.1% of the genes expressed in the A. adenophora RSM, which was substantially higher than that expressed in the RSMs of both A. indica (5.7%) and I. cylindrica (0.1%) (Fig. 4B), and so the RSM of A. adenophora had more (P = 0.05) of these symbiotic arbuscular mycorrhizal (AM) fungi than did that of I. cylindrica (Fig. 2D). Therefore, it is likely they play a positive role in successful A. adenophora invasion by enhancing the provision of N and P, especially if there are limited amounts in the soil, and in protecting it from parasite attack at the roots (Johnson et al., 2010). The supply of nitrogen is known to play an important role in exotic plant invasion (Bajpai & Inderjit, 2013; Perkin & Nowak, 2013) especially since the gene expression profiles of enzymes associated with nitrogen fixation and transformation metabolism in the A. adenophora RSM were similar to those of both A. indica and I. cylindrica (Fig. 5). These data suggest that attracting and stimulating the metabolic activity of Glomeromycota enhances the invasive capabilities of A. adenophora, and is the first metabolic evidence to support an important role for AM fungi in A. adenophora invasion.
We showed that there were greater similarities in the composition and expression levels of functional genes in the A. adenophora and A. indica RSMs than in I. cylindrica (Figs. 3 and 4A, 4B, & 4C). Such compositional and metabolic similarities in the RSMs may explain why A. indica can withstand invasion attempts by A. adenophora, as shown by their coexistence at one site for at least 8 years. Higher levels of expression of genes associated with cell wall, membrane, and envelope biogenesis; amino acid transport and metabolism; energy production and conversion; carbohydrate transport and metabolism; secondary metabolite biosynthesis, transport, and catabolism; transcription; translation; ribosomal structure and biogenesis; replication, recombination, and repair; coenzyme transport and metabolism; and nucleotide transport and metabolism were seen in the RSM of A. adenophora than in either the RSMs of A. indica and especially I. cylindrica (Fig. 3). Such enhancement of expression of these genes would suggest that the A. adenophora RSM is more metabolically active than those of either native species.
Invasion by A. adenophora did not affect gene expression levels associated with microbial nitrogen fixation, ammonia oxidation, and nitrite and nitrate reduction in the invaded soil. There was no evidence for the increased expression of N metabolic genes, which may also reflect high amounts of organic C (litter) present in the RSM of A. adenophora (Table 1), where its decomposition may release organic N in higher amounts than from either native plants, as reported for other invasive plant species (Ehrenfeld, Ravit & Elgersma, 2005; Hata, Kato & Kachi, 2012; Kaur et al., 2012; Meisner et al., 2012; Li et al., 2017). This is supported by evidence that more genes are associated with carbohydrate metabolism in the RSM of A. adenophora than in those of the native plant species. Interestingly, in their GeoChip study, Zhao et al. (2019) showed that the A. adenophora RSM had higher nitrogen metabolism gene expression levels than those found in the native plant species examined. Such differences may arise from the measurement techniques used. GeoChip assays quantify gene expression in terms of the total DNA, transcriptomic analysis measures gene expression levels as mRNA synthesis. Zhao et al. (2019) compared the rhizosphere soil of A. adenophora to that of a mixture of soil samples from seven native plant species, and we compared the rhizosphere soil of A. adenophora individually with those of two native plant species.
Conclusions
In conclusion, the data obtained in this study suggests that the RSM of the weed, A. Adenophora, differs substantially in its bacterial and fungal communities to those of the two native plant species. The RSM of A. adenophora contained higher percentage abundances of Proteobacteria and Bacteroidetes than those of the native plant species. Increased expression levels of genes associated with metabolic activities of transport and metabolism of amino acids, coenzymes, nucleotides and carbohydrates; energy production and conversion; transcription; and eventual cell growth in the A. adenophora RSM play an important enhancing role in the nutritional metabolism of its rhizosphere soils, allowing it to invade a habitat already occupied by two native species, A. indica and I. cylindrica. The data also indicate that an increased level of gene expression in members of the fungal communities, especially the saprotrophic Ascomycota and Basidiomycota and the AM fungi Glomeromycota, played a role in its successful invasion.
Supplemental Information
Relative abundance of the dominant (average relative abundance > 0.5%) bacterial genera identified in the rhizosphere soils of weed Ageratina adenophora and native plant species
AGE: Ageratina adenophora; ART: Artemisia indica; IMP: Imperata cylindrica.
Relative abundance of the dominant (average relative abundance > 0.5%) fungal genera identified in the rhizosphere soils (RSs) of weed Ageratina adenophora and native plant species.
AGE: Ageratina adenophora; ART: Artemisia indica; IMP: Imperata cylindrica.