
Taxonomic identification of Lower Pleistocene fossil hominins based on distal humeral diaphyseal cross-sectional shape
- Published
- Accepted
- Received
- Academic Editor
- William Jungers
- Subject Areas
- Anthropology, Evolutionary Studies, Paleontology
- Keywords
- Humerus, Diaphysis, Paranthropus , Early Homo, Geometric morphometrics, Postcranial skeleton, Taxonomy
- Copyright
- © 2015 Lague
- Licence
- This is an open access article distributed under the terms of the Creative Commons Attribution License, which permits unrestricted use, distribution, reproduction and adaptation in any medium and for any purpose provided that it is properly attributed. For attribution, the original author(s), title, publication source (PeerJ) and either DOI or URL of the article must be cited.
- Cite this article
- 2015. Taxonomic identification of Lower Pleistocene fossil hominins based on distal humeral diaphyseal cross-sectional shape. PeerJ 3:e1084 https://doi.org/10.7717/peerj.1084
Abstract
The coexistence of multiple hominin species during the Lower Pleistocene has long presented a challenge for taxonomic attribution of isolated postcrania. Although fossil humeri are well-suited for studies of hominin postcranial variation due to their relative abundance, humeral articular morphology has thus far been of limited value for differentiating Paranthropus from Homo. On the other hand, distal humeral diaphyseal shape has been used to justify such generic distinctions at Swartkrans. The potential utility of humeral diaphyseal shape merits larger-scale quantitative analysis, particularly as it permits the inclusion of fragmentary specimens lacking articular morphology. This study analyzes shape variation of the distal humeral diaphysis among fossil hominins (c. 2-1 Ma) to test the hypothesis that specimens can be divided into distinct morphotypes. Coordinate landmarks were placed on 3D laser scans to quantify cross-sectional shape at a standardized location of the humeral diaphysis (proximal to the olecranon fossa) for a variety of fossil hominins and extant hominids. The fossil sample includes specimens attributed to species based on associated craniodental remains. Mantel tests of matrix correlation were used to assess hypotheses about morphometric relationships among the fossils by comparing empirically-derived Procrustes distance matrices to hypothetical model matrices. Diaphyseal shape variation is consistent with the hypothesis of three distinct morphotypes (Paranthropus, Homo erectus, non-erectus early Homo) in both eastern and southern Africa during the observed time period. Specimens attributed to non-erectus early Homo are unique among hominids with respect to the degree of relative anteroposterior flattening, while H. erectus humeri exhibit morphology more similar to that of modern humans. In both geographic regions, Paranthropus is characterized by a morphology that is intermediate with respect to those morphological features that differentiate the two forms of early Homo. This study demonstrates the utility of the humeral diaphysis for taxonomic identification of isolated postcranial remains and further documents a high degree of postcranial diversity in early Homo.
Introduction
Our ability to reconstruct hominin evolution is predicated upon appropriate taxonomic allocation of fossil specimens. Unfortunately, the diversity of Lower Pleistocene hominins confounds our ability to identify isolated postcrania to species (or even genus), particularly as taxonomic diagnoses are typically based on craniodental remains. While some of the postcranial remains from Swartkrans, South Africa, indicate two distinct morphotypes (presumably representing Homo and Paranthropus; Grine & Susman, 1991; Susman, de Ruiter & Brain, 2001), taxonomic allocation of isolated bones is, in most cases, controversial and/or uncertain (Grine, 2005). In eastern Africa, the situation is complicated by the existence of multiple contemporaneous forms of early Homo (Leakey et al., 2012; Joordens et al., 2013; Antón, Potts & Aiello, 2014; Spoor et al., 2015). Moreover, at least one form of non-erectus early Homo exhibits aspects of “Australopithecus-like” postcranial morphology that had traditionally been assumed to characterize Paranthropus (Wood & Constantino, 2007). Hence, isolated postcrania cannot be securely referred to P. boisei based solely on their morphological similarity to homologous elements among other australopiths.
Historically, the absence of well-authenticated P. boisei skeletons has been a particular problem with respect to identification of eastern African postcranial remains. Until recently, the only skeleton that could reasonably be attributed to P. boisei (based on a mandibular fragment) was KNM-ER 1500, a poorly preserved and fragmentary partial skeleton from Koobi Fora (Upper Burgi Member). Although ER 1500 was originally attributed to an australopith (Leakey, 1973) and later more specifically to P. boisei (Grausz et al., 1988), Wood (1991) noted that its mandibular morphology can be observed on mandibles attributed to early Homo, thereby putting its taxonomic status into question. Fortunately, the recent discovery of a dentally associated partial skeleton (OH 80) more confidently attributed to P. boisei (Domínguez-Rodrigo et al., 2013) now provides a stronger foundation for testing taxonomic hypotheses regarding isolated Lower Pleistocene postcrania. Although the skeleton of OH 80 is meager and fragmentary, those remains that are available (portions of a humerus, radius, femur, and tibia) may be compared with homologous specimens from other partial skeletons, as well as with more enigmatic isolated remains.
The humerus, particularly the distal end, is one of the most common postcranial elements in the hominin fossil record, making it ideal for studies of early hominin postcranial variation (e.g., McHenry, 1971; McHenry & Corruccini, 1975; Senut, 1981b; Feldesman, 1982; Lague & Jungers, 1996; Bacon, 2000; McHenry & Brown, 2008; Lague, 2014). Although the new P. boisei humerus (OH-80-10) lacks articular morphology, the cross-sectional shape of its distal diaphysis is reportedly similar to isolated specimens from Swartkrans attributed to P. robustus (Domínguez-Rodrigo et al., 2013). Based on qualitative observations of transverse sections through the distal diaphysis, Susman, de Ruiter & Brain (2001) attributed humeri with anteroposteriorly flat (mediolaterally broad) distal diaphyses to P. robustus (i.e., SKX 19495, SK 24600, SK 2598) and humeri with more “rounded” cross-sections to Homo (i.e., SKX 10924, SKX 34805). These attributions were based partly on observations of eastern Africa humeri (Senut, 1981a; see below) and partly on reported (though unsubstantiated1) comparisons to TM 1517e, a humerus securely attributed to P. robustus (since TM 1517 is the holotype of that taxon; Broom, 1938; Broom & Schepers, 1946).
The above taxonomic attributions at Swartkrans are less than secure, particularly in the absence of any quantitative comparison with TM 1517 (or other available fossil humeri). In addition, recent evidence from the distal articular surface suggests that SK 24600 and SKX 10924 (the only two specimens from Swartkrans to include elbow joint morphology) actually belong to Homo and Paranthropus, respectively (Lague, 2014; contra Susman, de Ruiter & Brain, 2001). Hence, there is some question as to whether those specimens at Swartkrans characterized by AP flattening are truly representative of P. robustus rather than Homo.
Given the AP flattened diaphyseal morphology of OH 80-10, the dichotomous pattern of shape variation observed at Swartkrans may also characterize fossils in eastern Africa of similar age. In fact, KNM-ER 739, an isolated specimen tentatively attributed to Australopithecus (and therefore, by inference, P. boisei; Leakey, 1971) is described as having an unusually AP flattened distal diaphysis compared to Gomboré IB 7594, a specimen from Melka Kunturé, Ethiopia, commonly attributed to Homo (Chavaillon et al., 1977; Senut, 1981a). These two specimens are also considerably different in distal articular morphology (Lague & Jungers, 1996), supporting the contention that they do, in fact, represent different taxa. Unfortunately, neither of these specimens is associated with taxonomically diagnostic craniodental material and therefore cannot, on their own, resolve questions regarding which genus (if either) has characteristically AP flattened distal humeri. Moreover, other than the description of OH-80 (Domínguez-Rodrigo et al., 2013), no study has assessed distal diaphyseal shape among available eastern African humeral specimens of known species attribution (i.e., OH 62, KNM-ER 3735, ER 1808, WT 15000).
The potential taxonomic utility of humeral diaphyseal shape merits quantitative analysis of a wide range of hominin fossils from across Africa. This study analyzes cross-sectional shape variation of the distal humeral diaphysis among fossil hominins (c. 2-1 Ma) attributable to Paranthropus and Homo to test the hypothesis that specimens can be divided into distinct morphotypes. Fossils from both southern and eastern Africa, including fragmentary specimens lacking articular morphology, are examined to assess whether a similar pattern of morphological variation characterizes each region.
Materials and Methods
The main fossil study group includes 15 hominin humeri (c. 2-1 Ma), six of which are attributed to species based on association with craniodental material (Table 1). In most cases, 3D surface scans of the original specimens (collected by JM Plavcan and CV Ward) were used to find the transverse section of interest (see below). The scan of OH 62 was produced from a high-quality cast housed at the Institute of Human Origins (Tempe, AZ). An image of the appropriate section of OH 80-10 (as determined by the author) was kindly provided by M Domínguez-Rodrigo from a CT scan. In the absence of available 3D scans of SKX 19495 and SK 2598, I used the published CT sections of those specimens (Susman, de Ruiter & Brain, 2001). Two other published CT sections from the same source (SK 24600, SKX 10924) were used to assess the effect of using published images rather than sections collected by the author (from 3D surface scans). Shape differences between the two sets of data were found to be negligible; for both specimens, the shape provided in the literature was far more similar to the shape collected from the surface scan than to any other specimen (based on Procrustes distances; see below). Since this study relies on Procrustes distance matrices to represent morphometric relationships among the fossils, it is desirable that different sections representing the same specimen should produce very similar sets of Procrustes distances (to the other fossils). In the case of both SK 24600 and SKX 10924, there is, in fact, a significant correlation between the two sets of Procrustes distances (SKX 10924: R = 0.85, P < 0.001; SK 24600: R = 0.85, P < 0.001), suggesting that the use of published scans for SK 24600 and SKX 10924 will not significantly impact the results.
| Specimen | Bed/Member | Taxona | Reference(s)b | |
|---|---|---|---|---|
| South Africa c | ||||
| 1 | TM 1517 | Mb. 3 (Kromdraai) | P. robustus | Broom (1938); Straus Jr (1948) |
| 2 | SKX 10924 | Member 3 | ?? Homo | Susman, de Ruiter & Brain (2001) |
| 3 | SKX 19495 | Member 3 | ?? P. robustus | Susman, de Ruiter & Brain (2001) |
| 4 | SK 2598 | Member 1 (HR) | ?? P. robustus | Susman, de Ruiter & Brain (2001) |
| 5 | SKX 34805 | Member 1 (LB) | ?? Homo | Susman (1989); Susman, de Ruiter & Brain (2001) |
| 6 | SK 24600 | Member 1 (LB) | ?? P. robustus | Susman, de Ruiter & Brain (2001) |
| Eastern Africa | ||||
| 7 | OH 80 | Bed II (Olduvai) | P. boisei | Domínguez-Rodrigo et al. (2013) |
| 8 | OH 62 | Bed I (Oludvai) | Homo habilis | Johanson et al. (1987) |
| 9 | KNM-WT 15000 | Natoo | Homo ergaster | Walker & Leakey (1993) |
| 10 | KNM-ER 739 | Okote | ?? P. boisei | Leakey, Mungai & Walker (1972); McHenry (1973) |
| 11 | KNM-ER 1591 | KBS | ?? Homo | Leakey (1973) |
| 12 | KNM-ER 1808 | KBS | Homo ergaster | Leakey (1974); Leakey & Walker (1985) |
| 13 | KNM-ER 6020 | KBS | ?? P. boisei | Leakey & Walker (1985) |
| 14 | KNM-ER 1504 | Upper Burgi | ?? P. boisei | Leakey (1973) |
| 15 | KNM-ER 3735 | Upper Burgi | Homo habilis | Leakey & Walker (1985) |
Some issues associated with certain fossil specimens merit attention. First, although the KNM-ER 1808 (H. erectus) skeleton is pathological, periosteal bone deposits are much thinner in the upper limb than in the lower limb (Ruff, 2008; Dolan, 2011). Minor surface irregularities (mostly due to small amounts of missing bone) were ignored when quantifying diaphyseal contour and the pathology is not expected to have a significant effect on overall cross-sectional shape. Second, the subadult KNM-WT 15000 (H. erectus) humerus is included here with the understanding that its shape may be partly affected by its developmental status (as demonstrated for its relative cortical thickness; Ruff, 2008). Lastly, although KNM-ER 1591 was originally attributed to Homo (Leakey, 1973), it has not been universally accepted as a hominin (Walker & Leakey, 1993). Its inclusion in this study is based on the author’s observation that the size and shape of its diaphysis (most of which is preserved) is so similar to that of KNM-ER 739 (also from Ileret) that the two specimens are likely to be conspecific.
Additional taxa were sampled to provide a comparative context for interpreting observed morphological variation among the fossils of the main study group (Table 2). Scans were collected for four species of Australopithecus (eight specimens total), as well as for four extant hominid species (Homo sapiens, Pan troglodytes, Gorilla gorilla, Pongo pygmaeus). Cross-sectional shape of AL 288-1 was calculated for both left and right humeral sections.
For each 3D scan, Landmark editor software (Wiley et al., 2005) was used to define a transverse section through the diaphysis intended to closely match that of Susman, de Ruiter & Brain (2001). All left humeri were mirrored to create “right” humeri for data collection. For each specimen, a user-defined transverse plane was created that could be virtually “slid” in either direction (proximodistally) until placed at the appropriate section level. The section of interest is located just proximal to a shallow depression on the posterior diaphyseal surface that slopes distally toward the much more highly excavated olecranon fossa. Although “percentage of total bone length” represents one possible way of defining the placement of a diaphyseal section, none of the fossils preserve the entire humerus. Consistency of section placement on all specimens was therefore accomplished by using one specimen as a constant visual reference. When located on complete humeri of four different extant hominid genera (n = 57), the section of interest typically corresponds to ∼19% of bone length from the most distal point on the lateral trochlear crest . The potential effect of variation in section placement on cross-sectional shape was considered via the additional collection of data from four length-defined sections (15%, 17%, 19%, 21%) on every modern human individual.
Cross-sectional shape was initially captured by placing a high density of three-dimensional (3D) landmarks around the bone surface along the appropriately positioned transverse plane (via the “curve” option in Landmark editor). For each individual specimen, the 3D landmark coordinates were then exported from Landmark editor and converted to 2D landmarks by mathematically aligning the landmark configuration to its principal axes, thereby virtually eliminating variation along a third dimension. Graphs of the resulting 2D surface outlines were imported into tpsDig2 (Rohlf, 2013) for quantification of 60 two-dimensional coordinate points, including two Type 2 landmarks (i.e., the most medial and lateral points of the section) and a set of 29 sliding semilandmarks along both the anterior and posterior surfaces (Fig. 1; see definitions in Zelditch, Swiderski & Sheets, 2012). For specimens suffering from minor surface abrasions, missing material was easily accounted for by using adjacent surface contours to bridge across obvious irregularities in the outline. Unfortunately, the appropriate section of OH 62 is missing substantial amounts of material on both its medial and lateral aspects and is estimated to be only about 63% complete. Therefore, the OH 62 section was digitally reconstructed based on its available contours and comparisons with all of the other specimens.2 Since the accuracy of this reconstruction is unknown, the tests described below were performed for two sets of specimens differing only in the presence/absence of OH 62.

Figure 1: Transverse section and two-dimensional landmarks used in this study.
Section location is shown on a 3D surface scan of KNM-ER 739 (posterior view). The two numbered landmarks represent the most medial (1) and lateral (2) points on the section. All other points (58) represent sliding semilandmarks.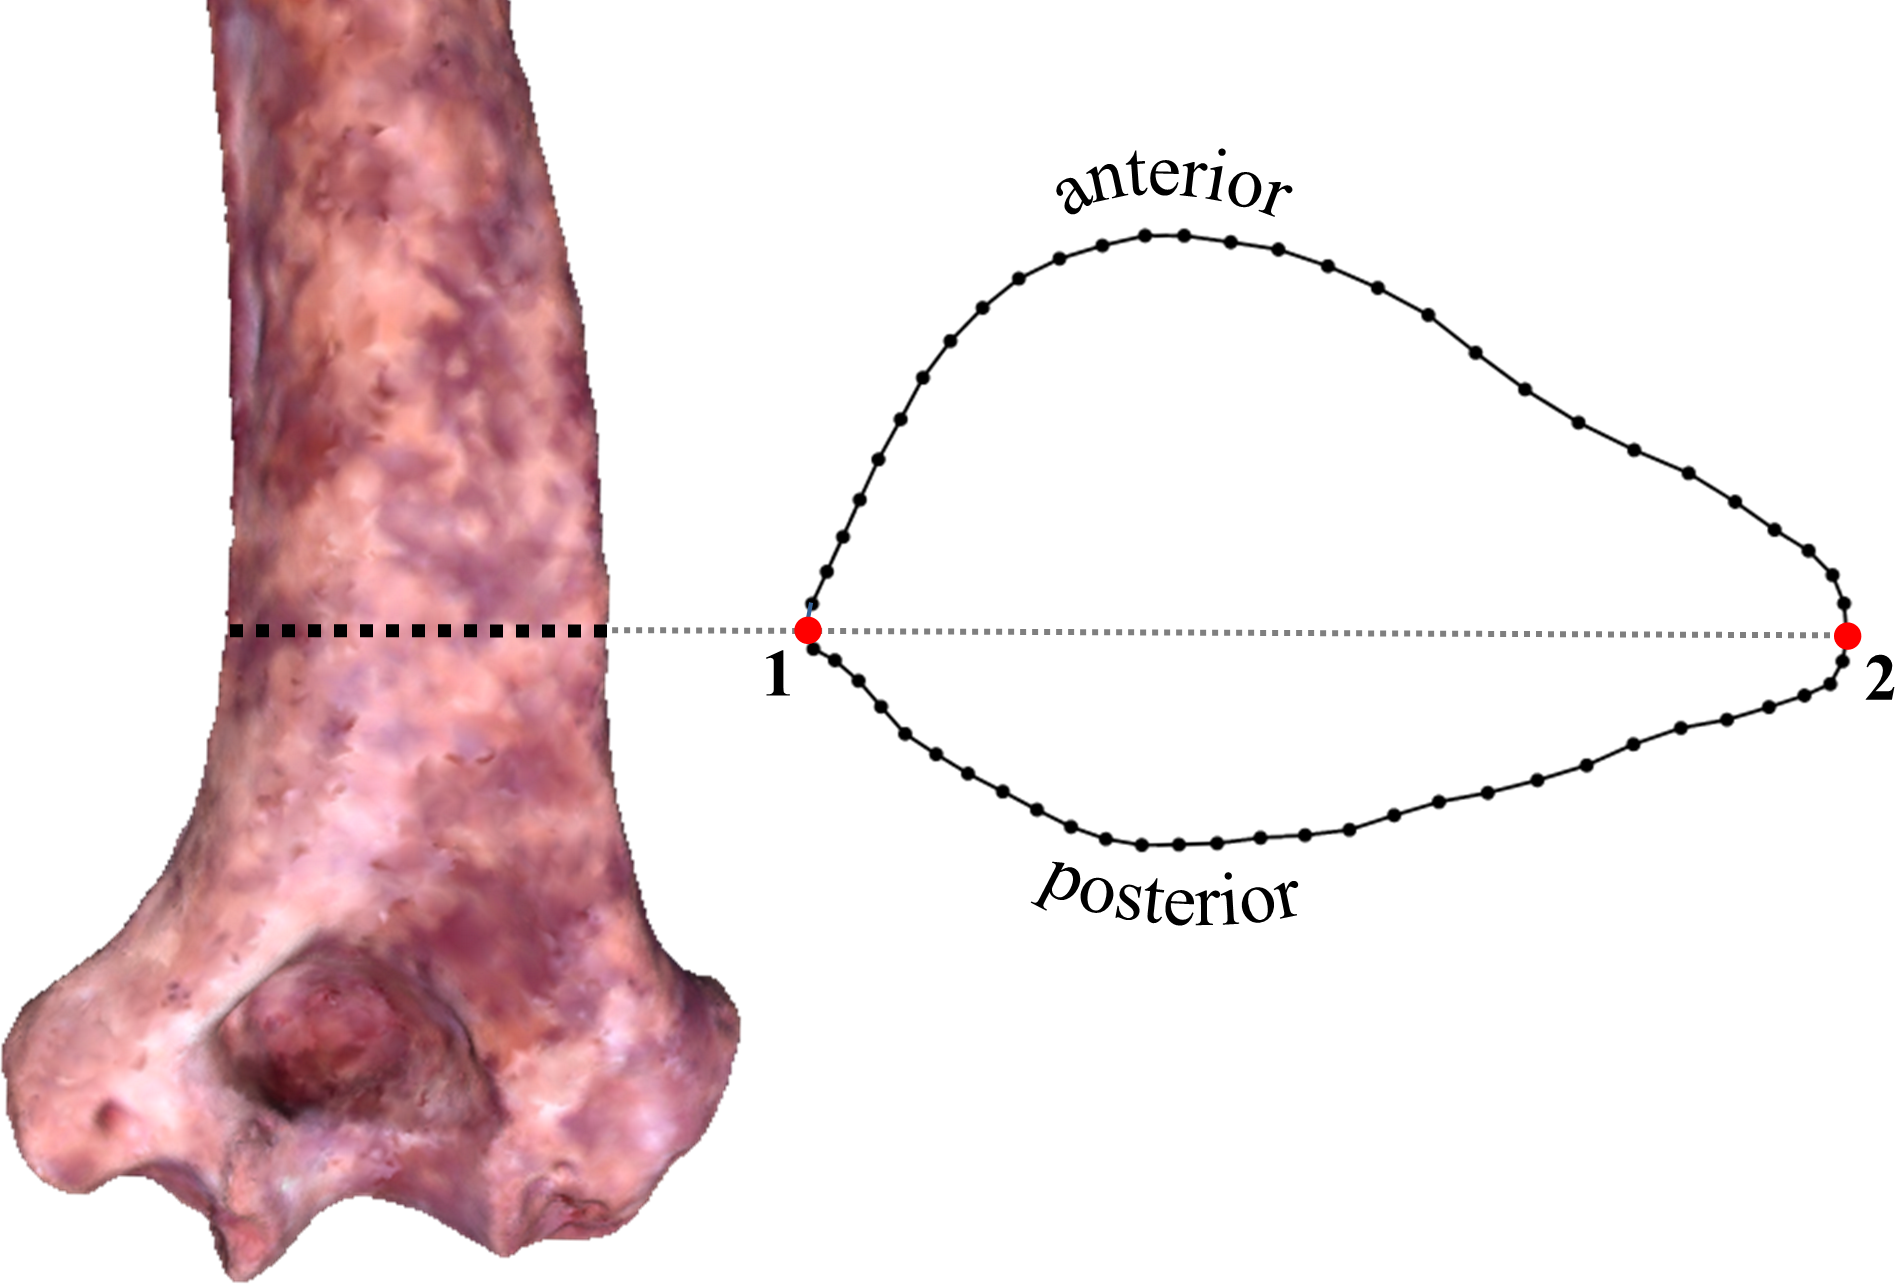
Generalized orthogonal least-squares Procrustes analysis (GPA) was used to transform raw landmark configurations into the same shape space (i.e., to superimpose shapes; Gower, 1975; Rohlf & Slice, 1990). With the use of tpsRelw software (Rohlf, 2010), an iterative procedure was used in which semilandmarks (designated via a ‘sliders’ file) were allowed to slide along surface outlines to minimize the amount of shape change between each specimen and the Procrustes average of all specimens. Procrustes distances (Dp) were calculated between every pair of fossils as a measure of shape dissimilarity (corresponding to the square root of the sum of squared distances between corresponding landmarks of two superimposed shapes; Rohlf, 1999; Zelditch, Swiderski & Sheets, 2012). To provide a basis for evaluating Procrustes distances between fossils, an exact randomization procedure (Sokal & Rohlf, 1981) was used in which all possible pairwise Procrustes distances were calculated within each extant species. The magnitude of a given Procrustes distance between fossils could then be evaluated by counting the number of pairwise distances in the extant reference group with a higher value.
Principal Components Analysis (PCA; equivalent herein to relative warps analysis) was used to visually summarize variation among the superimposed shapes. Although distance-based cluster analysis (UPGMA; Unweighted Pair Group Method with Arithmetic Mean) was also explored as a means of visualization, it was generally too sensitive to distortions caused by dimensional reduction (thereby yielding insufficiently high cophenetic correlations). Only cluster analyses yielding a cophenetic correlation higher than 0.8 were considered reasonably good representations of the Procrustes distance matrix upon which they were based.
To explicitly test hypotheses regarding taxonomic relationships among the fossils, I used Mantel tests of matrix correlation (Mantel, 1967; Rodrigues et al., 2002). All tests were performed with 5,000 random permutations using PAST software (Hammer, Harper & Ryan, 2001). The null hypothesis of each test is that there is no relationship between the structure of two matrices under consideration: (1) the observed Procrustes distance (Dp) matrix for the fossils, and (2) a model matrix consisting of user-assigned hypothetical distance values (Fig. 2). For each pair of specimens in a given model matrix, a discrete distance value was assigned to indicate hypothesized membership in the same taxon (0) or a different taxon (1). In some cases, an intermediate value (0.5) was used to indicate different species of the same genus (e.g., two different Paranthropus species, or two different Homo species). The patterns of linkages established in the model matrices were used to test various hypothesis regarding the morphological relationships among the fossils (as represented by the observed matrix of Procrustes distances).
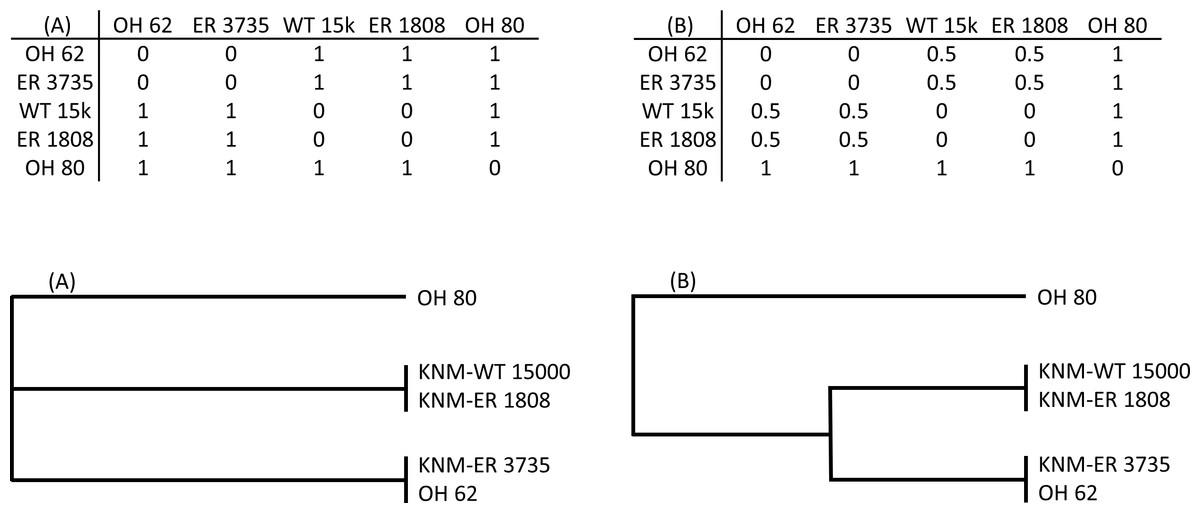
Figure 2: Two hypothetical examples (A, B) of model matrices (for a subset of five fossils).
For each matrix, a dendrogram is shown that depicts the relationships defined therein. Matrix (A) represents a hypothesis of three independent groups with respect to the morphological relationships among specimens. Matrix (B) is similar except that members of two of the groups are hypothesized to be more similar to one another than they are to OH 80.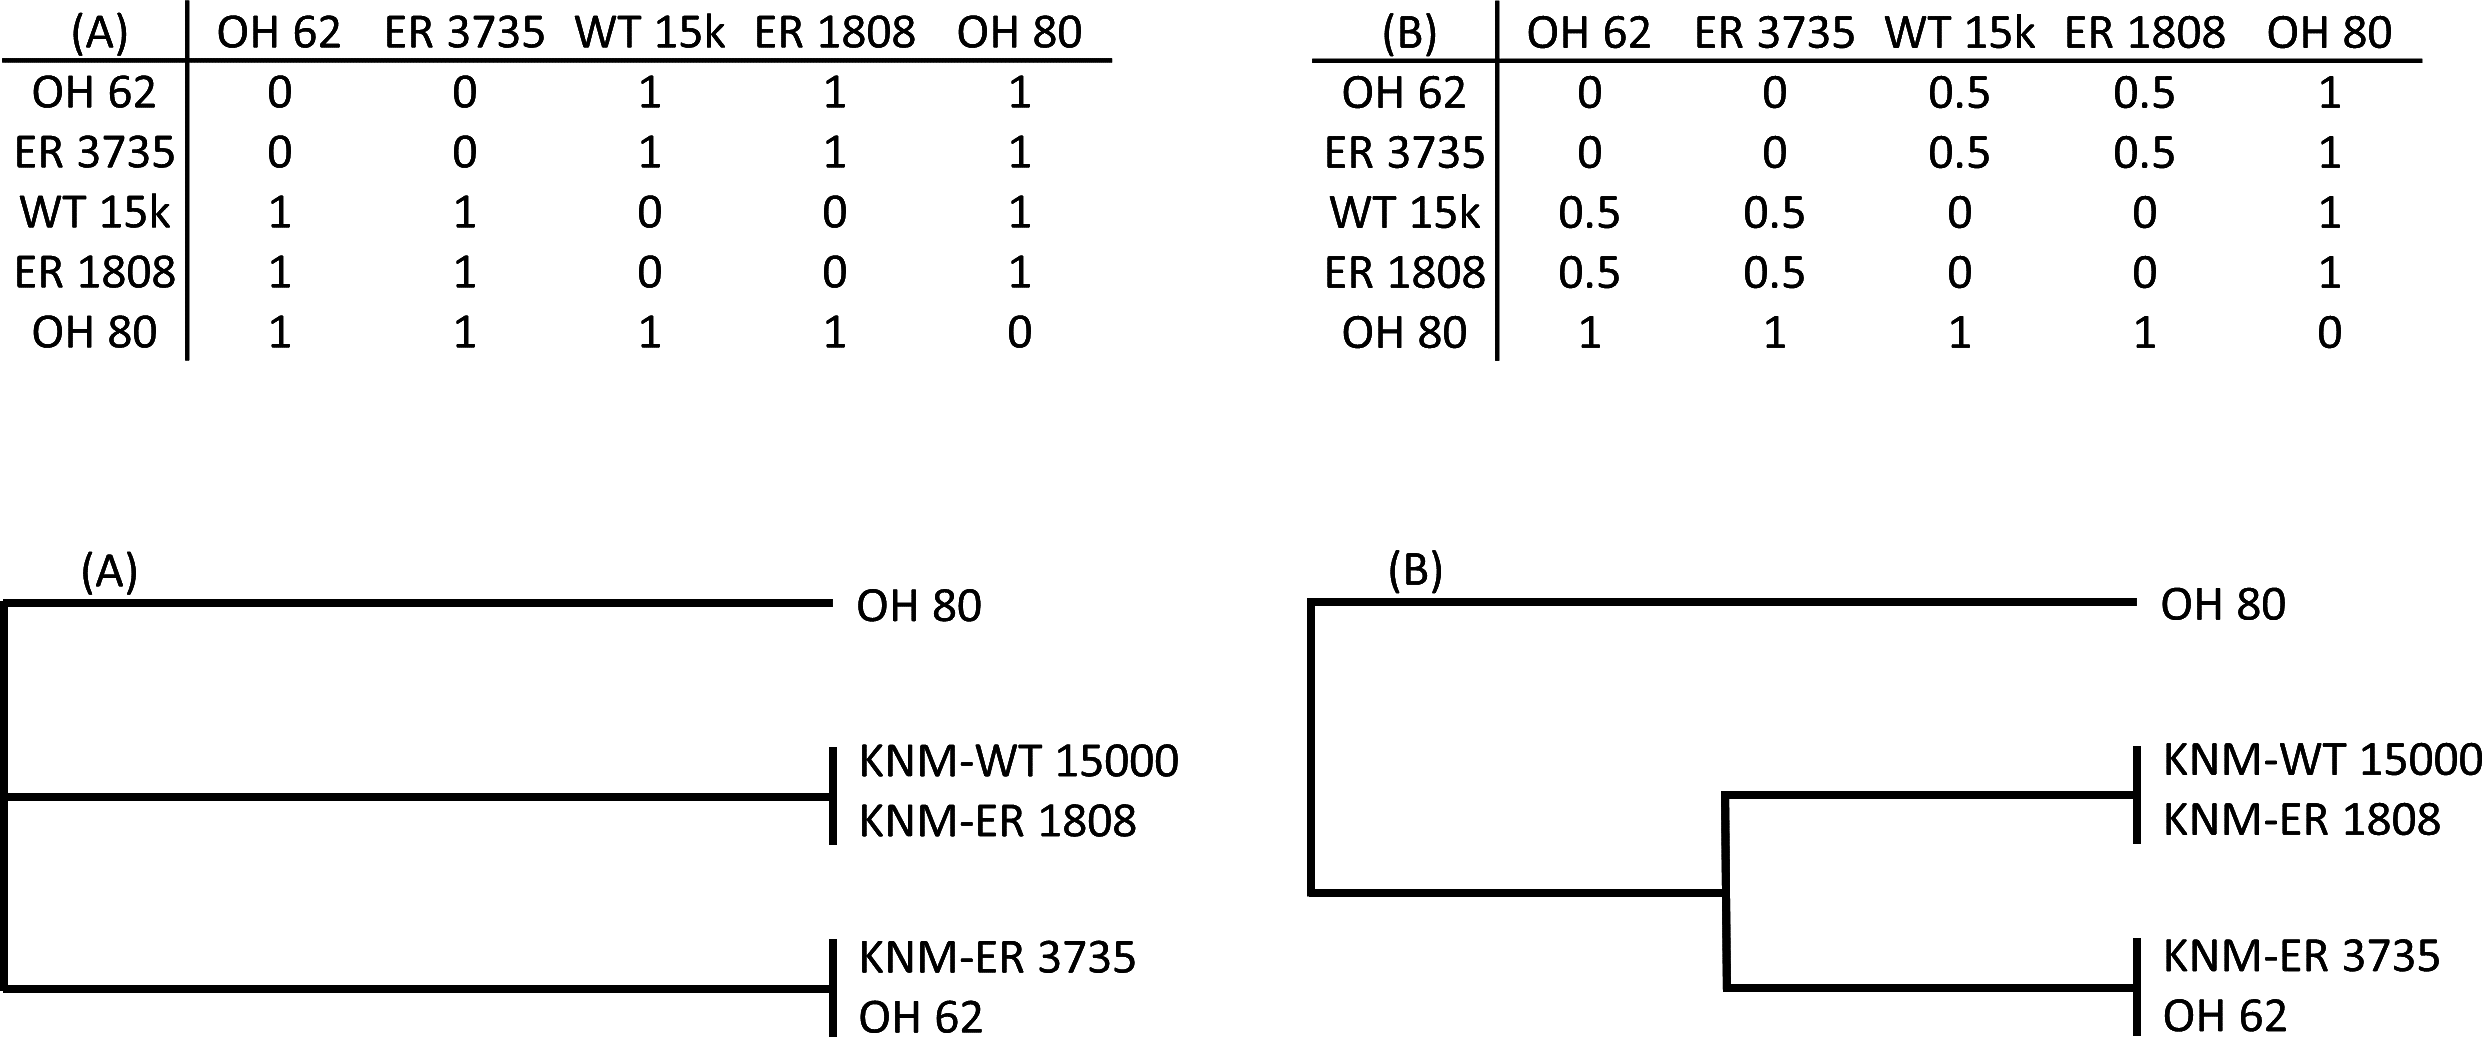
It is beyond the scope of this paper to test every possible way of dividing 15 fossils into multiple groups. Group configurations tested here are based on previously published taxonomic hypotheses and/or the results of the tests themselves (i.e., arrangement on PC plots and/or observed Procrustes distance values). For any given Mantel test, rejection of the null hypothesis does not necessarily imply that the group configuration under testing reflects the “best” or “true” taxonomic grouping, since multiple group configurations may yield significant results. The Mantel tests are meant only to refute or support a given taxonomic hypothesis.
Results
South Africa
PCA of the South African specimens reveals that most of the shape variation (72.2%) occurs along a single principal component (PC1; Fig. 3). PC1 is associated with variation in relative AP width and reflects the variation described by Susman, de Ruiter & Brain (2001) such that three AP flattened specimens (SK 24600, SKX 19495, SK 2598) are separated from two more rounded specimens (SKX 10924, SK 34805). Contrary to the claims of Susman and colleagues, however, TM 1517 (P. robustus) is more similar to the rounded specimens than to the AP flattened specimens; in fact, the Procrustes distance (0.057) between TM 1517 and SK 10924 is lower than that for any other pair of South African specimens (Table 3). If one also considers South African fossils outside of the main study group, only the two Malapa specimens (MH1, MH2) have a smaller Dp between them.
Figure 3: PCA results for the South African fossil study group.
Only TM 1517 is associated with taxonomically identifiable craniodental remains. Shape variation along PC1 largely involves differences in AP width relative to ML width. Results of the Mantel tests of matrix correlation support the three-group configuration depicted on the plot. SKX 10924 is morphologically very similar to P. robustus.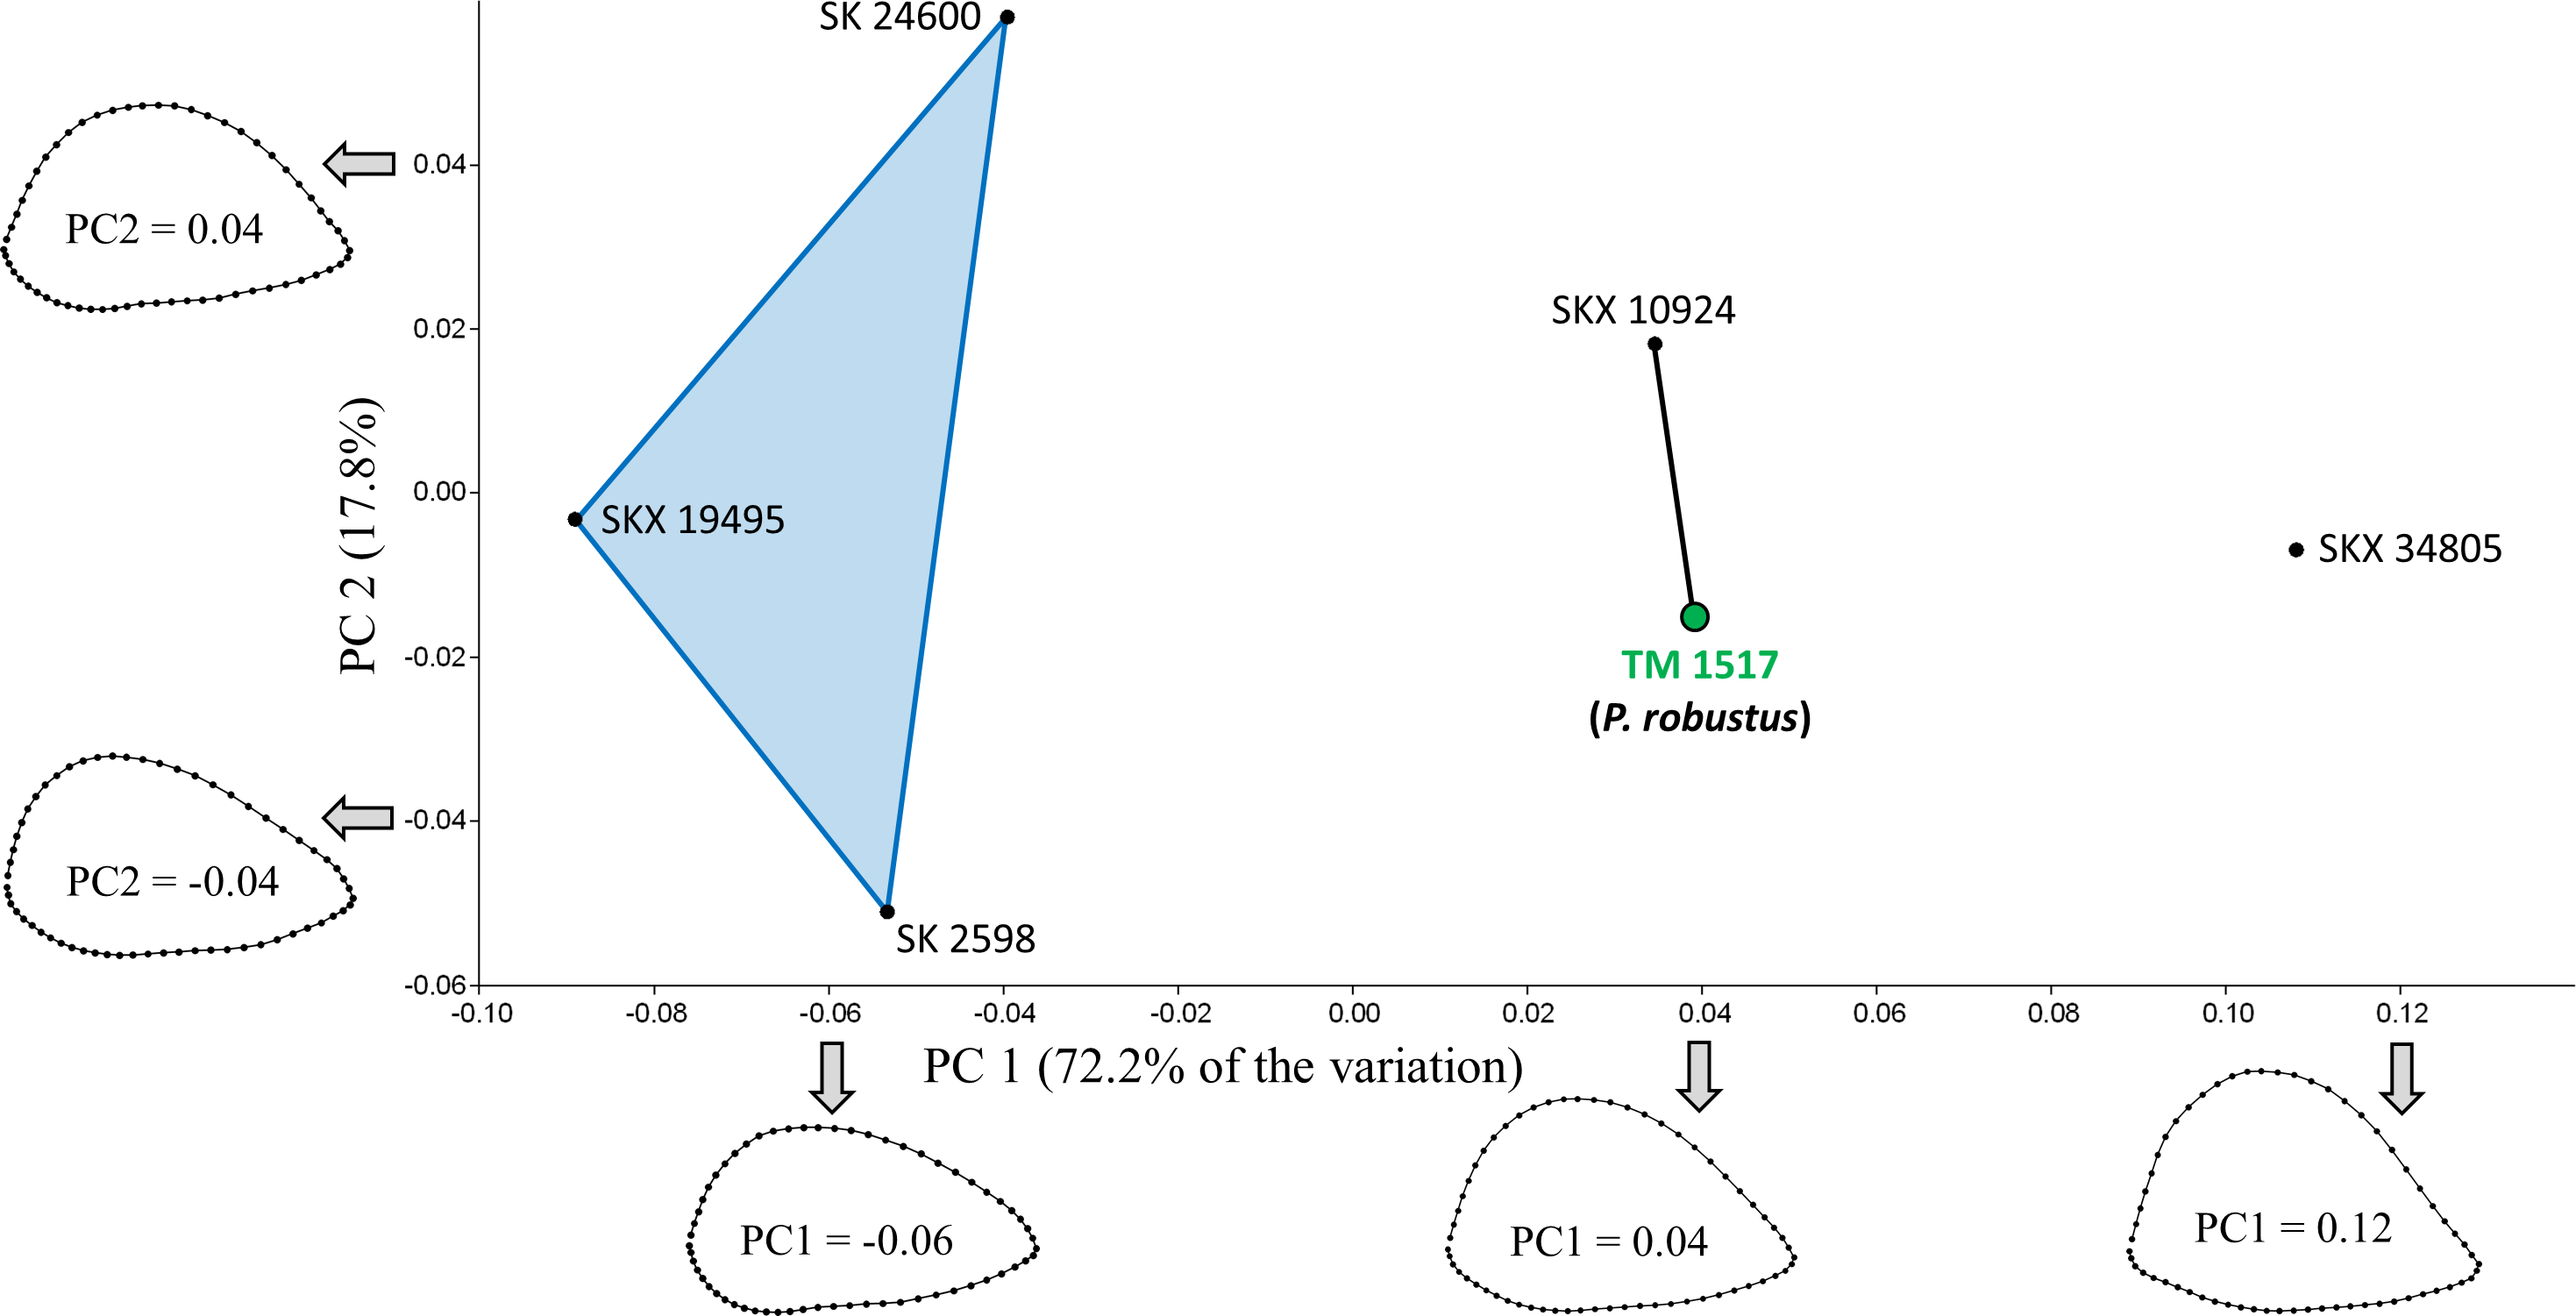
| P. robustus | Non-erectus early Homo | H. erectus | P. boisei | Australopithecus | |||||||||||||||||||
|---|---|---|---|---|---|---|---|---|---|---|---|---|---|---|---|---|---|---|---|---|---|---|---|
| Fossil specimen | TM 1517 | SKX 10924 | SKX 19495 | SK 2598 | SK 24600 | OH 62 | KNM-ER 3735 | SKX 34805 | KNM-WT 15000 | KNM-ER 1808 | OH 80 | KNM-ER 739 | KNM-ER 1591 | KNM-ER 6020 | KNM-ER 1504 | KNM-KP 271 | AL 288-1m | AL 288-1s | AL 137-48a | AL 322-1 | Stw 431 | MH1 | MH2 |
| TM 1517 | – | P | – | – | – | – | – | – | – | – | – | – | – | – | – | – | – | – | – | – | – | – | |
| SKX 10924 | 0.057 | P | – | – | – | – | – | – | – | – | – | – | – | – | – | – | – | – | – | – | – | – | |
| SKX 19495 | 0.136 | 0.134 | – | – | – | – | PHGO | PHGO | PHGO | – | – | – | P | – | PHG | P | PHGO | – | PHGO | PHG | PHG | PHG | |
| SK 2598 | 0.102 | 0.117 | 0.069 | – | – | – | PHGO | PHGO | P | – | – | – | – | – | – | – | P | – | P | P | – | – | |
| SK 24600 | 0.110 | 0.098 | 0.086 | 0.111 | – | – | PHGO | – | PHG | – | – | – | – | – | PHG | – | PHG | – | PHG | – | P | PHG | |
| OH 62 | 0.081 | 0.098 | 0.099 | 0.087 | 0.072 | – | PHG | P | – | – | – | – | – | – | – | – | – | – | PHG | – | – | – | |
| KNM-ER 3735 | 0.103 | 0.107 | 0.101 | 0.111 | 0.045 | 0.047 | PHG | P | PHG | – | – | – | – | – | PHG | – | PHG | – | PHG | – | – | PH | |
| SKX 34805 | 0.084 | 0.097 | 0.198 | 0.171 | 0.164 | 0.149 | 0.161 | – | – | PHG | – | – | PH | – | – | – | – | – | – | – | – | PHG | |
| KNM-WT 15000 | 0.082 | 0.072 | 0.180 | 0.164 | 0.129 | 0.132 | 0.132 | 0.067 | – | – | – | – | – | – | – | – | – | – | – | – | P | PHG | |
| KNM-ER 1808 | 0.078 | 0.088 | 0.172 | 0.132 | 0.151 | 0.126 | 0.150 | 0.091 | 0.106 | – | – | – | – | – | – | – | – | – | – | – | – | – | |
| OH 80 | 0.086 | 0.068 | 0.089 | 0.076 | 0.080 | 0.086 | 0.096 | 0.144 | 0.118 | 0.106 | – | – | – | – | – | – | – | – | – | – | – | – | |
| KNM-ER 739 | 0.062 | 0.082 | 0.108 | 0.067 | 0.109 | 0.081 | 0.106 | 0.120 | 0.120 | 0.085 | 0.069 | – | – | – | – | – | – | – | – | – | – | – | |
| KNM-ER 1591 | 0.055 | 0.063 | 0.117 | 0.081 | 0.107 | 0.090 | 0.111 | 0.111 | 0.104 | 0.073 | 0.058 | 0.044 | – | – | – | – | – | – | – | – | – | – | |
| KNM-ER 6020 | 0.101 | 0.056 | 0.135 | 0.128 | 0.106 | 0.118 | 0.123 | 0.139 | 0.111 | 0.110 | 0.067 | 0.100 | 0.090 | – | – | – | – | – | – | – | – | P | |
| KNM-ER 1504 | 0.069 | 0.057 | 0.117 | 0.109 | 0.073 | 0.067 | 0.072 | 0.118 | 0.088 | 0.106 | 0.068 | 0.075 | 0.077 | 0.072 | – | – | – | – | – | – | – | – | |
| KNM-KP-271 | 0.086 | 0.077 | 0.145 | 0.113 | 0.148 | 0.127 | 0.154 | 0.122 | 0.128 | 0.089 | 0.090 | 0.080 | 0.073 | 0.086 | 0.107 | – | – | – | – | – | – | – | |
| AL 288-1m | 0.073 | 0.057 | 0.134 | 0.111 | 0.107 | 0.092 | 0.113 | 0.119 | 0.097 | 0.076 | 0.064 | 0.080 | 0.066 | 0.065 | 0.066 | 0.075 | – | – | – | – | – | – | |
| AL 288-1s | 0.073 | 0.069 | 0.165 | 0.131 | 0.141 | 0.123 | 0.146 | 0.094 | 0.088 | 0.052 | 0.093 | 0.091 | 0.069 | 0.094 | 0.096 | 0.073 | 0.050 | – | – | – | – | – | |
| AL 137-48a | 0.053 | 0.061 | 0.126 | 0.088 | 0.118 | 0.097 | 0.122 | 0.100 | 0.100 | 0.059 | 0.065 | 0.043 | 0.034 | 0.084 | 0.075 | 0.059 | 0.055 | 0.053 | – | – | – | – | |
| AL 322-1 | 0.082 | 0.057 | 0.168 | 0.139 | 0.149 | 0.141 | 0.158 | 0.100 | 0.091 | 0.087 | 0.096 | 0.101 | 0.080 | 0.078 | 0.101 | 0.062 | 0.075 | 0.059 | 0.067 | – | – | – | |
| Stw 431 | 0.071 | 0.067 | 0.158 | 0.139 | 0.115 | 0.122 | 0.122 | 0.086 | 0.055 | 0.096 | 0.097 | 0.106 | 0.086 | 0.104 | 0.089 | 0.120 | 0.092 | 0.085 | 0.086 | 0.089 | – | P | |
| MH1 | 0.074 | 0.101 | 0.142 | 0.100 | 0.131 | 0.084 | 0.118 | 0.122 | 0.130 | 0.071 | 0.099 | 0.057 | 0.076 | 0.117 | 0.089 | 0.096 | 0.080 | 0.089 | 0.066 | 0.119 | 0.121 | – | |
| MH2 | 0.093 | 0.119 | 0.153 | 0.100 | 0.152 | 0.103 | 0.139 | 0.149 | 0.154 | 0.083 | 0.110 | 0.078 | 0.089 | 0.131 | 0.114 | 0.106 | 0.093 | 0.099 | 0.081 | 0.128 | 0.135 | 0.048 | |
| H. sapiens | 0.054 | 0.059 | 0.166 | 0.139 | 0.125 | 0.109 | 0.124 | 0.072 | 0.053 | 0.063 | 0.097 | 0.094 | 0.076 | 0.095 | 0.076 | 0.099 | 0.059 | 0.046 | 0.066 | 0.074 | 0.061 | 0.089 | 0.109 |
| P. troglodytes | 0.077 | 0.063 | 0.150 | 0.124 | 0.134 | 0.127 | 0.146 | 0.096 | 0.094 | 0.063 | 0.082 | 0.087 | 0.065 | 0.082 | 0.096 | 0.060 | 0.060 | 0.043 | 0.052 | 0.057 | 0.089 | 0.100 | 0.116 |
| G. gorilla | 0.095 | 0.052 | 0.148 | 0.144 | 0.093 | 0.108 | 0.106 | 0.126 | 0.087 | 0.108 | 0.081 | 0.110 | 0.094 | 0.048 | 0.064 | 0.109 | 0.065 | 0.093 | 0.094 | 0.090 | 0.088 | 0.118 | 0.138 |
| P. pygmaeus | 0.061 | 0.052 | 0.161 | 0.140 | 0.114 | 0.100 | 0.112 | 0.089 | 0.077 | 0.072 | 0.096 | 0.092 | 0.081 | 0.078 | 0.069 | 0.096 | 0.064 | 0.072 | 0.076 | 0.084 | 0.080 | 0.087 | 0.110 |
Notes:
Of the two model matrices in which the six specimens were divided into two groups (Tests #1 and #2; Table 4), neither yields a significantly high correlation coefficient with the observed distance matrix, regardless of whether TM 1517 is linked to the three AP flattened specimens (c.f., Susman, de Ruiter & Brain, 2001; R = .371, P = 0.113) or with the two more rounded specimens (R = .677, P = 0.075). Of the three tests (#3–5) involving division of specimens into three groups, only one (Test #3) results in rejection of the null hypothesis (R = .550, P = 0.034). Hence, among those tested here, the model matrix that best reflects the observed distances (Dp) among specimens is one defined by the following three groups: (1) SK 24600, SKX 19495, SK 2598; (2) TM 1517, SKX 10924; (3) SKX 34805. All three Dp values between SKX 34805 and the members of the first group exceed the majority (>95%) of pairwise distances sampled within all four extant species (Table 3). The two members of the second group, being morphologically intermediate between members of the other two groups, are only unusually distant from SKX 19495 (and only relative to variation in P. troglodytes).
| Test set: | South Africa only | Eastern Africa only | Mixed regions | ||||||||||||||
|---|---|---|---|---|---|---|---|---|---|---|---|---|---|---|---|---|---|
| Test #: | 1 | 2 | 3 | 4 | 5 | 6 | 7 | 8 | 9 | 10 | 11 | 12 | 13 | 14 | 15 | ||
| Knowns | TM 1517 | 1 | 1 | 1 | 1 | 1 | 1 | 1 | 1a | 1 | |||||||
| OH 80 | 1 | 1 | 1 | 1 | 1 | 2 | 2 | 1b | 2 | ||||||||
| KNM-ER 3735/OH 62 | 2 | 2 | 2 | 2 | 2a | 1 | 2 | 3 | 2 | 3a | |||||||
| KNM-WT 15000/ER 1808 | 3 | 3 | 3 | 3 | 2b | 2 | 4 | 3 | 3b | ||||||||
| Unknowns | SKX 10924 | 2 | 1 | 1 | 3 | 3 | 1 | 1 | 1a | 1 | |||||||
| SK(X) 2598/19495/24600 | 1 | 2 | 2 | 2 | 2 | 2 | 1 | 3 | 2 | 3a | |||||||
| SKW 34805 | 2 | 1 | 3 | 1 | 3 | 1 | 4 | 3 | 3b | ||||||||
| ER 739/1504/6020/1591 | 2 | 3 | 4 | 1 | 1 | 2 | 2 | 1b | 2 | ||||||||
| Results w/o OH 62 | R | 0.371 | 0.677 | 0.550 | 0.438 | 0.397 | 0.161 | 0.166 | 0.315 | 0.621 | 0.490 | -0.005 | 0.380 | 0.512 | 0.097 | ||
| P | 0.113 | 0.075 | 0.034 | 0.100 | 0.107 | 0.262 | 0.305 | 0.084 | 0.004 | 0.007 | 0.443 | 0.0004 | 0.0002 | 0.156 | |||
| ns | ns | * | ns | ns | ns | ns | ns | ** | ** | ns | *** | *** | ns | ||||
| Results with OH 62 | R | 0.279 | 0.216 | 0.375 | 0.598 | 0.415 | 0.151 | 0.008 | 0.392 | 0.504 | 0.104 | ||||||
| P | 0.114 | 0.153 | 0.016 | 0.001 | 0.002 | 0.311 | 0.396 | 0.0002 | 0.0002 | 0.153 | |||||||
| ns | ns | * | ** | ** | ns | ns | *** | *** | ns | ||||||||
Notes:
- ns
-
not significant
- *
-
P < 0.05
- **
-
P < 0.01
- ***
-
P < 0.001
Eastern Africa
In the eastern African sample, over half of the specimens (five of nine) are attributed to species based on associated craniodental material. The remaining four specimens (referred to as “unknowns” below) derive from Koobi Fora.
The first two principal components account for 67.3% of the variation (Fig. 4). Shape variation along PC1 is remarkably similar to that observed for South Africa, such that specimens with low scores (in this case, those attributed to H. habilis) have more AP flattened cross sections, while those with high scores (i.e., those attributed to H. erectus) have more rounded sections. Shape differences between the two Homo groups are also apparent on the anterolateral surface, which is slightly concave in H. erectus and more convex in H. habilis; the same pattern of shape variation is also observed (to a lesser extent) along PC1 of the South African PCA. Along PC1, all four of the Koobi Fora “unknowns” cluster together in the middle, in close proximity to OH 80 (P. boisei). Based on Procrustes distances (Table 3), among the eastern African specimens, two of the “unknowns” (ER 1504, ER 6020) are morphologically more similar to OH 80 than to any other specimen,3 whilst ER 739 and ER 1591 are closer only to each other. In fact, the Procrustes distance (0.044) between ER 739 and ER 1591 is smaller than that for any other pair of fossils in the eastern African sample.
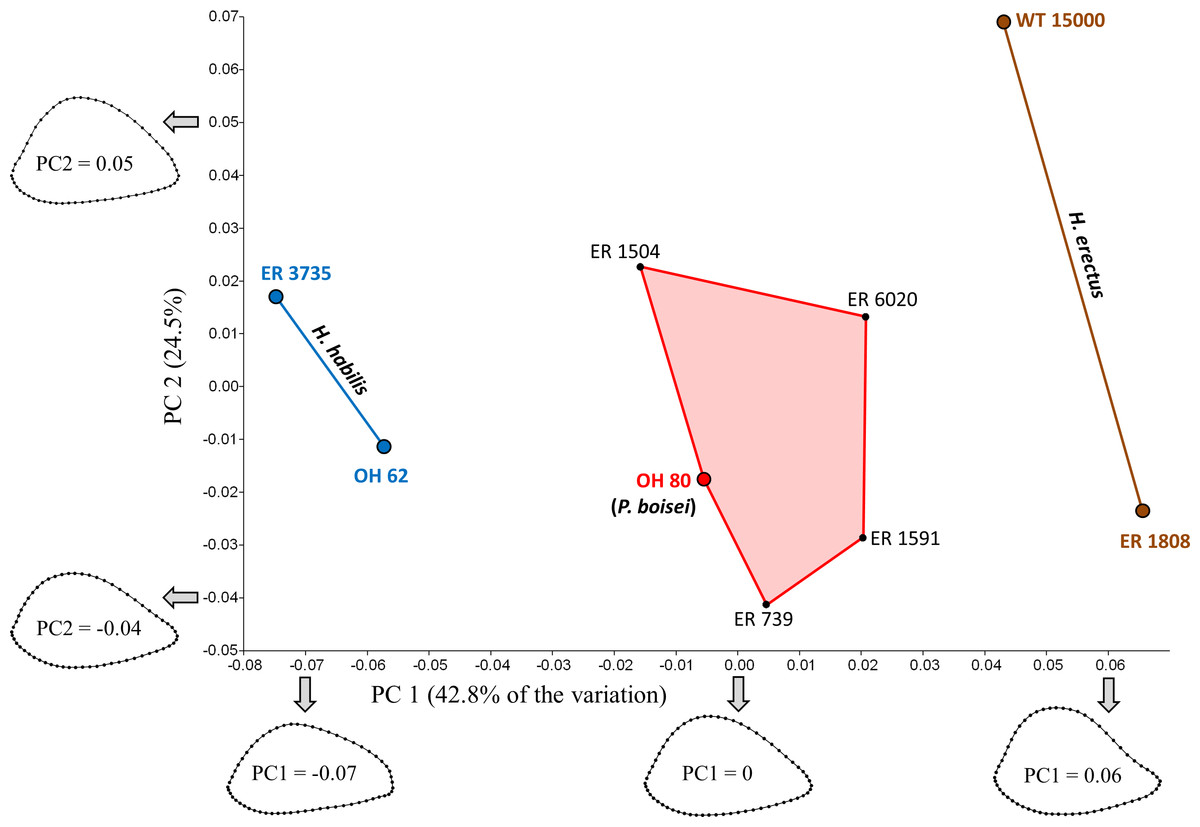
Figure 4: PCA results for the eastern African fossil study group.
Specimens associated with taxonomically identifiable craniodental remains are indicated with larger colored dots. As in South Africa, shape variation along PC1 involves differences in AP width relative to ML width. Results of the Mantel tests support the three-group configuration depicted on the plot. The four “unknown” Koobi Fora specimens likely represent P. boisei.
The shape similarity among the “unknowns” suggests coding them as members of the same taxon for purposes of the Mantel tests. In fact, previous studies of distal articular morphology also show strong shape similarity among the unallocated Koobi Fora humeri (Lague & Jungers, 1996; Lague, 2014; but see McHenry & Brown, 2008). As the specimens appear to comprise a morphologically cohesive group, and there is little basis for separating them, all of the “unknowns” were considered members of the same taxon for purposes of the eastern African Mantel tests.
The similarity of the “unknowns” to OH 80 is further supported by the Mantel test results (Table 4). With one exception, results are the same whether or not one includes the reconstructed OH 62 humerus; unless otherwise noted, values reported below are from tests in which OH 62 was excluded. Model matrices in which the Koobi Fora “unknowns” were coded as H. habilis (Test #6: R = 0.161, P = 0.262) or H. erectus (Test #7: R = 0.166, P = 0.305) are not correlated with the observed Procrustes distance matrix. Moreover, treatment of the “unknowns” as their own distinct group (i.e., not linked to any of the three known species) also produces a nonsignificant result (Test #8: R = 0.315, P = 0.084) unless OH 62 is included in the sample (R = 0.375, P = 0.016). In contrast, treatment of the four “unknowns” as P. boisei (i.e., grouping them with OH 80) yields a considerably higher and statistically significant correlation (Test #9: R = 0.621, P = 0.004).
A model matrix in which the two Homo species were linked (by assigning 0.5 for pairings between different species of Homo) also results in rejection of the null hypothesis (Test #10: R = 0.490, P = 0.007). Nonetheless, the correlation between observed and model matrices is much higher when the two Homo groups are treated independently, as one would expect given that the two species of Homo fall on opposite extremes of PC1. Moreover, three of the four possible interspecific Procrustes distances between H. habilis and H. erectus are unusually high (>95% of all pairwise values; Table 3) in one or more of the extant reference groups, with the distance between ER 1808 (H. erectus) and ER 3735 (H. habilis) being the largest in the eastern African sample.
Combined sample
When all of the fossil specimens are combined, PC1 is again associated with a pattern of shape variation in which AP flatter specimens have lower scores (Fig. 5). The first two principal components account for over 70% of the shape variation in the sample, though most of the between-group variation is associated with PC1. The arrangement of specimens along PC1 resembles a combination of the previous region-specific PCA results. Mantel Test #12 supports the hypothesis that shape-based distances among specimens do not reflect a simple regional dichotomy (i.e., eastern vs. southern; R = − 0.005, P = 0.443).

Figure 5: PCA results (PC1, PC2) for the main study group (combined geographic regions).
Specimens associated with taxonomically identifiable craniodental remains are indicated with larger colored dots. Shape variation along PC1 is similar to that observed for region-specific PCAs (Figs. 3 and 4). The two species of Paranthropus are both intermediate with respect to those morphological features that differentiate H. erectus from non-erectus early Homo.
Along PC1, SKX 34805 has the highest positive score, thereby falling closest to the two Kenyan specimens attributed to H. erectus. At the other extreme, the three Swartkrans specimens originally attributed to P. robustus (Susman, de Ruiter & Brain, 2001) are much closer to the two H. habilis specimens (OH 62, ER 3735) than to TM 1517 (P. robustus). A Mantel test (#11) involving only the two H. habilis humeri and the three aforementioned Swartkrans humeri does not support the separation of these specimens into two groups, largely because the Procrustes distance (0.045) between SK 24600 and KNM-ER 3735 is unusually small (i.e., second only to that between ER 739 and ER 1591 among fossils of the main study group).
Based on the results presented above, it is reasonable to consider the following four-group configuration (also see Table 5): (1) non-erectus early Homo (OH 62, ER 3735, SK 24600, SKX 19495, SK 2598), (2) P. boisei (OH 80, ER 739, 1504, 6020, 1591), (3) P. robustus (TM 1517, SKX 10924), (4) H. erectus (WT 15000, ER 1808, SKX 34805). A model matrix based on these four groups is significantly correlated with the observed Procrustes distance matrix, regardless of whether the four groups are treated as independent (Test #13: R = 0.392, P = 0.0002) or the two Paranthropus groups are coded as linked (Test #14: R = 0.504, P = 0.0002). On the other hand, if the two Homo groups are linked in the model matrix, the correlation drops considerably and the null hypothesis is accepted (Test #15: R = 0.104, P = 0.153). The above results are the same when OH 62 is excluded from the analyses. For all but two comparisons, morphometric distances (Dp) between members of the two Homo groups are significantly high relative to variation in at least one (and usually more than one) extant species (Table 3). Specimens belonging to the two intermediate Paranthropus groups generally do not produce significantly high Procrustes distances when paired with those assigned to either form of Homo (with some exceptions; SKX 34805 and OH 80, SKX 34805 and ER 6020, ER 6020 and SKX 19495).
| Species | Based on craniodental remains | Based on humeral morphology |
|---|---|---|
| P. robustus | TM 1517 | SKX 10924 |
| P. boisei | OH 80 | KNM-ER 739, ER 1504, ER 6020, ER 1591 |
| H. habilis a | OH 62, KNM-ER 3735 | SK 24600, SKX 19495, SK 2598 |
| H. erectus | KNM-WT 15000, KNM ER 1808 | SKX 34805 |
Notes:
Additional between-group variation is observed along the third principal component (Fig. 6), which is associated with shape differences that (on average) differentiate both forms of early Homo from P. boisei. Although groups overlap, the two forms of early Homo generally exhibit a less convex posterior diaphyseal surface, more similar (but not identical) to the flatter surface observed on the humeri of modern humans. (If the relatively extreme ER 6020 humerus is removed, the same group configuration is observed at a higher principal component (PC5) due to reduced variation along this particular axis).

Figure 6: PCA results (PC1, PC3) for the main study group (combined geographic regions).
Although groups overlap along PC3, both forms of early Homo generally differ from P. boisei (on average) by virtue of reduced surface convexity on the posterior side of the diaphysis.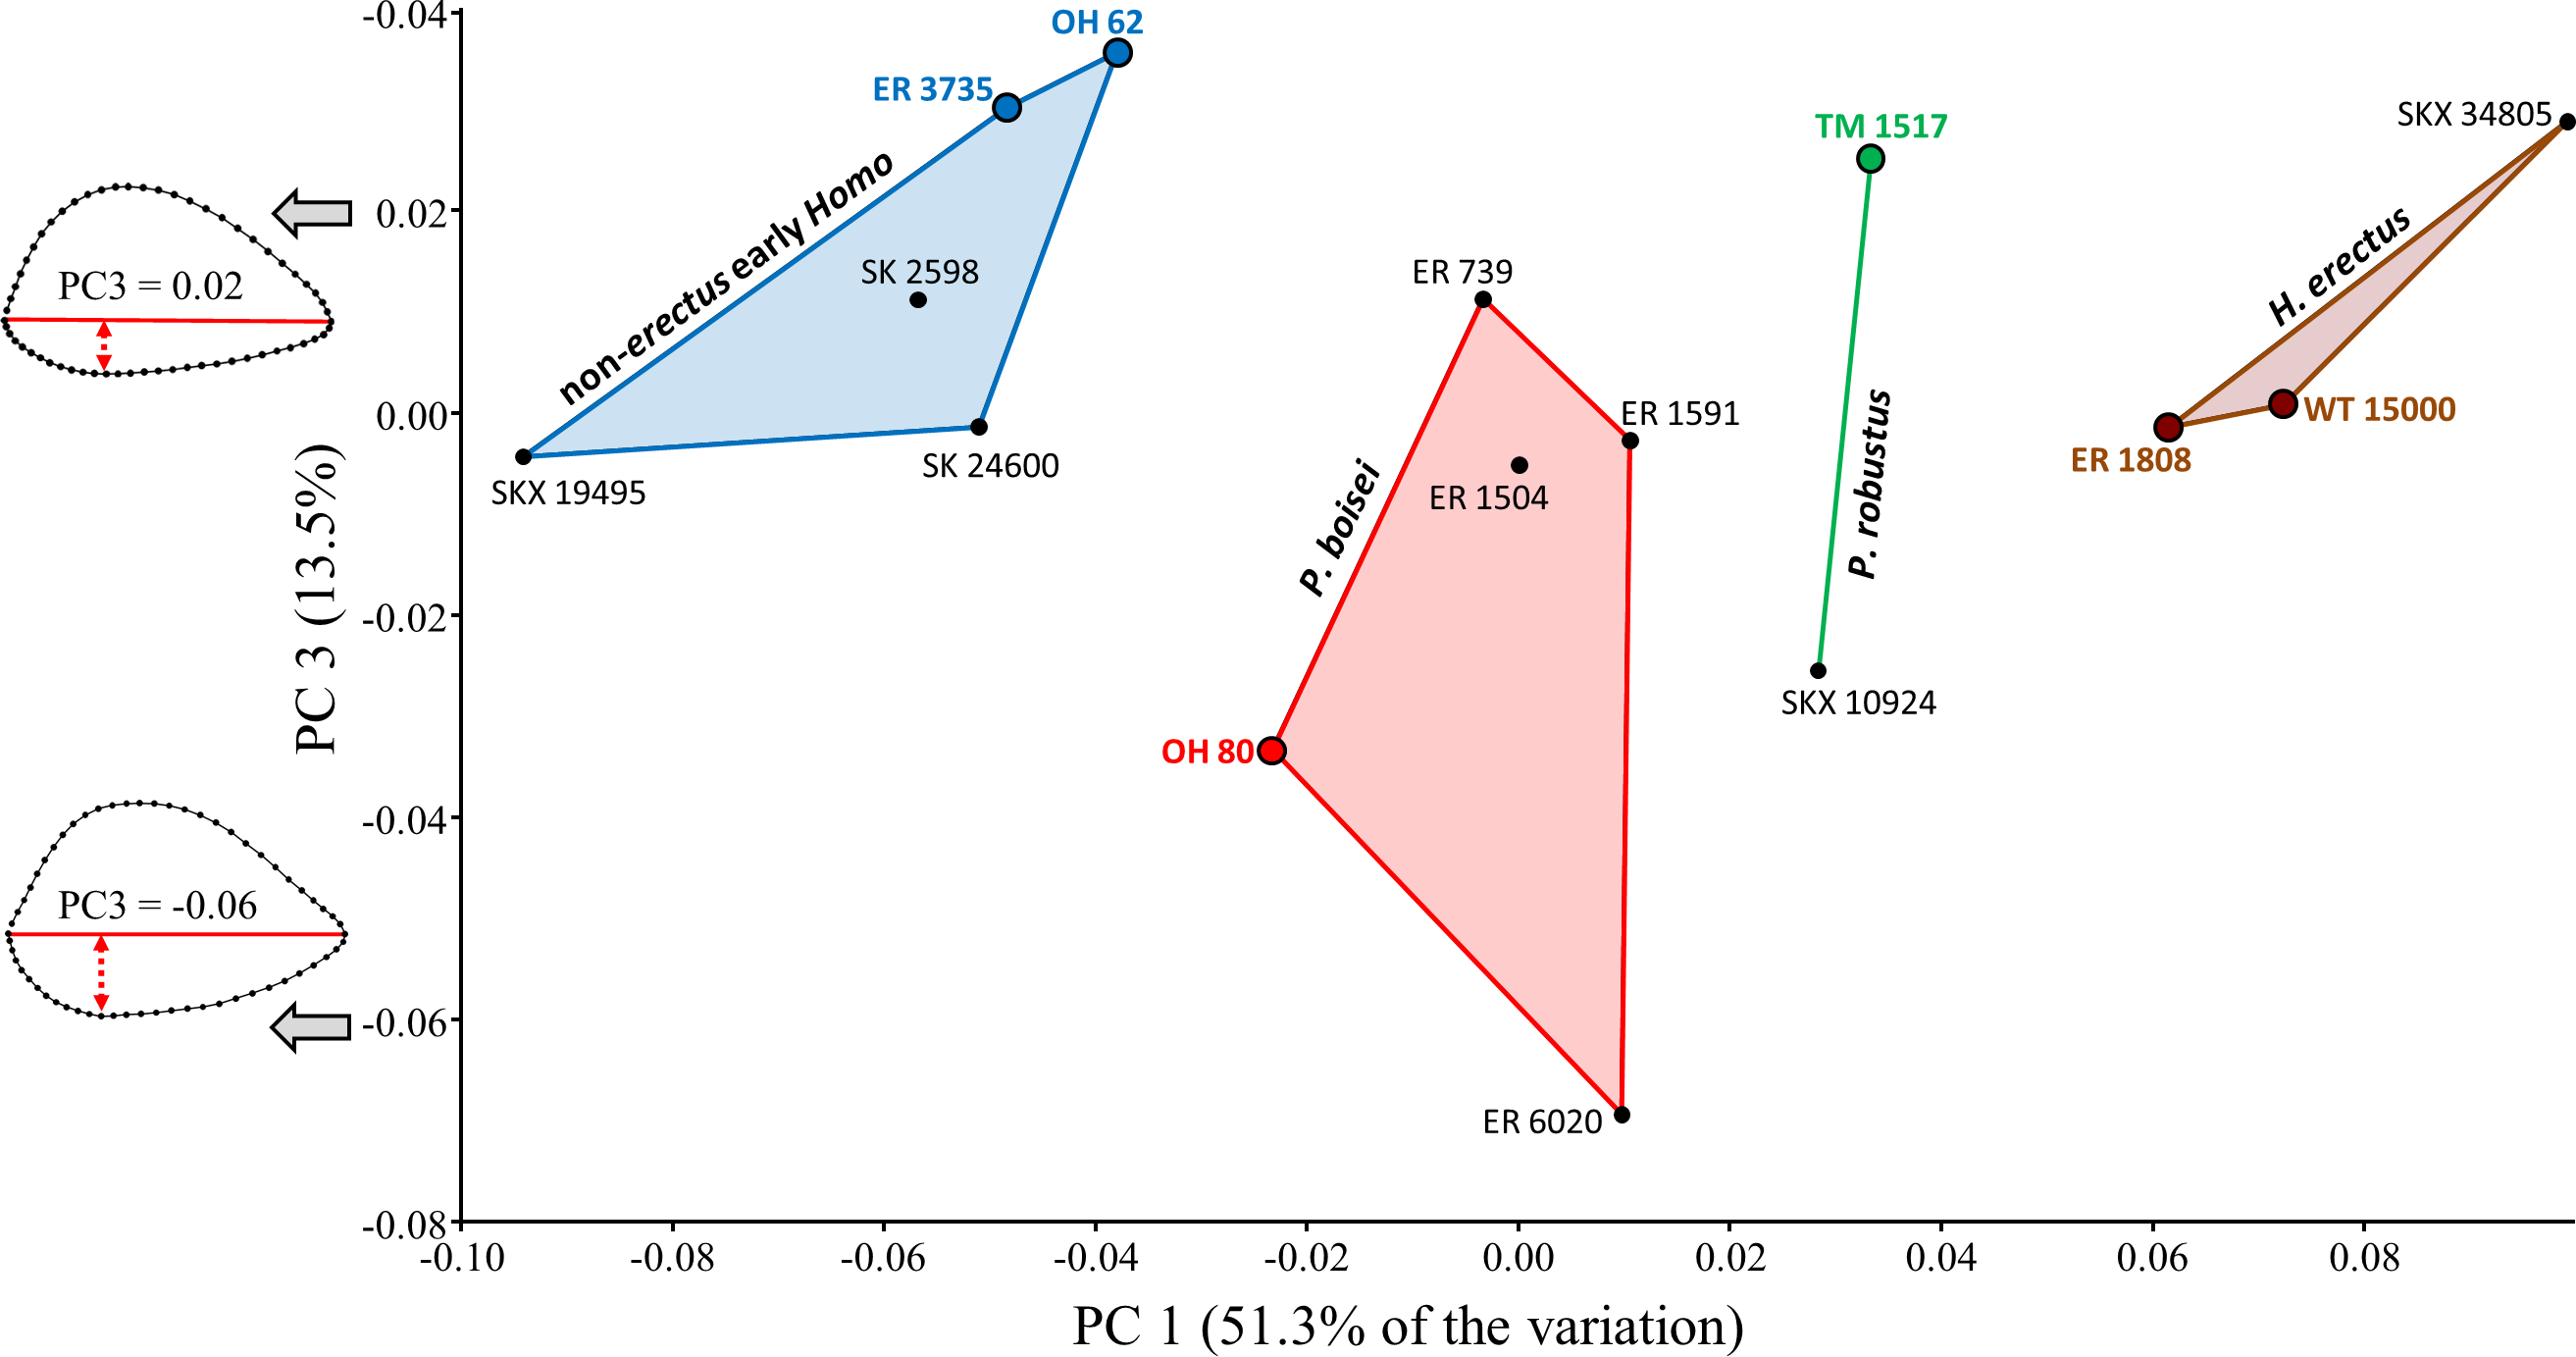
Effect of section location on cross-sectional shape variation
The potential effect of variation in section placement was considered by collecting data from four length-defined sections (15%, 17%, 19%, 21%) among modern humans, including the particular section (19%) assumed to be examined on the fossils. On average, among the modern humans sampled here, the proximodistal distance between adjacent sections equals 6.2 mm, such that the most proximal (21%) and most distal (15%) sections are separated by 18.6 mm on a specimen of average humeral length. Hence, the sampled sections cover a relatively wide span of the distal diaphysis.
Cross-sectional shape variation related to section placement is largely captured by PC1 (Fig. 7). Not surprisingly, modern human humeral diaphyses becomes relatively flatter in the AP dimension as one moves distally towards the olecranon fossa. In general, only at the most distal (15%) section does the shallow depression just proximal to the olecranon fossa begin to become apparent. Addition of the fossils to the PCA (Fig. 8) slightly changes the placement of PC1, though most of the variation among modern humans (related to section placement) is still associated with this component. The high degree of AP flattening that characterizes P. boisei and non-erectus early Homo is comparable to that observed at more distal regions (15%, 17%) of the modern human diaphysis. Nonetheless, as is clear from PC2, cross-sectional shapes of these two fossils groups (and P. robustus) are clearly dissimilar from those observed among modern humans, even at these more distal (i.e., AP flatter) section locations. Variation along PC2 reflects the more oval shape of the non-erectus fossil hominins, in contrast to the more triangular shape (and flatter posterior surface) of H. sapiens. H. erectus is similar to modern humans (particularly the 17% and 19% sections) along both of the first two principal components.
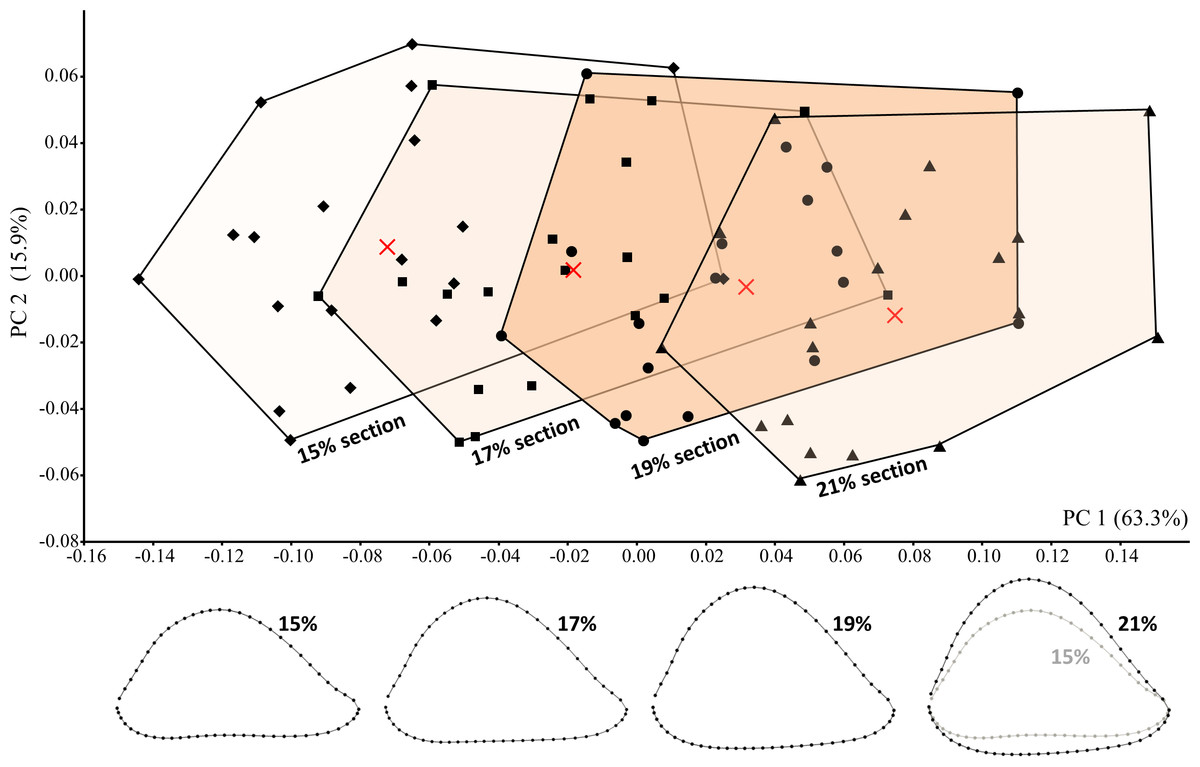
Figure 7: PCA results for modern humans sampled at four different section locations (i.e., 15%, 17%, 19%, and 21% of humeral length).
Average landmark configurations are shown for each group (and marked on the plot with “X”). Shape variation along PC1 corresponds to variation in section placement and is associated with increasing AP flatness at more distal sections.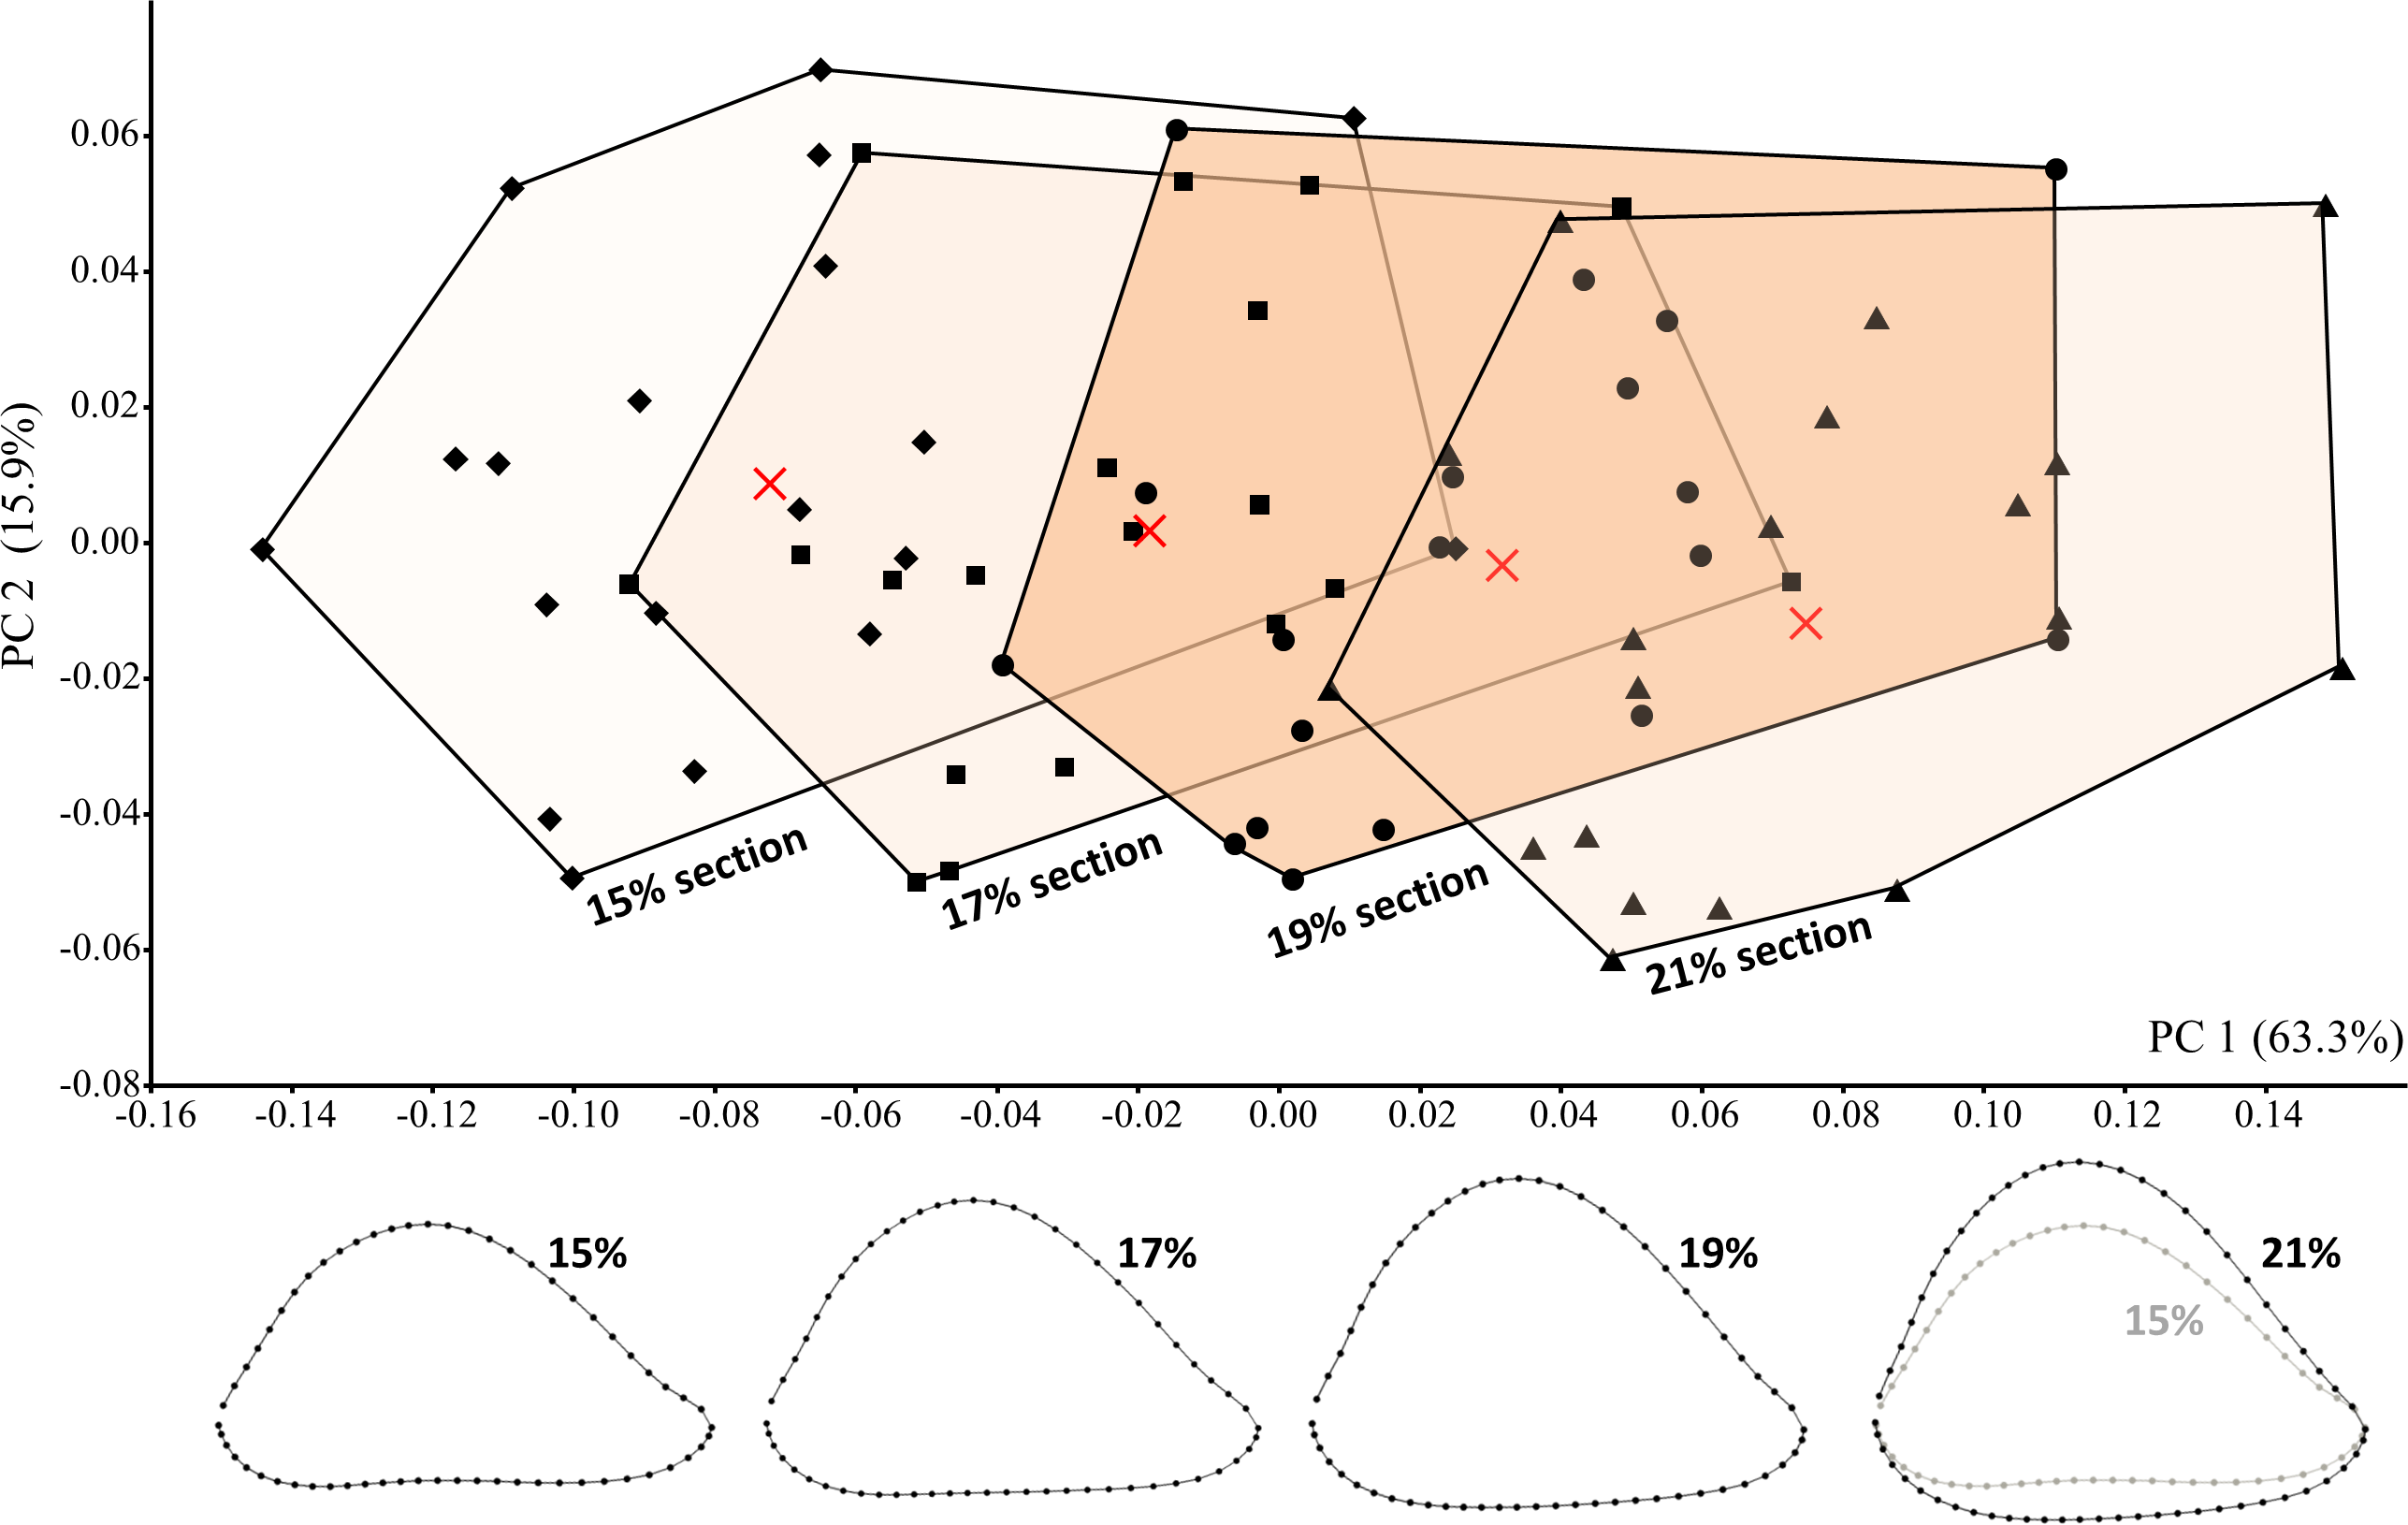

Figure 8: PCA results for the main fossil study group combined with modern humans (at four different section locations).
Fossil shapes were quantified at the 19% section level (highlighted for modern humans). More highly AP flattened diaphyseal sections have lower scores along PC1. Even at more distal (i.e., AP flatter) sections, modern humans are dissimilar from the most highly AP flattened fossils (P. boisei, non-erectus early Homo). H. erectus fossils resemble modern humans sampled at the same section level (19%). Fossils numbered as in Table 1.
Comparative context: extant hominids
Non-parametric multivariate analysis of variance (NPMANOVA) based on Procrustes distances (involving random permutation of group membership; 5,000 iterations) indicates significant shape differences among the four extant hominid species (F = 10.46, P = 0.0002). Based on post-hoc tests, all of the extant groups differ significantly from one another in shape (P < 0.05), even when the Bonferroni correction is used to adjust P values (based on the number of comparisons). Based on PCA of extant hominids alone (Fig. 9A), modern humans differ from nonhuman hominids (particularly African apes) in having a flatter (less convex) posterior diaphyseal surface, resulting in an overall more triangular shape. The lateral edge of the more oval cross-sectional outline of apes is also influenced by a more sharply defined lateral supracondylar ridge, though based on PC1, this is more true for chimpanzees than for the other nonhuman hominid groups (see also Fig. 10). Although orangutans appear to overlap substantially with the other hominids, the first two axes account for only 58.6% of the total variation in the sample; in fact, multiple two-group PCAs involving Pongo reveal more substantial differences between orangutans and the other extant species that are obfuscated when all four groups are considered together.
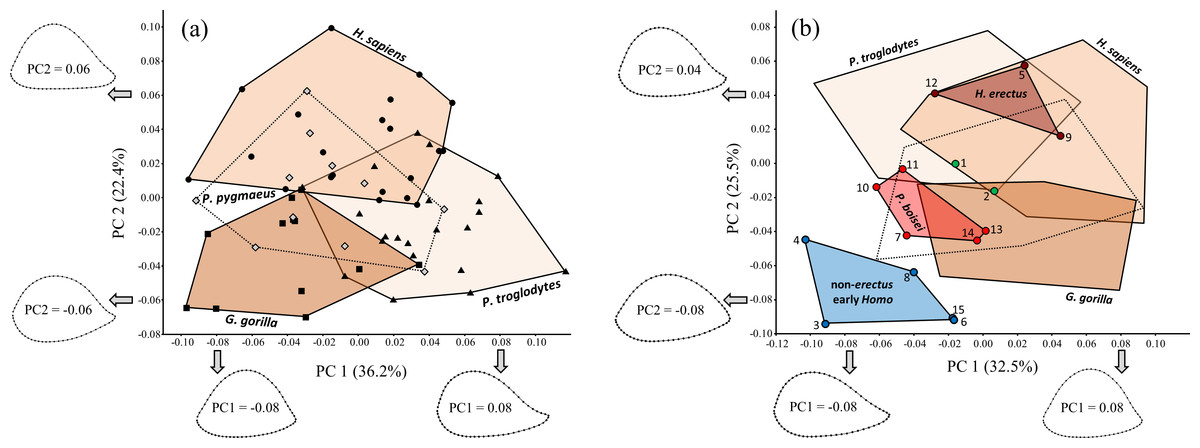
Figure 9: PCA results for (A) extant hominids only, and (B) extant hominids combined with the main fossil study group.
Despite considerable overlap, the extant species are significantly different from one another (based on NPMANOVA). Fossils attributed to non-erectus early Homo are highly unusual among both extant hominids and fossil hominins, while H. erectus falls within the H. sapiens range of variation. Fossils numbered as in Table 1.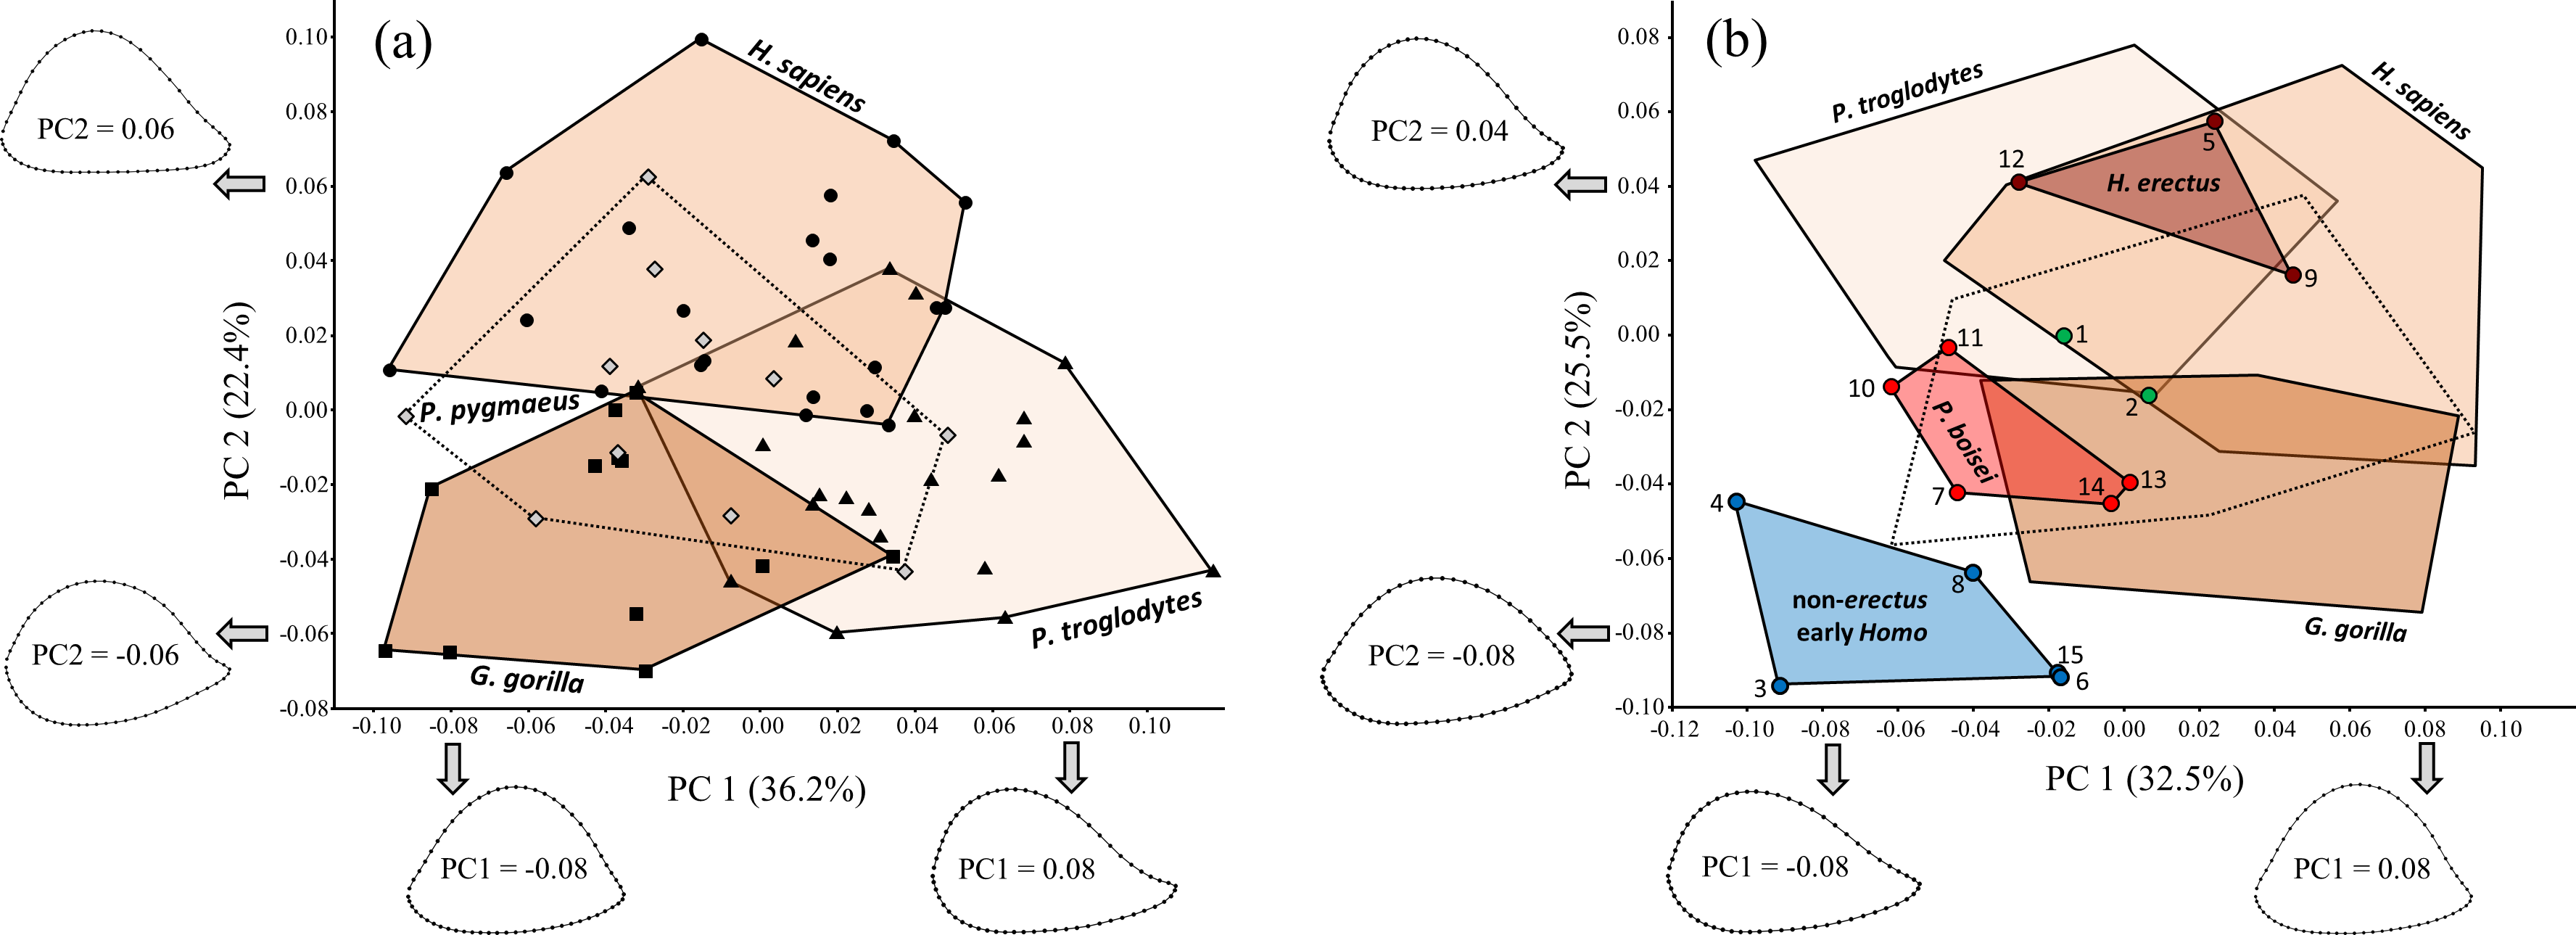
Inclusion of the fossils with the extant taxa (Fig. 9B) produces a similar (albeit rotated) configuration of extant groups. Variation along PC1 is similar to that for the extant-only plot (except that the axis is reversed). The arrangement of the four proposed fossil groups resembles that observed on previous fossil-only PCA plots, such that the two Paranthropus species appear intermediate between two different Homo extremes. The H. erectus group falls within the H. sapiens range of variation on PC1 and PC2, while P. boisei and non-erectus early Homo both fall beyond modern humans and do not strongly resemble any particular extant taxon. Indeed, members of the non-erectus Homo group appear to be highly unusual among both living and fossil hominids.
Comparative context: Australopithecus
A PCA that includes Australopithecus (and sex-species means for extant hominids) yields virtually the same principal components as that for the main study group alone (PC1 reversed), with some additional variation along PC2 due to the high scores for Au. sediba (MH1, MH2) along this axis (Fig. 11). Apart from Au. sediba, fossil specimens attributed to Australopithecus are relatively homogeneous in shape and occupy a region between the proposed H. erectus and P. boisei groups, thereby overlapping with P. robustus.

Figure 10: Group averages for distal humeral diaphyseal cross-sectional shape.
Shapes are based on generalized orthogonal least-squares Procrustes analysis (GPA) of 60 two-dimensional coordinate points (2 landmarks, 58 sliding semilandmarks).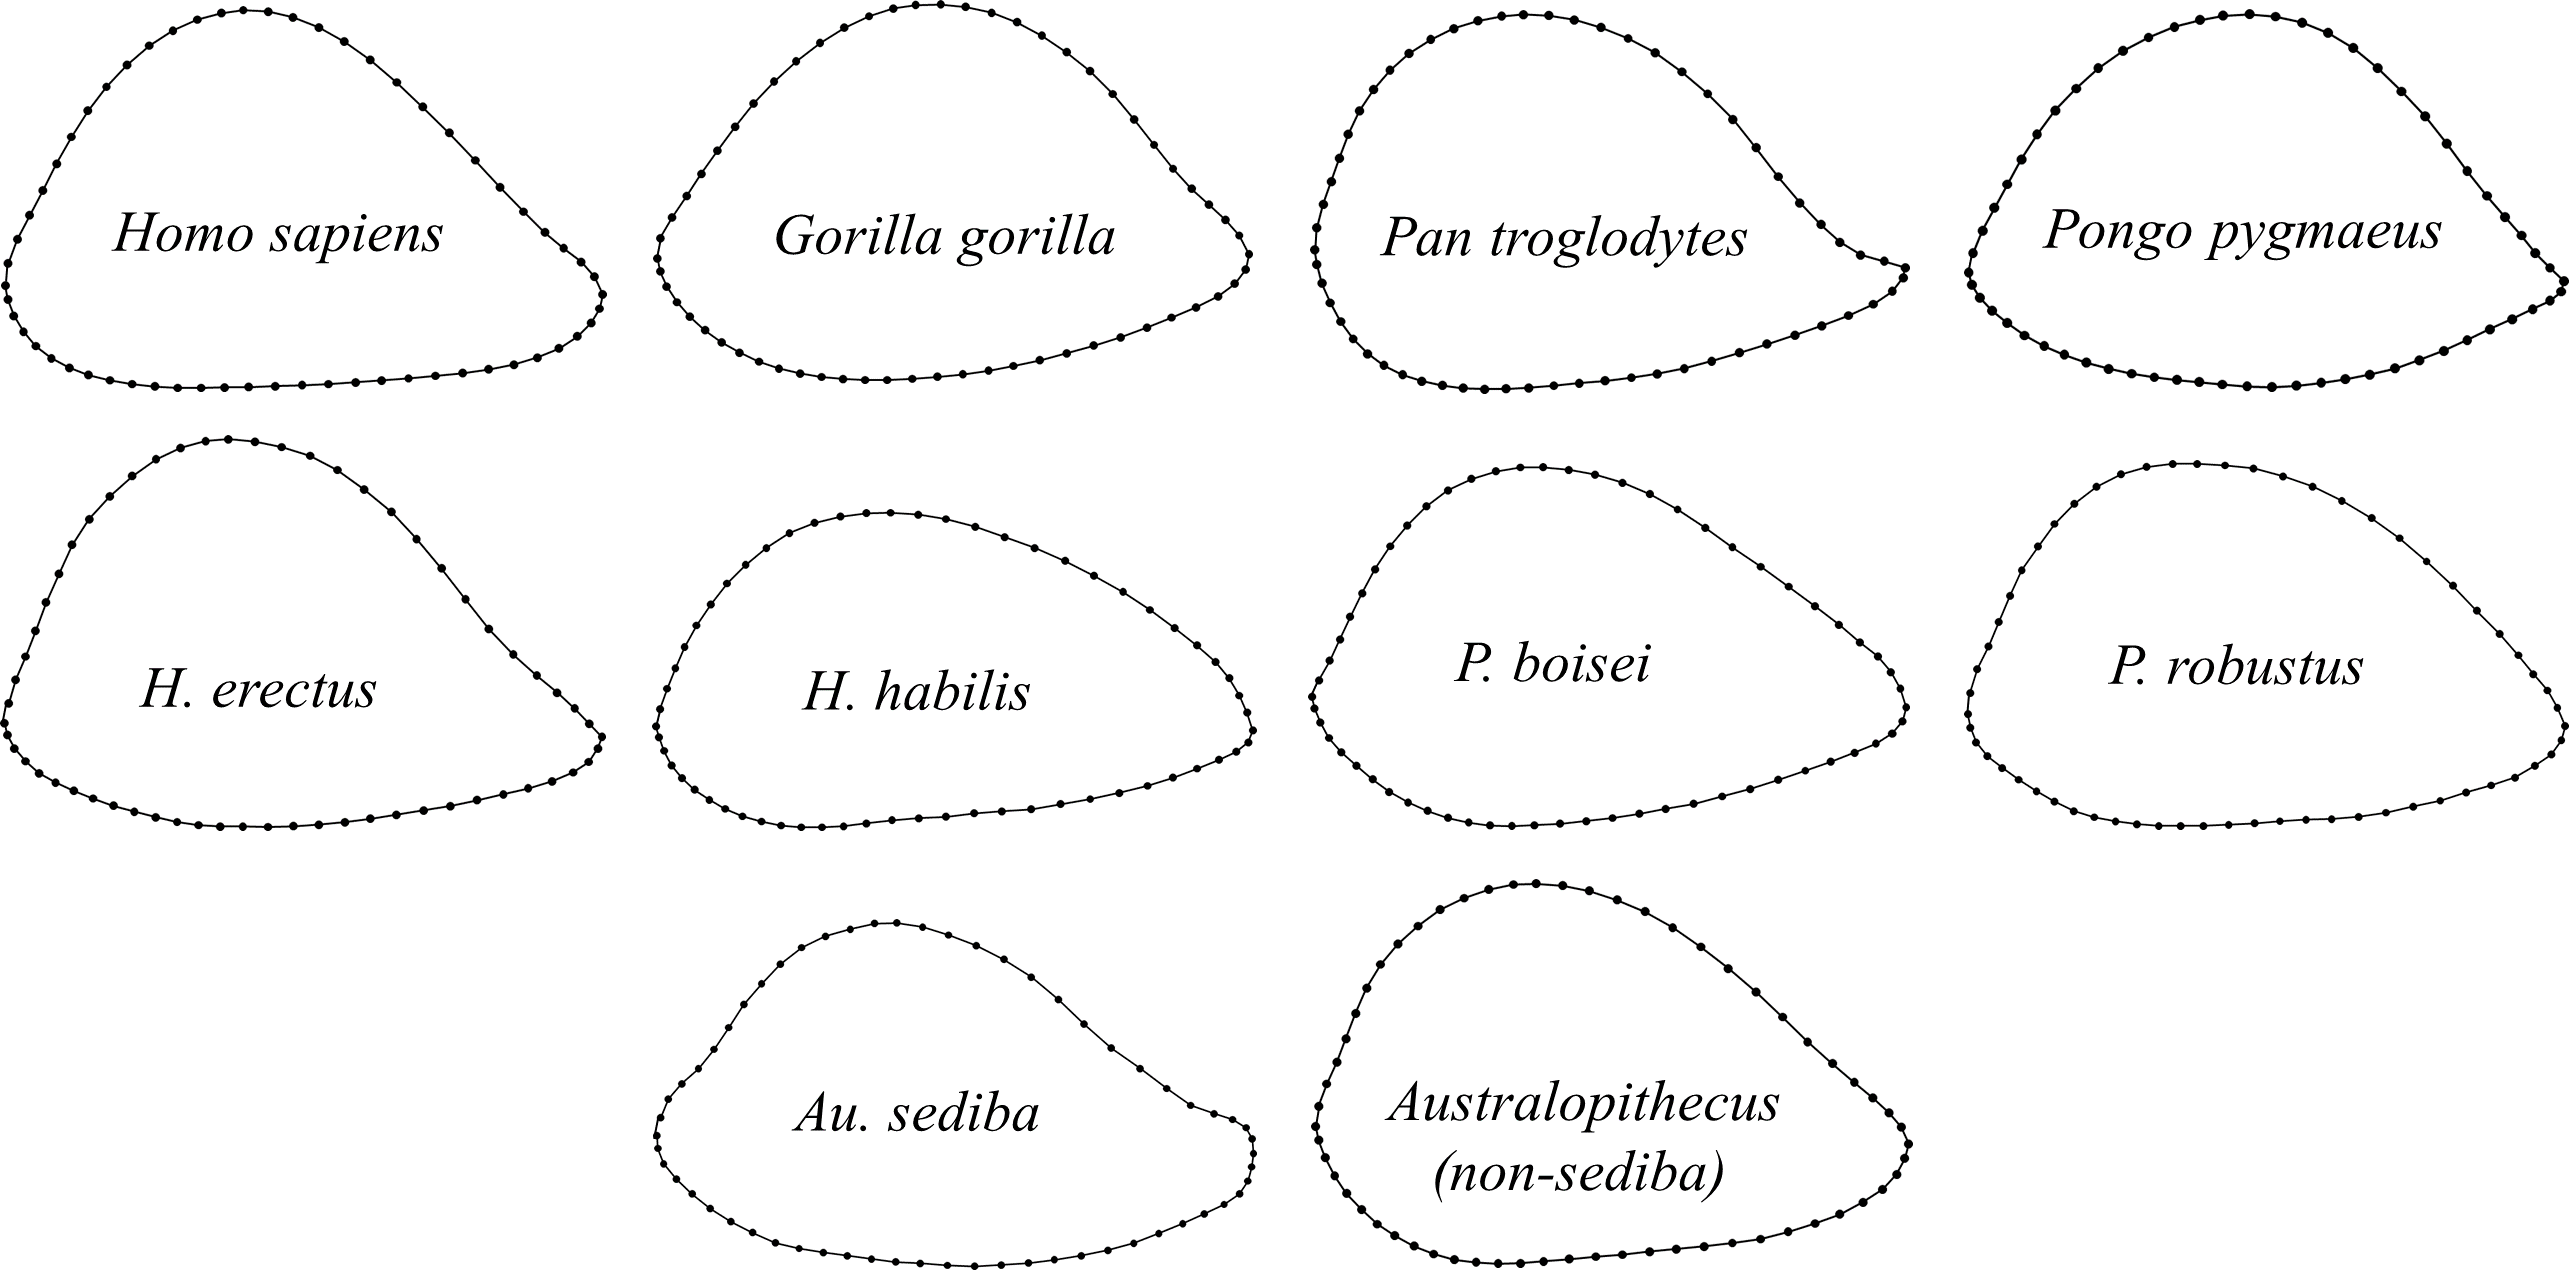
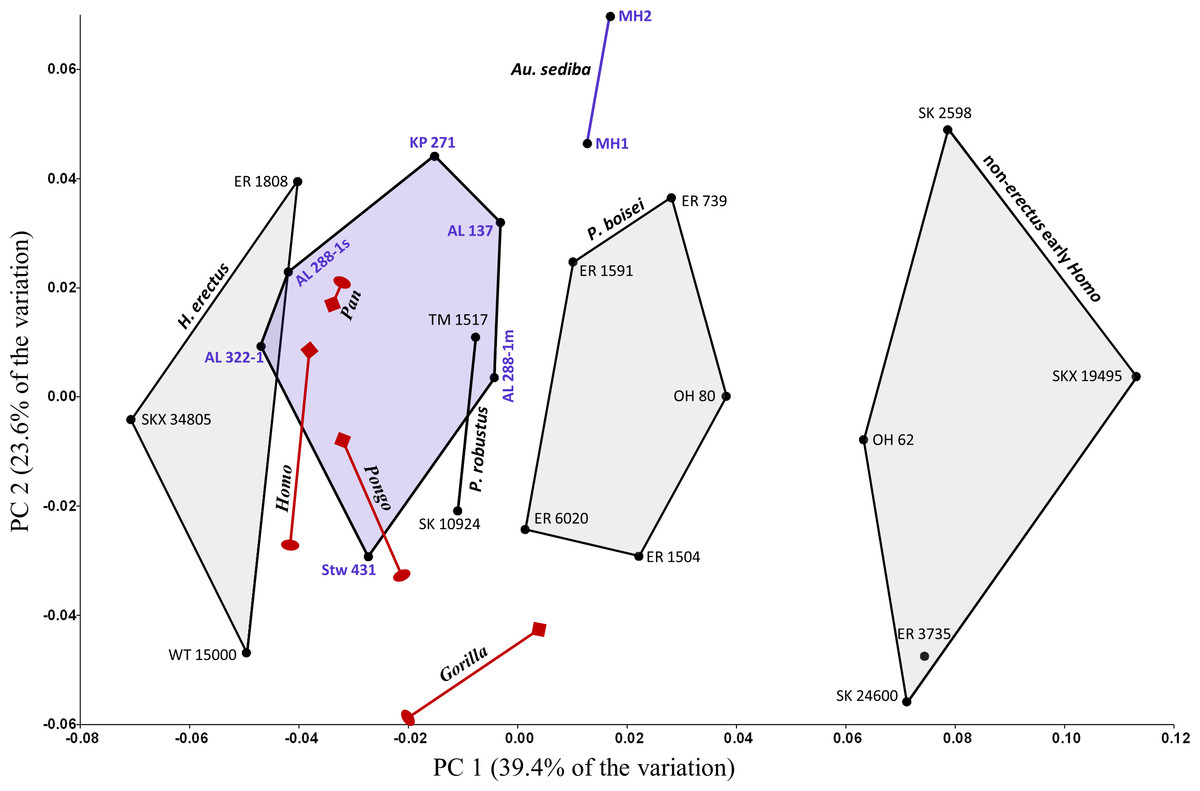
Figure 11: PCA results for the entire fossil sample.
Fossils beyond the main study group include seven specimens of Australopithecus (purple). Extant hominid sex-species means are also included (dark red; oval, female; diamond, male). Addition of the aforementioned specimens produces similar principal components as a PCA based on the main study group alone. With the exception of those attributed to Au. sediba, specimens of Australopithecus are relatively similar to one another and to P. robustus.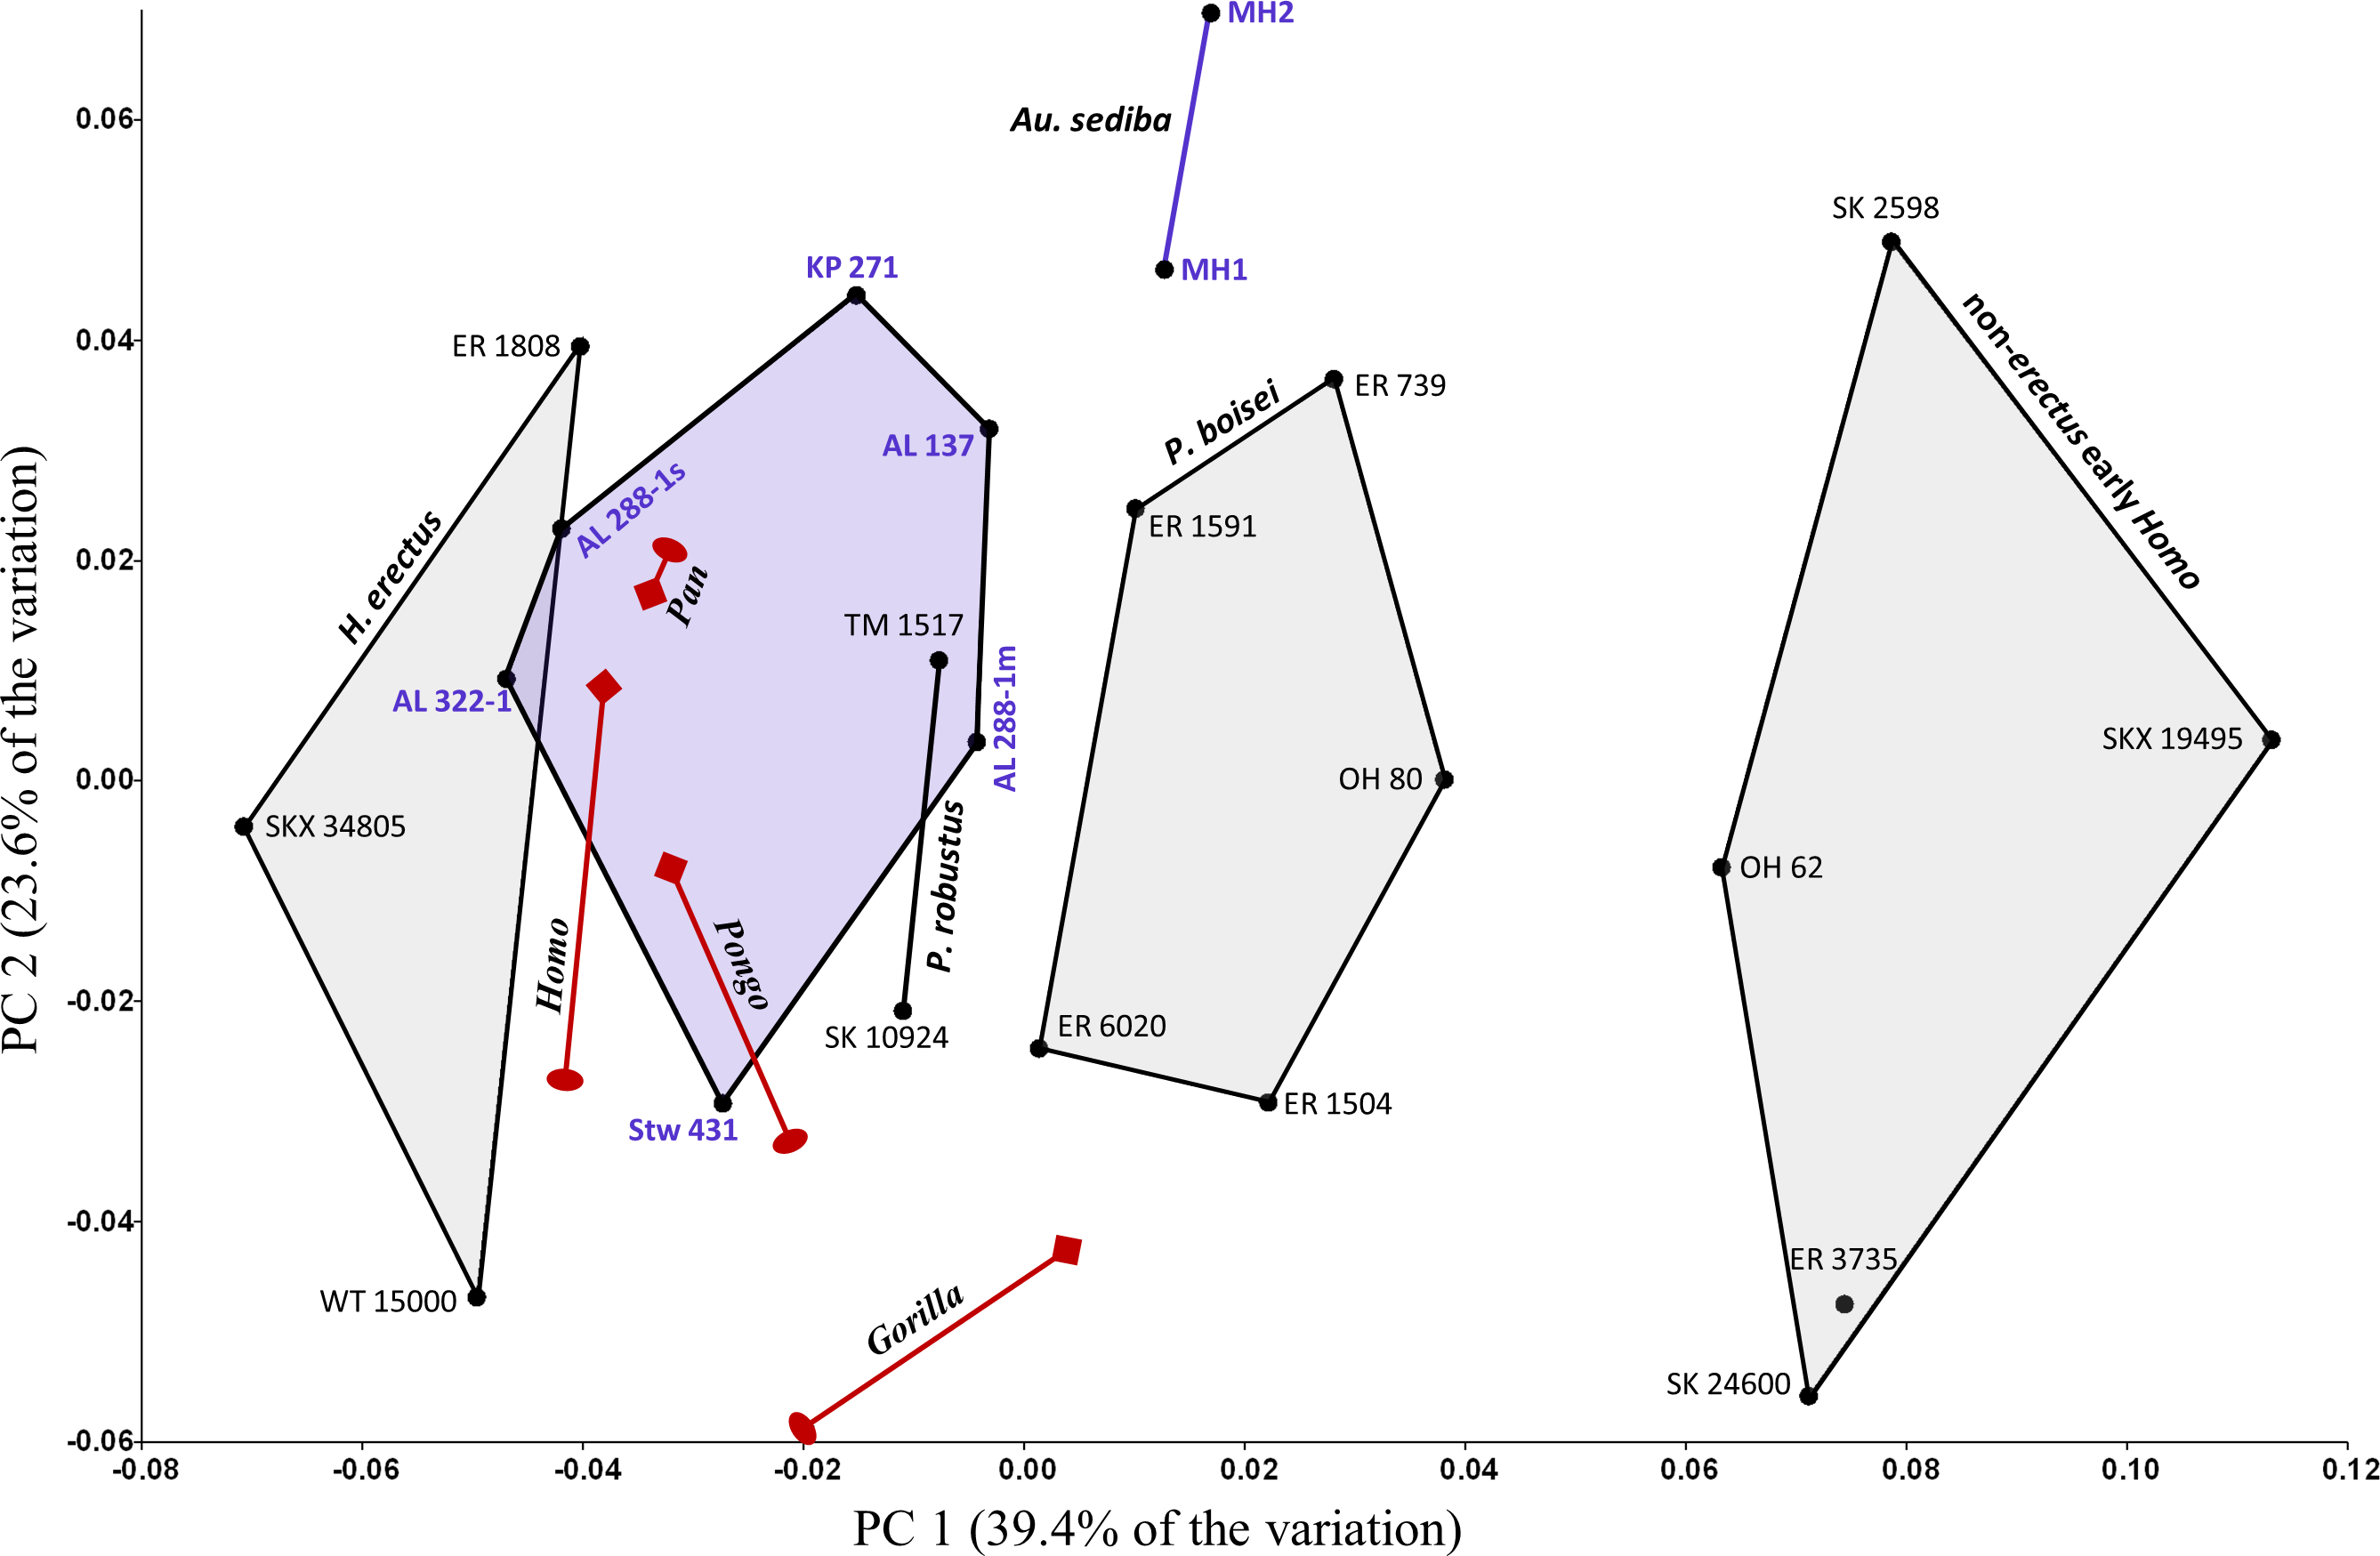
Although they are clearly not identical in shape, the left and right humeri of AL 288-1 (“Lucy”) are not as relatively dissimilar as they appear along PC1; out of 253 possible pairwise comparisons among the fossil specimens, only six pairings (e.g., MH1 and MH2) yield a lower Dp than that between AL 288-1m and AL 288-1s. Based on Procrustes distances, Lucy’s humeri are more similar to one another than either is to any other fossil specimen, with the result that they are linked together if one performs a UPGMA cluster analysis of the entire fossil sample (not shown, due to an insufficiently high cophenetic correlation coefficient of 0.72). It would appear that the morphological differences between AL 288-1m and AL 288-1s, however small, parallel the shape variation correlated with PC1, accounting for the apparent distance between these specimens along this axis. Indeed, PCA of the Australopithecus specimens alone produces a plot in which the Lucy humeri appear (as expected) much closer to one another. Exploration of the extant hominids sampled here does not support the existence of any consistent shape differences between left and right sides, though a thorough analysis of left/right cross-sectional shape asymmetry is beyond the scope of this paper.
Extant species means along PC1 fall close to one another and within the same region as Australopithecus, with none approaching the extreme AP flatness observed for specimens of non-erectus early Homo, and only the average for gorilla males overlapping with P. boisei. Based on Procrustes distances, all of the extant species means are about equally dissimilar from the average shape for Australopithecus (non-sediba), with gorillas being the most distant (as suggested by their higher placement on PC2). The apparent similarity between Pan and Homo on the PCA plot is somewhat misleading, as chimpanzees are far closer to gorillas than to modern humans along the third principal component (PC3: 14.3%; not shown). In fact, among extant taxa, Homo is most similar to Pongo, as depicted in a UPGMA cluster analysis based on Procrustes distances between group means (Fig. 12). The uniqueness of both Au. sediba and non-erectus early Homo is also apparent from the cluster analysis, as these groups belong to separate branches that fall outside all of the other sampled hominids. In contrast, H. erectus links closely with H. sapiens, and P. robustus links closely with Australopithecus (non-sediba). It is also worth noting that all extant hominid sexes are linked with the opposite sex of the same species.
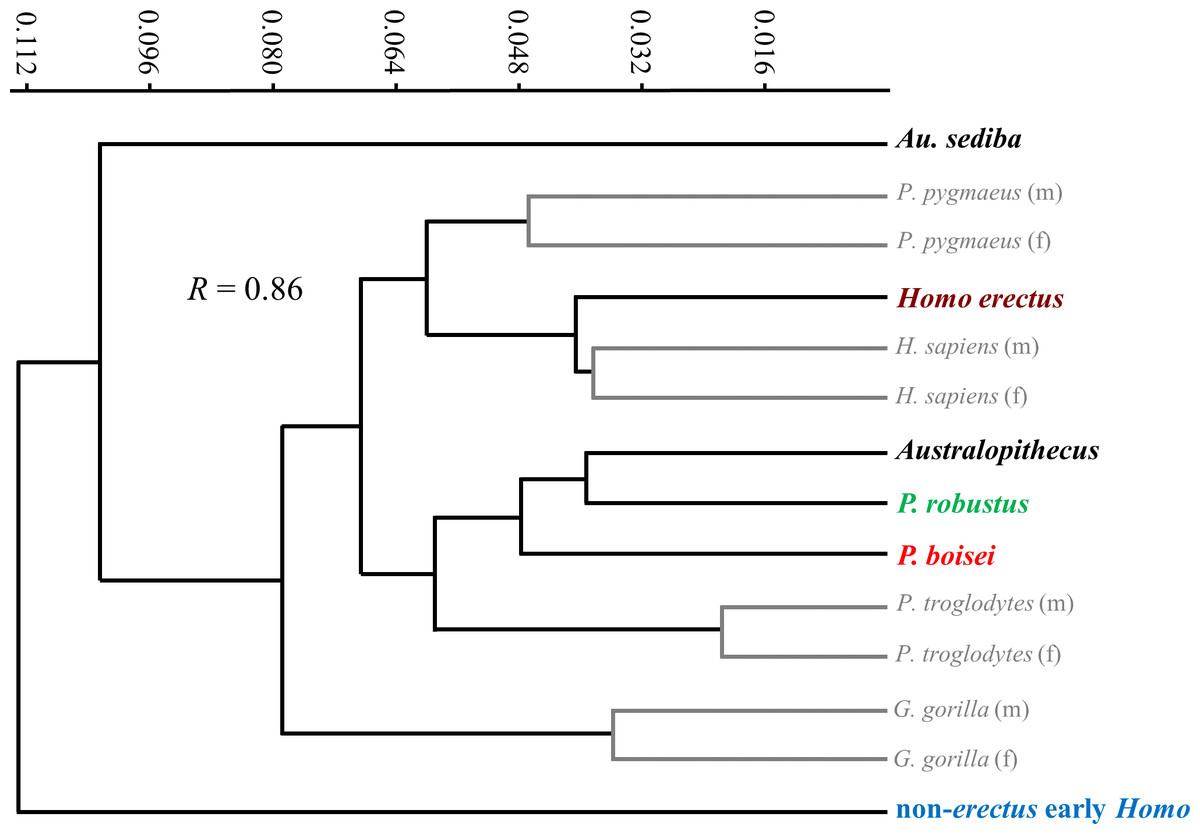
Figure 12: UPGMA cluster analysis based on Procrustes distances between group averages for distal diaphyseal shape.
Among extant taxa, all groups are most closely linked to conspecific groups of the opposite sex. “Australopithecus” includes all sampled specimens of Australopithecus except those attributed to Au. sediba and is most closely linked with P. robustus. Modern humans are closely linked with H. erectus. Both Au. sediba and non-erectus early Homo appear to be unusual among hominids.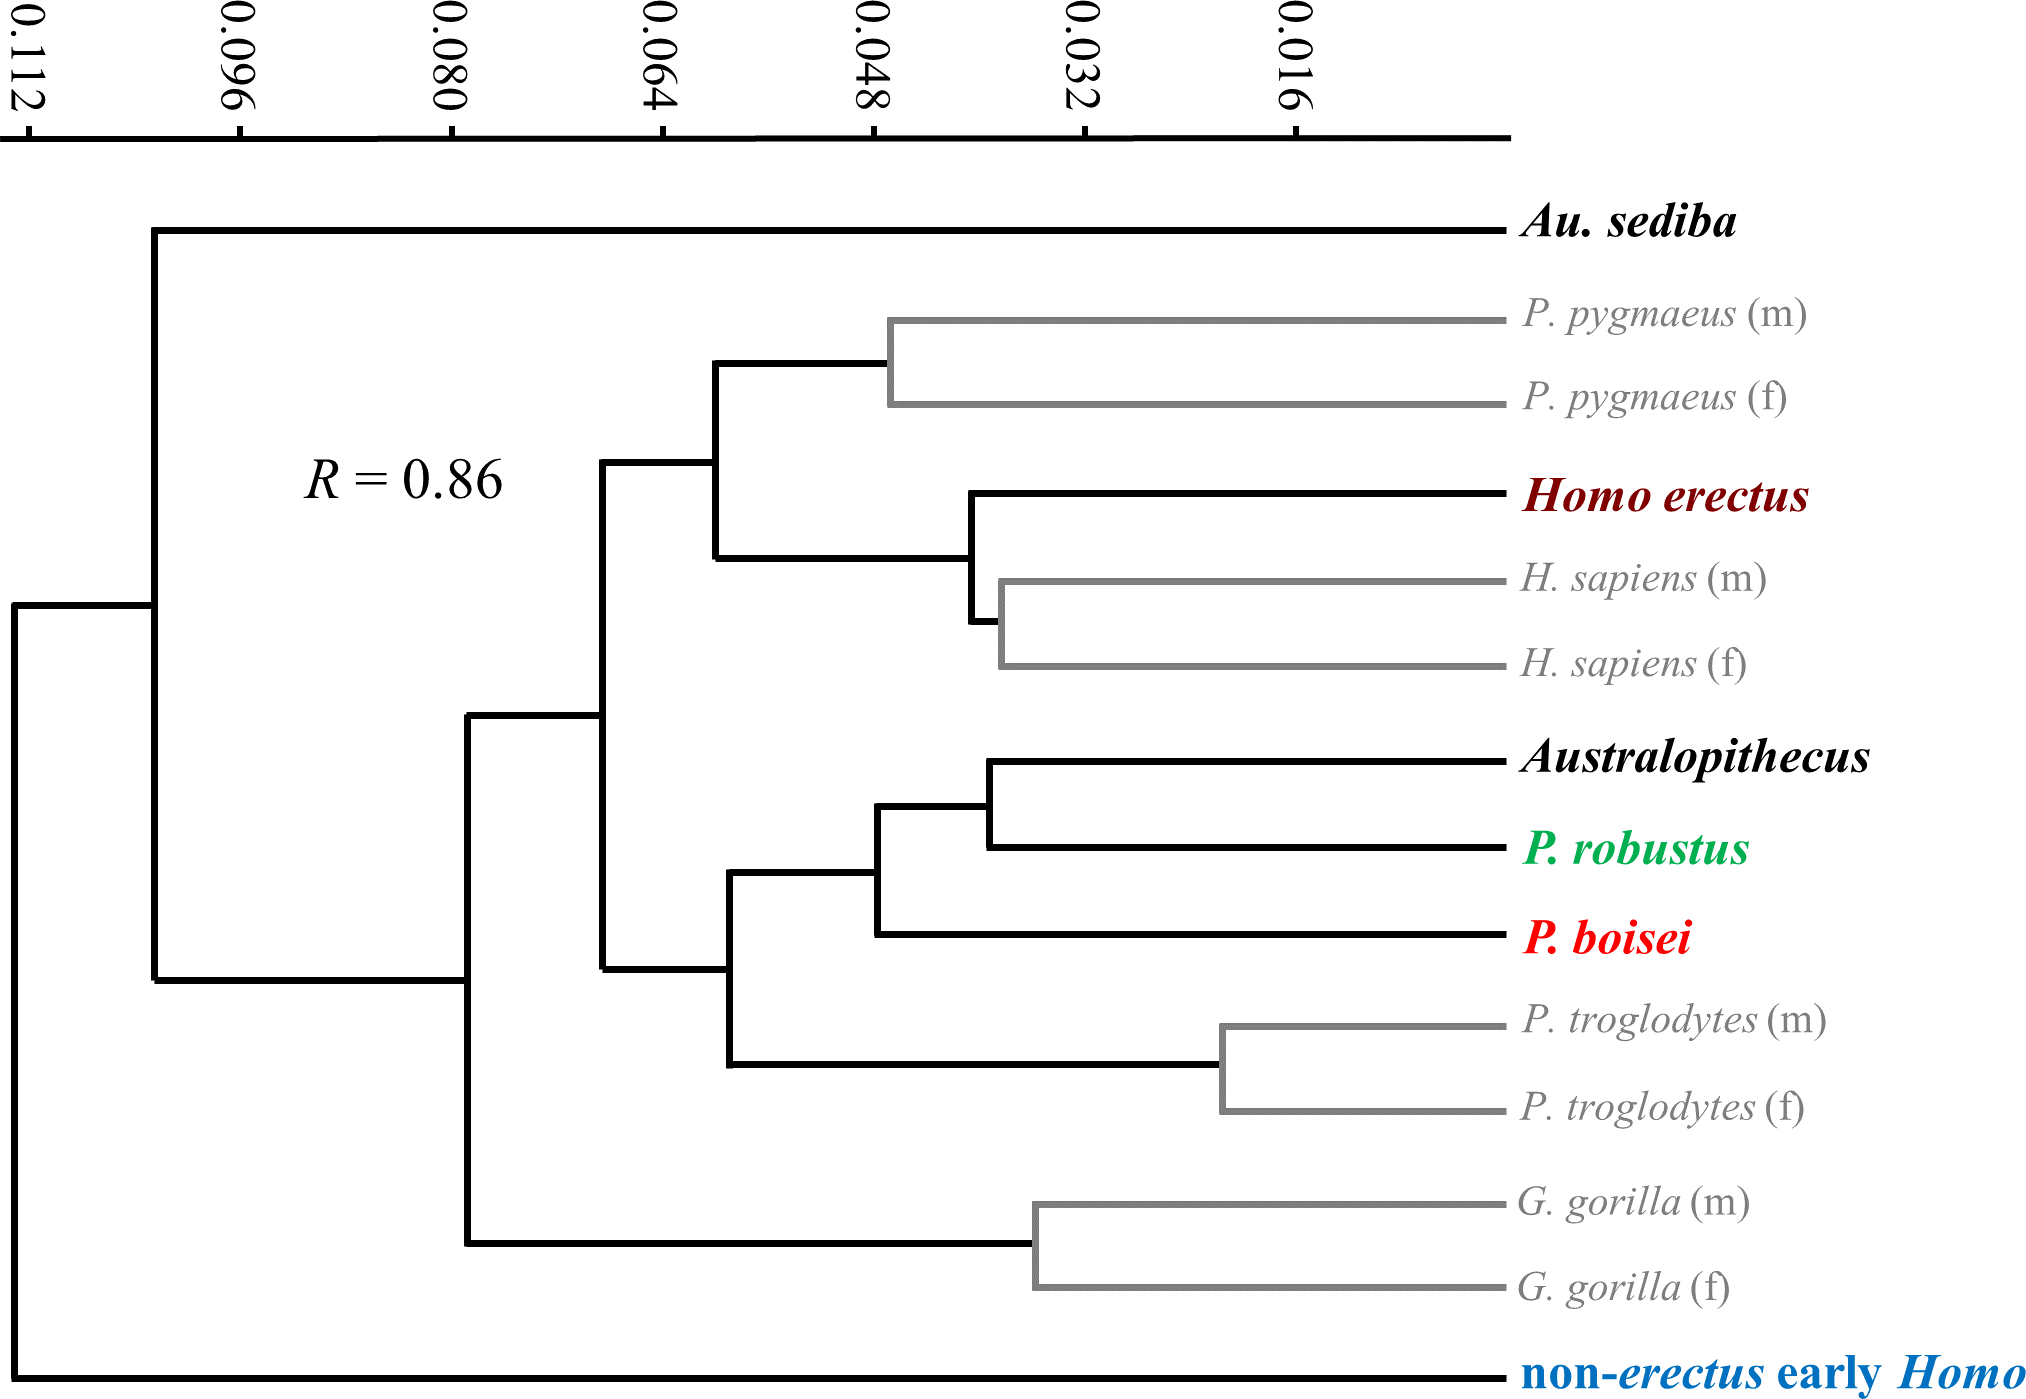
The evolution of humeral shape (at least those aspects captured by PC1) can be further assessed by plotting PC1 scores against geological age of the specimens (Fig. 13). Based on the small sample of specimens included here, the diaphyseal shape of non-sediba Australopithecus appears relatively stable over much of the evolution of the genus, particularly considering that the range of PC1 scores observed for Au. afarensis includes the scores for both KNM-KP 271 (Au. anamensis) and Stw 431 (Au. africanus). With the exception of AL 288-1m (just beyond the upper range of H. sapiens), all of the scores for non-sediba Australopithecus fall within the ranges of the four extant species. The period after 2.0 Ma is characterized by increased variation in humeral diaphyseal shape. While P. robustus is characterized by the same morphology exhibited by Australopithecus, H. erectus exhibits a morphology more similar to modern Homo and Pongo (also see UPGMA cluster results; Fig. 12). Specimens attributed here to P. boisei exhibit a degree of AP flattening that is rarely observed among modern hominids at this level of the diaphysis, while the diaphyseal shape of non-erectus early Homo appears to be unique among all of the extant and fossil hominids sampled here.
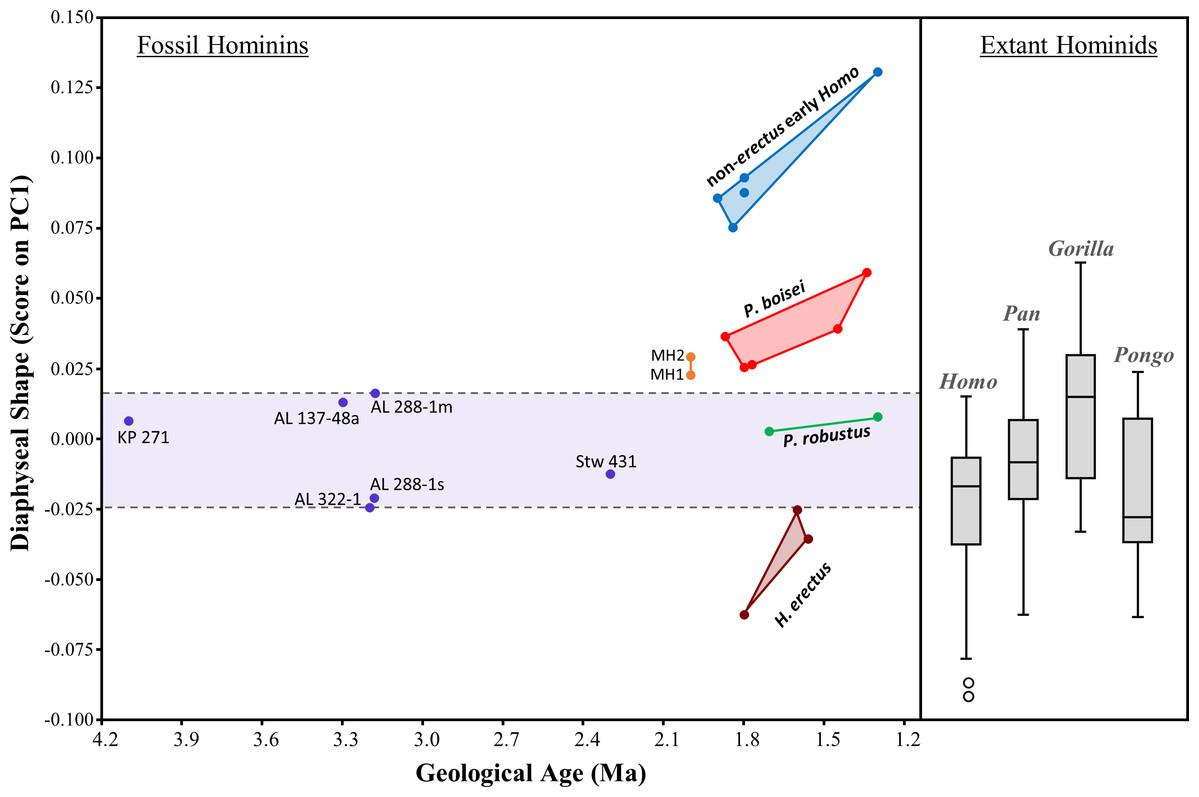
Figure 13: Scatter plot of the relationship between geological time and diaphyseal shape (i.e., PC1 score).
PC1 scores were obtained by projecting all specimens onto the first principal component of the combined-region PCA (Fig. 5). Variation among 2-1 Ma fossil hominins is considerable compared to interspecific variation within Australopithecus. The relatively AP flattened (ML widened) diaphyses of both P. boisei and non-erectus early Homo are atypical of extant hominids. Boxes for extant species contain 50% of the data (median at horizontal line) and ‘whiskers’ represent min./max. values.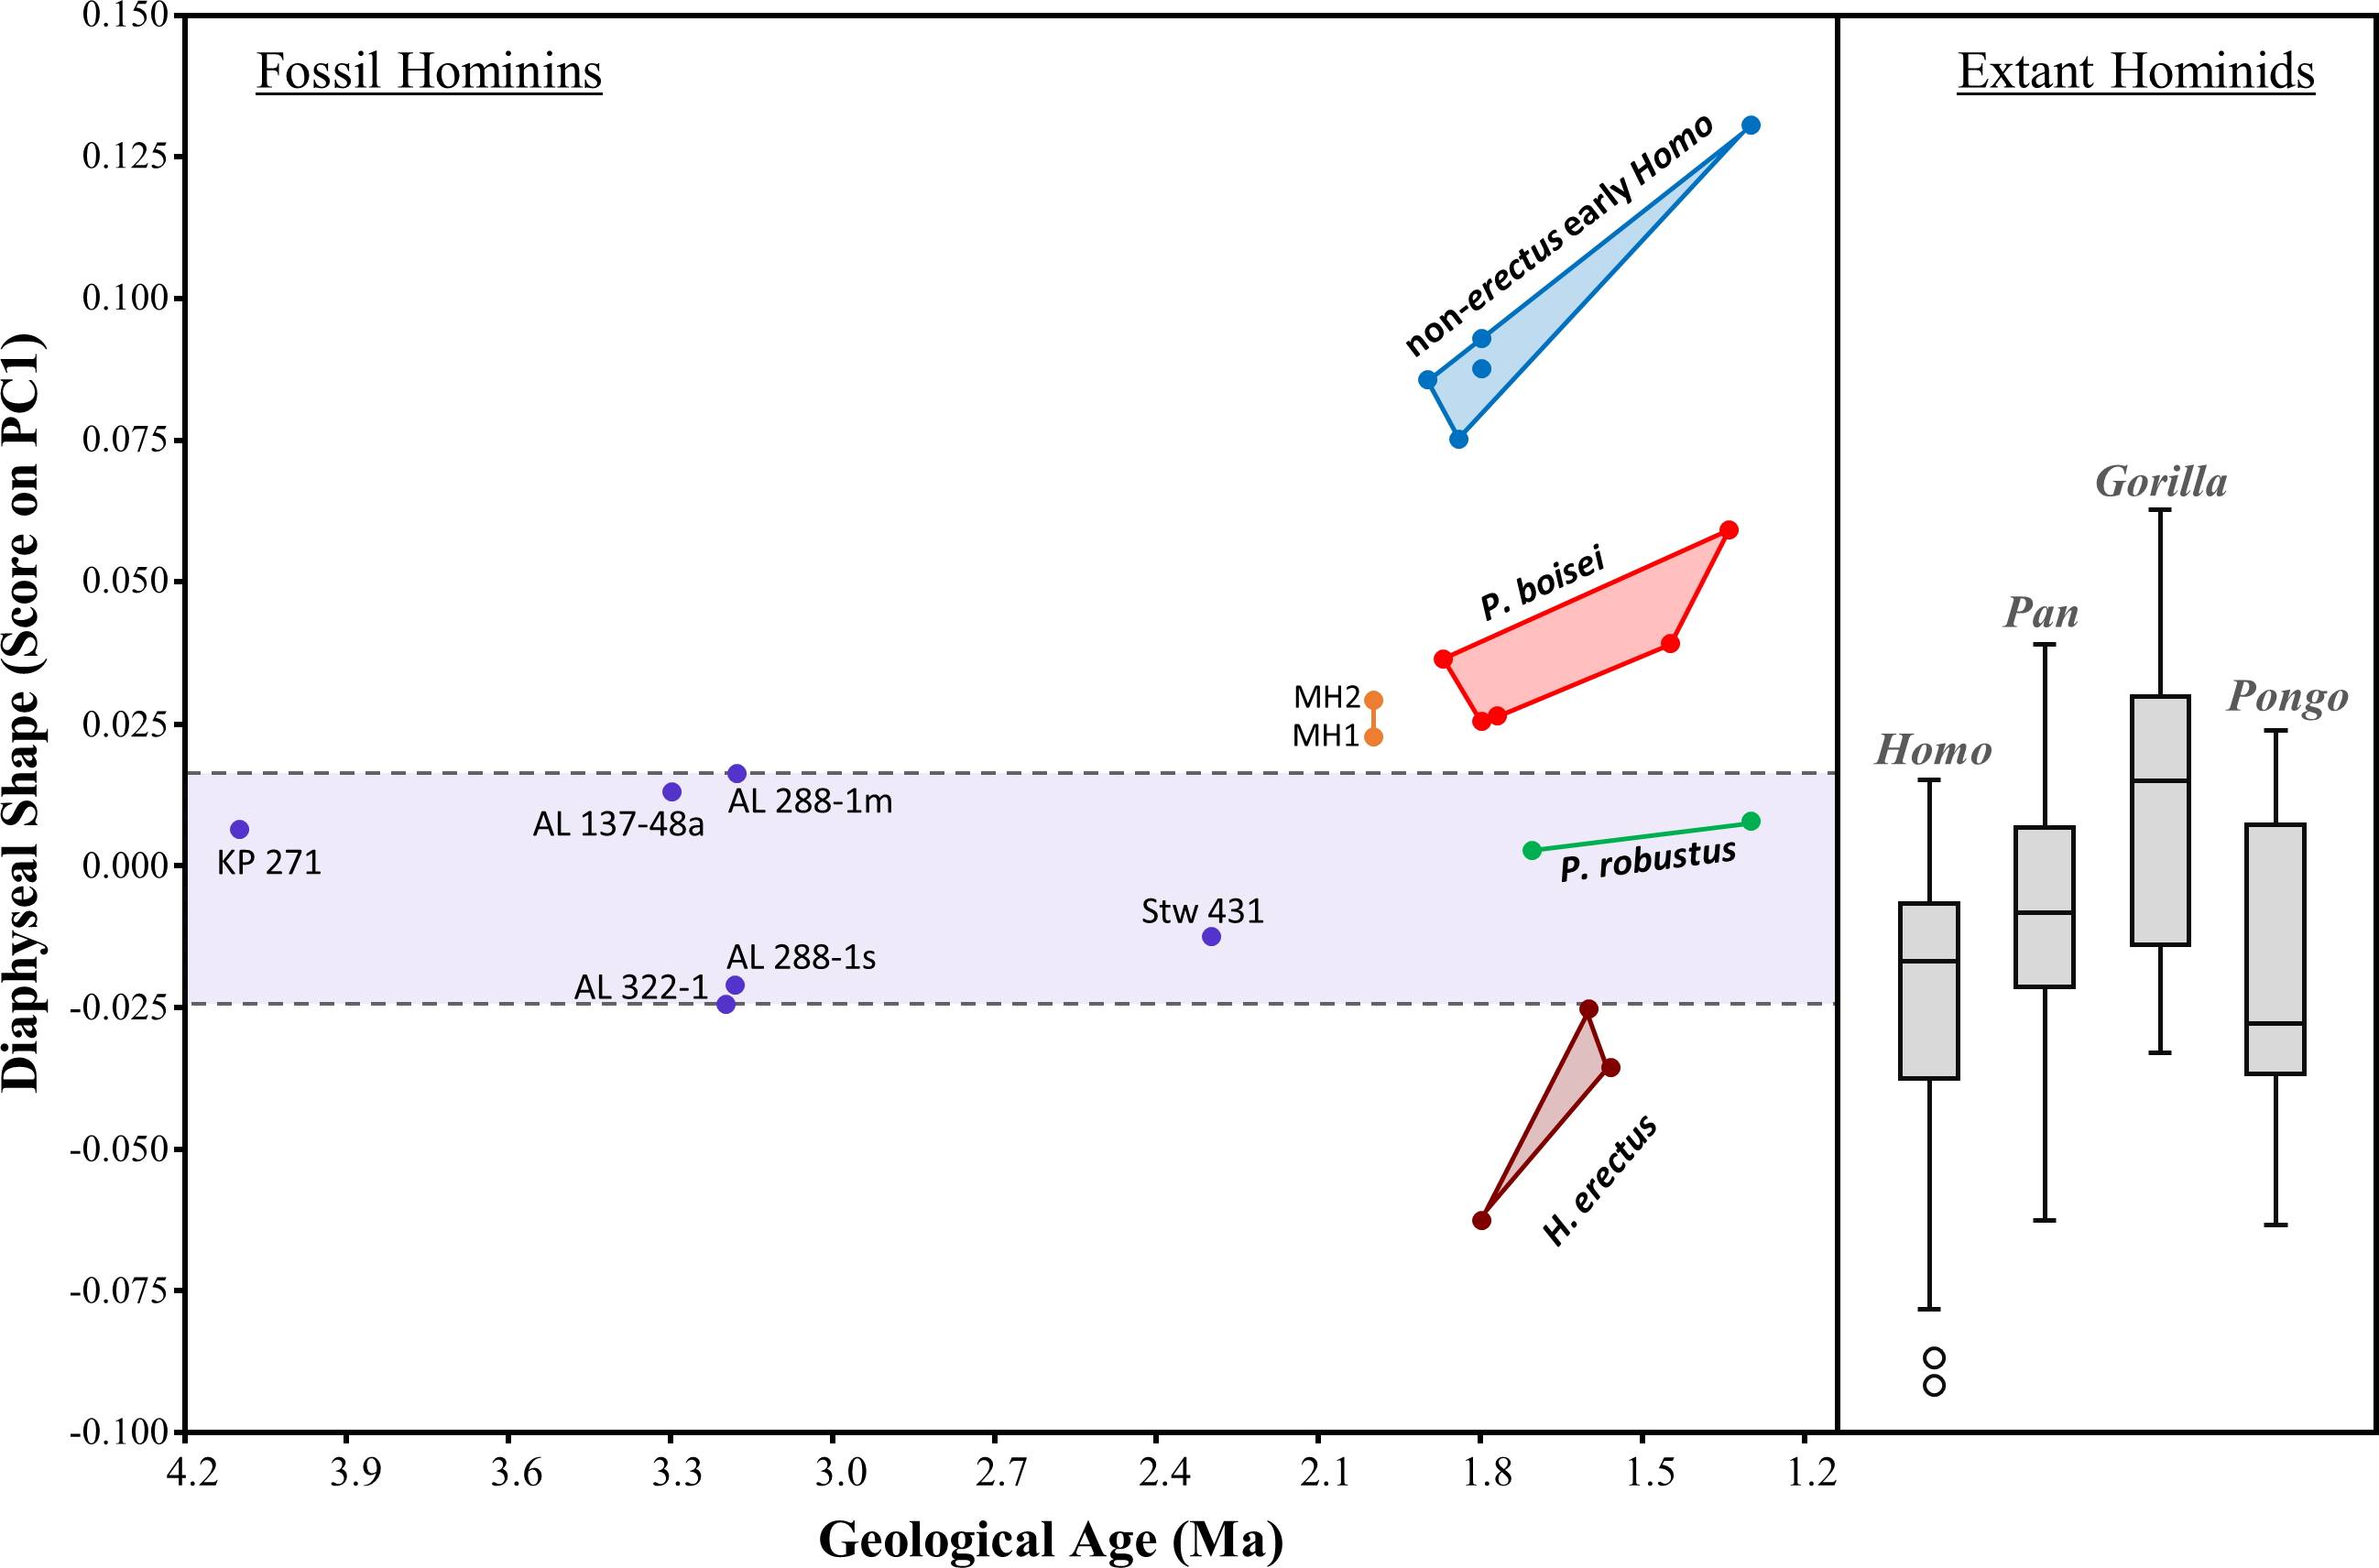
With respect to overall size of the cross section, the majority of fossils fall in the lower half of the H. sapiens range (Fig. 14). Exceptions among the Australopithecus specimens include the moderately large Au. africanus humerus (Stw 431) and the somewhat larger Au. anamensis humerus from Kanapoi (KNM-KP 271), both of which fall in the upper size range for modern humans. Most of the fossil Homo specimens are similar in size to those of smaller-bodied hominins, with the exception of KNM-ER 1808 (H. erectus). The size overlap between H. erectus and non-erectus early Homo indicates that the substantial shape differences between these groups are not allometric in nature. Within P. boisei, even the three smallest specimens fall in the upper half of the modern human size range, while the two largest specimens are beyond the range of modern humans and chimpanzees sampled here (and similar in size to small gorillas and large orangutans; not shown).
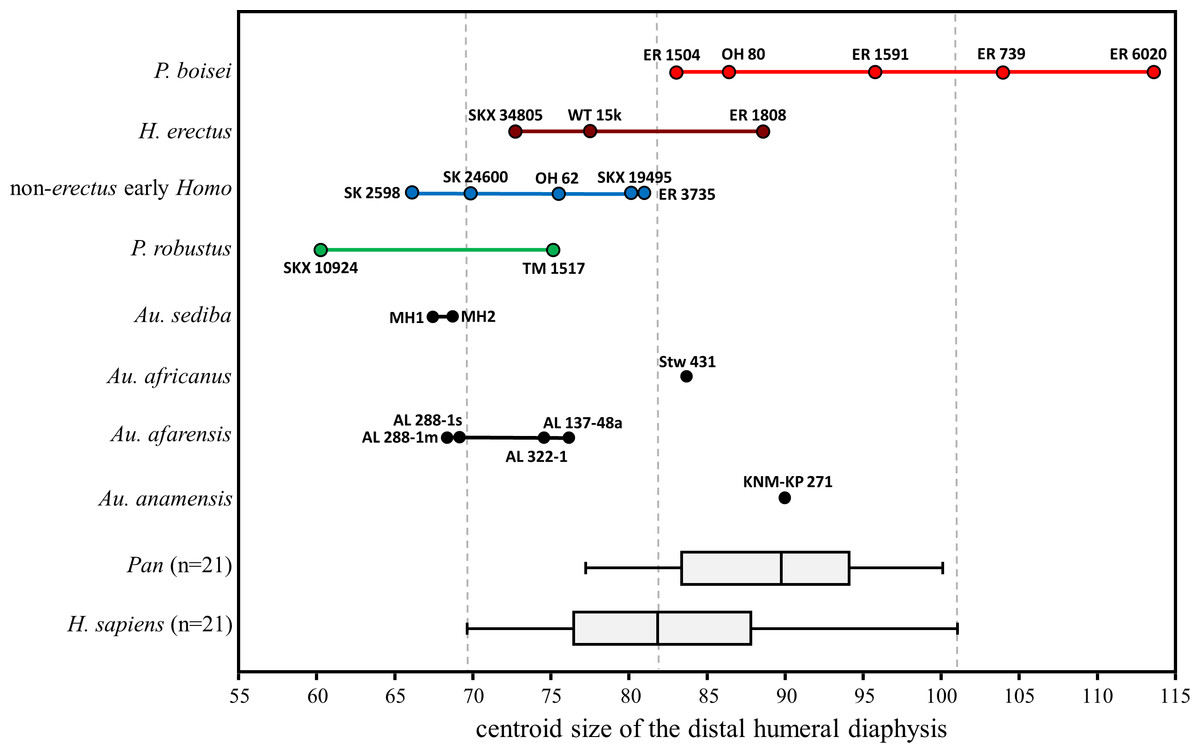
Figure 14: Cross-sectional size of the distal humeral diaphysis (base on centroid size).
Boxes for extant species contain 50% of the data (median at horizontal line) and ‘whiskers’ represent min./max. values. Gorilla and Pongo not shown due to their extreme size.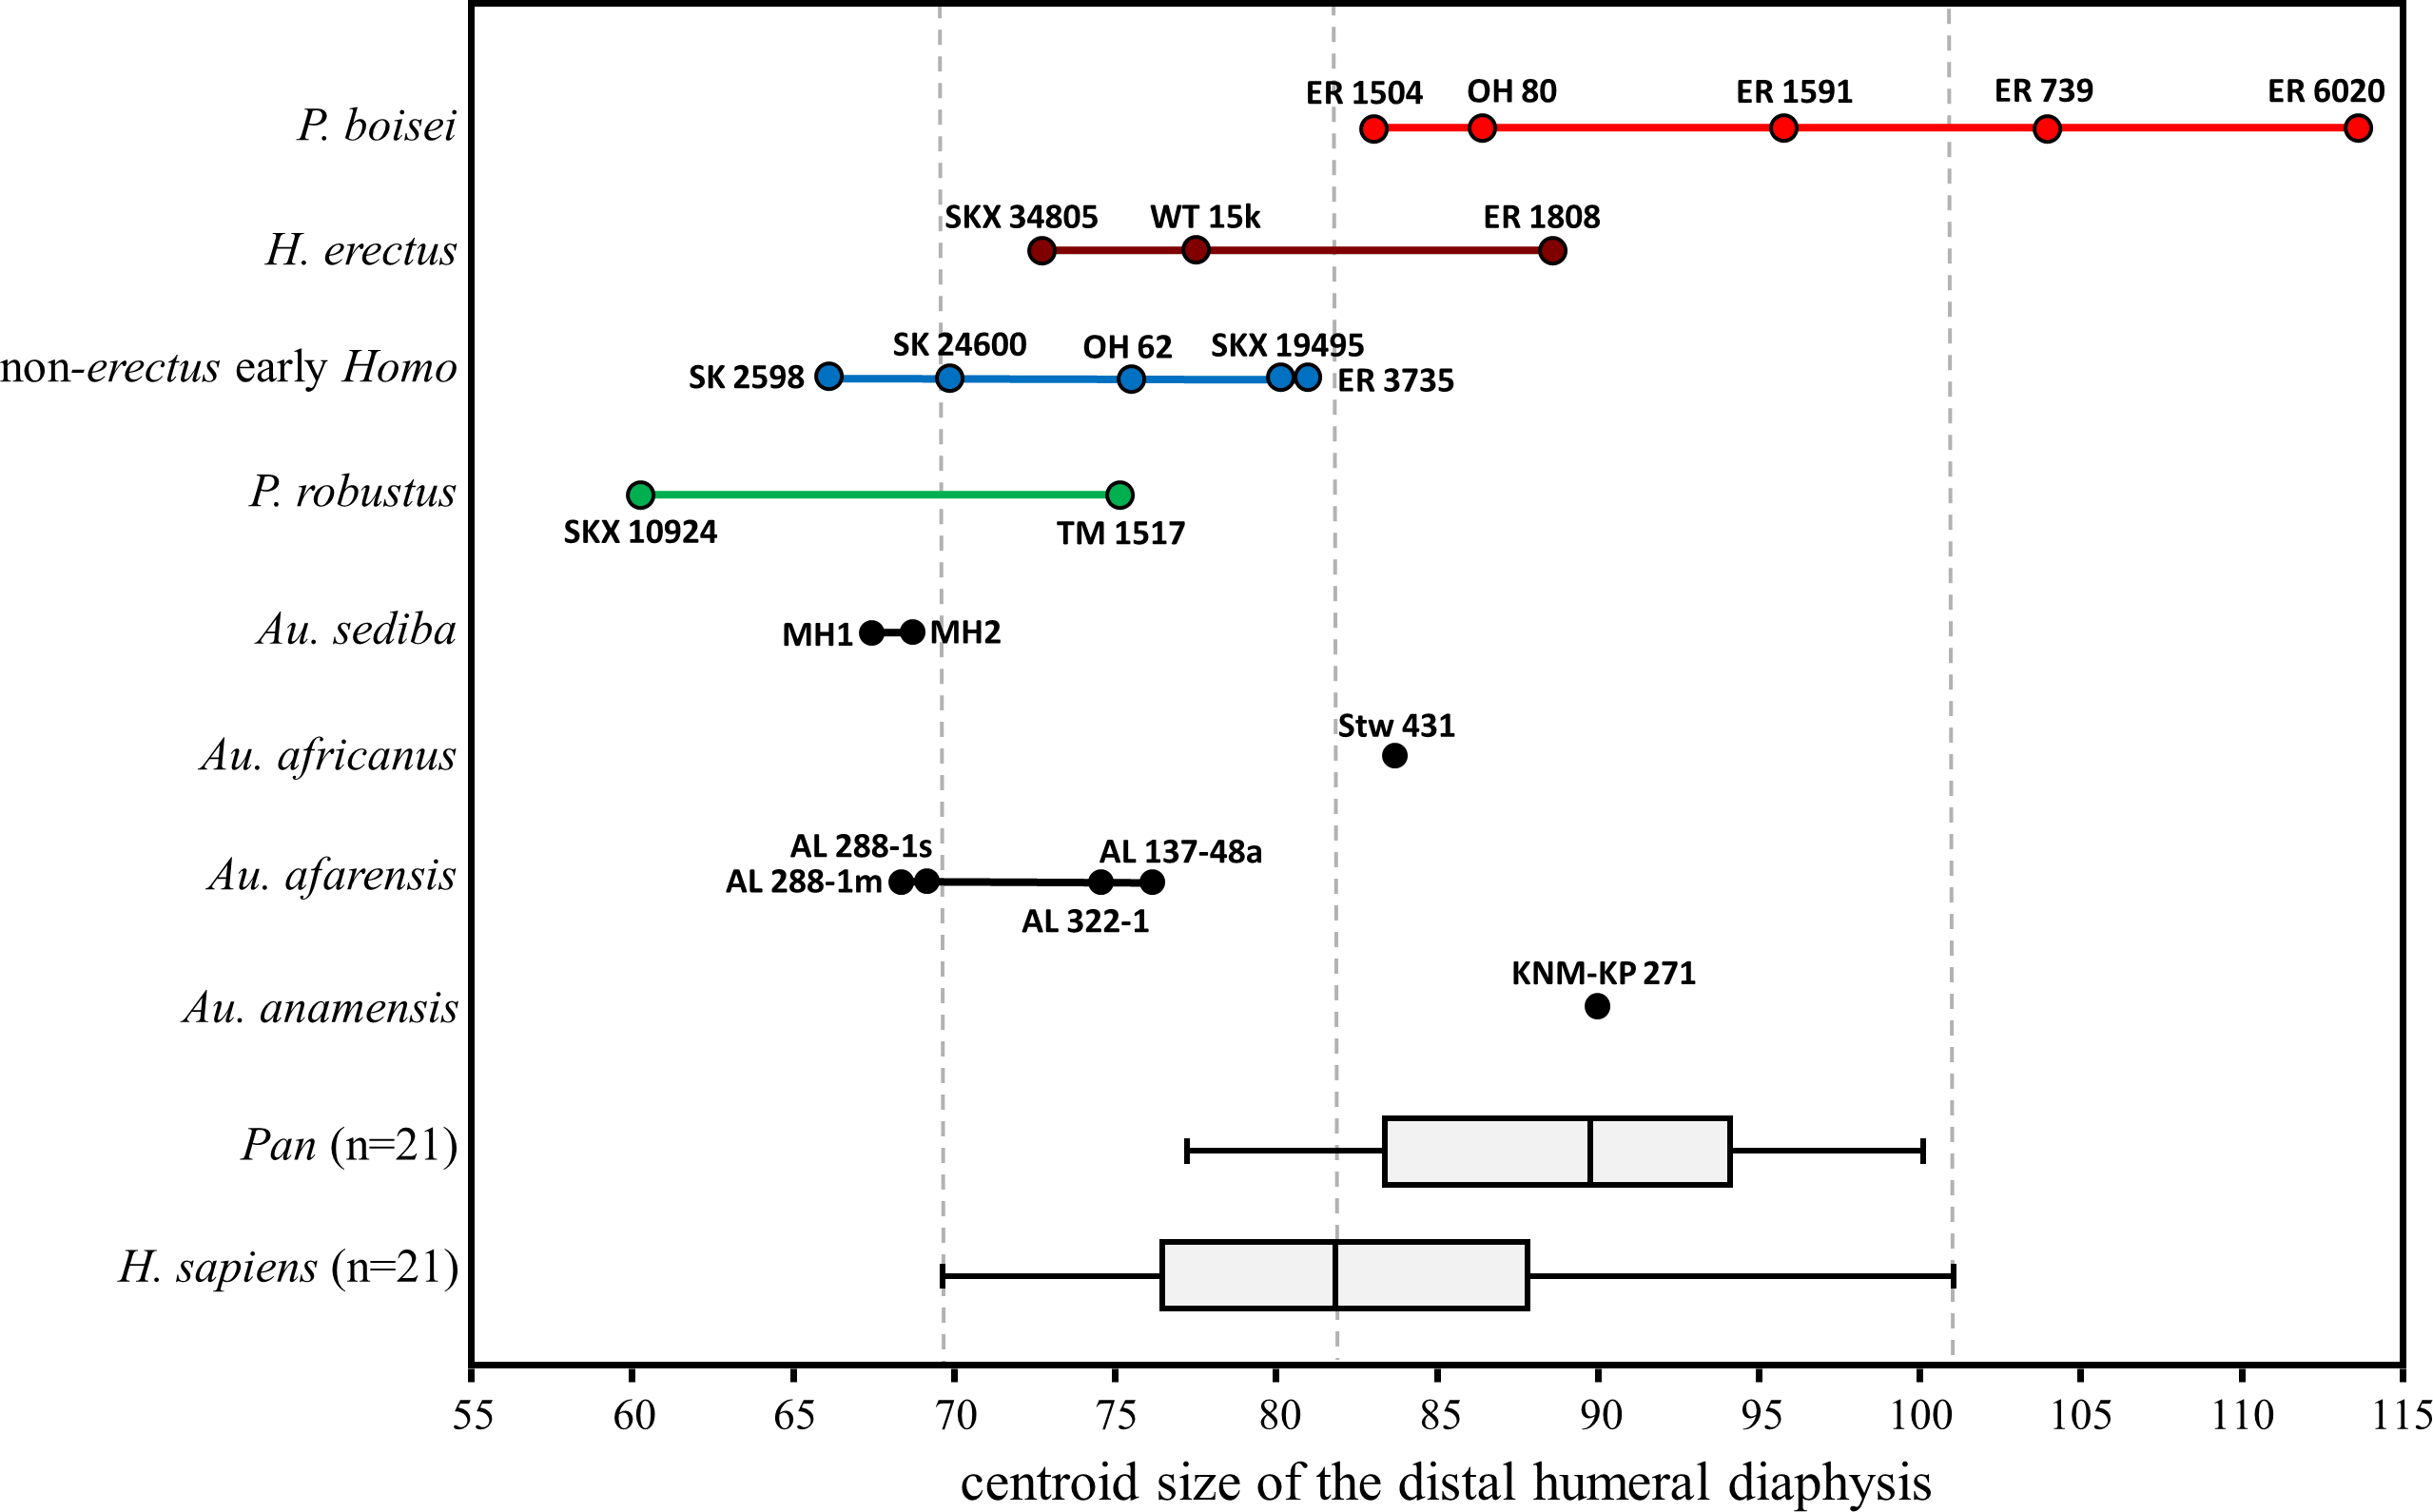
Discussion
In both southern and eastern Africa, the distal humeral diaphysis is useful for differentiating among Lower Pleistocene hominin taxa. In each region, diaphyseal shape variation indicates at least three distinct morphotypes (Paranthropus, Homo erectus, non-erectus early Homo) during the time period under study (c. 2-1 Ma), and does not reflect a simple dichotomy between Paranthropus and Homo. While the two species of Paranthropus are somewhat similar with respect to diaphyseal shape, the two Homo groups are distinctly different from one another, reflecting the presence of at least two postcranial morphotypes within early Homo (Ward et al., 2015). Overall, H. erectus exhibits a diaphyseal profile similar to modern humans, while specimens attributed here to non-erectus early Homo are characterized by a high degree of anteroposterior flattening (relative to mediolateral width) that is unusual among hominids. Shape differences between the two Homo groups are also apparent along the anterolateral surface, which is slightly concave in H. erectus, but slightly convex in non-erectus early Homo. Although P. boisei humeri are also unusually AP flattened, they exhibit a morphology that is intermediate in many ways between the two Homo extremes. On balance, the nine craniodentally unassociated humeral specimens examined here are best attributed as follows (also see Table 5): (1) Homo aff. habilis (SK 24600, SKX 19495, SK 2598), (2) Homo erectus (SKX 34805), (3) Paranthropus boisei (ER 739, 1504, 6020, 1591), (4) Paranthropus robustus (SKX 10924).
South Africa
The results of this study lend credence to previous claims that diaphyseal morphology can be used to identify early hominin humeri at Swartkrans (Susman, de Ruiter & Brain, 2001). Nonetheless, these results also support suggestions (based on elbow morphology; Lague, 2014) that the original taxonomic attributions of the Swartkrans humeri should be revised. Variation in diaphyseal morphology at Swartkrans suggests the presence of at least two species of early Homo, one with affinities to eastern African Homo habilis (“1813 group”; SK 24600, SK 19495, SK 2598), and one with affinities to Homo erectus (SKX 34805). Moreover, both distal articular and diaphyseal cross-sectional morphology indicate that SKX 10924 is best attributed to P. robustus, as it bears the greatest resemblance to TM 1517 (P. robustus holotype) in both anatomical regions. Although Susman, de Ruiter & Brain (2001) allocated SKX 34805 to Homo (in agreement with the present study), this suggestion was based on the assumption that all of the more rounded specimens from Swartkrans (including SKX 10924) represent Homo; this does not appear to be the case.
Two of the aforementioned Swartkrans humeri (SKX 10924, SKX 19495) derive from Member 3. Hence, although the particular species attributions proposed here for these specimens differ from previous attributions, the implications are the same: while none of the craniodental specimens from Member 3 have been attributed to Homo (Grine et al., 2009), the humeral evidence indicates that both Homo (at least one specimen) and Paranthropus are present in these deposits. The Member 3 deposits may therefore contain one of the latest-occurring examples of non-erectus early Homo in Africa (i.e., SKX 19495), depending upon the appropriate dating of this member (e.g., Balter et al., 2008; Herries, Curnoe & Adams, 2009; Sutton et al., 2009).
This study finds no morphological basis for differentiating the South African form of non-erectus early Homo from contemporaneous H. habilis in eastern Africa. Nevertheless, it should not be automatically assumed that the H. habilis specimens (ER 3735, OH 62) are conspecific with the similarly flattened Swartkrans specimens (SK 24600, SKX 19495, SK 2598). Studies based on craniodental material suggest that South African early Homo fossils may represent species (or a species lineage) not sampled in eastern Africa (Grine et al., 1993; Grine et al., 2009); this hypothesis is not refuted by the present results, particularly given that relatively homogeneous humeral morphology can be observed across multiple species of Australopithecus for both the elbow joint (Lague & Jungers, 1996; Lague, 2014) and the distal diaphysis. Hence, it is plausible that different species of non-erectus early Homo may also share similar humeral morphology. At this time, it is reasonable to refer to the South African members of the “non-erectus early Homo” group as H. aff. habilis.
Eastern Africa
In eastern Africa, the enigmatic humeri from Koobi Fora (KNM-ER 739, 1504, 6020, 1591) are best attributed to Paranthropus boisei, as has long been suspected for both ER 739 and ER 1504 since their original attributions to Australopithecus (Leakey, Mungai & Walker, 1972; Leakey, 1973). It is not particularly surprising that these specimens share similar diaphyseal morphology, since multiple studies have noted strong similarities among ER 739, 1504 and 6020 with respect to elbow joint morphology (Leakey, 1973; Senut, 1981c; Lague & Jungers, 1996; Lague, 2014; but see McHenry & Brown, 2008). KNM-ER 1591 has received less attention than the other Koobi Fora specimens, probably because it lacks most of its articular anatomy. Although it was originally attributed to Homo (Leakey, 1973), its status as a hominin has been questioned (Walker & Leakey, 1993); in fact, it has recently been listed in the Turkana Public Database as a carnivoran. Nevertheless, it does not resemble the humerus any known extant or fossil carnivoran (ME Lewis, pers.comm., 2015) and its contours are remarkably similar to those of KNM-ER 739 throughout the length of the diaphysis (most of which is preserved). Hence, KNM-ER 1591 and KNM-ER 739 are likely conspecific.
With respect to its distal diaphysis, the OH 80 P. boisei humerus was originally described as AP flat (ML broad) and therefore similar in shape to the “P. robustus” specimens of Susman, de Ruiter & Brain (2001; i.e., SK 2598, SK 24600, SKX 19495). Based on the present study, however, the specimens attributed by Susman and colleagues to P. robustus actually represent a form of non-erectus early Homo. In fact, Domínguez-Rodrigo et al. (2013) also note that the OH 80 humerus has a relatively greater AP dimension than the presumed “P. robustus” specimens. Although Domínguez-Rodrigo et al. (2013) surmise that this discrepancy might be due to sex differences (or comparisons of slightly different sections), their observations accord well with the results of the present study. Although OH 80 is relatively AP flattened compared to H. erectus and modern humans, it does, in fact, have a relatively greater AP dimension than humeri attributed here to non-erectus early Homo (including the “P. robustus” specimens of Susman, de Ruiter & Brain, 2001).
The intermediate degree of AP flattening observed for P. boisei is accompanied by a high degree of posterior surface convexity (particularly medially) that is apparent upon visual inspection (contrasting with the flatter posterior surface generally observed in Homo). The diaphyseal morphology of P. boisei noted here augments a list of anatomical features that render the humeri of this species fairly distinctive, including highly projecting lateral and medial epicondyles, a mediolaterally narrow zona conoidea, wide medial and lateral pillars, and a shallow olecranon fossa (Leakey, 1973; Senut, 1981c; Lague & Jungers, 1996). In addition, it appears that P. boisei had unusually large arms compared to both earlier and contemporaneous hominins, with the larger specimens exhibiting features either at the upper end (elbow joint; Lague, 2014) or beyond (distal humeral diaphysis) the size range of modern humans. Moreover, the OH 80 humerus is characterized by cortical bone that is considerably thicker than that of modern H. sapiens (Domínguez-Rodrigo et al., 2013), and the well-preserved diaphyses of both KNM-ER 739 and ER 1591 have extremely well-pronounced muscle markings. The body size range of P. boisei remains speculative, though it is clear from a number of specimens (i.e., KNM-ER 739, ER 6020, ER 1591, OH 80) that this species was characterized by extremely robust, powerful upper limbs. It is unknown whether the humeral strength of P. boisei is high relative to femoral strength (as demonstrated for H. habilis; Ruff, 2009), though the powerful upper limbs of P. boisei are consistent with frequent arboreal climbing.
As surmised by Lague & Jungers (1996), it is theoretically possible that one or more of the craniodentally unassociated Koobi Fora humeri represents H. rudolfensis (i.e., the “1470 group”; Antón, Potts & Aiello, 2014; Spoor et al., 2015) rather than P. boisei. Nonetheless, fossils attributed to H. rudolfensis are rare above the KBS Tuff (Antón, Potts & Aiello, 2014; Joordens et al., 2013), and other than KNM-ER 3735 (H. habilis), KNM-ER 1504 is the only Turkana specimen examined here that derives from below this level. Moreover, the strong similarity among the Koobi Fora humeri and the distinctive nature of both their articular and diaphyseal morphology suggests that they all belong to the same genus, if not the same species. Given that KNM-ER 739 is a good deal younger (c. 1.5 Ma) than any currently known H. rudolfensis, and that all of the Koobi Fora specimens resemble OH 80 with respect to diaphyseal shape, it is most likely that these specimens solely represent P. boisei. An alternative (but less likely) possibility is that, in contrast to all other known forms of early Homo (H. habilis, H. erectus, South African non-erectus Homo), the humeri of H. rudolfensis are indistinguishable from those of P. boisei. Further light on this issue awaits the discovery of postcranial remains that can be definitively linked to H. rudolfensis by virtue of craniodental association.
Additional implications of this study
The work presented here solves a small piece of the postcranial puzzle that has long impeded progress in reconstructing the evolution and functional morphology of Lower Pleistocene hominins. As originally suggested by the work of Senut (1981a), humeral diaphyseal morphology can facilitate the taxonomic identification of specimens lacking associated diagnostic craniodental remains.
The results presented here have implications that extend beyond the particular set of fossil humeri under examination. For example, AP diaphyseal flattening has previously been observed for KNM-ER 739 in comparison to Gomboré IB 75944 (Melka Kunturé; Chavaillon et al., 1977; Senut, 1981a). Given the nature of diaphyseal variation observed here, the Melka Kunturé humerus, originally attributed to Homo sp. (Chavaillon et al., 1977), therefore most likely represents H. erectus. In addition, two of the craniodentally unassociated humeri examined here are associated with additional postcranial elements. The SK 24600 humerus is thought to belong to the same individual as a proximal radius (SK 24601; Susman, de Ruiter & Brain, 2001). The results presented here therefore imply that the morphology of the SK 24601 radius is characteristic of non-erectus early Homo (a proposition that merits further testing via morphometric comparisons with other available proximal radii; e.g., OH 80-11, OH 62, KNM-ER 3735, KNM-ER 1500, SK 18b, SKX 3699). In addition, the KNM-ER 1504 humerus (herein attributed to P. boisei) is associated with two partial femora (ER 1503, ER 1505) thought to represent the same individual (Leakey, 1973). The ER 1503 proximal femur bears a primitive morphology common among australopiths (and Orrorin tugenensis), such as a small femoral head, a long and anteroposteriorly narrow femoral neck, low neck-shaft angle, and broad proximal shaft (Richmond & Jungers, 2008; Harmon, 2009; Richmond & Jungers, 2012). Hence, the results of the present study confirm that typical australopith femoral morphology also characterized P. boisei.
Distal humeral diaphyseal shape variation among Lower Pleistocene hominins does not resemble variation observed among extant great apes and humans, making it difficult to draw functional inferences based on comparative anatomy. The similarities in diaphyseal anatomy between Homo and Pongo are particularly intriguing given obvious differences in habitual use of the upper limb. Although long bone cross-sectional properties are known to be responsive to mechanical loadings during life (Ruff, Holt & Trinkaus, 2006; Ruff, 2009), the extent to which distal humeral diaphyseal shape responds to habitual limb use (or is phylogenetically constrained) is unclear. Strongly marked entheseal changes associated with muscles that cross the shoulder have been correlated with differences in humeral diaphyseal shape (and diaphyseal rigidity) in the mid-proximal region, though a similar phenomenon has not been observed in the distal diaphysis (Ibáñez-Gimeno et al., 2013). It may be the case that distal diaphyseal shape is largely unaffected by age-related or activity-related variation in cross-sectional properties. Although relative cortical thickness of the mid-distal shaft of the KNM-WT 15000 humerus is much lower than that of KNM-ER 1808T (likely due to its subadult status; Ruff, 2008), the two conspecific specimens are very similar in distal diaphyseal shape. In fact, the same can also be said for MH1 and MH2, which also represent conspecific subadult and adult individuals, respectively. Hence, limited evidence would suggest that, at least by a certain age, skeletally immature individuals have a similar distal diaphyseal shape to that of adults, even if differences exist in relative cortical thickness (and therefore diaphyseal strength).
The shape of the diaphyseal section sampled here has the potential to be affected by the salience of the lateral supracondylar ridge, which could influence total mediolateral width as well as the lateral profile of the section (as is particularly the case for chimpanzees). On the other hand, the mediolaterally widest fossil specimens in this study (non-erectus early Homo) have fairly rounded lateral borders and are not characterized by a strongly developed lateral ridge, suggesting that variation in AP/ML width among fossil hominins is not simply being driven by variation in the lateral projection of this feature.
It is plausible that distal diaphyseal shape variation is at least partly related to different patterns of force transmission through the distal region of the humerus. The typical location of maximum transarticular forces would be expected to affect the placement of the anteroposteriorly thickest region of the distal diaphysis (which, among hominids, is typically located proximal to some part of the trochlea). In this regard, it is reasonable to surmise that aspects of articular morphology will be correlated with aspects of distal diaphyseal shape, since both should reflect typical forces through the elbow. For example, greater force through the medial side of the humeroulnar joint (perhaps due to powerful musculature arising from the medial epicondyle) might necessitate both an increase in the surface area of the medial trochlea (and therefore the size of medial trochlear crest), and the addition of bone on the medial pillar, thereby increasing relative mediolateral width of the diaphysis. Future investigations will explore the functional relationships between joint morphology, diaphyseal shape, and the power/leverage of forearm muscles originating from the medial and lateral epicondyles.
Although incorporation of additional fossil humeri may expand the variation observed within Australopithecus, present evidence indicates that the diaphyseal shape of this genus is characterized by a pattern of long-term stability. Among species of Australopithecus, only the late-occurring Au. sediba exhibits morphology that is unusual (and unique among hominids). In addition, the distal diaphyseal morphology of P. robustus resembles that of non-sediba Australopithecus. A pattern of long-term postcranial homogeneity among australopiths is not unique to the humeral diaphysis, as it has also been observed for elbow joint morphology (Lague & Jungers, 1996; Lague, 2014) and for proximal femoral morphology (Richmond & Jungers, 2008; Richmond & Jungers, 2012). It is worth noting, however, that although the proximal femur of P. boisei does not appear to appreciably differ from that of other australopiths (based on KNM-ER 1504), the distal humerus of P. boisei departs from the general australopith pattern for both joint morphology and diaphyseal cross-sectional shape.
With respect to distal humeral diaphyseal morphology, the general similarities observed among Australopithecus (non-sediba), P. robustus, and multiple extant hominids suggest that non-sediba Australopithecus morphology represents a primitive condition relative to the other fossil hominins. The marked variation in diaphyseal morphology observed among post-Australopithecus hominin species may reflect an increased diversity of forelimb use in the Lower Pleistocene, perhaps associated with the more pronounced habitat/resource heterogeneity associated with this time period (Antón, Potts & Aiello, 2014). The unique diaphyseal morphology associated with non-erectus early Homo presents a particularly striking contrast to the more modern-looking diaphysis of H. erectus, further emphasizing observations of postcranial diversity within early Homo (e.g., Ruff, 2009; Ward et al., 2015), as well as previous descriptions of early Homo diversification as a time of “morphological experimentation” (Antón, Potts & Aiello, 2014). Among the fossil species examined here, H. erectus shows the greatest similarities to H. sapiens, perhaps indicating a shift to a more modern pattern of upper limb use compared with earlier and contemporaneous hominin species (i.e., increased manipulatory skill in a fully committed terrestrial biped). The unique morphology of Homo habilis is more difficult to interpret without further investigation , though this species may be unusual among early hominins in the use of its upper limbs for both primitive stone tool production and (according to some researchers) habitual arboreal climbing behavior. A more complete understanding of upper limb function in early hominin taxa awaits the results of ongoing research.
Conclusions
In both southern and eastern Africa, the distal humeral diaphysis is useful for differentiating among early (c. 2-1 Ma) hominin taxa (i.e., Paranthropus, H. erectus, non-erectus early Homo). While previous claims that diaphyseal morphology can be used to identify taxa at Swartkrans (Susman, de Ruiter & Brain, 2001) are supported, the original taxonomic attributions of the Swartkrans humeri should be revised (as is also suggested by distal articular anatomy; Lague, 2014). For example, those specimens previously referred to P. robustus (SK 2598, SKX 19495, SK 24600) should be allocated to a form of non-erectus early Homo (e.g., H. aff. habilis), while evidence from both the elbow joint and the distal diaphysis indicates that SKX 10924 belongs to P. robustus. The enigmatic isolated humeri from Koobi Fora (KNM-ER 739, 1504, 6020, 1591) all resemble OH 80 and are best attributed to P. boisei. Overall, the diaphysis of both P. boisei and non-erectus early Homo is unusually AP flattened (ML broad) among both fossil hominins and extant hominids, though non-erectus Homo humeri are most extreme in this regard and markedly different from the more modern human-like specimens attributed to H. erectus.