
The expression characteristics and prognostic roles of autophagy-related genes in gastric cancer
- Published
- Accepted
- Received
- Academic Editor
- Vladimir Uversky
- Subject Areas
- Bioinformatics, Gastroenterology and Hepatology, Oncology, Medical Genetics
- Keywords
- Autophagy, Gastric cancer, Gene expression, TCGA, ATG4
- Copyright
- © 2021 Wang et al.
- Licence
- This is an open access article distributed under the terms of the Creative Commons Attribution License, which permits unrestricted use, distribution, reproduction and adaptation in any medium and for any purpose provided that it is properly attributed. For attribution, the original author(s), title, publication source (PeerJ) and either DOI or URL of the article must be cited.
- Cite this article
- 2021. The expression characteristics and prognostic roles of autophagy-related genes in gastric cancer. PeerJ 9:e10814 https://doi.org/10.7717/peerj.10814
Abstract
Background
Autophagy is an evolutionally highly conserved process, accompanied by the dynamic changes of various molecules, which is necessary for the orderly degradation and recycling of cellular components. The aim of the study was to identify the role of autophagy-related (ATG) genes in the occurrence and development of gastric cancer (GC).
Methods
Data from Oncomine dataset was used for the differential expression analysis between cancer and normal tissues. The association of ATG genes expression with clinicopathologic indicators was evaluated by The Cancer Genome Atlas (TCGA) database and Gene Expression Omnibus (GEO) database. Moreover, using the TCGA datasets, the prognostic role of ATG genes was assessed. A nomogram was further built to assess the independent prognostic factors.
Results
The expression of autophagy-related genes AMBRA1, ATG4B, ATG7, ATG10, ATG12, ATG16L2, GABARAPL2, GABARAPL1, ULK4 and WIPI2 showed differences between cancer and normal tissues. After verification, ATG14 and ATG4D were significantly associated with TNM stage. ATG9A, ATG2A, and ATG4D were associated with T stage. VMP1 and ATG4A were low-expressed in patients without lymph node metastasis. No gene in autophagy pathway was associated with M stage. Further multivariate analysis suggested that ATG4D and MAP1LC3C were independent prognostic factors for GC. The C-index of nomogram was 0.676 and the 95% CI was 0.628 to 0.724.
Conclusion
Our study provided a comprehensive illustration of ATG genes expression characteristics in GC. Abnormal expressions of the ubiquitin-like conjugated system in ATG genes plays a key role in the occurrence of GC. ATG8/LC3 sub-system may play an important role in development and clinical outcome of GC. In the future, it is necessary to further elucidate the alterations of specific ATG8/LC3 forms in order to provide insights for the discovery, diagnosis, or targeting for GC.
Introduction
Autophagy is an evolutionally highly conserved process, which is necessary for the orderly degradation and recycling of cellular components (Yang et al., 2020). In normal cells, autophagy keeps low-level constitutive function. Basal autophagy plays an important role in maintaining homeostatic control and elimination of unfavorable proteins. Its activity can be accelerated by a variety of cellular stressors including nutrient starvation, DNA damage, and organelle damage. Autophagy is closely related to the occurrence and treatment of tumors (Rahman et al., 2020). Recently, the paradoxical roles of autophagy in tumor suppression and tumor promotion have been widely observed. As a physiological quality control process, autophagy exerts a cytoprotective effect to suppress cancer development by removing damage that leads to aberrant mutations. On the other hand, as cancer progresses, starving and oxidative stress situation can active autophagy to fulfill the high metabolic need of cancer cells (Mathew, Karantza-Wadsworth & White, 2007).
The process of autophagy is accompanied by the dynamic changes of various molecules. Identification of the autophagy-related biomarkers will contribute to improving diagnosis and treatment of cancers. Autophagy is executed by a set of autophagy-related (ATG) genes, which have been investigated extensively in yeast. Although the discovery of ATG genes greatly advanced the understanding of autophagy, the function and mechanisms involved in ATG genes need to be further explored in mammalian. Recently, several studies have investigated the association of ATG genes and cancers. By activating ATG6-mediated autophagy, the down-regulation of microRNA-30a increases the chemoresistance of osteosarcoma cells, thereby inhibiting cell proliferation and invasion (Xu et al., 2016). Upregulation of UCA1 inhibits cell proliferation, migration, invasion, and drug resistance via ATG7-mediated autophagy (Wu et al., 2019). The methyltransferase MGMT inhibits the expression of ATG4B, thereby inhibiting autophagy and reducing the chemosensitivity of cisplatin in gastric cancer (GC) (Lei et al., 2020). Moreover, comprehensive study of all ATG genes has been conducted in breast, head neck and kidney carcinoma (Deng et al., 2018; Pei et al., 2018).
GC is the fourth most common cancer and the second leading cause of cancer death in the world (Van Cutsem et al., 2016). The incidence is mainly related to diet, lifestyle, genetic predisposition, family history, treatment and medical conditions, infections, demographic characteristics, occupational exposures and ionizing radiation (Yusefi et al., 2018). Abnormal expression of ATG genes may lead to the dysregulation of autophagy and tumorigenesis. However, the diagnostic and prognostic values of ATG genes have not been fully realized in GC. Since large-scale expression data is available, it is feasible to display an overview of ATG genes from the perspective of expression characteristics and prognostic role in GC. In the current study, we performed systematic analysis by using available datasets of ONCOMINE and The Cancer Genome Atlas (TCGA), in order to evaluate the differential expression of ATG genes and their associations with clinicopathological parameters and prognosis of GC. Our data may provide a new understanding of the autophagy-related mechanism in gastric carcinogenesis.
Materials & Methods
Autophagy-related genes selection
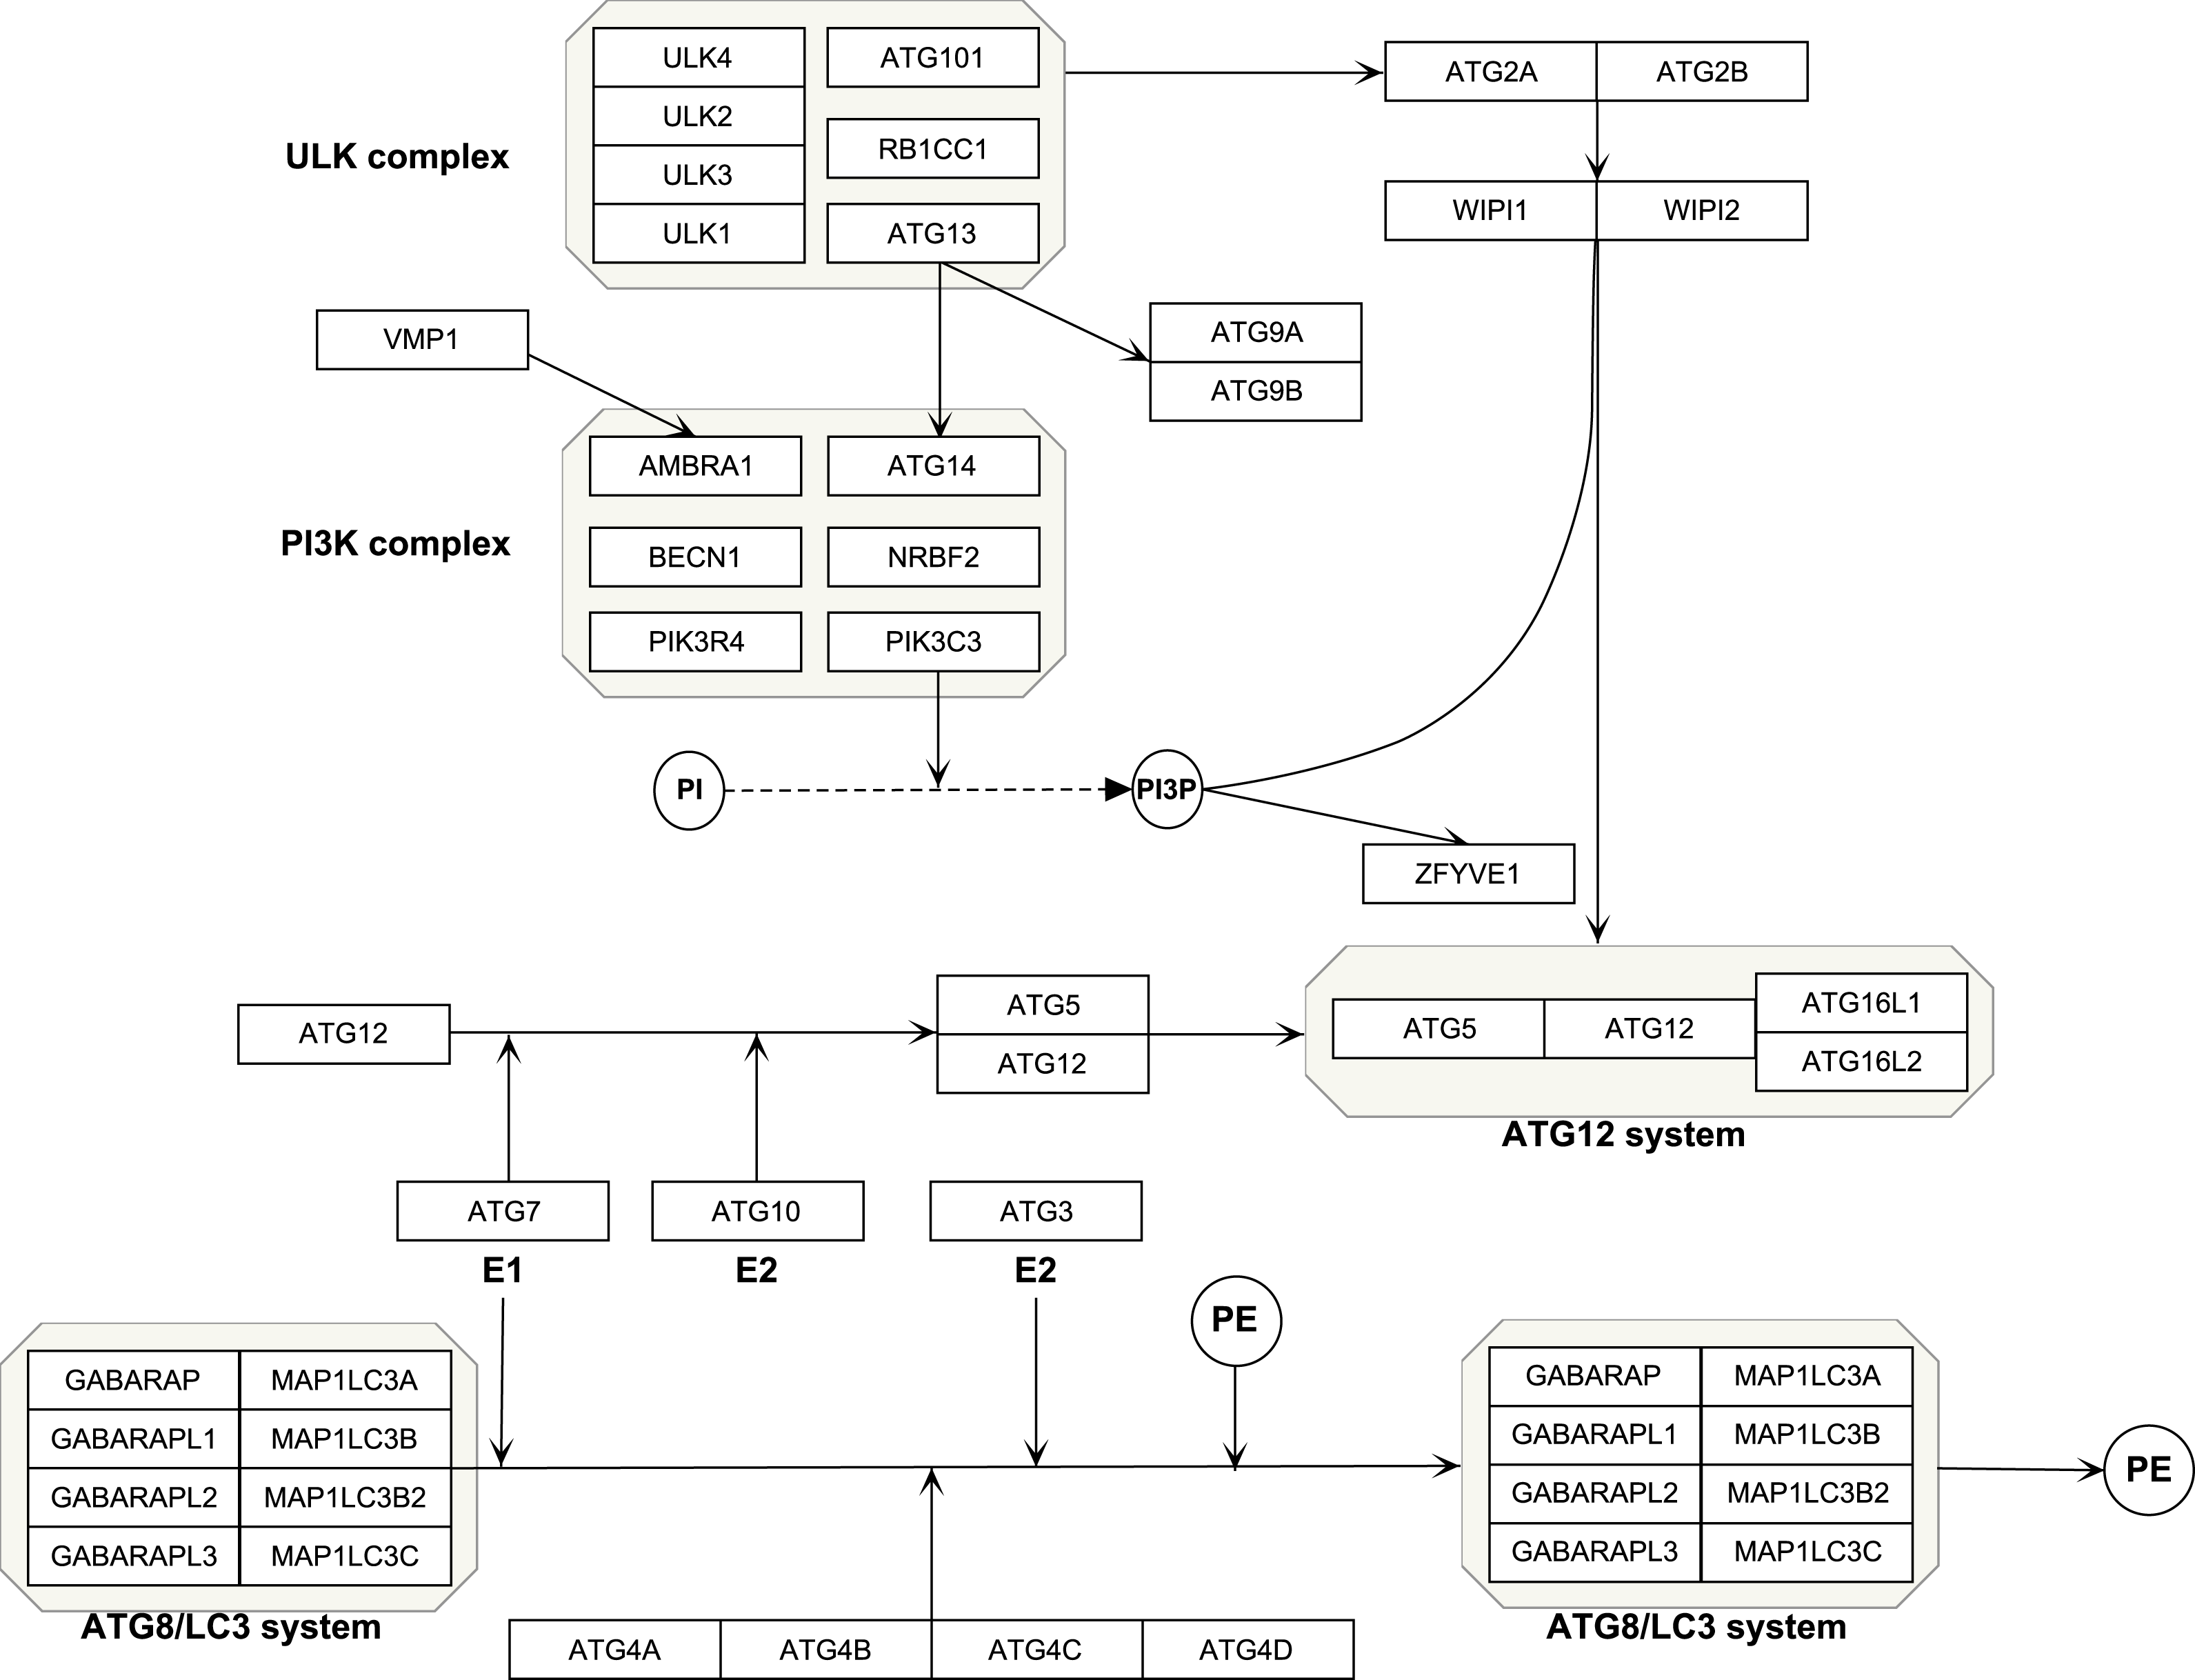
The Kyoto Encyclopedia of Genes and Genomes (KEGG, https://www.kegg.jp/) is an online tool for analysis of the gene function (Kanehisa et al., 2020). Reactome (https://reactome.org/) is a bioinformatics resource for visualization, interpretation and analysis of pathways (Jassal et al., 2020). Using the two datasets, we selected the genes in autophagy pathways as ATG genes, which composed four functional units including the ULK protein complex, Beclin-1/PI3K complex, ubiquitin-like conjugation system and other genes (Mizushima, Yoshimori & Ohsumi, 2011). All the isoforms of a gene were included, such as ATG4A, ATG4B, ATG4C and ATG4D. A total of 40 genes were selected. PathVisio (Version:3.3.0, https://pathvisio.github.io/) was used to visualize the autophagy genes (Kutmon et al., 2015). which composed four functional units including ULK complex, PI3K complex, ubiquitin-like conjugation system and other genes (Table 1 and Fig. 1).
| Gene symbol | Aliases | Function | |
|---|---|---|---|
| ULK complex | ULK1/2/3/4 | ATG1A/B/C/D | Acts upstream of PIK3C3 to regulate the formation of autophagophores |
| ATG101 | C12orf44 | Stabilizes ATG13, protecting it from proteasomal degradation. | |
| ATG13 | KIAA0652 | Essential for autophagosome formation | |
| RB1CC1 | ATG17 | Direct interaction with Atg16L1 | |
| PI3K complex | BECN1 | ATG6 | Acts as core subunit of the PI3K complex |
| PIK3R4 | VPS15 | Involved in regulation of degradative endocytic trafficking | |
| PIK3C3 | VPS34 | Catalytic subunit of the PI3K complex | |
| NRBF2 | COPR | Modulated ATG14 protein | |
| ATG14 | ATG14L | Plays a role in autophagosome formation and MAP1LC3/LC3 conjugation to phosphatidylethanolamine | |
| AMBRA1 | DCAF3 | Interacts with becn1 | |
| ubiquitin-like conjugating system | ATG12 | APG12 | Conjugation with ATG5 |
| ATG5 | APG5 | Functions as an E1-like activating enzyme | |
| ATG16L1/L2 | ATG16A/B | Interacts with ATG12-ATG5 to mediate the conjugation of phosphatidylethanolamine (PE) to LC3 | |
| ATG3 | APG3 | E2 conjugating enzyme | |
| ATG4A/B/C/D | APG4A/B/C/D | Cleaves the C-terminal amino acid of ATG8 family proteins to reveal a C-terminal glycine | |
| ATG7 | APG7 | E1-like activating enzyme | |
| ATG10 | APG10 | E2-like enzyme | |
| GABARAP/L1/L2/L3 | ATG8A/B/C/D | Ubiquitin-like modifier | |
| MAP1LC3A/B/B2/C | ATG8E/F/G/J | Ubiquitin-like modifier | |
| others | WIPI1/2 | ATG18A/B | Functions upstream of the ATG12-ATG5-ATG16L1 complex and LC3, and downstream of the ULK1 and PI3-kinase complexes |
| ATG9A/B | APG9L1/L2 | Transmembrane protein | |
| ATG2A/B | / | Required for both autophagosome formation | |
| ZFYVE1 | DFCP1 | PI3P-binding FYVE-containing protein | |
| VMP1 | EPG3, TANGO5, TMEM49 | Plays a role in the initial stages of the autophagic process through its interaction with BECN1 |
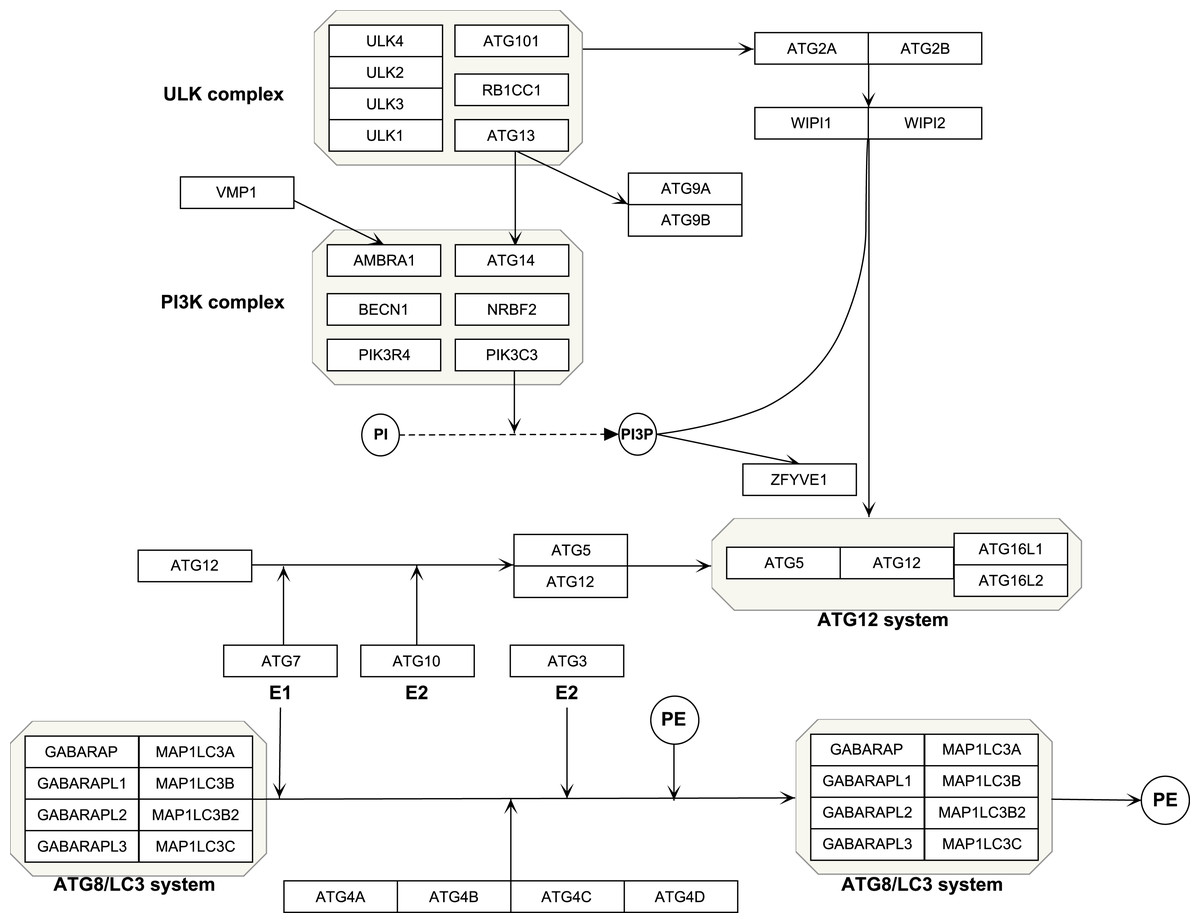
Figure 1: Schematic of autophagy pathway.
Differential gene expression analysis by Oncomine
By consulting the public data in Oncomine (https://www.oncomine.org/resource/login.html) (Rhodes et al., 2004), a powerful online database with 715 sub datasets and 86,733 samples, we established and logged in an Oncomine account, and input all of 40 ATG genes (gene symbols were listed in Table 1) to analyze their differential expression at transcription level in GC and different Lauren types. Combination of P-value <0.05 and fold change >2 was identified as significant difference in gene expression.
Correlation analysis of ATG genes expression and clinicopathological parameters from TCGA and GEO datasets
TCGA is a public database that contains the data of genomic expressions and the clinical features in 33 types of cancers (Tomczak, Czerwinska & Wiznerowicz, 2015). The gene expression and clinicopathological information of GC were downloaded from TCGA data portal (https://portal.gdc.cancer.gov/projects/). R was performed to normalize the expression data. The patients’ TNM stage, T, N and M (Nagtegaal et al., 2020) were considered as the clinical parameters.
Verification of the differences of gene expression
The GSE62254 dataset was a 300 samples microarray profile tested by the Asian Cancer Research Group (ACRG) (Cristescu et al., 2015). Using GSE62254, we verified the differences of gene expression identified from TCGA datasets.
Statistical analysis
All statistical analyses were performed by R 3.14 (http://www.r-project.org/) and the package of rms. Student’s t-tests was used to analyze the differences between cancer samples and normal tissues, of which the criterion is p-value <0.01 and fold change >2.0. The association between the ATG genes expressions and clinical features was accessed by Pearson X2 test. The correlation between ATG genes expressions and overall survival time was evaluated by Kaplan–Meier method and compared by log-rank test. Univariate and multivariate Cox proportional hazard regression models were used to recognize the independent prognostic factors. Based on the multivariate Cox regression models, a nomogram was formulated together with all the independent prognostic genes. The concordance index (C-index), which is similar to the area under the receiver operating characteristic (ROC), was used to evaluate the nomogram. P < 0.05 were considered significant difference.
Results
Differential expression of ATG genes in GC
By the Oncomine analysis, there were 10 genes of 40 ATG genes with significantly differential expression between GC and normal samples, which were named as differentially expressed genes (DEGs) (Fig. 2). Seven DEGs were belong to the ubiquitin-like conjugating system, among them ATG4B, ATG12 and ATG16L2 were significantly up-regulated in GC, while ATG10, GABARAPL2 and GABARAPL1 expressions were down-regulated in GC. As for ATG7, the expression was uncertain. ULK4, belonging to the ULK complex, was found down-regulated in GC. While AMBRA1, a member of the PI3K complex, was highly expressed in GC. As a connection between PI3K complex, ULK complex and ATG12 system, WIPI2 showed higher expression in cancer tissue.
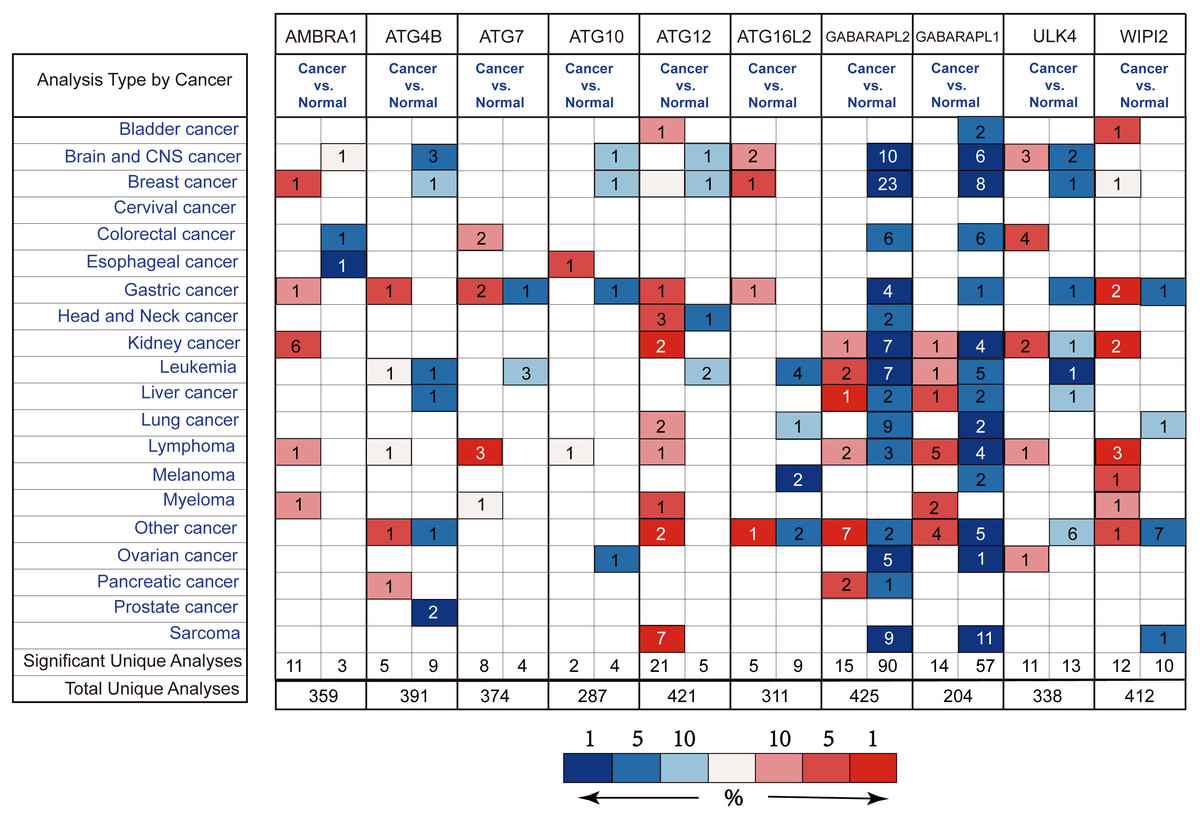
Figure 2: Different ATGs mRNA expression in different tumor types.
This graphic showed the numbers of datasets with statistically signifcant mRNA overexpression (red) or downexpression (blue) of the target gene (cancer vs. normal tissue). Cell color is determined by the best gene rank percentile for the analyses within the cell.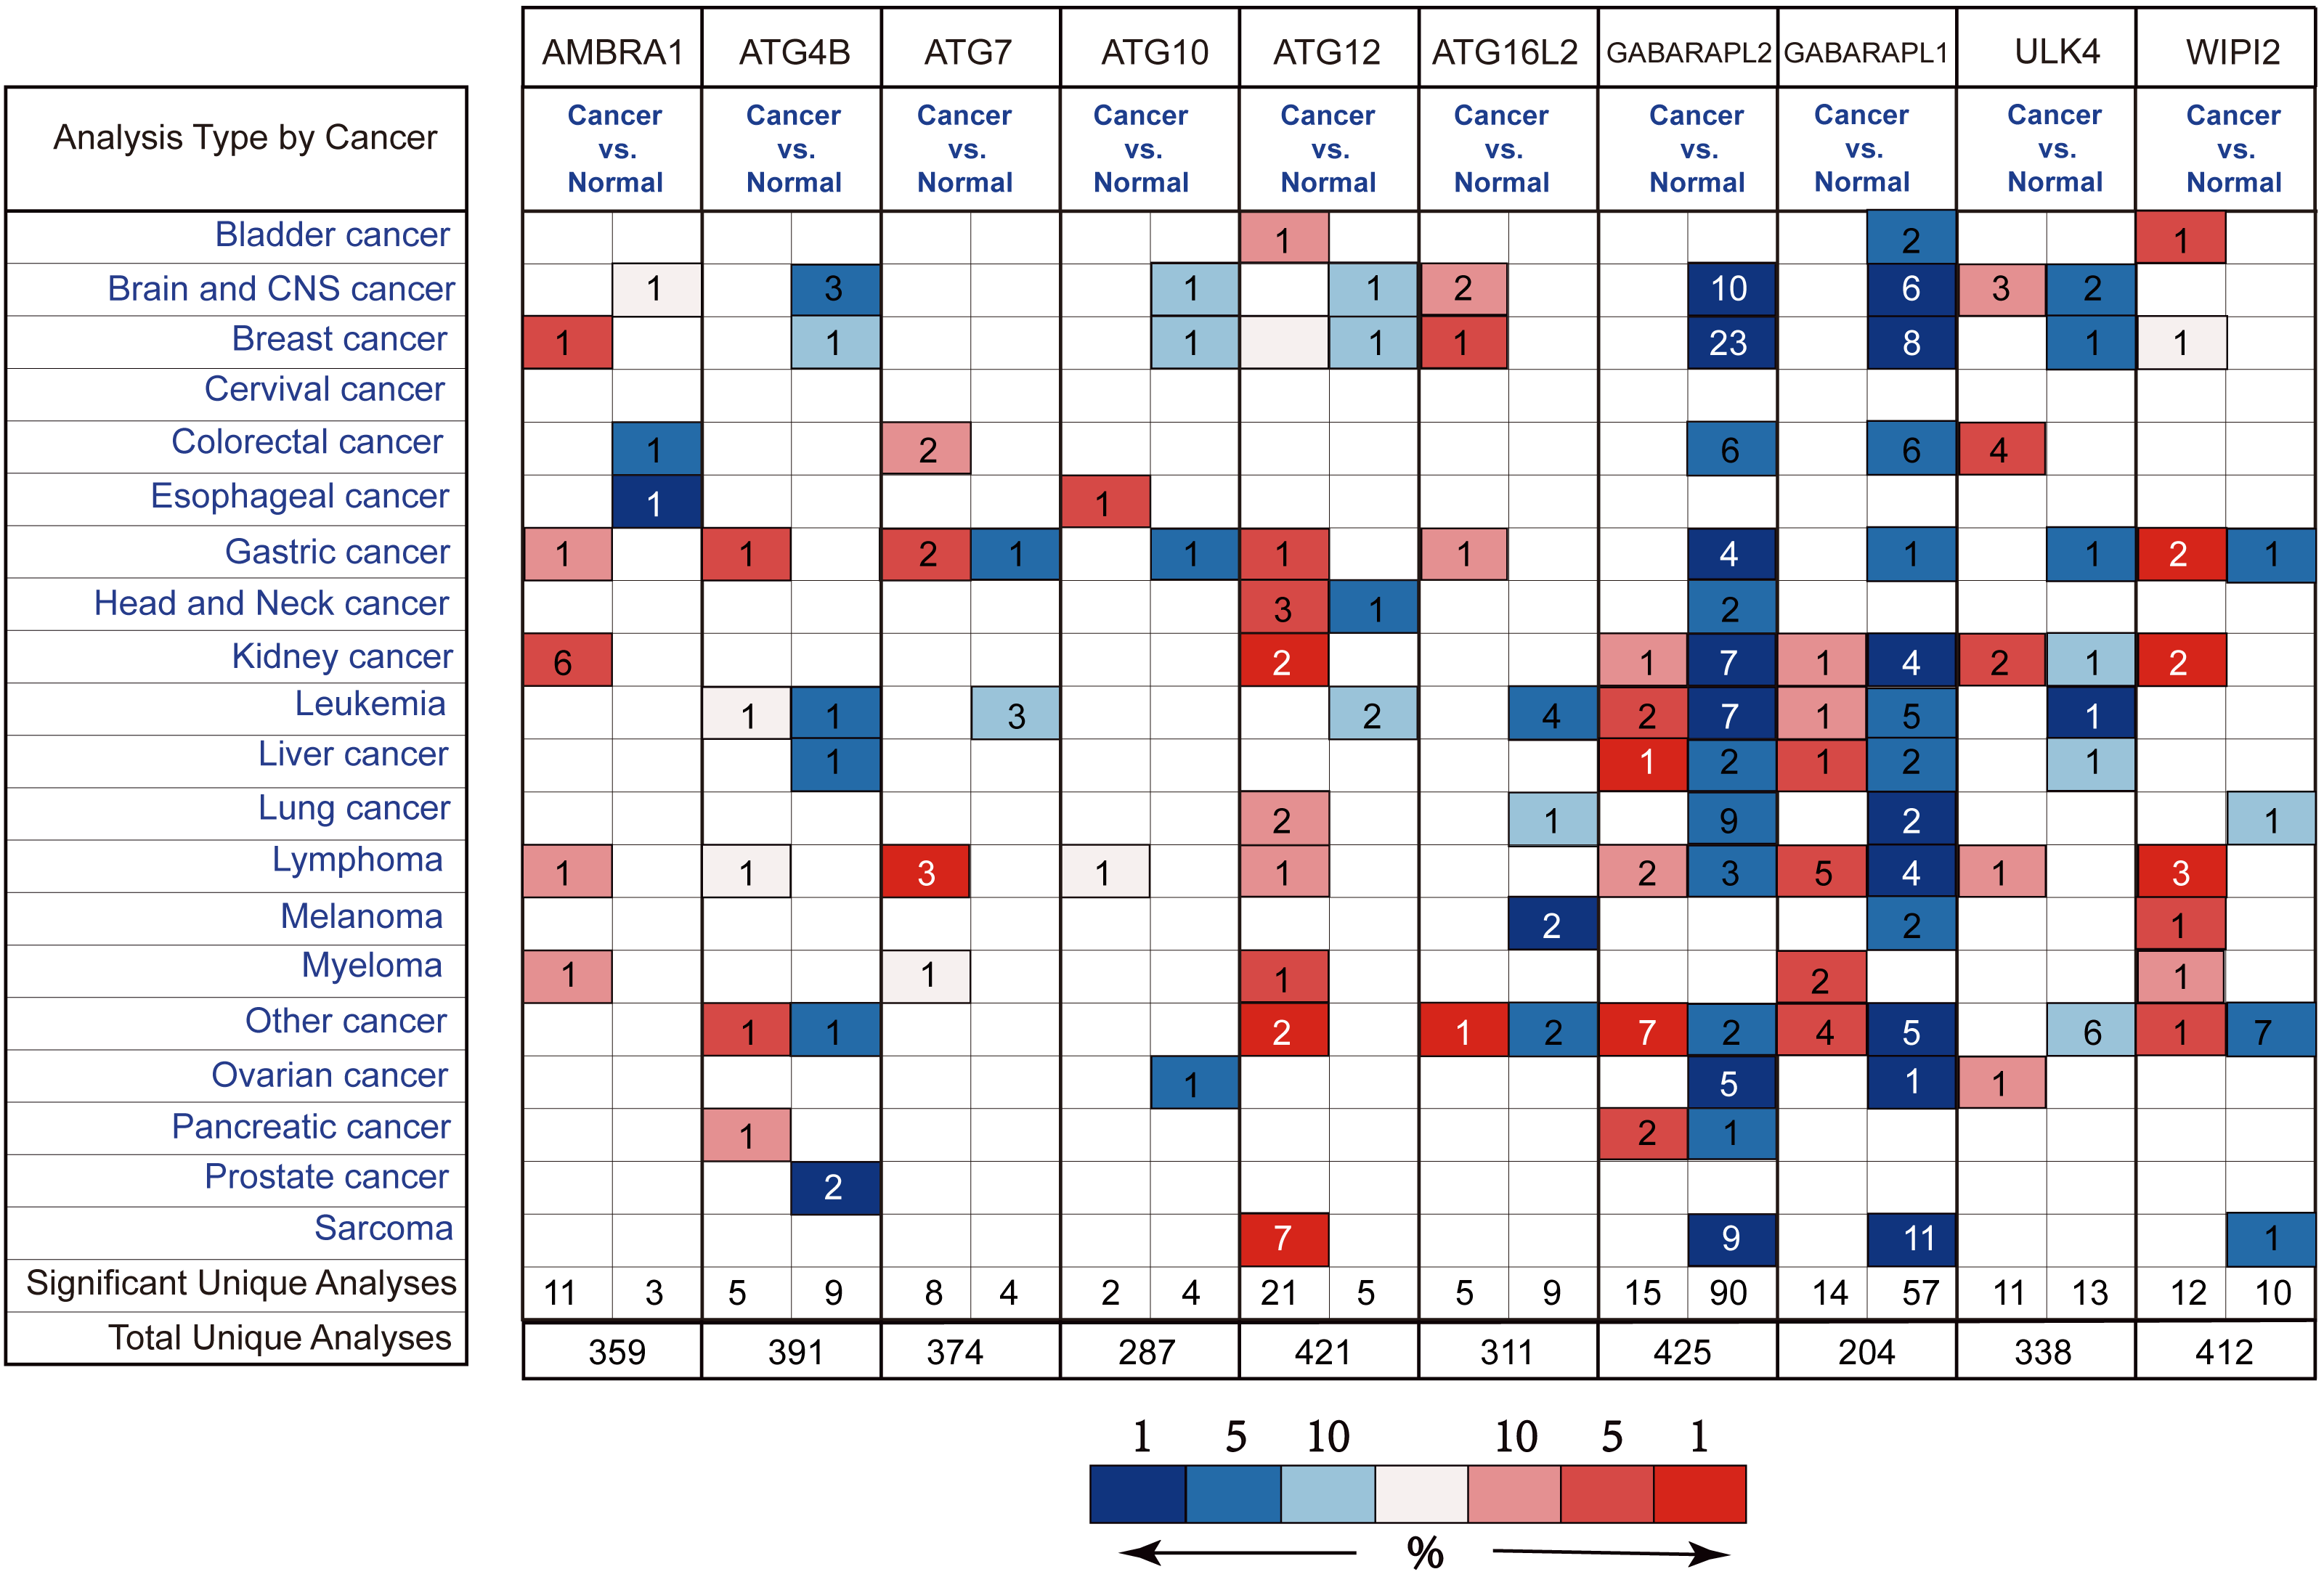
Histological stratification analysis showed that GABARAPL1 was down-regulated in all types of GC compared with normal tissues, with fold change of −2.321 in intestinal gastric adenocarcinoma, −2.287 fold in diffuse adenocarcinoma and −2.622 fold in mixed adenocarcinoma. Six DEGs showed significant differences in the gastric mixed adenocarcinoma subgroup, among them AMBRA1, ATG4B, ATG7 (probe 224025_s_at) and ATG12 were up-regulated, while GABARAPL1 and ATG7 (probe 1569827_at) were down-regulated. Four DEGs including ATG10, ATG16L2, ULK4 and GABARAPL1 showed differences in diffuse gastric adenocarcinoma subgroup, while other four DEGs including ATG7 (probe 224025_s_at), GABARAPL1, WIPI2 and GABARAPL3 showed differences in gastric intestinal type adenocarcinoma subgroup (Figs. 3A and 3B).
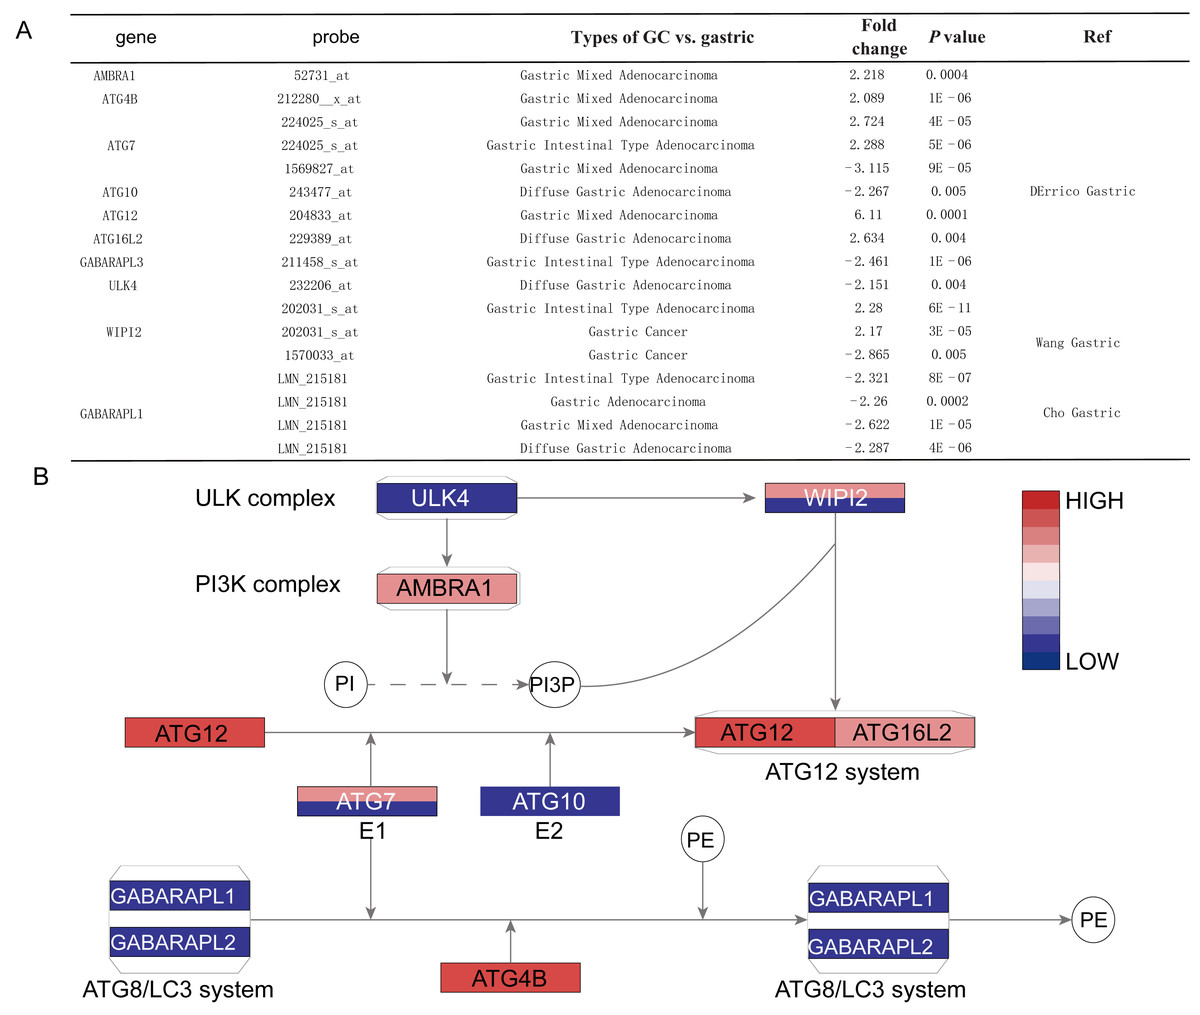
Figure 3: The detail information for the different ATGs.
(A) The detail information in the oncomine dataset. (B) The position of different ATGs in autophagy pathway. The blue color represents downexpression in cancer, while the red color represents overexpression in cancer. The gene with two different colors means two probe of the gene showed different expressions. The gradient color represents the gene’s fold change.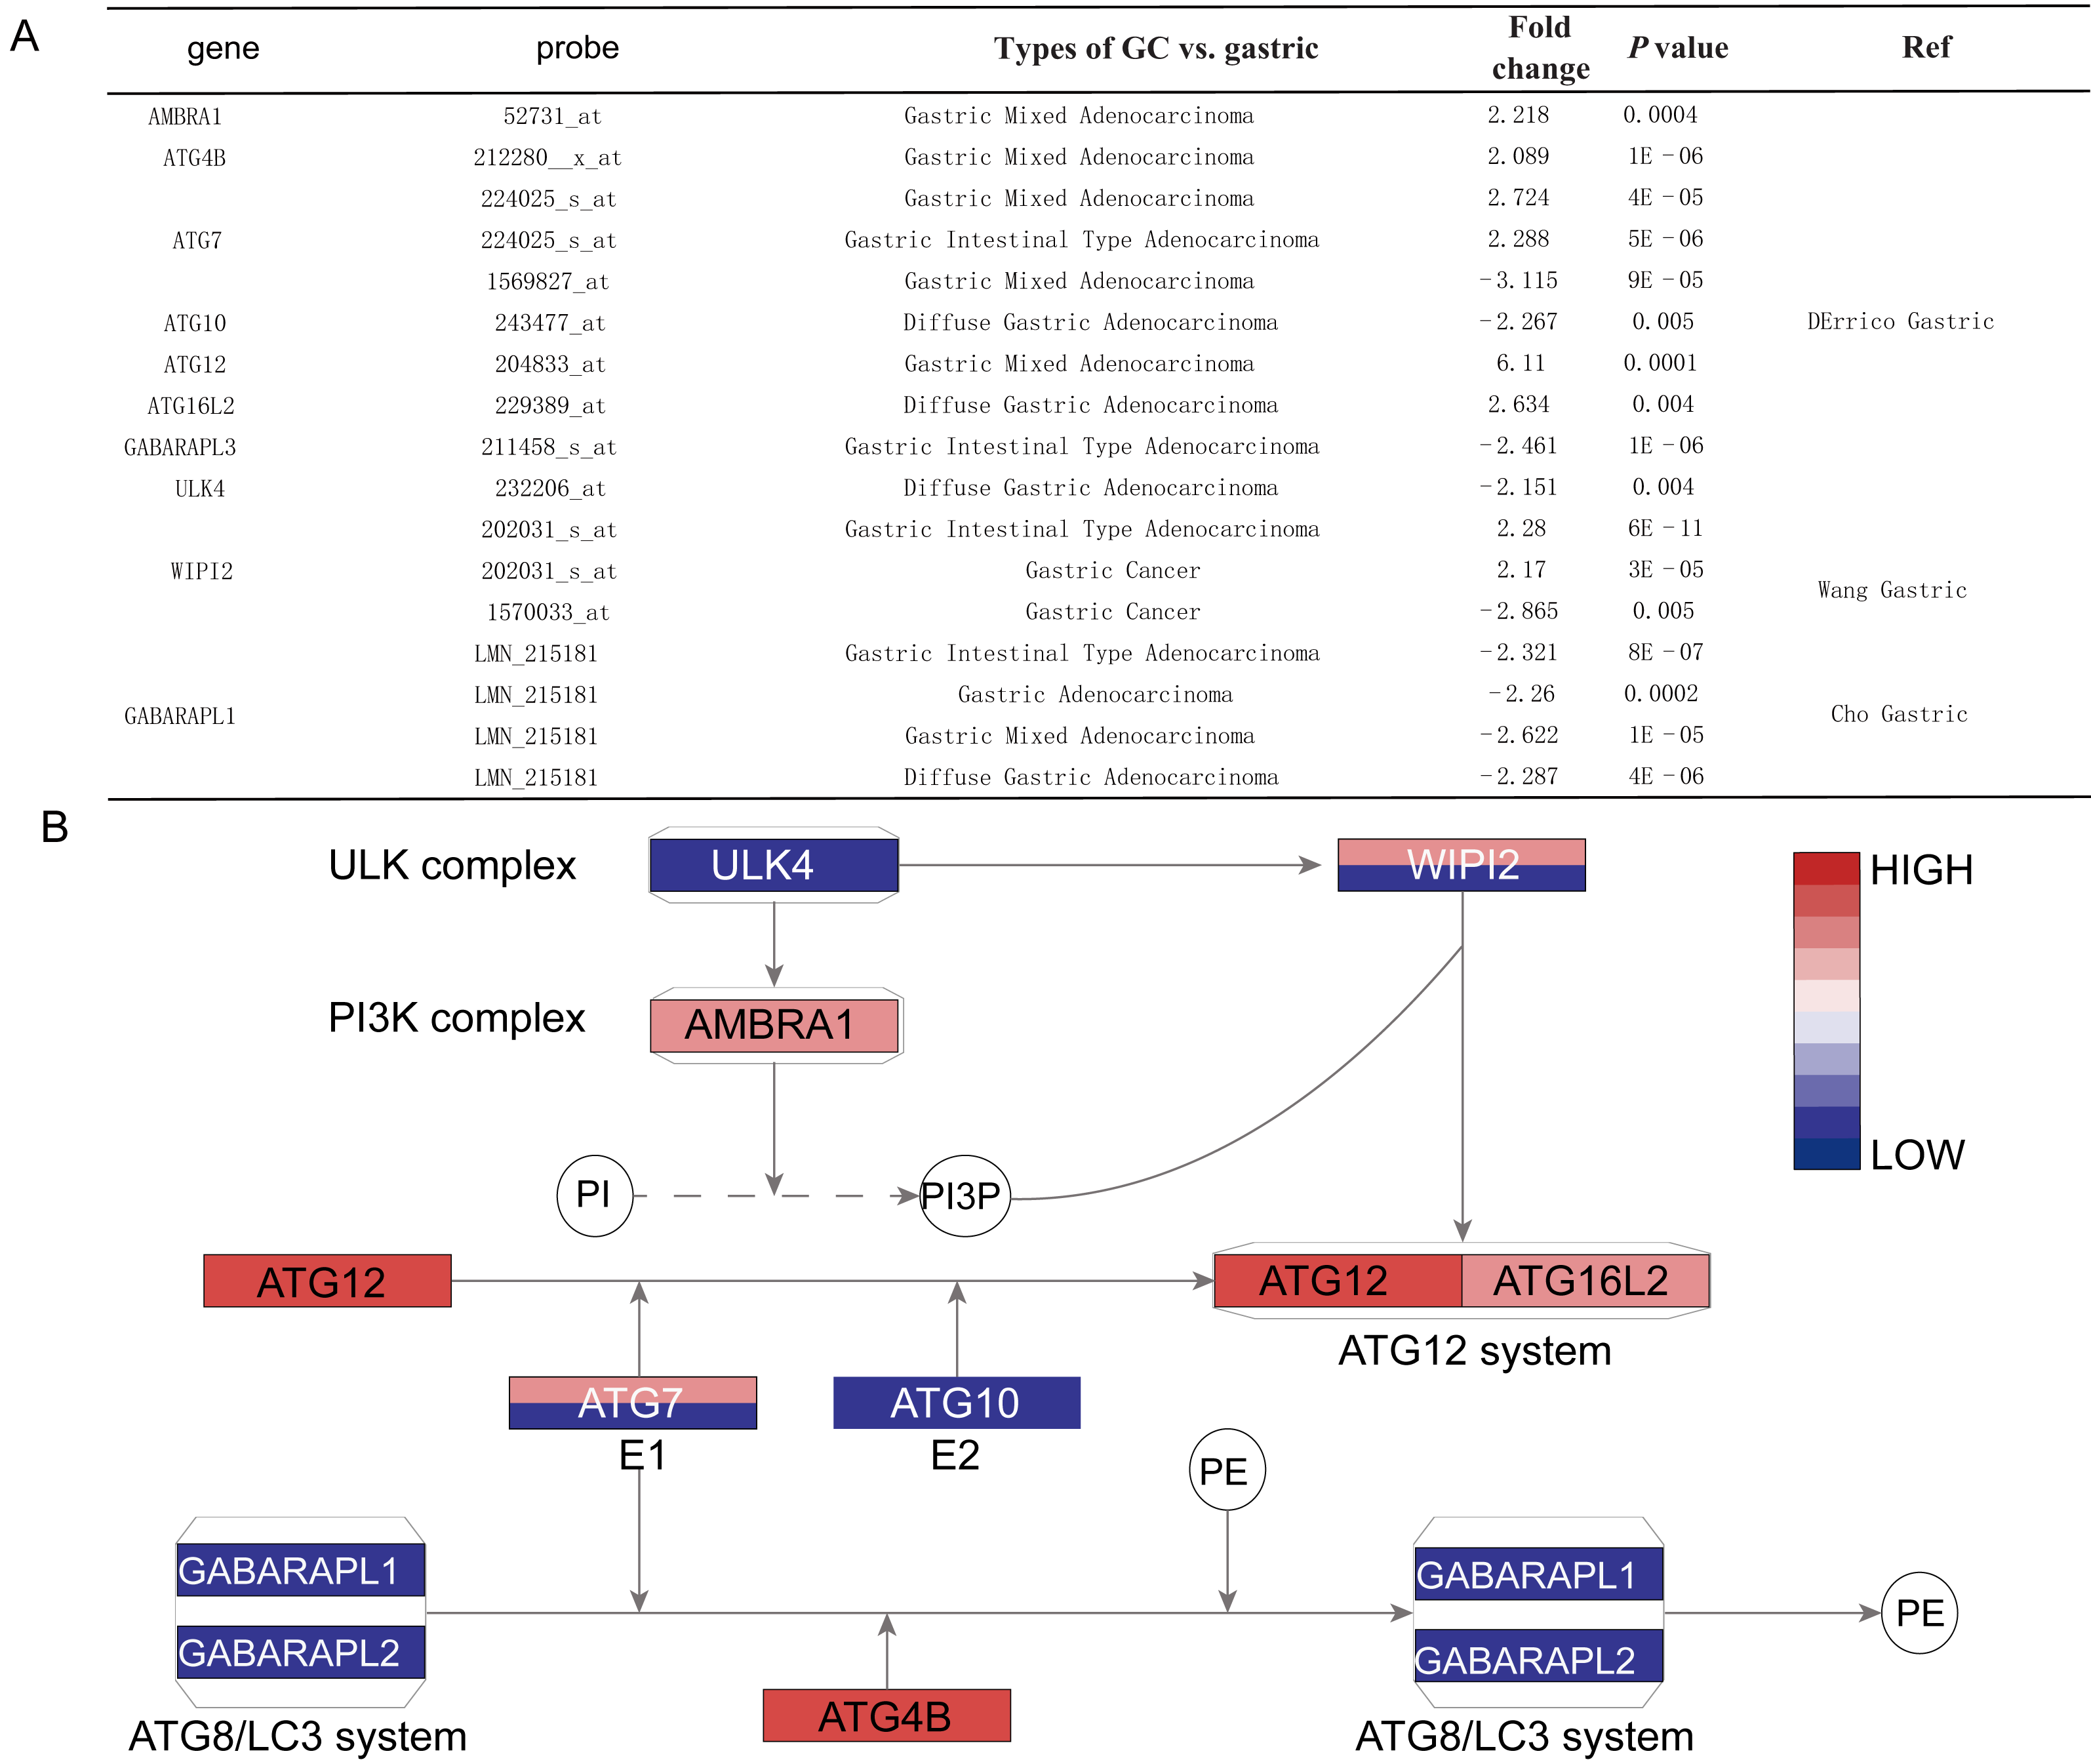
Association between ATG genes expression and clinicopathologic variables of GC
Data of 376 GC patients in TCGA were downloaded for the analysis. ATG14, ULK3, ATG2B, ATG12, ATG4C, ATG4D, and MAP1LC3A showed significantly relationship with TNM stage. After verification, ATG14 and ATG4D were significantly associated with TNM stage (P = 0.027, 0.048 respectively). ATG9A (P = 0.00083), ATG2A (P = 0.00417), and ATG4D (P = 0.00864) were related with T stage. Low expression of VMP1 and ATG4A suggested absence of lymph node metastasis (P = 0.0018, 0.015, correspondingly). However, no gene in autophagy pathway was observed to be associated with M stage (Table 2).
Roles of ATG genes expression in the prediction of GC prognosis
354 patients were included to analyze the overall survival of GC. The median value was used as cut-off value to distinguish high expression and low expression of ATG genes. According to the univariate survival analysis, ATG4D, GABARAPL2 and MAP1LC3C were significantly associated with the prognosis of GC. Moreover, the patients with low-expression of ATG4D or high-expression of GABARAPL2 and MAP1LC3C demonstrated longer survival time, and both of the latter two genes belonged to ATG8/LC3 system. Using the Cox’s proportional hazards model, we then performed the multivariate analysis adjusted by gender, age, TNM stage. ATG4D and MAP1LC3C were identified as the independent prognostic factors, with adjusted hazard ratio (HR) of 1.5727 (95% CI [1.1194–2.21]) and 0.5767 (95% CI [0.4086–0.8138]) separately (Fig. 4 and Table 3). The summary of the correlation between ATG genes expression and TNM staging and prognosis of GC was shown in Fig. 5.
Joint prediction of the GC prognosis using ATG4D and MAP1LC3C
According to the expression of ATG4D and MAP1LC3C in GC, the gastric cancer patients were divided into four groups: ATG4D high expression - MAP1LC3C high expression (HH), ATG4D low expression - MAP1LC3C low expression (LL), ATG4D high expression - MAP1LC3C low expression (HL) and ATG4D low expression - MAP1LC3C high expression (LH). A significant difference was displayed among the four groups (p = 0.0056, Fig. 6A).
| Gene symbol | TCGA | GSE62254 | ||||||
|---|---|---|---|---|---|---|---|---|
| TNM | ||||||||
| I–II | III–IV | P | I–II | III–IV | P | |||
| ATG14 | low | 96 | 80 | 72 | 76 | |||
| high | 71 | 105 | 0.00761 | 54 | 96 | 0.02711 | ||
| ULK3 | low | 71 | 100 | 61 | 89 | |||
| high | 96 | 85 | 0.03 | 65 | 83 | 0.568 | ||
| ATG2B | low | 95 | 85 | 62 | 86 | |||
| high | 72 | 100 | 0.04032 | 64 | 86 | 0.8923 | ||
| ATG12 | low | 96 | 83 | 58 | 91 | |||
| high | 71 | 102 | 0.018 | 68 | 81 | 0.241 | ||
| ATG4C | low | 94 | 84 | 65 | 83 | |||
| high | 73 | 101 | 0.041 | 61 | 89 | 0.57 | ||
| ATG4D | low | 70 | 100 | 55 | 95 | |||
| high | 97 | 85 | 0.022 | 71 | 77 | 0.04822 | ||
| MAP1LC3A | low | 71 | 105 | 65 | 83 | |||
| high | 96 | 80 | 0.0076 | 61 | 89 | 0.57 | ||
| T | ||||||||
| T1T2 | T3T4 | P | T1T2 | T3T4 | P | |||
| WIPI1 | low | 41 | 147 | 101 | 49 | |||
| high | 58 | 121 | 0.022 | 87 | 63 | 0.0947 | ||
| ATG9A | low | 39 | 143 | 80 | 70 | |||
| high | 60 | 125 | 0.018 | 108 | 42 | 0.00083 | ||
| ATG2B | low | 42 | 145 | 95 | 85 | |||
| high | 57 | 123 | 0.047 | 93 | 57 | 0.092 | ||
| ATG2A | low | 40 | 141 | 82 | 68 | |||
| high | 59 | 127 | 0.038 | 106 | 44 | 0.00417 | ||
| ATG4D | low | 39 | 141 | 83 | 67 | |||
| high | 60 | 127 | 0.025 | 105 | 45 | 0.00864 | ||
| ATG7 | low | 40 | 146 | 90 | 60 | |||
| high | 59 | 122 | 0.017 | 98 | 52 | 0.3396 | ||
| N | ||||||||
| N0 | !N0 | P | N0 | !N0 | P | |||
| PIK3R4 | low | 66 | 116 | 18 | 132 | |||
| high | 45 | 130 | 0.031 | 20 | 130 | 0.728 | ||
| VMP1 | low | 65 | 116 | 28 | 122 | |||
| high | 46 | 130 | 0.046 | 10 | 140 | 0.00178 | ||
| ATG12 | low | 66 | 113 | 16 | 134 | |||
| high | 45 | 133 | 0.018 | 22 | 128 | 0.2976 | ||
| ATG4A | low | 68 | 115 | 26 | 124 | |||
| high | 43 | 131 | 0.0111 | 12 | 138 | 0.01509 | ||
| M | ||||||||
| M0 | M1 | P | M0 | M1 | P | |||
| ULK4 | low | 160 | 19 | 137 | 13 | |||
| high | 170 | 6 | 0.008 | 136 | 14 | 0.8401 | ||
| MAP1LC3B | low | 174 | 7 | 139 | 11 | |||
| high | 156 | 18 | 0.0171 | 134 | 16 | 0.3131 | ||
Notes:
Significant results are marked in bold.
Furtherly, to predict 1-year and 3-year survival rate, we built a nomogram by the multivariate Cox regression models. After validation, the C-index was 0.676 and the 95% CI was 0.628 to 0.724. According to the total score after added with points identified on the point scale, we found that the likelihood of 1-year and 3-year OS for individual patient could be reasonably predicated by nomogram (Fig. 6B). As shown in Figs. 6C and 6D, the survival evaluated by the Kaplan–Meier method was marked on the y-axes, the predicted survival estimated by nomogram was observed on the x-axes, and the red lines represented the ideal reference line for which predicted survival corresponds with actual survival. The plot for the probability of OS 1-year or 3-year showed optimal agreement between the prediction by nomogram and actual observation for nomogram.
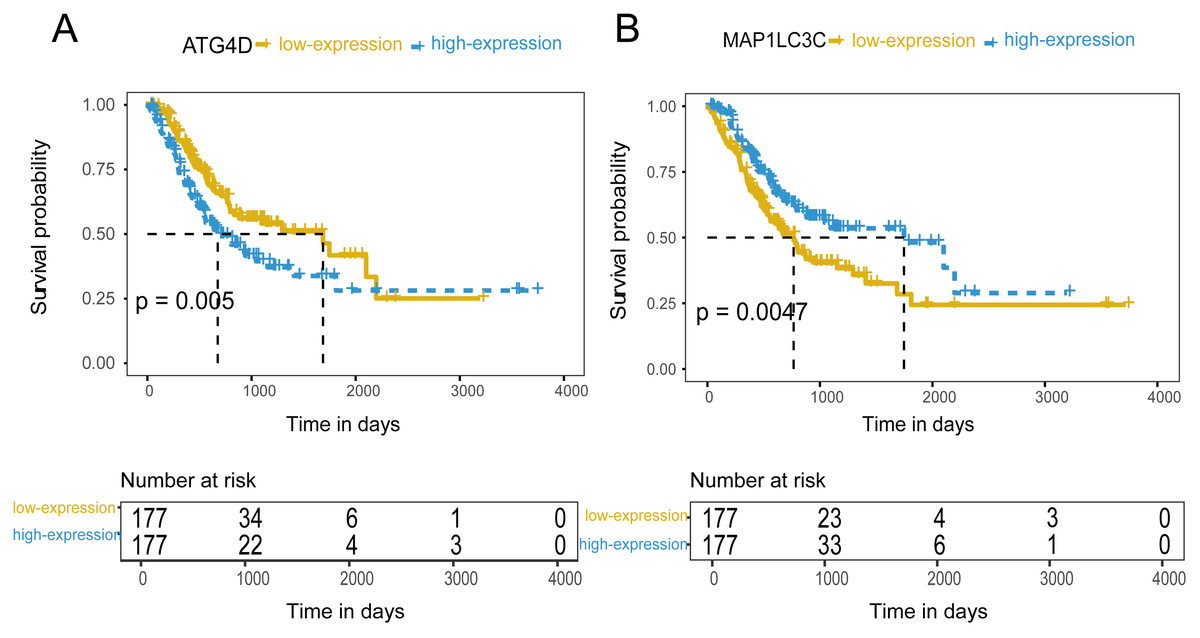
Figure 4: The prognostic value of mRNA level of independent prognostic factors.
(A) ATG4D. (B) MAP1LC3C.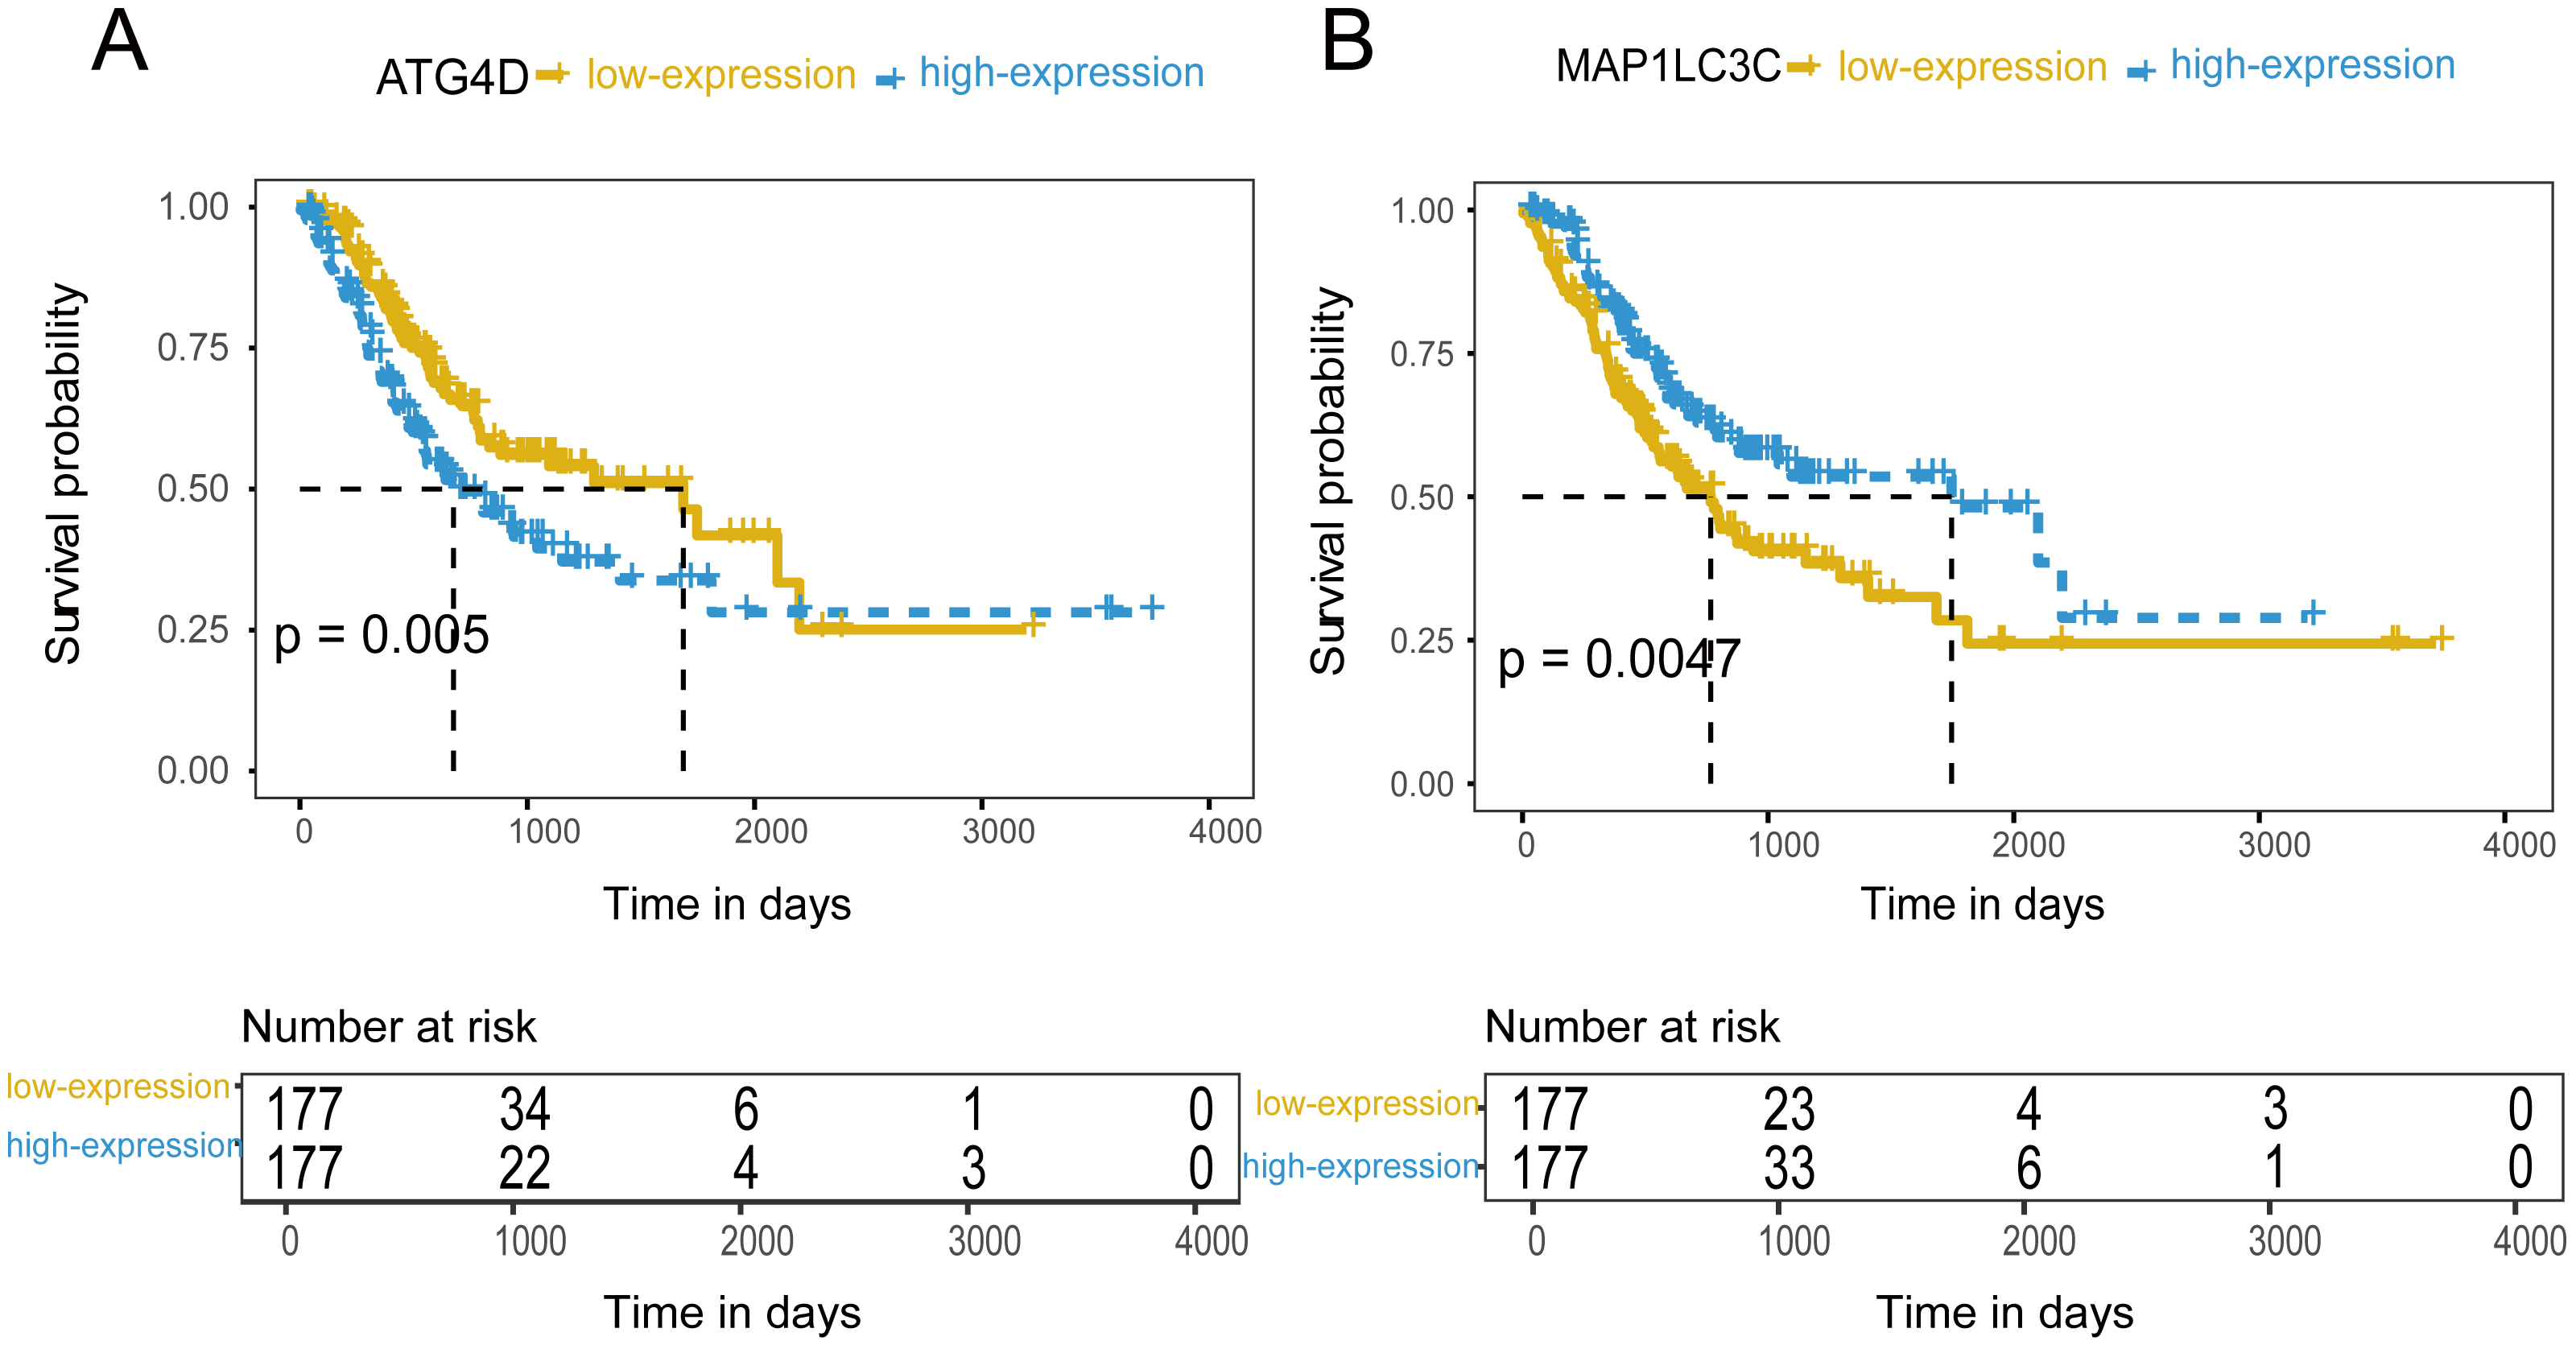
Discussion
Considering the vital function of ATG genes in autophagy, many studies have focused on their role in cancers. To date, no researcher has elaborated an overview of the impact of ATG genes on the development, progression, and prognosis of GC. In the current study, for the first time, we investigated the expression profiling and the prognostic roles of whole members of ATG genes in GC using multiple databases. Our results elucidated that abnormal expressions of some key ATG genes were significantly associated with GC progression and outcome.
| Univirable analysis | Multivanable analysis | |||
|---|---|---|---|---|
| HR(95CI) | P | HR(95CI) | P | |
| ATG4D | 1.602(1.153–2.225) | 0.00493 | 1.5727(1.1194–2.21) | 0.009058 |
| GABARAPL2 | 0.6925(0.499–0.9609) | 0.0279 | 0.7855(0.5597–1.102) | 0.162447 |
| MAP1LC3C | 0.6242(0.4488–0.8682) | 0.00511 | 0.5767(0.4086–0.8138) | 0.00173 |
Notes:
Significant results are marked in bold.
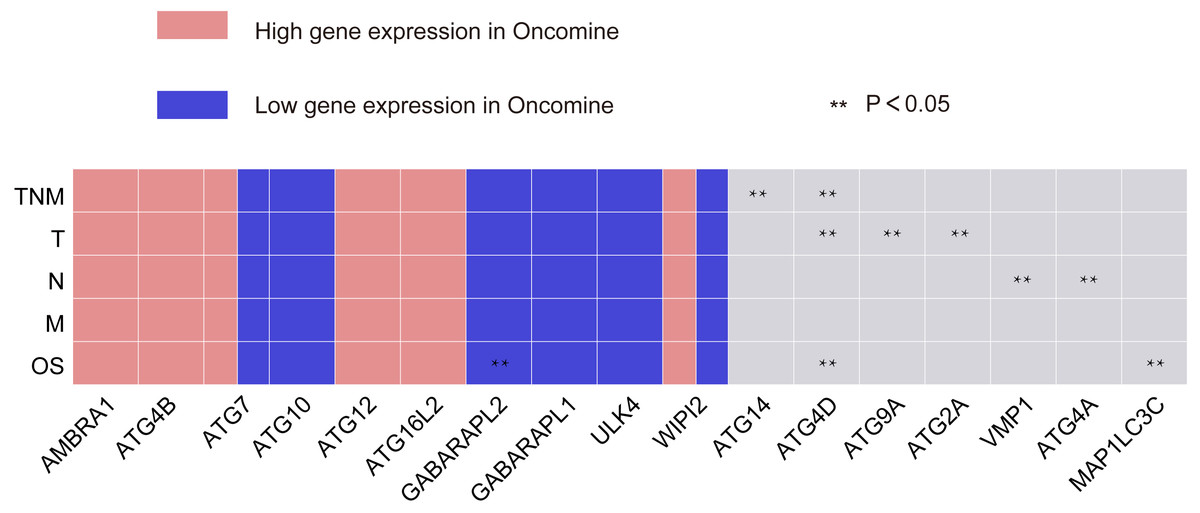
Figure 5: Summary of the correlation between ATG genes expression and TNM staging and prognosis.
The red frame represents genes with high significant expression, and the blue frame represents genes with low significant expression. Two asterisks (**) represent that gene expressions has significant correlation with TNM staging or OS of GC.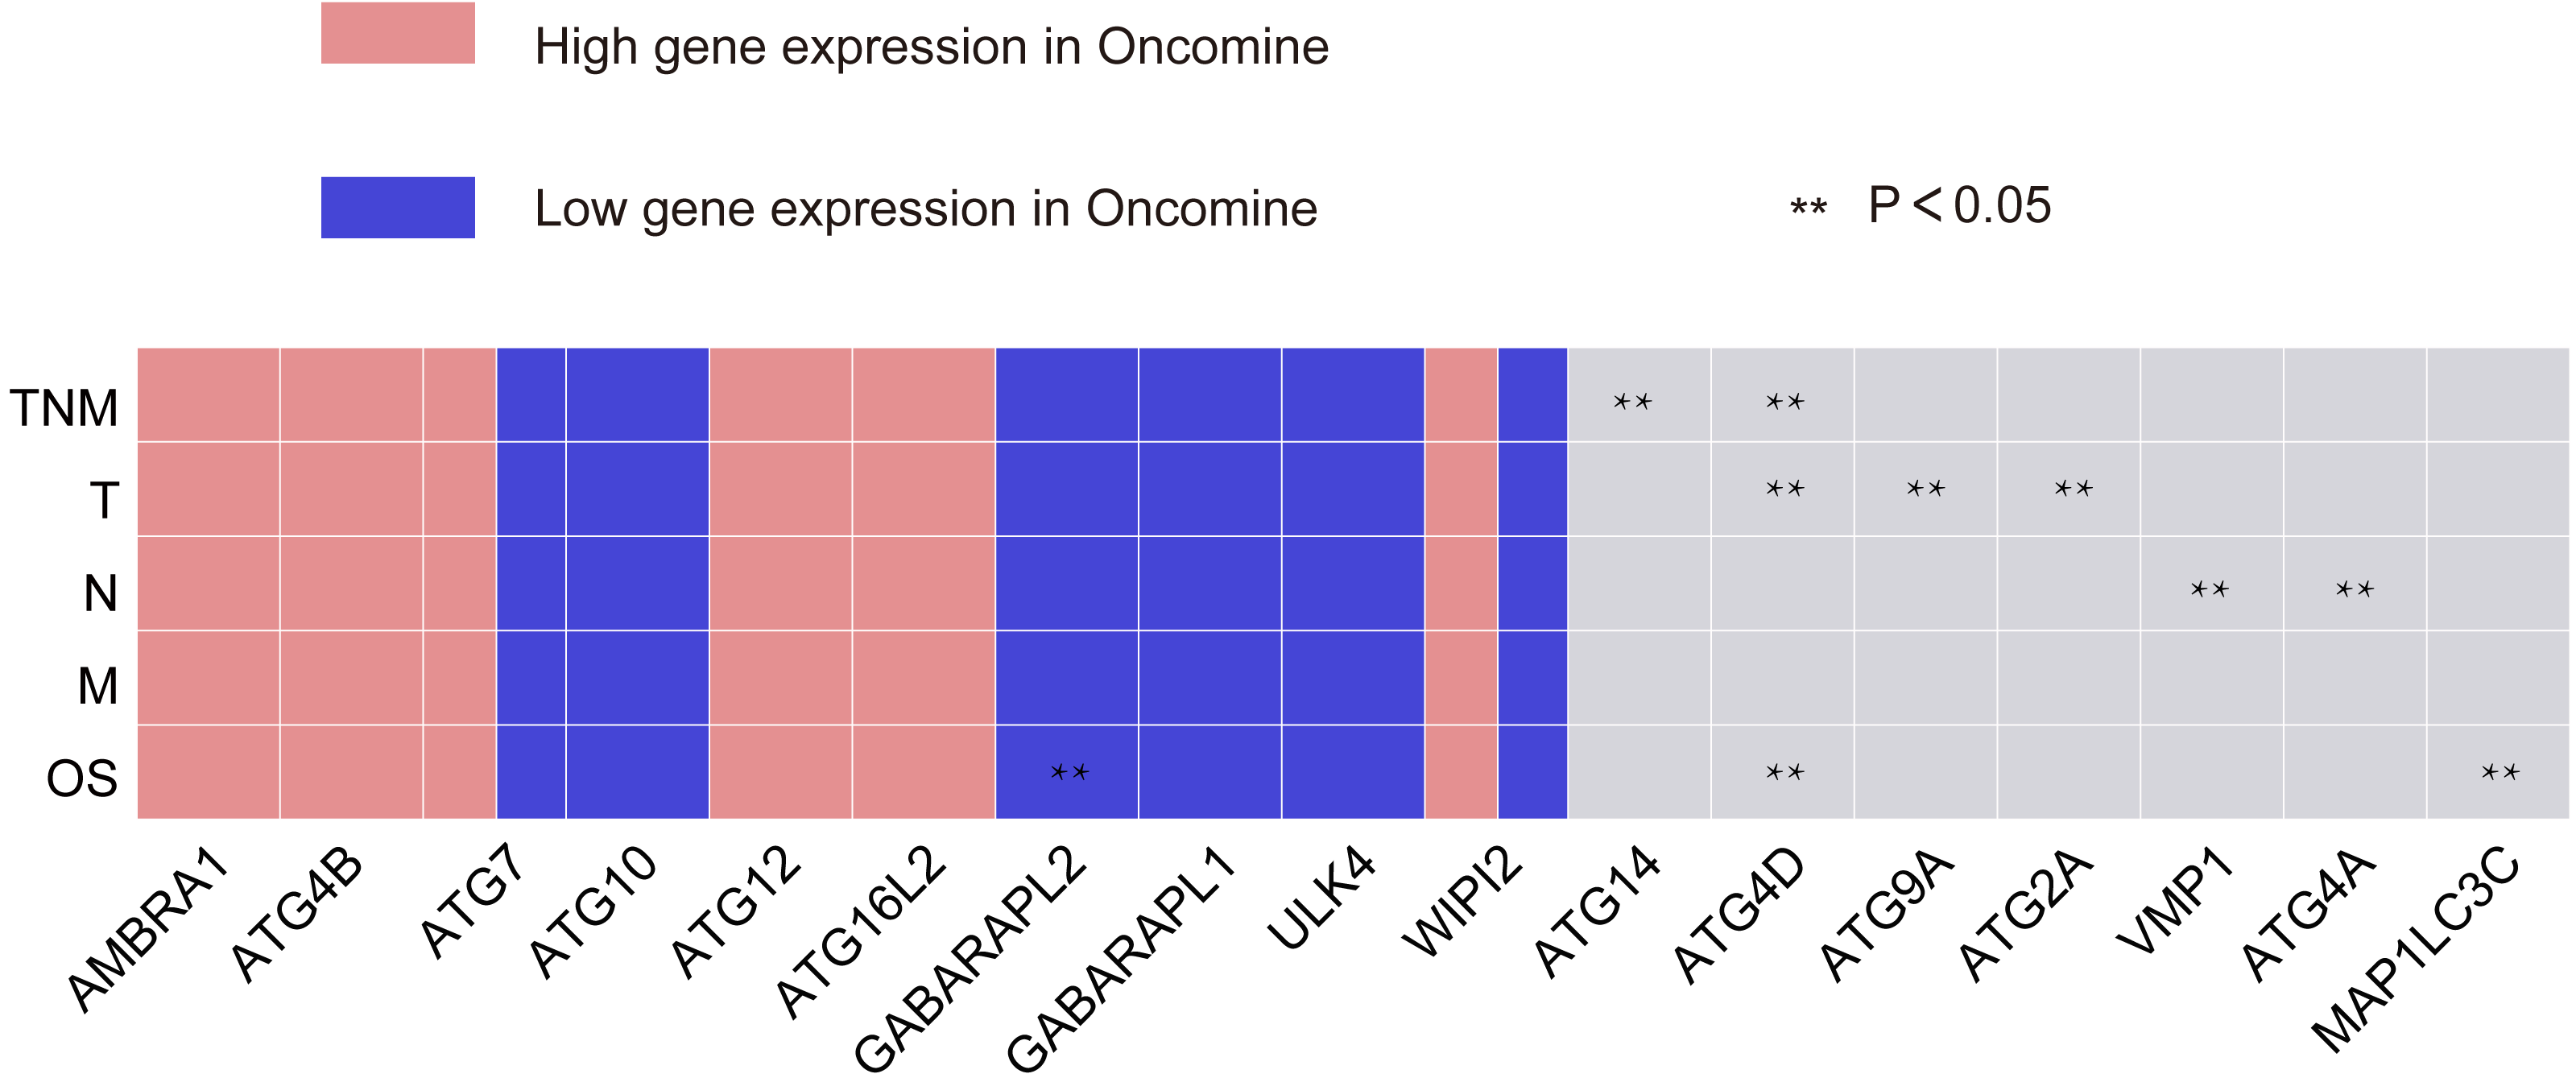
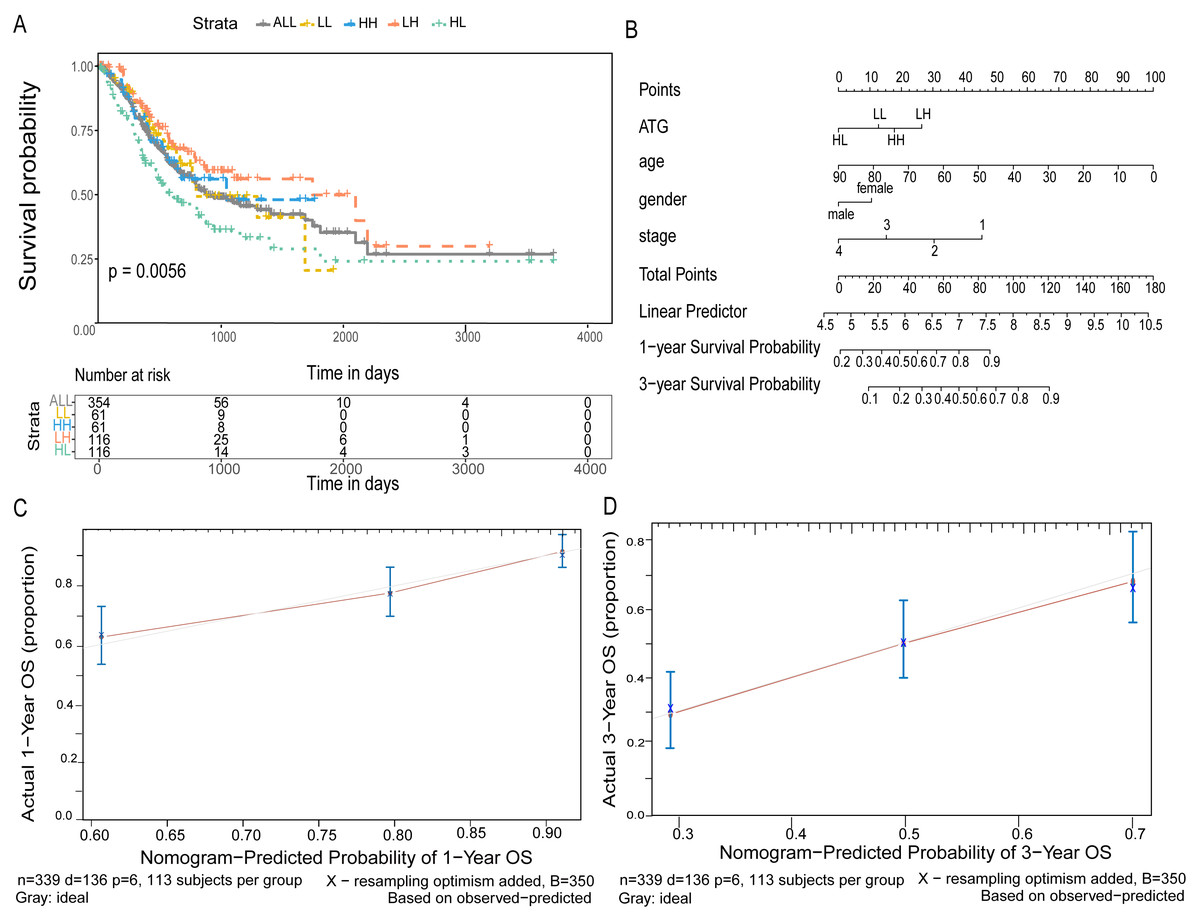
Figure 6: Joint predictive the patients prognosis using ATG4D and MAP1LC3C.
(A) The Kaplan–Meier plot for the four groups. (B) The nomogram for indicating the one- and three-year overall survival in patients with gastric cancer. (C) The calibration curve of nomogram for predicting overall survival at one year. (D) The calibration curve of nomogram for predicting overall survival at three year.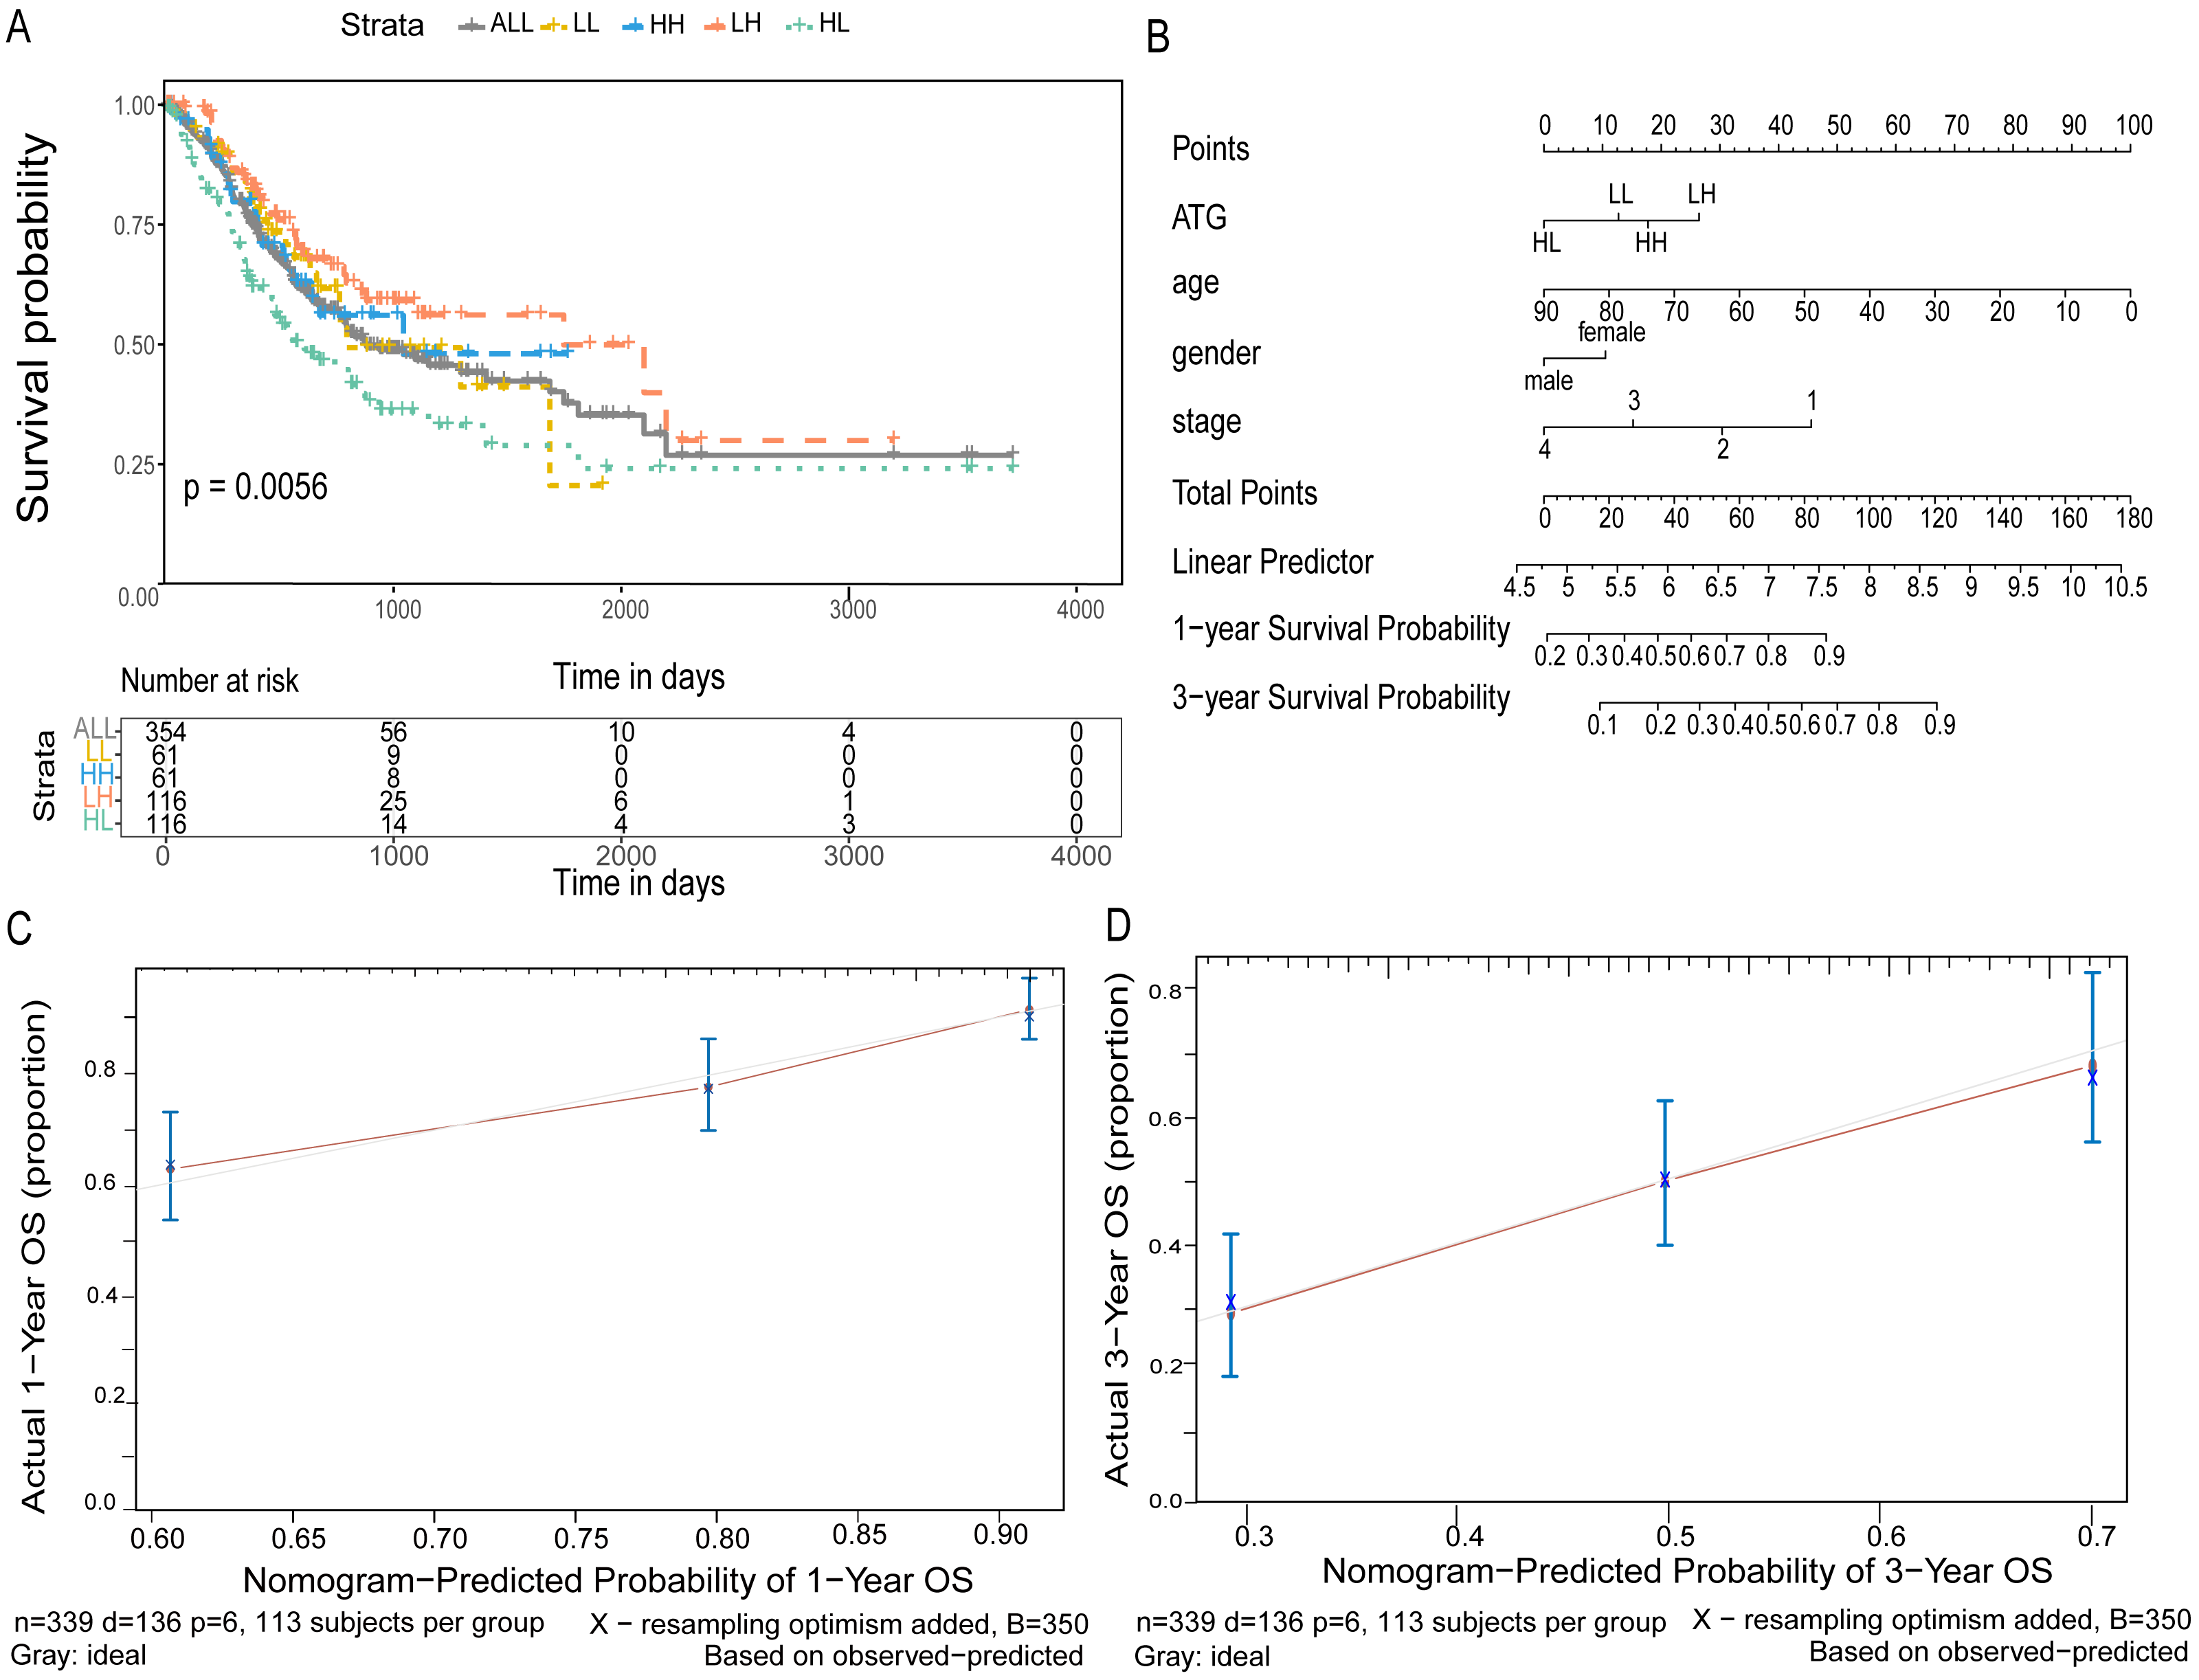
Firstly, 10 DEGs were identified between cancer and normal tissues, and 7 of these genes were associated with ubiquitin-like conjugating system, which intimately involved in driving the biogenesis of the autophagosomal membrane (Nakatogawa, 2013). ATG4B (Liu et al., 2014), the core autophagy protein in ATG8/LC3 system, was found to be up-regulated in cancer tissue in our study. It has been reported that ATG4B can promote the growth of colorectal cancer, while silencing the expression of ATG4B can reduce the colony formation of cancer cells and inhibit tumor growth (Liu et al., 2014; Liu et al., 2018). The E1-like activating enzyme ATG7 and the E2-like activating enzyme ATG10 also play a vital role in activating and transferring key proteins in the sub-systems. In our study, expression of ATG12 and ATG7 showed up-regulation while ATG10 expression was down regulated in cancer tissues. Similarly, Cao et al. (2016) analyzed 352 tissue microarrays containing cancer and paired adjacent normal tissues and found that ATG7, ATG12 were highly expressed in the GC tissues, and ATG10 was weakly expressed in GC. Probably because autophagy plays a specific function as a cancer suppressor or tumor promoter, mainly depends on the environment, and its activity will change with the development of the tumor (Amirfallah et al., 2019). As for ATG genes of other functional units of ubiquitin-like conjugating system, some studies (Lebovitz et al., 2015; Su et al., 2019) found that GABARAPL1 transcripts were less abundant in breast, prostate, liver and non-small cell lung cancers than matched normal controls, indicating that GABARAPL1 may be a tumor suppressor. While ATG16L2 transcripts increased in kidney cancer. As a high risk gene, its high expression is associated with poor prognosis (Wan et al., 2019). The high expression of Ambra1 is beneficial to cell survival (Sun et al., 2018). Falasca compared 26 prostate adenocarcinoma and 12 normal specimens by immunohistochemistry and observed that AMBRA1 was highly expressed in prostate cancer (Falasca et al., 2015). The expression trend of those genes was consistent with our results in GC. The above results indicate that the ubiquitin-like conjugated system plays a key role in the occurrence of GC, and its mechanism deserves further study.
It has been reported that autophagy was associated with the invasion, migration as well as implantation metastasis of cancer. Therefore, we further analyzed the relationship between ATG genes and GC TNM staging, and verified the differential genes using GSE62254 to improve the accuracy. After verification, ATG9A, ATG2A and ATG4D were found to be associated with T stage. Among these genes, ATG9A was previously reported to be associated with T stage in non-metastatic renal cell carcinoma (Tang et al., 2013). ATG4D affects the biological behavior of prostate cancer by regulating the activity of androgen receptor (Hu et al., 2020). Besides, all of these significant differences were observed at early T stage, which suggested that autophagy may play its role mainly at the early stage of GC progression. By analyzing the expression of ATG genes both in TCGA and GSE62254, the results showed that VMP1 and ATG4A were over-expressed in patients with lymph node metastasis. Similarly, Yang et al. found that the expression of ATG4A was associated with lymph node metastasis in 110 GC patients (Yang et al., 2016). VMP1 was reported to promote Kras G12D-mediated pancreatic cancer initiation and facilitate lymph node metastasis (Loncle et al., 2016). In addition, ATG4D and ATG14 were observed to be associated with overall TNM stage according to our analysis. ATG14 was up-regulated while ATG4D was down-regulated in GC of stage III-IV, which suggested that the two genes may have the opposite effect in GC progression. It has been reported that the low expression of ATG4D was associated with Colorectal Cancer of III stage (Gil et al., 2018). Interestingly, significant relation was observed between ATG4 isoforms and all the three clinicopathologic variables, that ATG4D was associated with TNM and T stage, and ATG4A showed difference in N stage. As ATG4 activity is essential and highly specific to autophagy, it may be a prospective autophagy-specific target for GC therapy.
Previous investigations have also indicated the predictive role of autophagy pathway genes in prognosis of various types of cancers. Here we analyzed all the ATG genes using TCGA dataset to assess their prognostic values in GC. ATG4D and MAP1LC3C were confirmed to be statistically significant in multivariate survival analysis. The expression of ATG4D and MAP1LC3C is low in colorectal cancer, and ATG4D is related to the poor prognosis of pancreatic cancer (Hu et al., 2020). The high expression of ATG4D and the low expression of MAP1LC3C may indicate the poor survival of gastric patients. Furthermore, we developed a nomogram according to the joint expression of ATG4D and MAP1LC3C along with other clinicopathological parameters. The group of HL showed poor survival while the group of LH indicated favorable prognosis. In the internal validation set, the calibration plot showed that the predicted 3-year and 5-year overall survival were in correspondence with the actual survival estimated by the Kaplan–Meier method. MAP1LC3C is a member of the LC3 family of proteins and a key structural component of the autophagosome that undergoes processing by members of the ATG4 family (Costa et al., 2016). These two functionally related genes together may have synergistic effect in GC prognosis. For the first time, our study formulated an ATG-based nomogram that could predict outcome of GC with a better accuracy.
On the basis of the above results, we found that ATG4 and ATG8, members of ATG8/LC3 system, were associated with both the occurrence and prognosis of GC in our study. ATG4 was up-regulated in cancer and was associated with poor GC survival. The over-expression of ATG8 was observed in normal tissues and involved with favorable prognosis of GC. ATG8/LC3 is essential for autophagosome biogenesis and it also functions as an adaptor protein for selective autophagy (Lee & Lee, 2016). At the same time, it is also widely used as a marker of autophagic vacuoles (Mareninova et al., 2020).Dysregulation of ATG8/LC3 proteins may contribute to pathogenic effects during progression of autophagy-associated human diseases. Our results indicated that the ATG8/LC3 system may play an important role in development and clinical outcome of GC. Elucidation of alterations in specific ATG8/LC3 forms in GC could provide insights for the discovery, diagnosis, or targeting of this high-mortality disease.
In conclusion, our study provided a comprehensive illustration of ATG genes expression characteristics in GC. Abnormal expressions of ATG genes were observed to be significantly involved in the whole process of GC occurrence, progression and prognosis. Specially, the ULK system, such as ATG4 family and ATG8/LC3, may serve as valuable biomarkers to indicate gastric carcinogenesis and prognosis. Considering the underlying important roles of ATG genes in gastric carcinogenesis and progression, future molecular experiments concerning the functions and mechanisms of ATG genes may generate promising significance in GC development and treatment.
Conclusions
Our study provided a comprehensive illustration of ATG genes expression characteristics in GC. Abnormal expressions of the ubiquitin-like conjugated system in ATG genes plays a key role in the occurrence of GC. ATG8/LC3 sub-system may play an important role in development and clinical outcome of GC. In the future, it is necessary to further elucidate the alterations of specific ATG8/LC3 forms in order to provide insights for the discovery, diagnosis, or targeting for GC.