
Analysis of synonymous codon usage of transcriptome database in Rheum palmatum
- Published
- Accepted
- Received
- Academic Editor
- Sankar Subramanian
- Subject Areas
- Bioinformatics, Genetics, Plant Science
- Keywords
- Codon usage bias, Nucleotide composition, Transcriptome analysis, Gene expression level, Rheum palmatum
- Copyright
- © 2021 Huo et al.
- Licence
- This is an open access article distributed under the terms of the Creative Commons Attribution License, which permits unrestricted use, distribution, reproduction and adaptation in any medium and for any purpose provided that it is properly attributed. For attribution, the original author(s), title, publication source (PeerJ) and either DOI or URL of the article must be cited.
- Cite this article
- 2021. Analysis of synonymous codon usage of transcriptome database in Rheum palmatum. PeerJ 9:e10450 https://doi.org/10.7717/peerj.10450
Abstract
Background
Rheum palmatum is an endangered and important medicinal plant in Asian countries, especially in China. However, there is little knowledge about the codon usage bias for R. palmatum CDSs. In this project, codon usage bias was determined based on the R. palmatum 2,626 predicted CDSs from R. palmatum transcriptome.
Methods
In this study, all codon usage bias parameters and nucleotide compositions were calculated by Python script, Codon W, DNA Star, CUSP of EMBOSS.
Results
The average GC and GC3 content are 46.57% and 46.6%, respectively, the results suggested that there exists a little more AT than GC in the R. palmatum genes, and the codon bias of R. palmatum genes preferred to end with A/T. We concluded that the codon bias in R. palmatum was affect by nucleotide composition, mutation pressure, natural selection, gene expression levels, and the mutation pressure is the prominent factor. In addition, we figured out 28 optimal codons and most of them ended with A or U. The project here can offer important information for further studies on enhancing the gene expression using codon optimization in heterogeneous expression system, predicting the genetic and evolutionary mechanisms in R. palmatum.
Introduction
Codon degeneracy is a common phenomenon among living beings as the 20 different amino acids are encoded by 64 types of codons. Most amino acids encoded by two to six codons except for Met or Trp (Duret, 2002; Ang et al., 2016), this phenomenon is defined as synonymous codon. It has been reported that the using frequency of synonymous codon in encoding amino acids is non-random for different genes or genomes, which is regarded as codon usage bias (Romero, Zavala & Musto, 2000). The formation of codon bias can be influenced by multiple forces, such as natural selection, mutational pressure, and random genetic drift (Bentele et al., 2013). Moreover, the codon usage bias may affect gene transcription, protein expression and some other biological processes of protein expression (Behura & Severson, 2013; Powell & Dion, 2015). Performing the codon usage bias analysis and identifying the characteristics of codon usage bias for certain genes or genomes are very significant for comprehending the molecular mechanisms of gene expression and for understanding the long-term molecular evolution in genomes.
Rheum palmatum is an endangered and very important medicinal plant in China. The dried root and rhizomes of R. palmatum (named rhubarb) have been used to treat various diseases like infectious disease, cancer, constipation, and renal disorders in Asian countries (Zalucki, Power & Jennings, 2007). It has been reported that the main bioactive compounds of R. palmatum are anthraquinones (Jang & Kuk, 2018). R. palmatum is mainly distributed in northwest China, and the wild resources of R. palmatum are decreasing rapidly due to the overexploitation of natural resources (Zhou et al., 2014; Wang et al., 2016b). Therefore, it is beneficial for us to understand the anthraquinones biosynthetic pathways based on exploring the codon usage characteristics of R. palmatum and so to protect the wild resources of R. palmatum.
The genomic information of R. palmatum is not determined now. RNA-seq technology is an effective method to introduce transcriptome database, which can provide large numbers of coding sequences (CDS) with non-coding and repetitive sequences excluded. The transcriptome of R. palmatum was assembled with the RNA-seq method and 140,224 unigenes were screened out in our previous study. In this project, we carried out a series of analysis to determine the codon usage patterns of R. palmatum and pointed out the optimal codons. The results are intelligible for us to unify the molecular evolution of R. palmatum and provide some new perspectives to decipher gene function and carry out genetic engineering of R. palmatum in the future.
Materials & Methods
Database preparation
The transcriptome database of R. palmatum used in this project was obtained from our previous research work due to the lack of genomic information. In total, 140,224 annotated unigenes were obtained to analysis the coding DNA sequences (CDS) using the ESTScan (Iseli, Jongeneel & Bucher, 1999) and BLASTx online software (https://blast.ncbi.nlm.nih.gov/Blast.cgi). 14917 CDS were left after analysis by using ESTScan and BLASTx online software. Among these CDSs, the sequences contain correct initiation and termination codons were remained and sequences contain internal termination codons were eliminated by using SelectCDS script (Meier et al., 2017). In additional, only the sequences longer than 100 amino acids in length were hold for further analysis. Finally, 2,626 CDS were left for the downstream codon usage analysis.
Indices of codon usage and codon bias
GC3s is an important parameter for evaluating the frequency of guanine + cytosine at the third synonymously coding position, excluding Met, Trp, and termination codons. The value of RSCU (Relative Synonymous Codon Usage) was calculated by dividing the observed frequency of codon usage by that expected under the situation that all codons encoding the same amino acid are used in the same probability. When the value of RSCU is great than 1 suggests the positive codon bias, and RSCU is smaller than 1 indicates the negative codon bias, whereas the value of RSCU equals 1 that means the codons to be used randomly or equally (Zhang et al., 2017). The values of ENc (Effective Number of Codons) range from 20 to 61, that are used to estimate the codon bias for an individual gene. An ENc value equals to 20 indicates that the amino acid in genes encoded by only one codon, while an ENc value equals to 61 indicates that the absence of codon usage preference (Sharp & Li, 1987). The study has shown that when the ENc value smaller than 36, the gene is affirmed to own strong codon usage preference (Fuglsang, 2006). CAI (Codon Adaptation Index) was often used to evaluate the extent of bias toward codons that were known to be preferred in highly expressed genes. The values of CAI range from 0 to 1.0, and the bigger the value is meaning the most frequently used synonymous codon (Fuglsang, 2008). CAI is calculated using the CAI calculate server (http://genomes.urv.es/CAIcal/).
Neutrality plot analysis
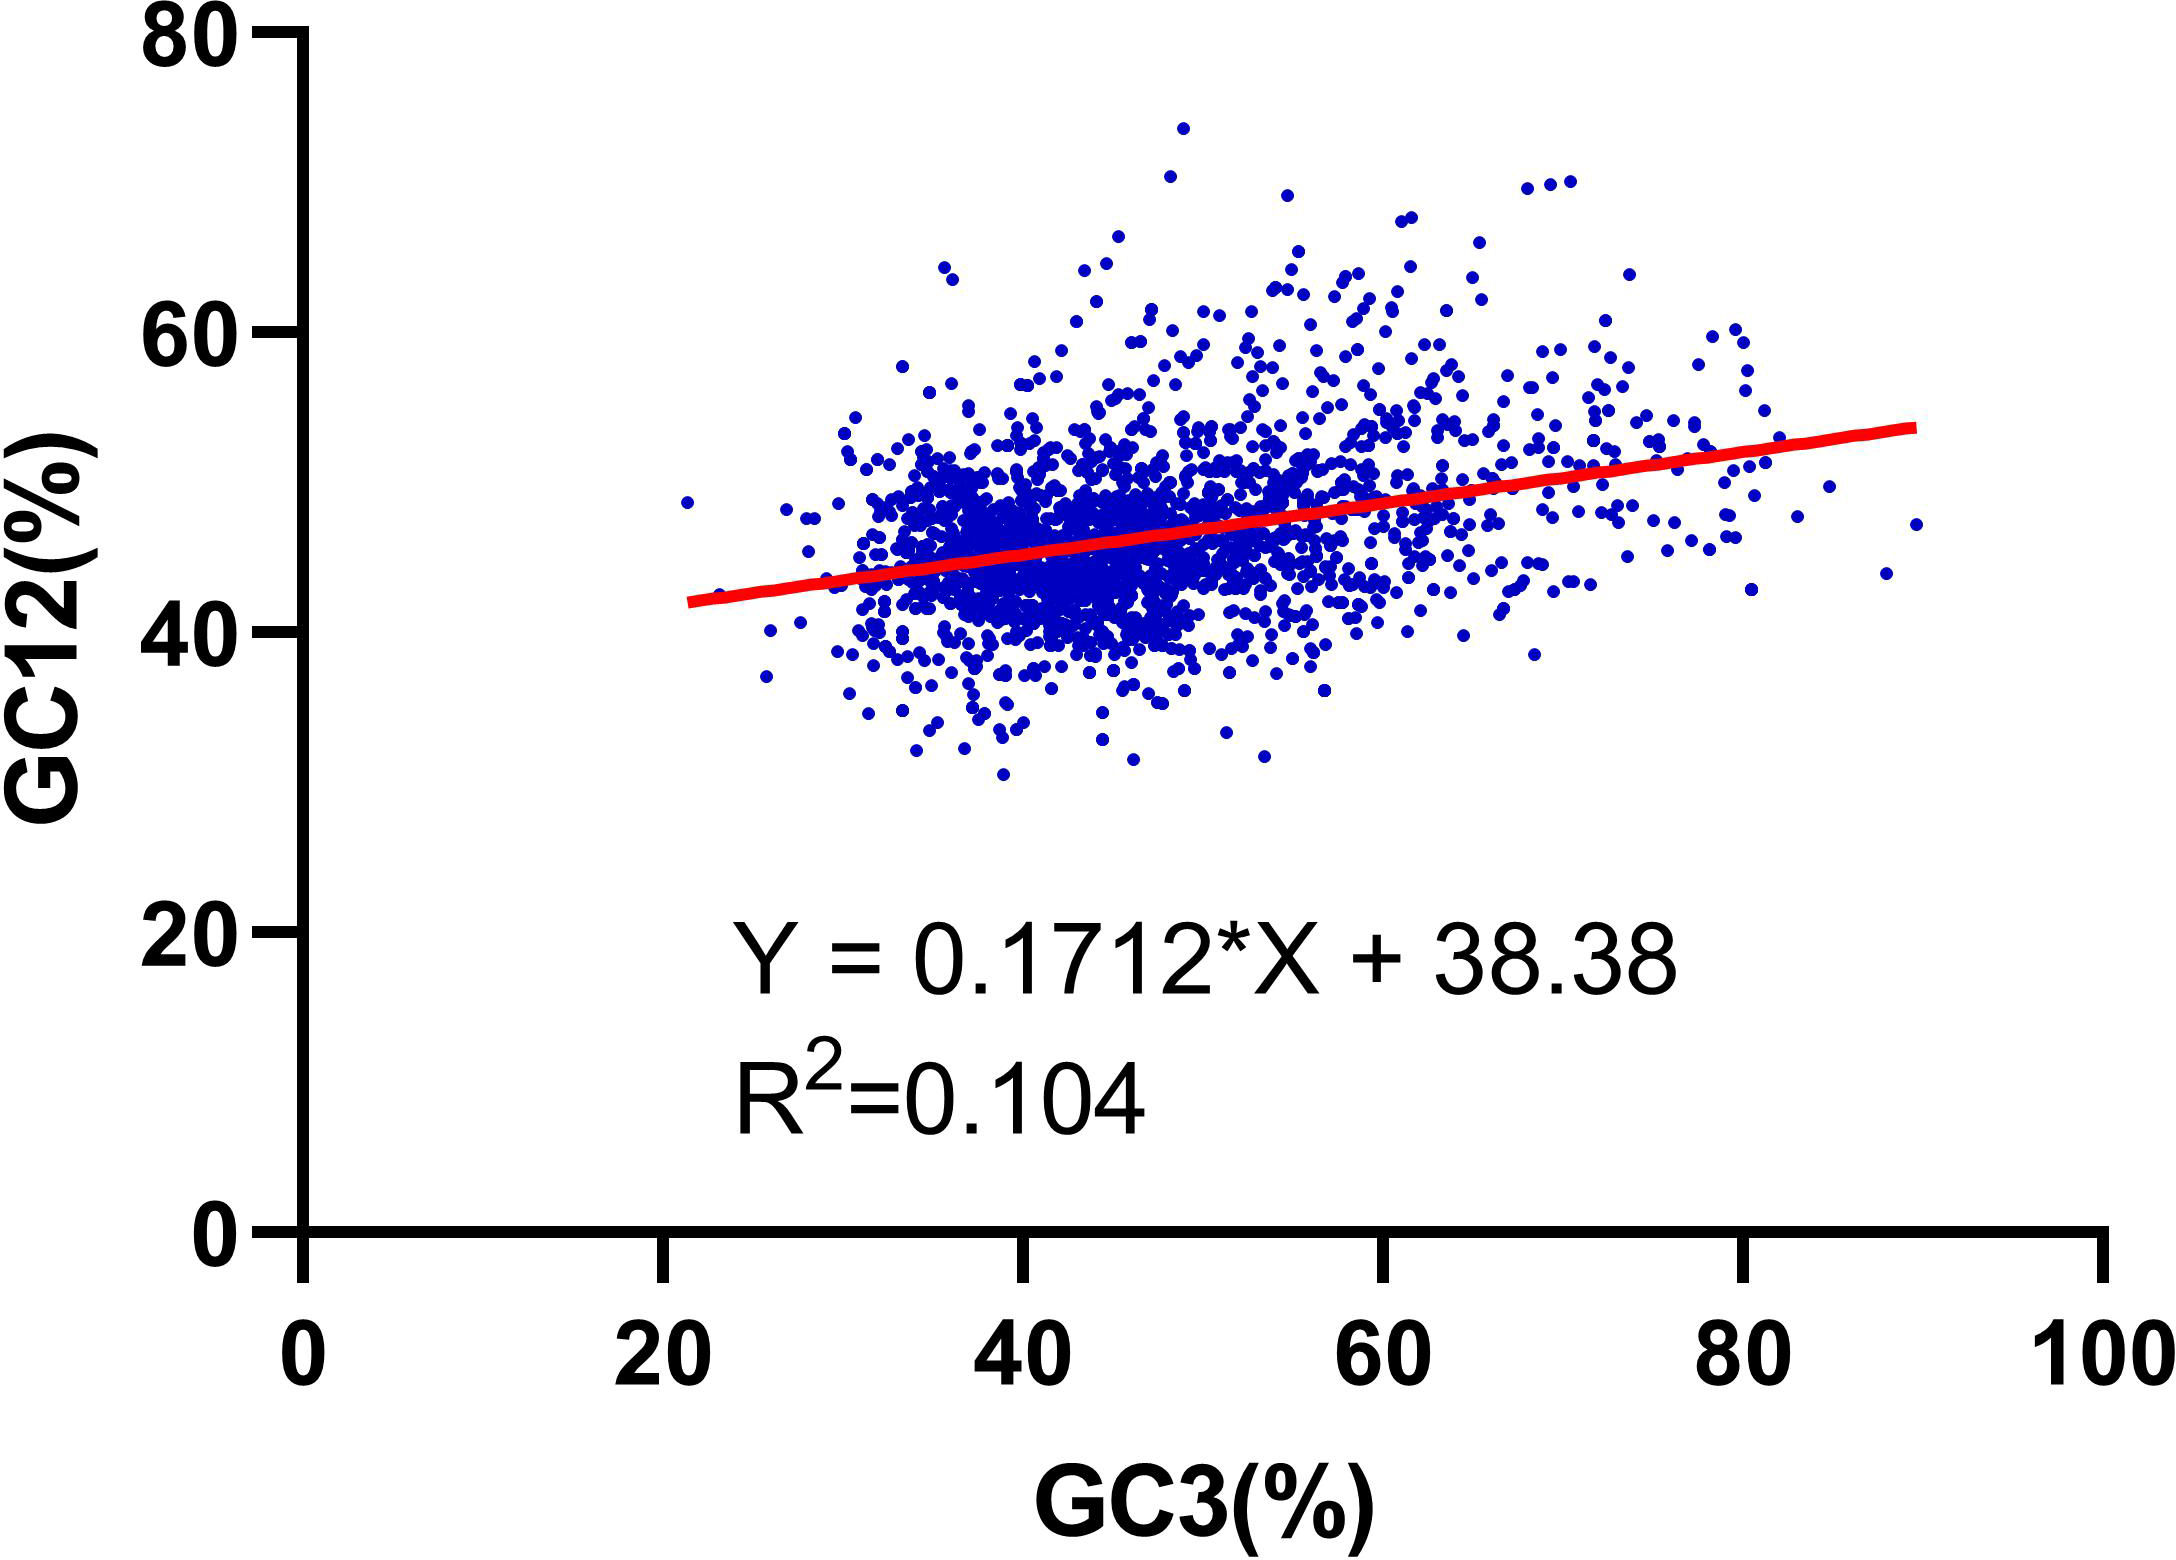
The neutrality plot (GC12 vs GC3) can demonstrate the balance between mutation and selection in shaping codon bias. GC12 represents the average ratio of GC content in the first and second position of the codons (GC1 and GC2), while GC3 stands for the GC content in the third position. If we found a statistically strong correlation between GC12 and GC3, we can suggest that the dominant driving force for the R. palmatum is mutation pressure. Conversely, if there is no correlation between GC12 and GC3, we can see that the dominant driving force for the R. palmatum is natural selection (Sharp & Li, 1987; Sueoka, 1988).
ENc-GC3s plot and PR2-Bias plot analysis
The ENC-GC3s (ENC vs GC3s) plot is usually carried out to exam the codon usage of a certain gene is only affect by mutation or also by other terms such as natural selection. The ENc-GC3s plot is constructed by the abscissa GC3s values and the ordinate ENC values. Furthermore, we calculate an expected curve on the ENc-GC3s plot. If we discover that the corresponding points distribute around expectation curve, we can conclude that the mutation pressure is the independent force in the progress of forming codon bias. If the corresponding points is significantly blow or far from the expected curve, there must be some other factors such as natural selection plays a key role in the formation of codon bias (Sueoka, 1988).
We have obtained the values of frequency of each nucleotide at the third site of codon (A3, U3, C3 and G3) and then performed the Parity Rule 2 bias (PR2-Bias) plot [A3/ (A3 + U3) vs G3/ (G3 + C3)] analysis (Wang et al., 2016a).
Correspondence analysis of codon usage
Correspondence analysis (COA) is a widely accepted approach to determine the multivariate statistical analysis of codon usage patterns. As the genes possess 59 sense codons (61 sense codons in all, but exclude the unique Met and Trp codons), we put all the genes into a 59-dimensional hyperspace in the plot. The method can explore the major trend in codon usage variation among R. palmatum CDS and distributes the codons in axes with these trends based on RSCU values (Sueoka & Kawanishi, 2000).
Determination of optimal codons
We get the top and bottom 5% of genes based on the CAI values as the high and low dataset, respectively. Then we get the mean RSCU values of the two gene groups, respectively. Finally, we carried out the Chi-squared contingency test to confirm the optimal codons. The usage frequency of certain codons that was remarkably higher in genes with high expression levels than that genes with low expression levels (p < 0.01) were regarded as optimal codons (Sau et al., 2005).
Results
Nucleotide composition of R. palmatum and codon bias
We performed the nucleotide composition of 2,626 CDS in R. palmatum as the nucleotide content can affect the codon bias seriously (Nie et al., 2014). Among the 2,626 CDS in R. palmatum, the nucleotide content of A varies from 1.58% to 58.90%, with a mean value of 30.42%, the frequency of T is 5.89%–43.89%, with an average value of 23.48%, the proportion of G is 6.52%– 52.44%, with a mean value of 21.03%, the ratio of C is 4.49%–53.27%, with a mean value of 24.46%. To further understand the impact of nucleotide contents of R. palmatum genes on codon bias, we also calculated the GC contents and GC3. The results demonstrated that the GC contents of all genes ranged between 40% and 50% (Fig. 1). The mean value of GC proportion was 46.57%, which indicated that the genes in R. palmatum are richer in AT contents than that of GC. The ratio of GC1, GC2 and GC3 was 51.33%, 41.38 and 46.60, respectively, which testified that the proportion of GC1 was highest, and the contents of GC2 was very similar to that of GC3.
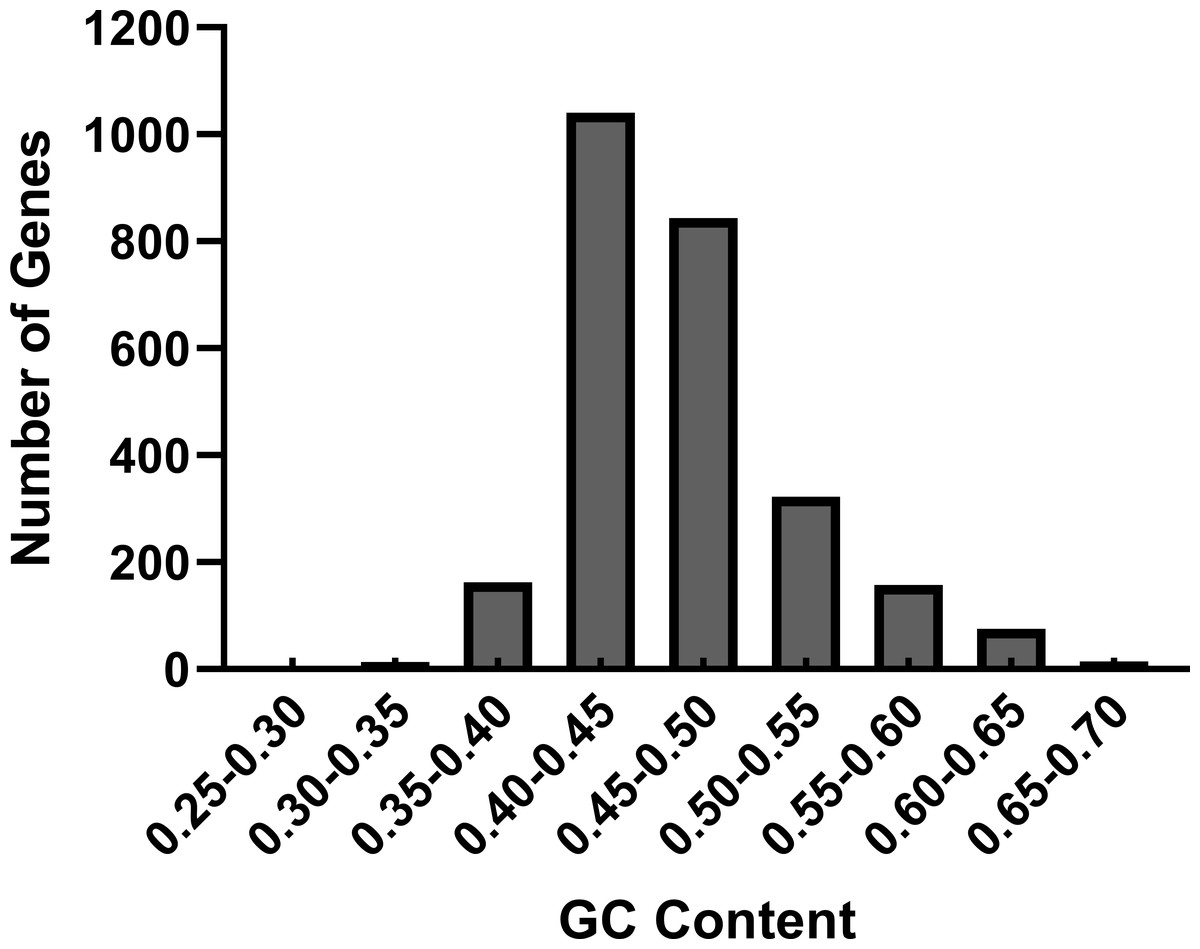
Figure 1: The distribution of GC contents in the CDS of R. palmatum.
We further performed the relationship analysis between GC12 and GC3 using the neutrality plots (GC12 against GC3) method. The content value of GC3 varied from 21% to 89%. The results shown that the slopes of the regression lines (regression coefficient) were 0.171 (Fig. 2), verifying that the dominant force of the codon bias was natural selection in the RNA-seq data of R. palmatum, rather than mutation pressure.

Figure 2: Neutrality plot analysis of the GC12 and that of the third codon position (GC3) for the entire coding DNA sequence of R. palmatum.
The effect of RSCU and ENC on codon bias
The ENC values in R. palmatum range from 30.83 to 61.00, with a mean value of 52.83. From the ENC values we can see that only 9 genes show a high codon bias with an ENC value smaller than 35. The results suggested that there is a common random codon usage in R. palmatum genes, without a strong codon bias preference. In addition, the RSCU values of 59 sense codons also indicates that the genes in R. palmatum are with a weak codon bias preference. As shown in the Table 1, more than half of the codons (30/59), marked in bold, are used frequently.
| AA | Codon | RSCU | AA | Codon | RSCU | AA | Codon | RSCU | AA | Codon | RSCU |
|---|---|---|---|---|---|---|---|---|---|---|---|
| Phe | UUU | 1.07 | Ser | UCU | 1.5 | Tyr | UAU | 1.1 | Cys | UGU | 0.32 |
| UUC | 0.93 | UCC | 0.93 | UAC | 0.9 | CGC | 0.57 | ||||
| Leu | UUA | 0.7 | UCA | 1.27 | His | CAU | 1.27 | CGA | 0.64 | ||
| UUG | 1.43 | UCG | 0.52 | CAC | 1.98 | CGG | 0.58 | ||||
| CUU | 1.42 | Pro | CCU | 1.49 | Gln | CAA | 1.52 | AGA | 1.76 | ||
| CUC | 0.92 | CCC | 0.69 | CAG | 1.42 | AGG | 1.69 | ||||
| CUA | 0.6 | CCA | 1.25 | Asn | AAU | 1.26 | Ser | AGU | 0.89 | ||
| CUG | 0.93 | CCG | 0.57 | AAC | 0.94 | AGC | 0.89 | ||||
| Ile | AUU | 1.31 | Thr | ACU | 1.31 | Lys | AAA | 1.18 | Gly | GGU | 1.12 |
| AUC | 0.92 | ACC | 0.9 | AAG | 1.63 | GGC | 0.79 | ||||
| AUA | 0.77 | ACA | 1.26 | Asp | GAU | 1.21 | GGA | 1.23 | |||
| Val | GUU | 1.47 | Ala | GCU | 1.55 | GAC | 0.61 | GGG | 0.85 | ||
| GUC | 0.76 | GCC | 0.82 | Glu | GAA | 1.18 | |||||
| GUA | 0.65 | GCA | 1.17 | GAG | 1.24 | ||||||
| GUG | 1.12 | GCG | 0.46 |
Notes:
The preferentially used codon s are displayed in bold.
The role of GC3s in the codon bias formation
We performed the ENC-plot here to distinguish the influence of GC3s in shaping codon bias of R. palmatum. As we can see from the Fig. 3, most of the R. palmatum genes were distributed far from the expected ENC-plot curve, only a few genes are were distributed around this curve. The result suggested that the mutational pressure is not the only factor in shaping the codon bias, other factors such as translational selection may play an important role in the formation of codon bias.
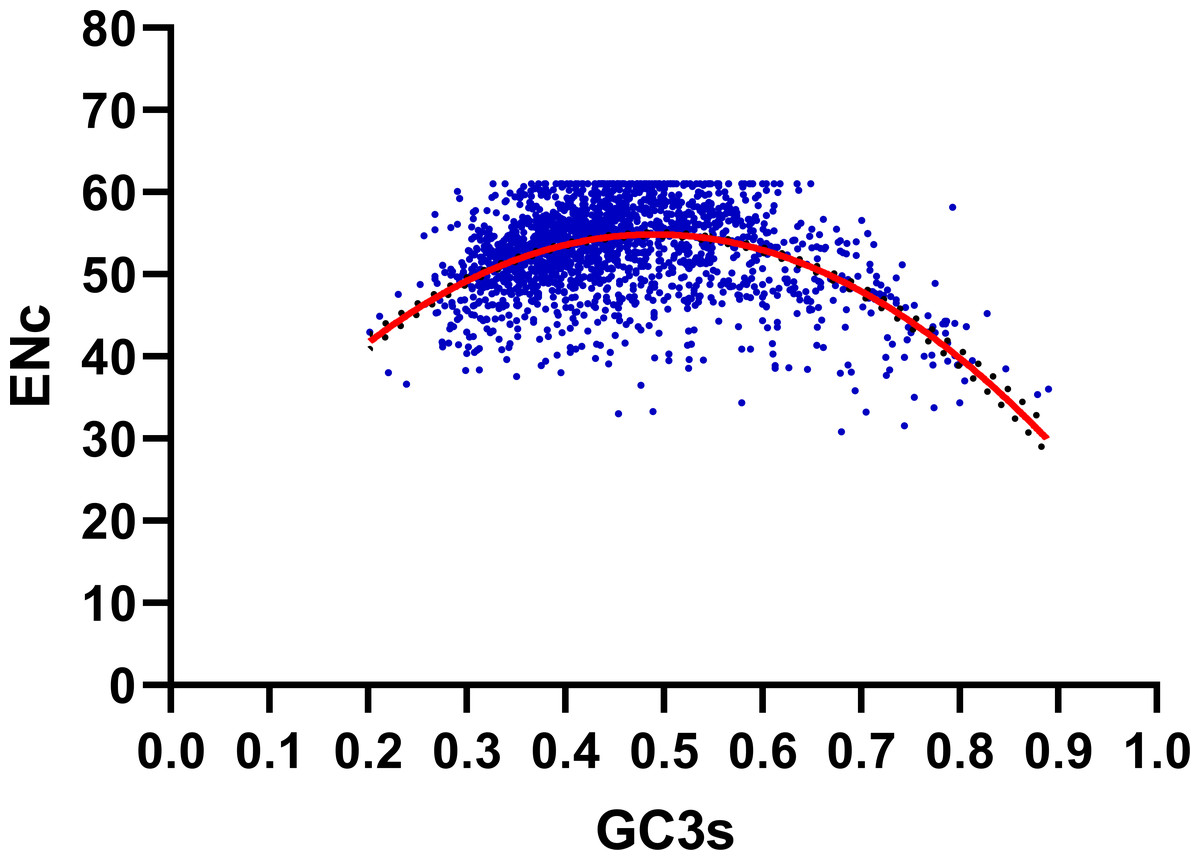
Figure 3: ENC-GC3 plot.
The solid line represents the expected curve when codon usage bias is only affected by mutation pressure.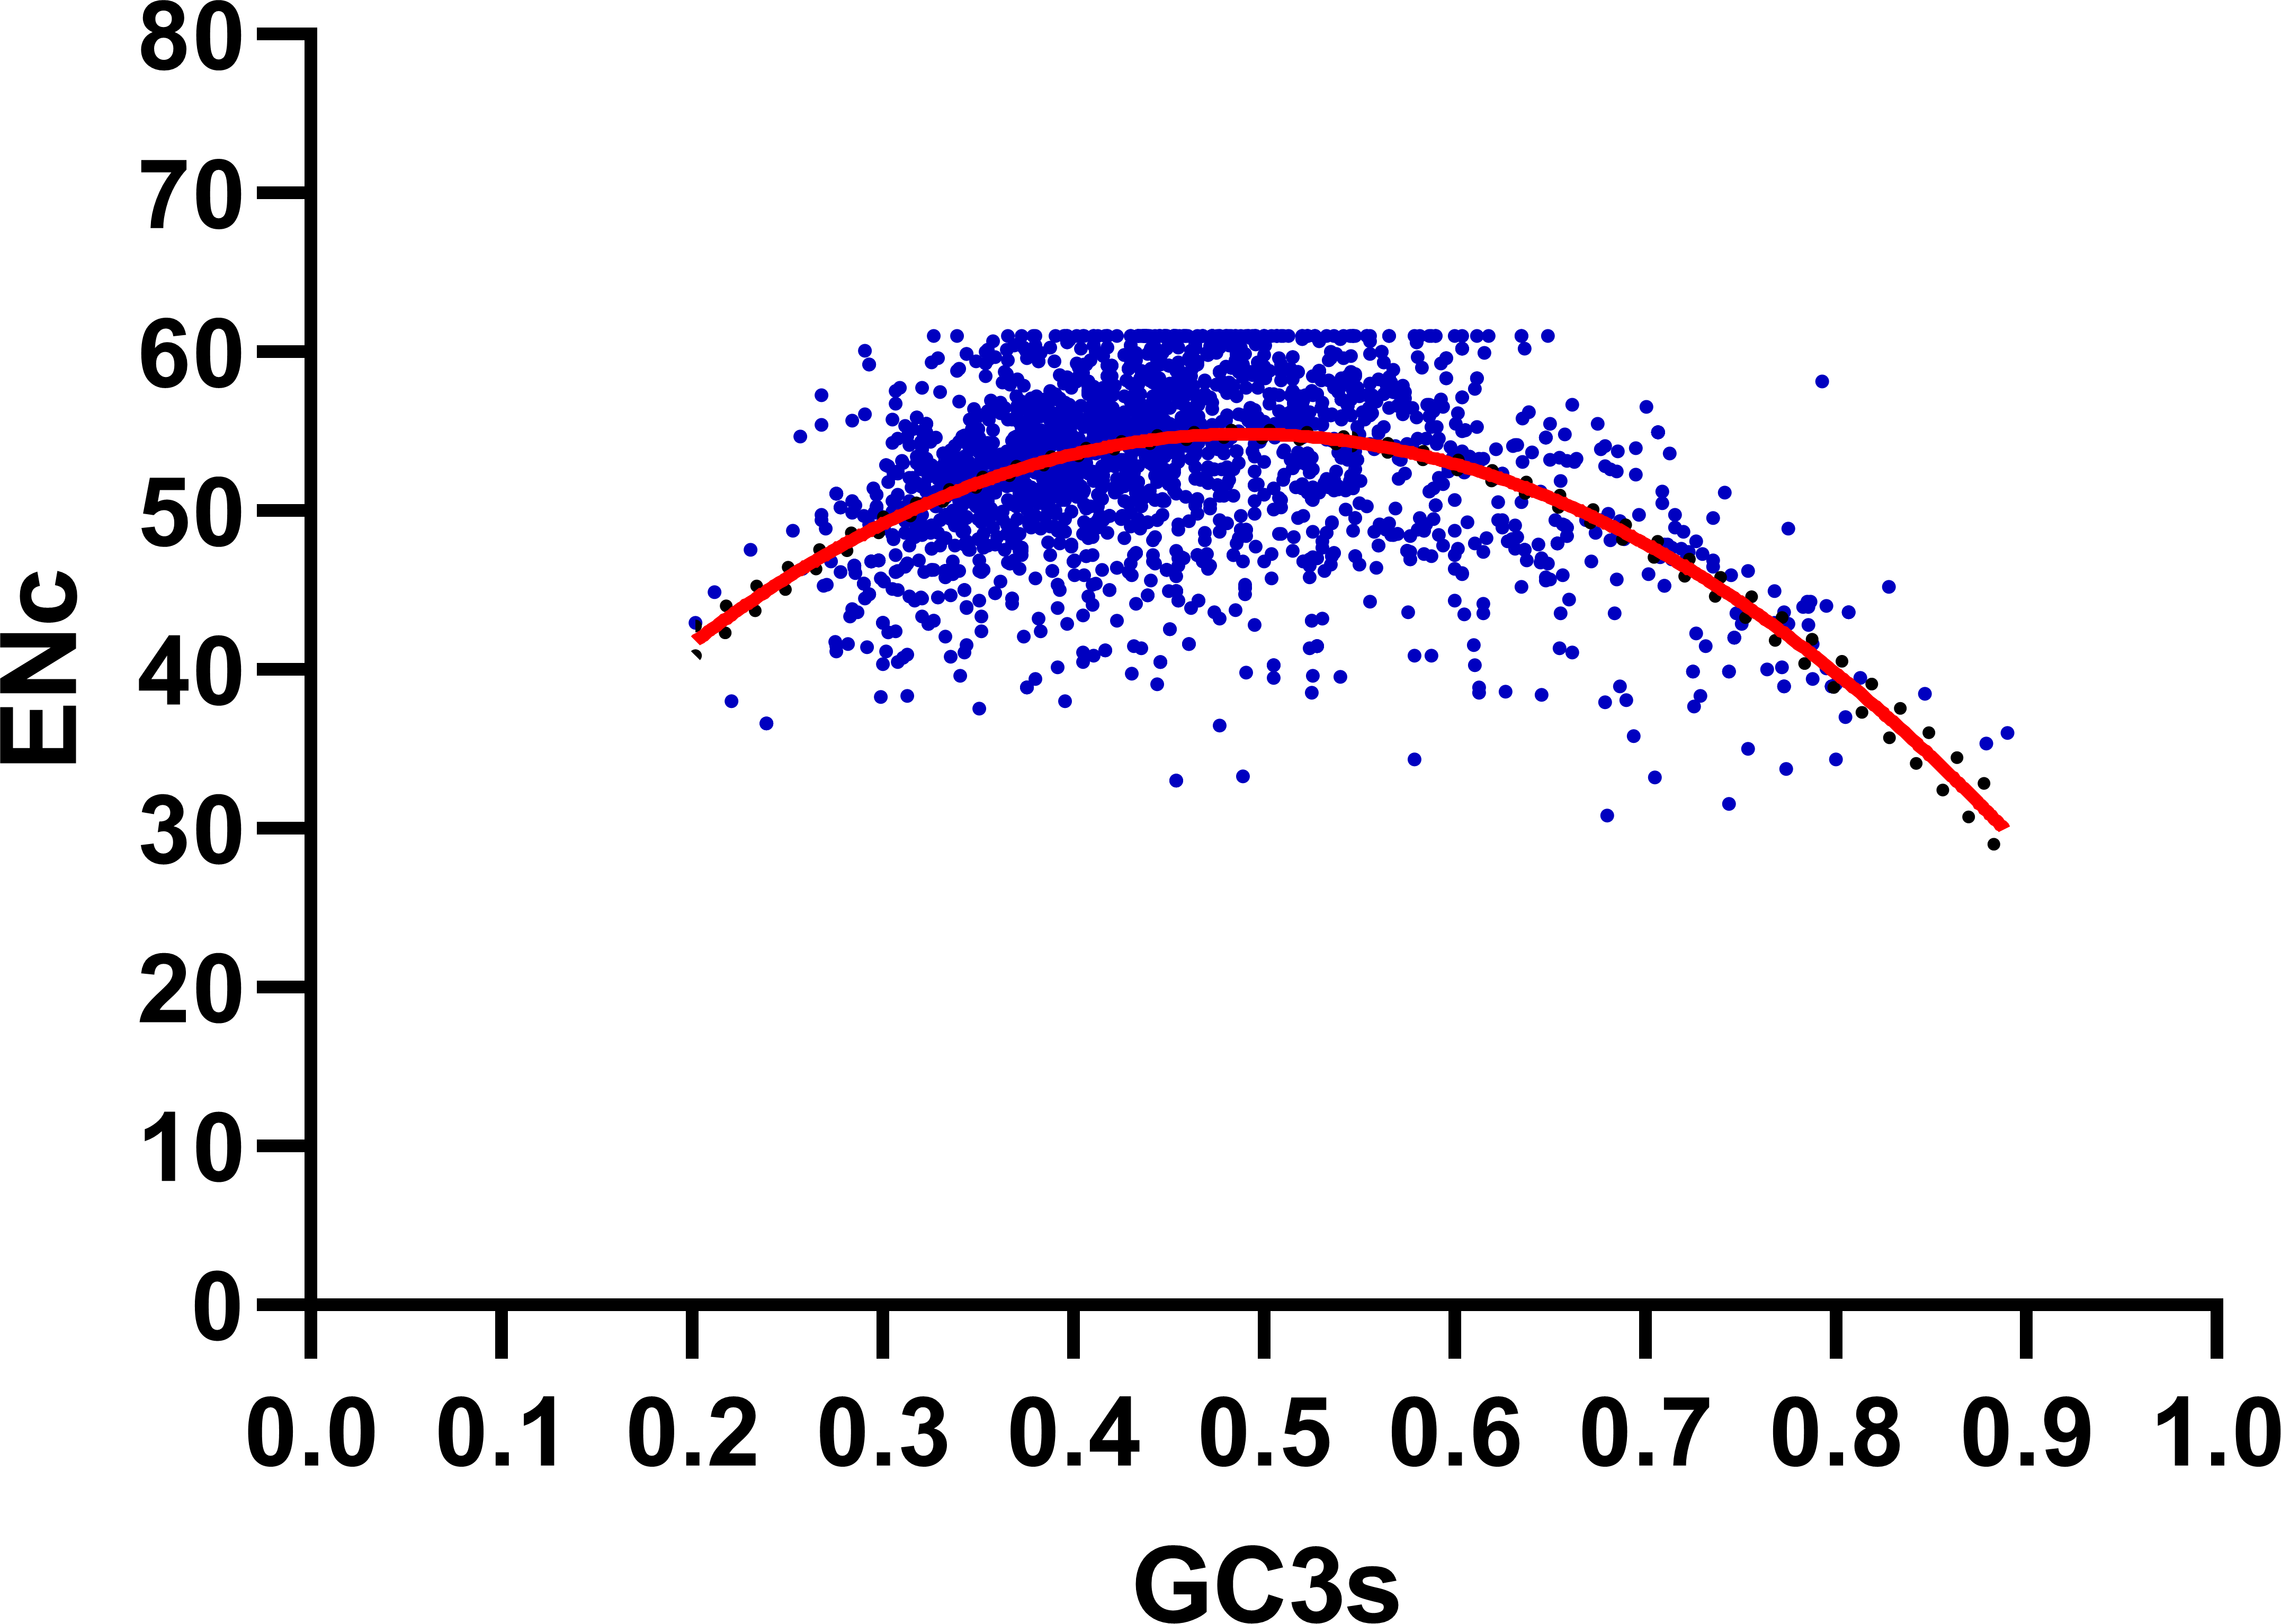
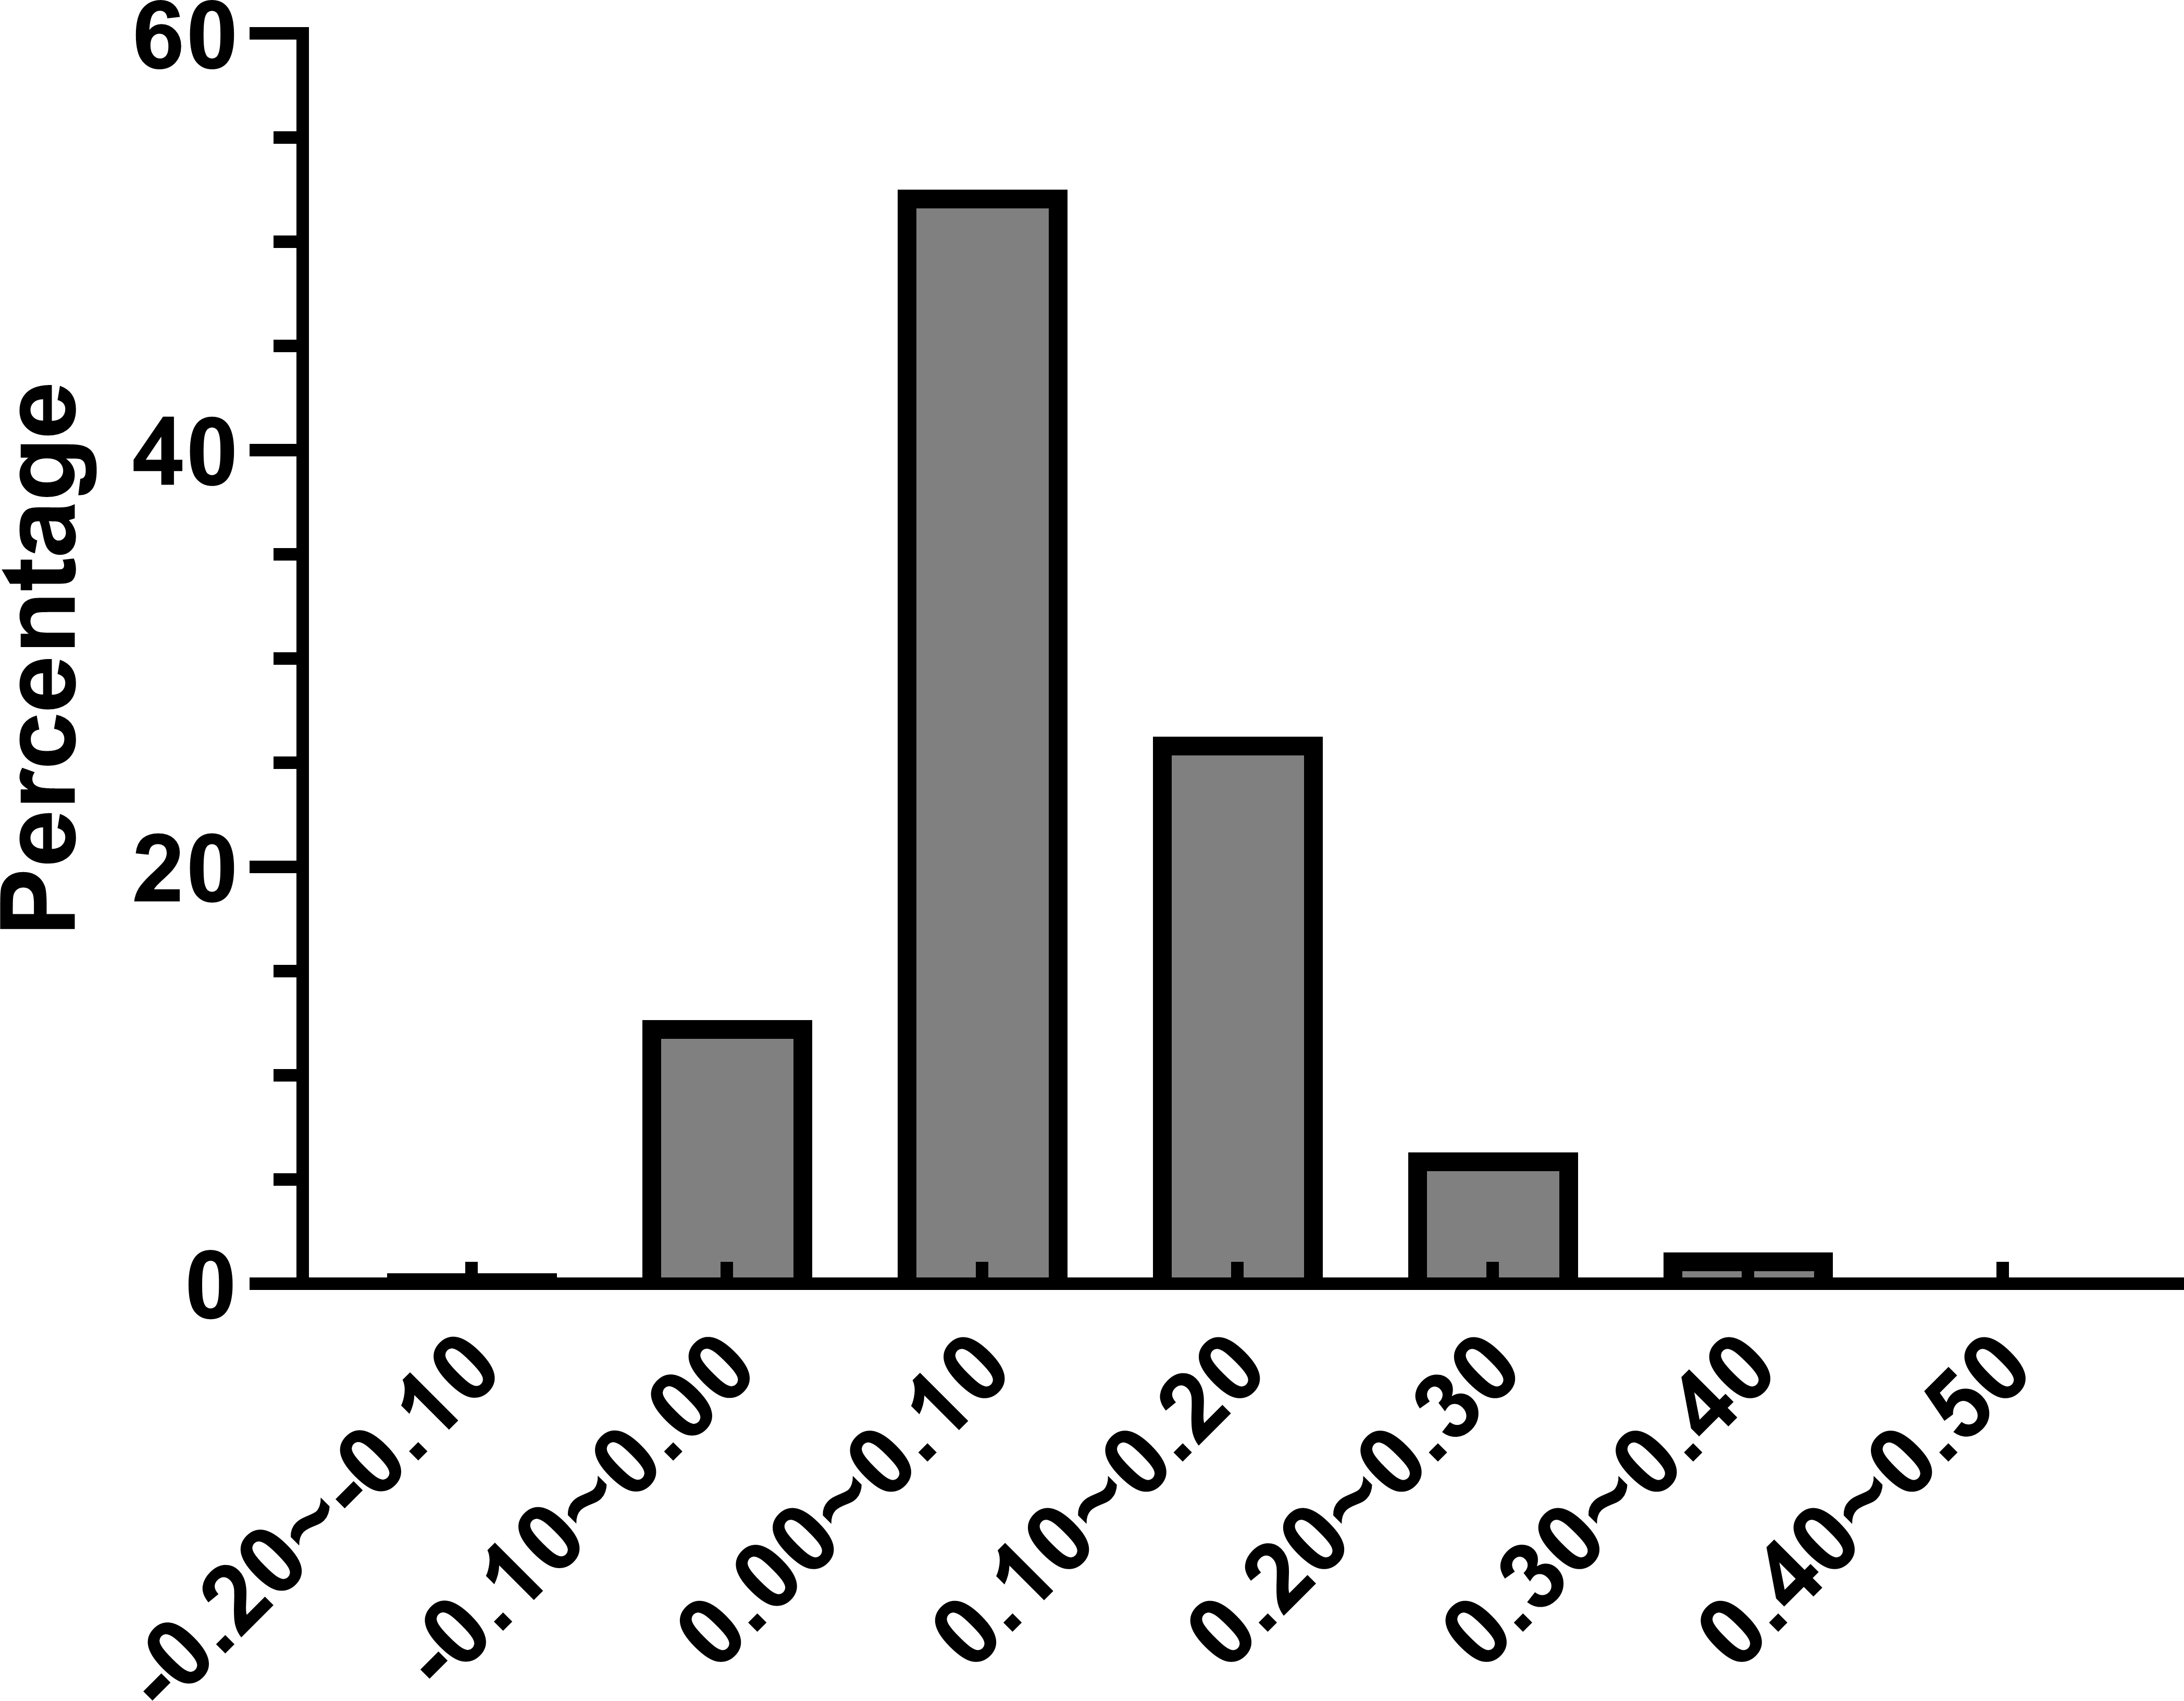
Further we calculated (ENCexp-ENCobs)/ENCexp for all the genes in R. palmatum to discriminate the difference between observed and expected ENC values (Sinclair & Choy, 2002). As shown in Fig. 4, (ENCexp-ENCobs)/ENCexp values for most genes were within 0.00–0.10 which indicated that the most expected ENC values were bigger than actual ENC values. The values of GC3s affected the results of ENC value according to the calculation formula of expected ENC. The distribution frequency of (ENCexp-ENCobs)/ENCexp values was consistent with the results that have been shown in Fig. 3, which suggested that the different values of GC3s can affect the result of codon bias. Taken together, the results provide more evidences that GC3s play as a conditional mutational bias.

Figure 4: Frequency distribution of (ENCexp-ENCobs)/ENCexp.
Correspondence analysis
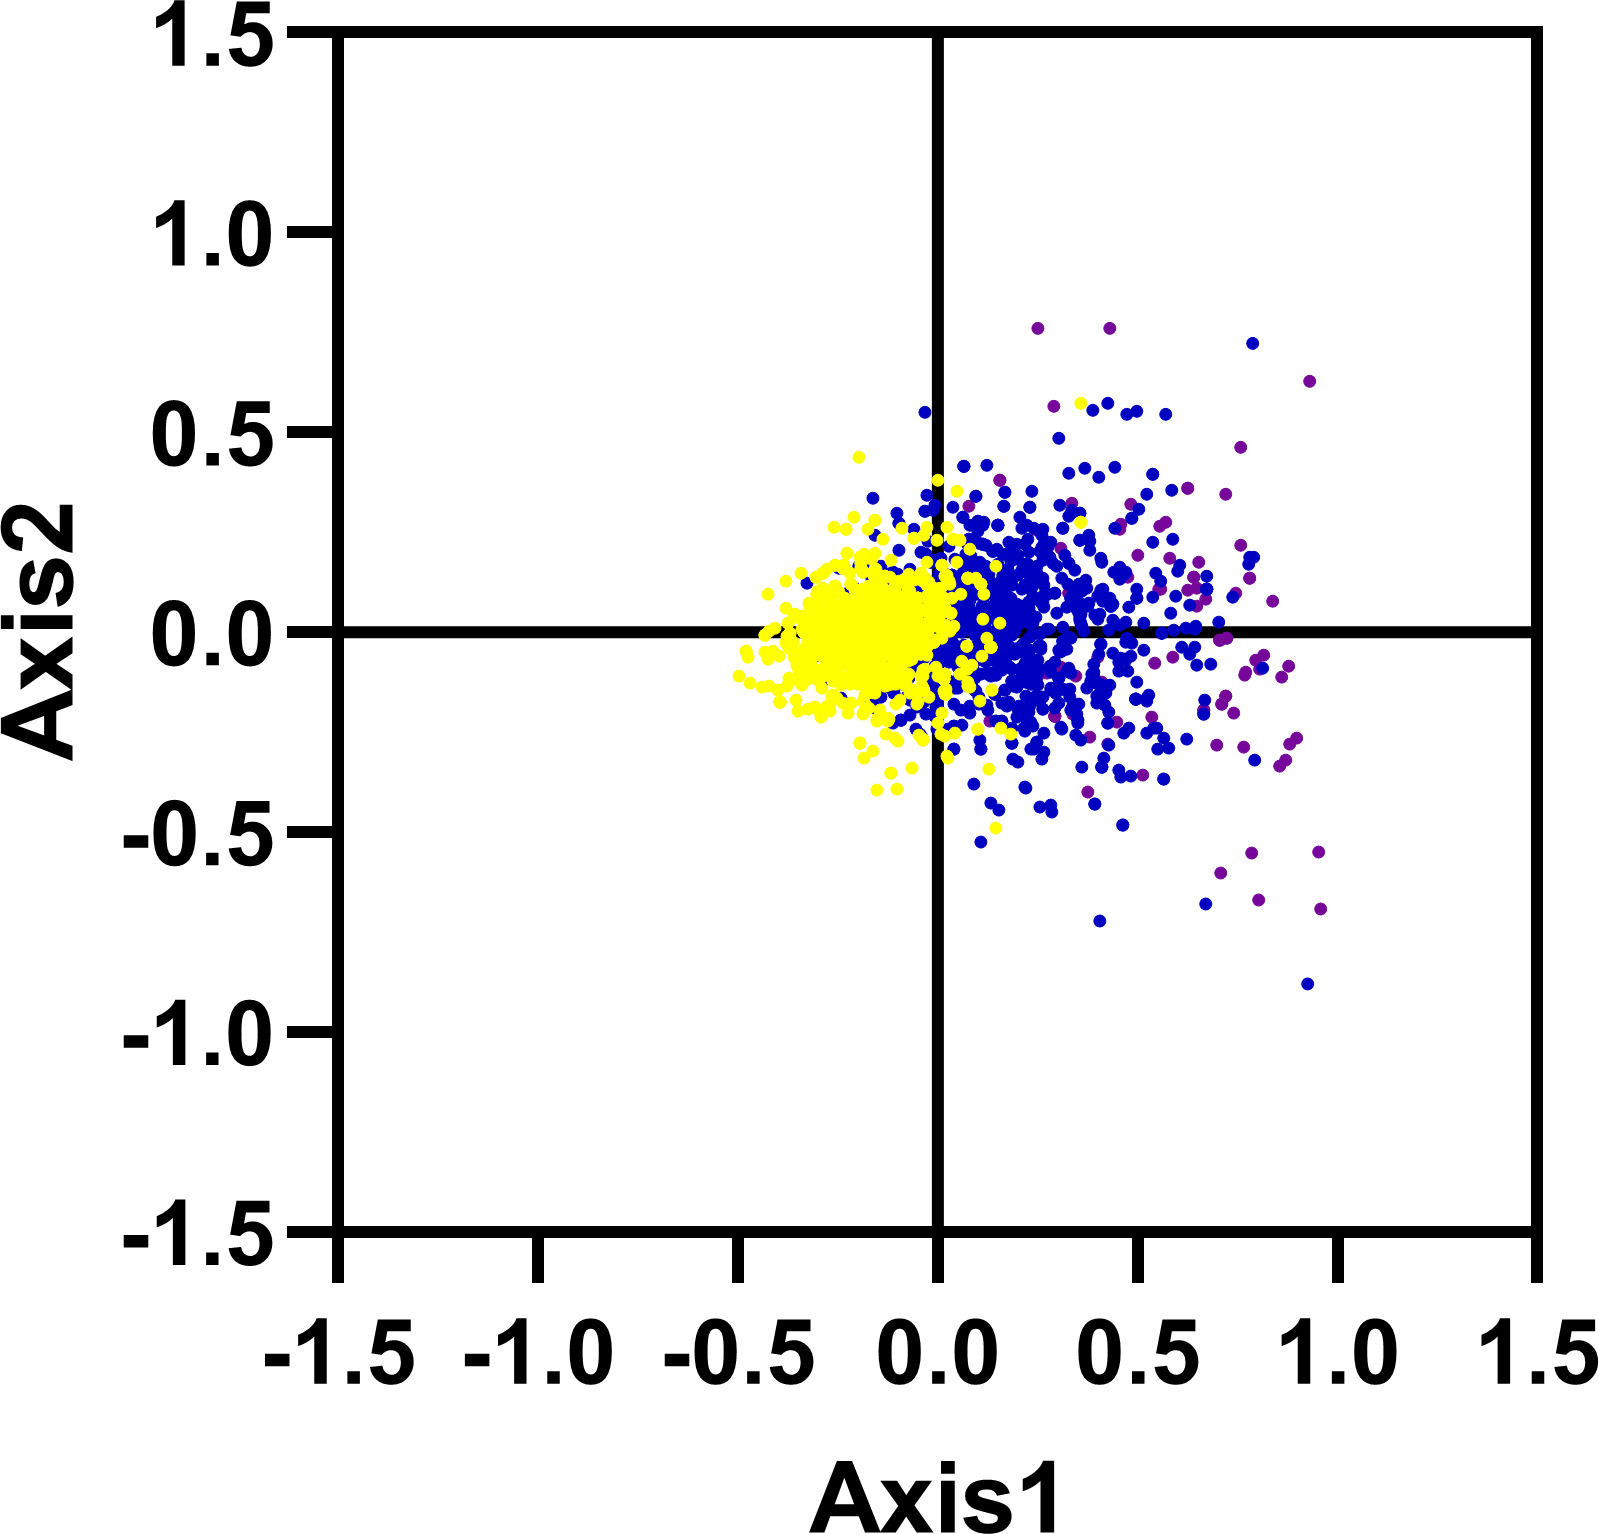
We carried out the correspondence analysis based on the RSCU values of all genes from R. palmatum. The result has shown that the Axis 1 and Axis 2 were two main contributors which contribute 11.53% and 6.38% of the total variance, respectively. As shown in Fig. 5, the position of the genes on the plane defined by the first two axes. Moreover, to check the role of GC content in shaping codon bias, the GC content of genes was higher than 60% marked with purple color, the GC content was between 45% and 60% marked with blue color, the GC content was below 45% marked with yellow color, respectively. As shown in Fig. 5, the red dots were separated along the primary axis, the blue and green dots located in the middle of the plot.
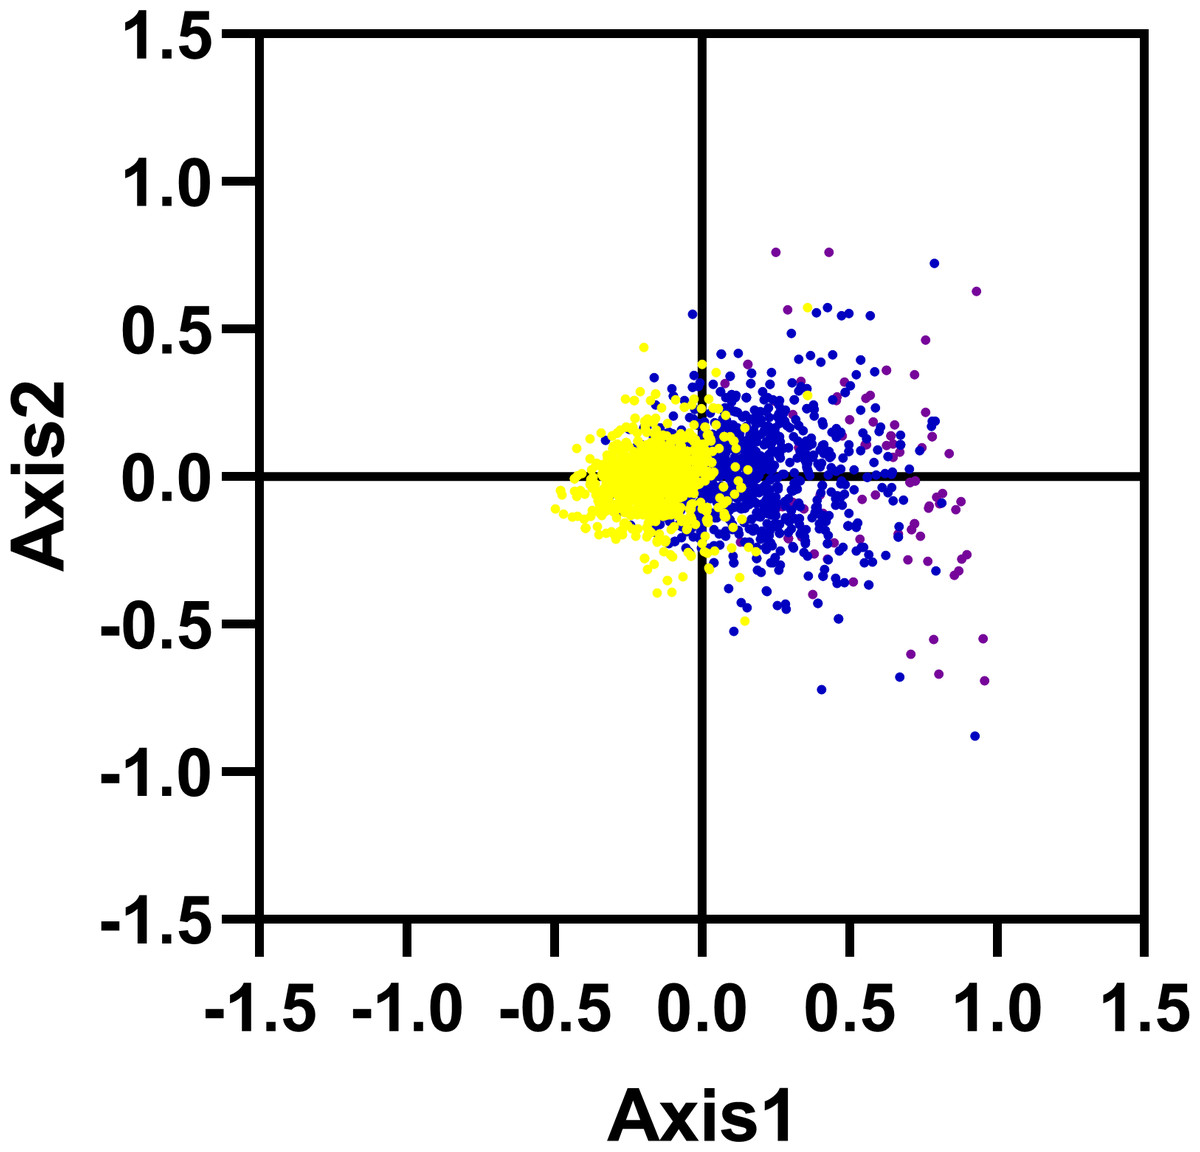
Figure 5: Correspondence analysis of codon usage bias: genes with GC content higher than 60%, within 45%–60% and lower than 45% were plotted as red, blue and green dots, respectively.
In addition, we have calculated the correlations among the six important parameters including Axis 1, GCall, GC3, GCall, ENC and CAI (Table 2). The parameter Axis 1 exhibited significant correlations with other four parameters such as GC12, GC3, GCall and CAI (r = 0.458, r = 0.931, r = 0.687, r = 0.260; p < 0.001), indicating that the codon bias of R. palmatum genes were influenced by two main factors including mutational pressure and translational selection.
C/T to A/G balance analysis in third codon
The previous studies about the effect of mutation pressure on codon bias have been reported that AU and GC come in pairs at third codon positions (Wright, 1990). However, our results suggest that the frequency of A3 and U3 (or G3 and C3) are different in R. palmatum genes. Estimating the proportion of GC and AT pairs in genes can offer more details about the effect of the forces on the codon bias formation. We carried out a Parity Rule 2 (PR2) plot analysis to determine whether there exist biases R. palmatum genes. As shown in Fig. 6, most of the points were distributed between 0.2 and 0.8 in the plot which suggesting that there is a low bias in either G3/C3 or A3/T3 in R. palmatum. In addition, the plot was divided into four quadrants taking 0.5 as the center on both axes. We found that there are more points in the fourth quadrant (the ratio of G3/GC3 and A3/AT3 > 0.5) than other three quadrants. The second quadrant contained the fewest points. All the results obtained above suggested that there is a slight significant preference for A and G at the third codon position of the R. palmatum genes. Therefore, there were some other forces like translational selection playing roles in the formation of codon bias.
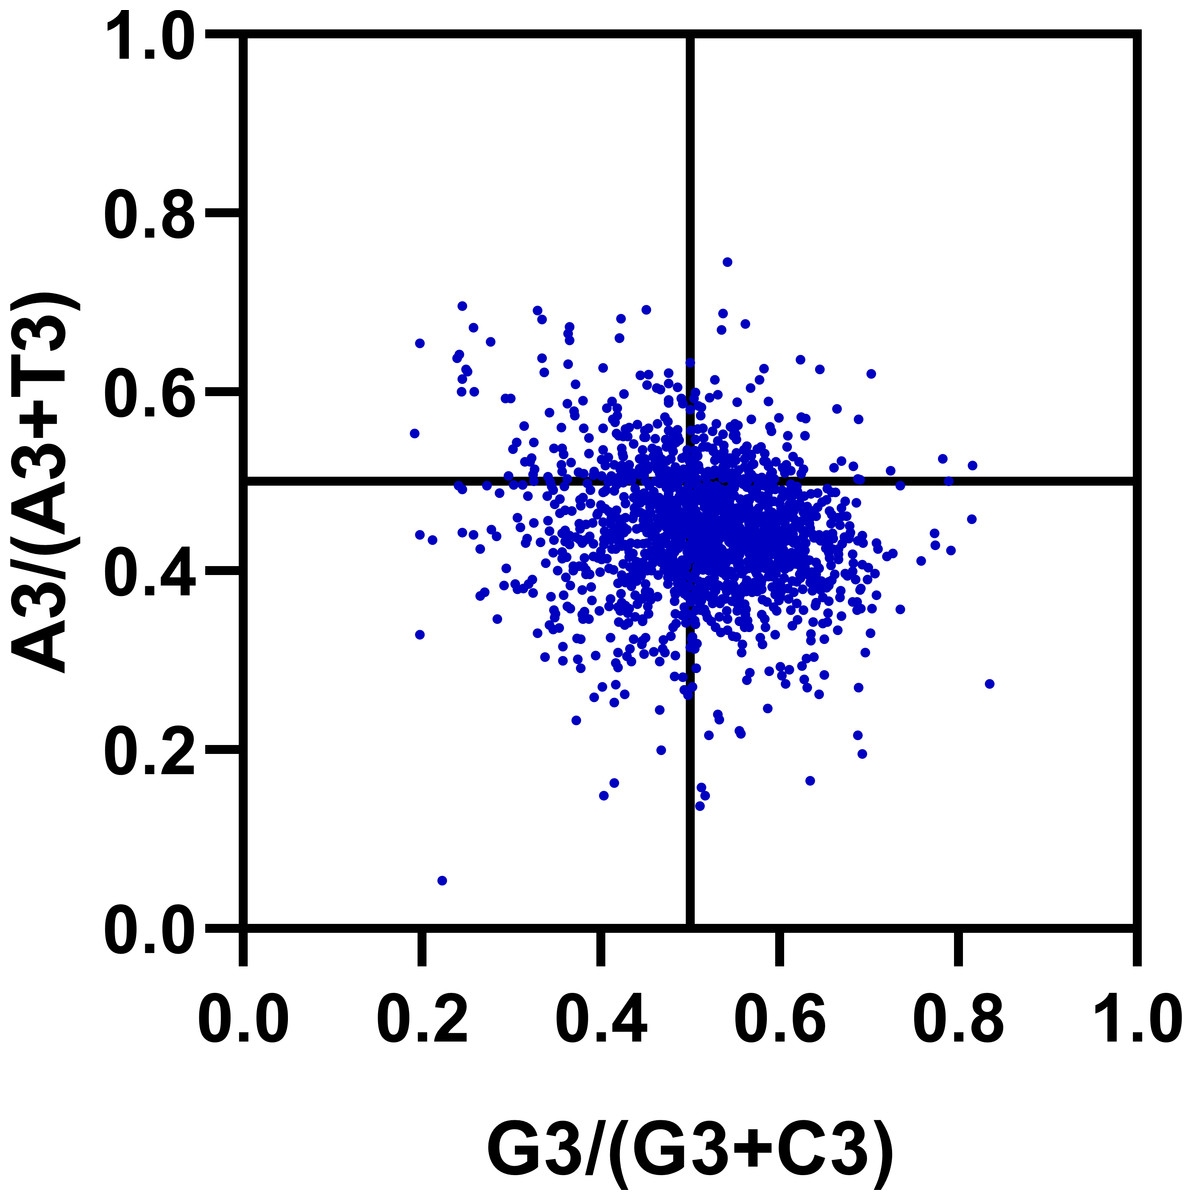
Figure 6: PR2-bias plot.
Using the values of A3/(A3 + U3) against G3/(G3 + C3).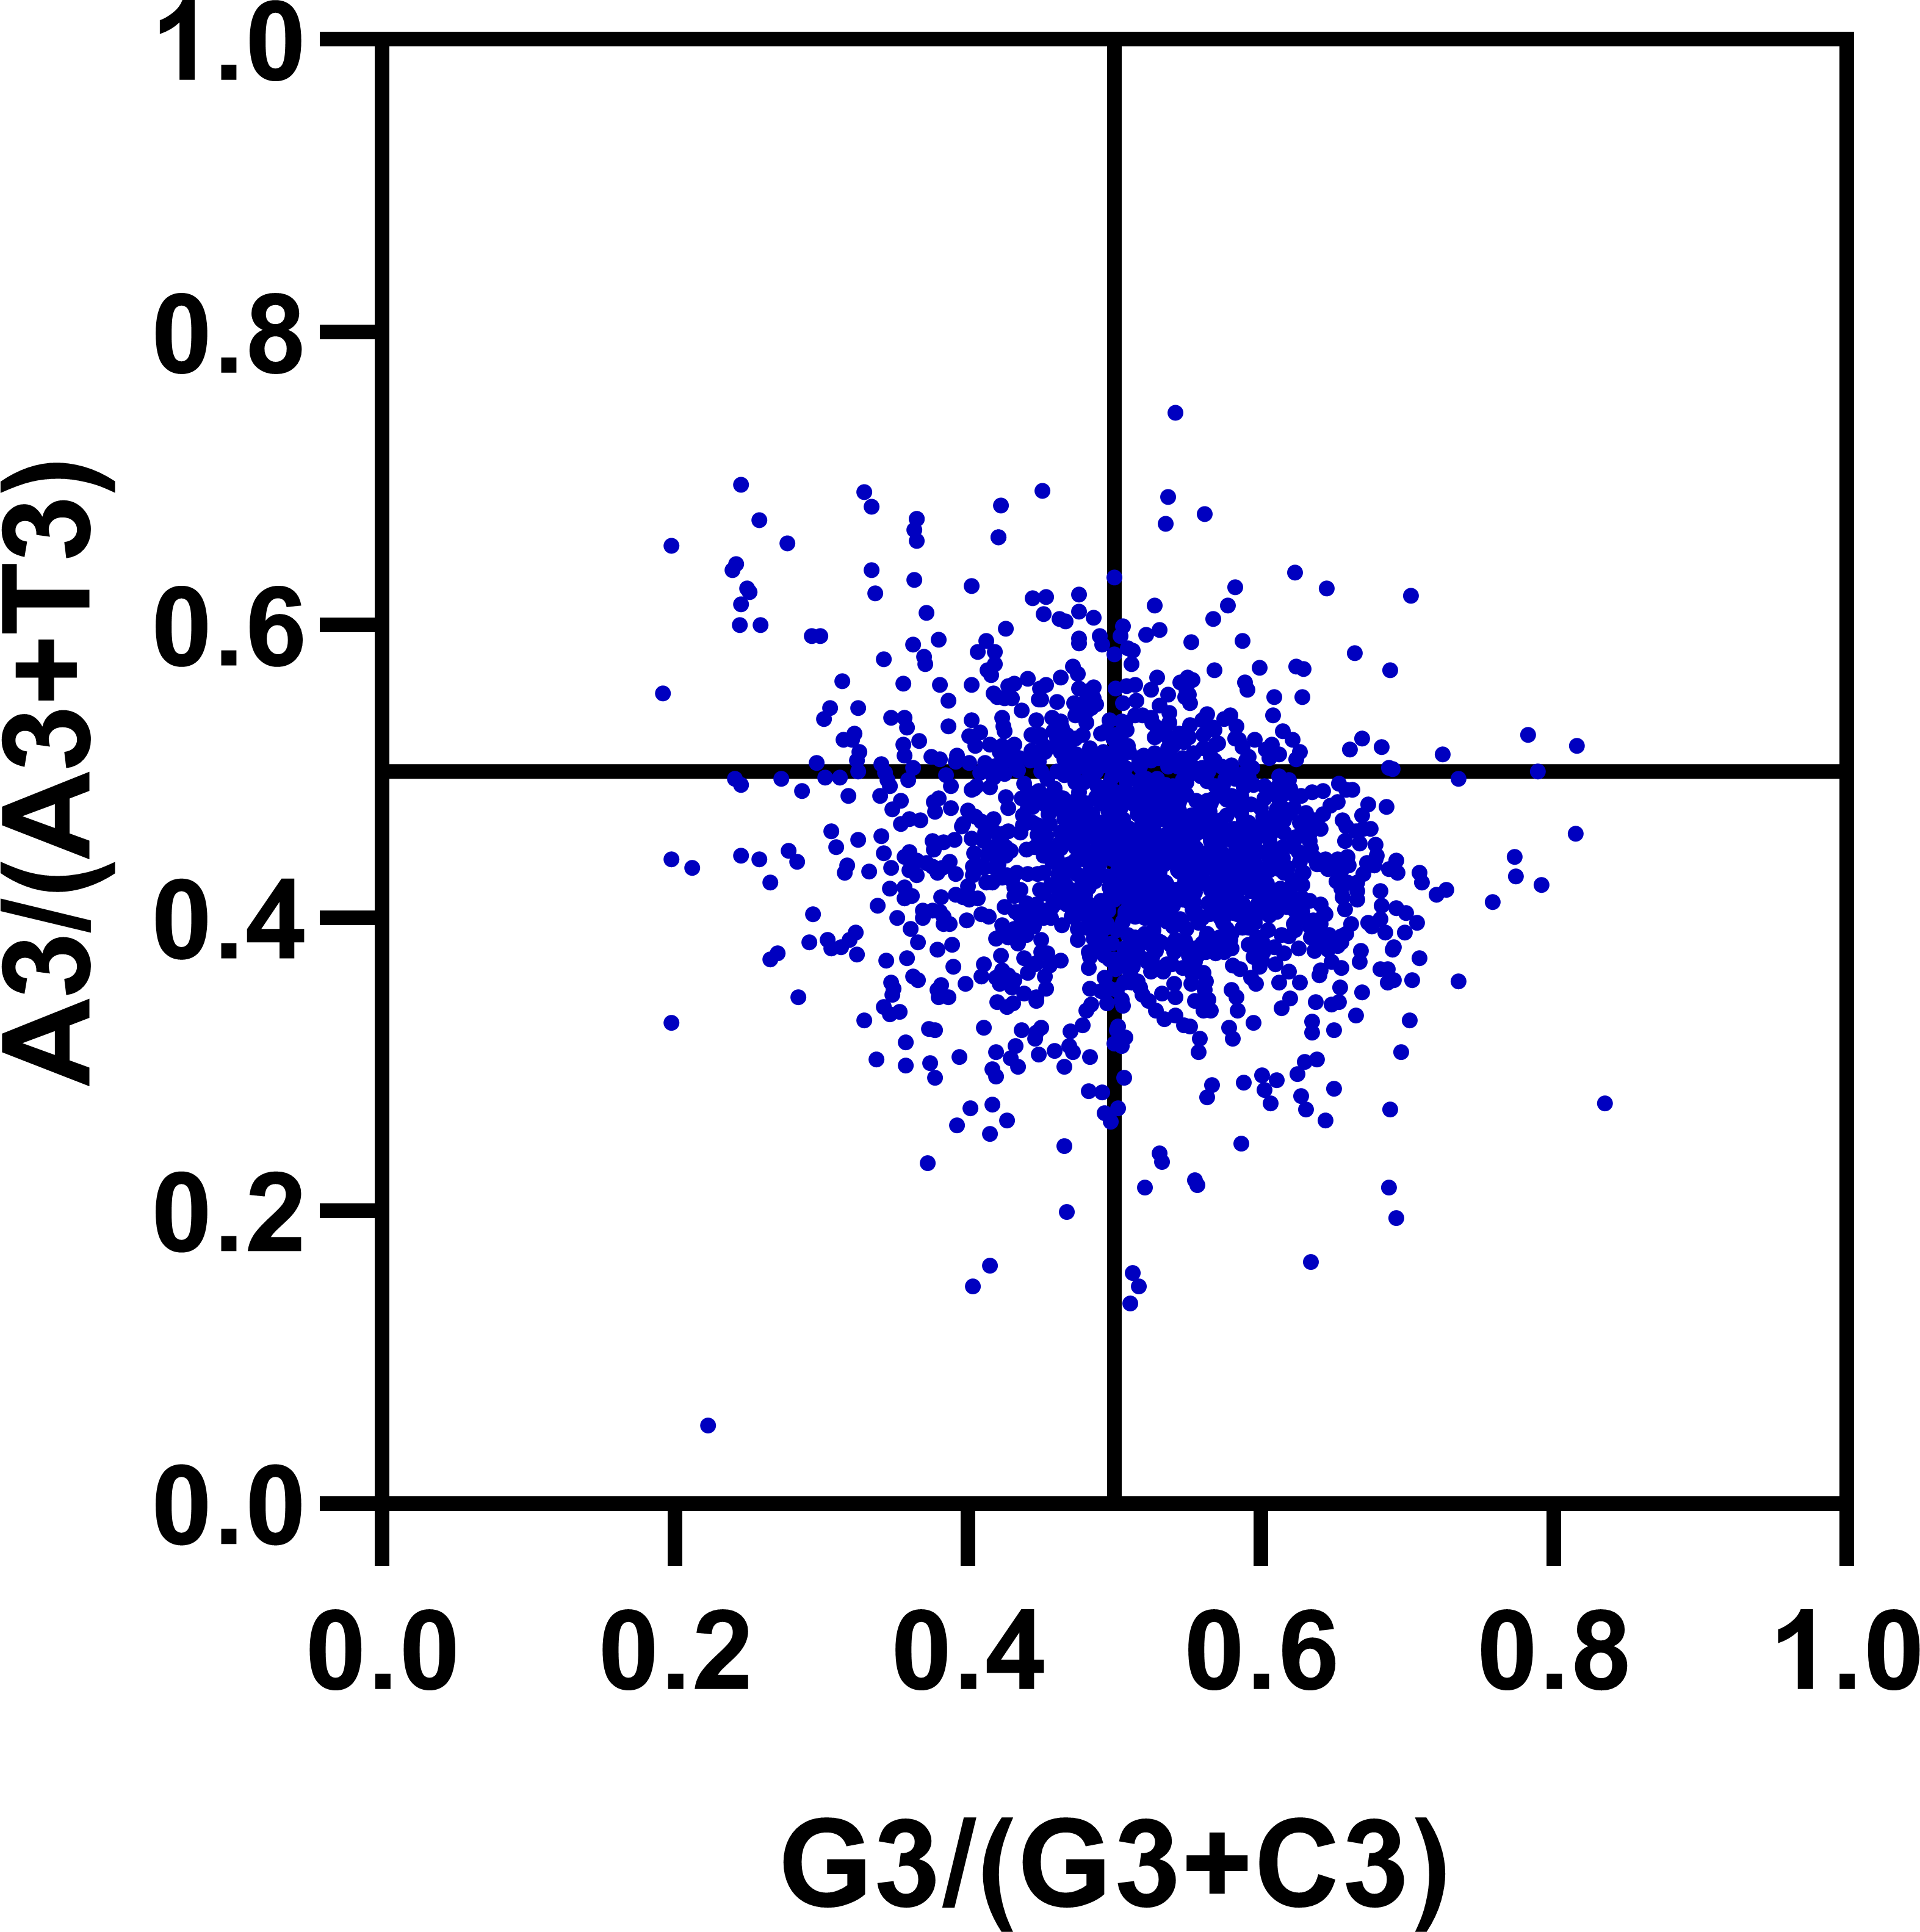
Effects of gene expression level
To determine the effect of gene expression level in shaping codon bias, we performed correlation coefficients analysis between the codon adaptation index (CAI) values and index values of the genes including ENC, GC3, GC12 and GCall content (Guan et al., 2018). As shown in Fig. 7 and Table 2, the index CAI values indicated a significantly negative correlation (r = −0.054, p < 0.001) with the ENC values, and showed a remarkable positive correlation with GC3 (r = 0.232, p < 0.001), GC12 (r = 0.059, p < 0.001) and GCall (r = 0.176, p < 0.001) content.

Figure 7: Neutrality plot (ENC vs. CAI).
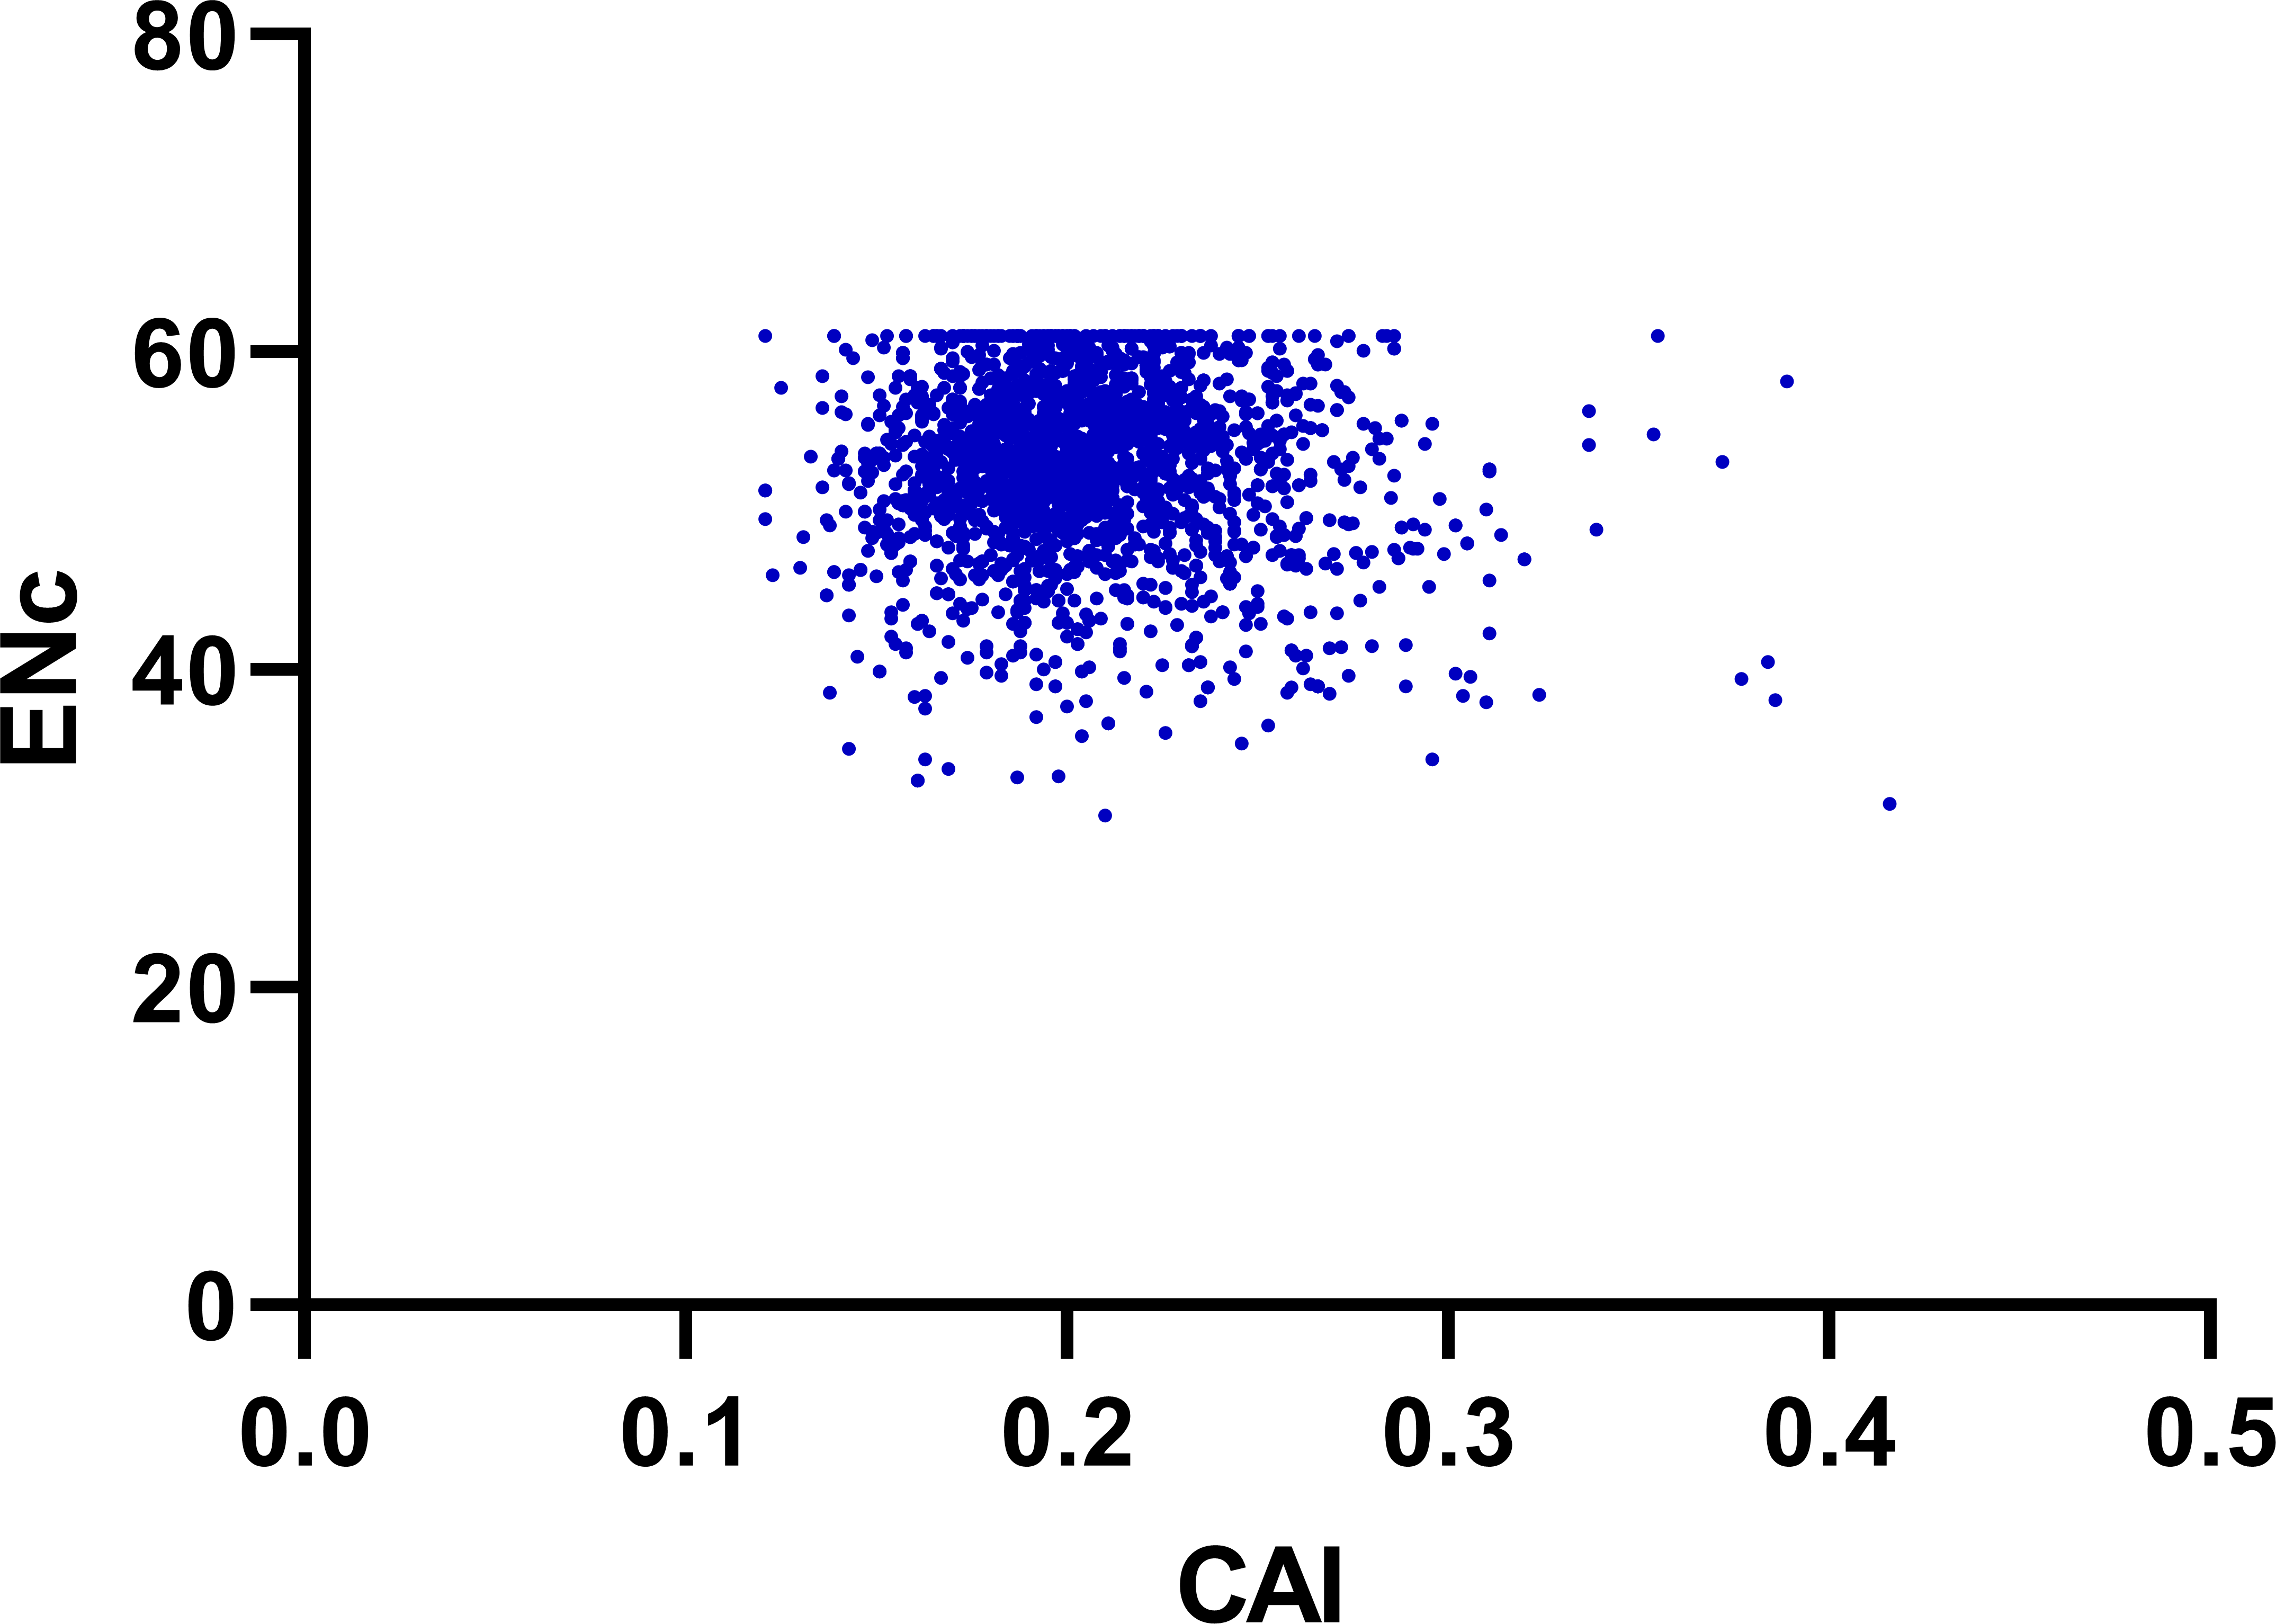
Determination of optimal codons for R. palmatum
We carried out a two-way Chi-squared contingency test to compare the codon usage among different genes. The highly- and lowly- expressed data of the genes based on average RSCU values were list in the Table 3. As shown in Table 3, 28 optimal codons were figured out and most of the optimal codons ended with A or U, except UUG for Leu. All the amino acids were coded by different codons such as Leu possess four codons and Ser possess three codons, Ile, Val, Arg, Ala, Thr and Pro all identified by two codons and others amino acids were all defined by only one codon. The results above indicated that the R. palmatum genes were preferred to A/U-ending synonymous codons which was inconsistent with Triticum aestivum (Zhang et al., 2007), Oryza sativa (Liu et al., 2004) and Zea mays (Liu et al., 2010) that preferred to G/C-ending synonymous. Our result was consistent with the study of codon usage patterns in Lonicera macranthoides which was also biased to A/U-ending synonymous codons (Liu et al., 2019).
| Amino acid |
Codon | High | Low | Amino acid |
Codon | High | Low | ||||
|---|---|---|---|---|---|---|---|---|---|---|---|
| RSCU | N | RSCU | N | RSCU | N | RSCU | N | ||||
| Phe | UUU* | 1.33 | 1118 | 0.42 | 265 | Ser | UCU* | 1.83 | 1103 | 0.77 | 338 |
| UUC | 0.67 | 567 | 1.58 | 986 | UCC | 0.58 | 349 | 1.98 | 873 | ||
| Lys | AAA* | 0.98 | 1149 | 0.47 | 290 | UCA* | 1.62 | 976 | 0.51 | 225 | |
| AAG | 1.02 | 1193 | 1.53 | 956 | UCG | 0.24 | 146 | 1.13 | 500 | ||
| Cys | UGU* | 1.46 | 621 | 0.49 | 146 | AGU* | 1.11 | 669 | 0.38 | 166 | |
| UGC | 0.54 | 229 | 1.51 | 449 | AGC | 0.62 | 373 | 1.24 | 548 | ||
| Leu | UUA* | 1.14 | 631 | 0.25 | 110 | Pro | CCU* | 1.92 | 829 | 0.73 | 339 |
| UUG* | 1.55 | 861 | 0.88 | 388 | CCC | 0.39 | 167 | 1.34 | 619 | ||
| CUU* | 1.60 | 884 | 0.67 | 294 | CCA* | 1.55 | 666 | 0.49 | 228 | ||
| CUC | 0.46 | 257 | 2.56 | 1132 | CCG | 0.14 | 62 | 1.43 | 660 | ||
| CUA* | 0.59 | 325 | 0.37 | 162 | Asn | AAU* | 1.37 | 1231 | 0.50 | 260 | |
| CUG | 0.66 | 365 | 1.28 | 564 | AAC | 0.63 | 562 | 1.50 | 787 | ||
| Asp | GAU* | 1.52 | 1708 | 0.70 | 489 | Trp | UGG | 1.00 | 412 | 1.00 | 383 |
| Ile | AUC | 0.67 | 444 | 1.84 | 790 | Thr | ACU* | 1.74 | 846 | 0.62 | 247 |
| AUA* | 0.81 | 542 | 0.46 | 199 | ACC | 0.52 | 252 | 1.82 | 731 | ||
| AUU* | 1.52 | 1010 | 0.70 | 301 | ACA* | 1.55 | 752 | 0.49 | 195 | ||
| Met | AUG | 1.00 | 967 | 1.00 | 676 | ACG | 0.19 | 90 | 1.08 | 432 | |
| Tyr | UAU* | 1.36 | 779 | 0.31 | 126 | Ala | GCU* | 1.73 | 1023 | 0.70 | 491 |
| UAC | 0.64 | 365 | 1.69 | 689 | GCC | 0.42 | 250 | 1.80 | 1260 | ||
| Gly | GGU* | 1.30 | 724 | 0.53 | 338 | GCA* | 1.70 | 1005 | 0.45 | 318 | |
| Val | GUU* | 1.75 | 1045 | 0.65 | 337 | GCG | 0.14 | 83 | 1.05 | 738 | |
| GUC | 0.51 | 304 | 1.42 | 735 | Gln | CAA* | 1.15 | 846 | 0.63 | 287 | |
| GUA* | 0.77 | 463 | 0.28 | 146 | CAG | 0.85 | 626 | 1.37 | 619 | ||
| GUG | 0.97 | 579 | 1.65 | 858 | Arg | CGU* | 0.78 | 244 | 0.41 | 115 | |
| TER | UAA | 1.11 | 49 | 1.09 | 48 | CGC | 0.23 | 71 | 1.45 | 407 | |
| UAG | 0.68 | 30 | 0.68 | 30 | CGA | 0.39 | 124 | 0.60 | 167 | ||
| UGA | 1.20 | 53 | 1.23 | 54 | CGG | 0.21 | 67 | 1.24 | 347 | ||
| His | CAU* | 1.50 | 750 | 0.48 | 169 | AGA* | 2.71 | 852 | 0.68 | 191 | |
| CAC | 0.50 | 249 | 1.52 | 540 | AGG | 1.68 | 529 | 1.62 | 452 | ||
Notes:
- RSCU
-
Relative Synonymous Codon Usage
- High/Low
-
highly- and lowly-expressed datasets
- N
-
number of codons
Codon usage was compared using a chi-square test to identify optimal codons.
Discussion
A lot of theories have supposed to clarify the origin of codon usage bias. The two main theories are neutral theory and the “selection–mutation–drift” model (Sharp & Li, 1986; Bulmer, 1988). Based on the neutral theory, the mutations occur in coding positions must be mutate neutral, thus lead to random selection of synonymous codons, while according to the “selection–mutation–drift” pattern, codon usage bias only informed the balance between selection favoring optimal codons and mutation–drift allowing persistence of non-optimal codons (Sharp & Li, 1986). In the genes with high expression levels, the selection makes a significant role in shaping the codon usage bias, while in the genes with low expression levels mutation–drift plays important role in determining codon usage (Kliman & Hey, 1994). But with the appearance of genome information of more species, it seems that these two theories are not enough to prove the characteristics of codon usage anymore. For example, in Oryza sativa codon usage is the result of nucleotide composition and expression level of each gene, as well as CDS length (Liu et al., 2004). In our study, the factors involved in shaping R. palmatum codon usage bias include the GC content, expression level of genes and natural selection as well as mutation pressure.
A previous study has found that there was no significant correlation between codon usage bias and gene expression level in mammals, which was inconsistent with our result that the codon bias in R. palmatum genes was also influenced by gene expression level (Karlin & Mrázek, 1996). But in rice, the genes with high expression levels always have strong variation in codon usage that is consistent with our results which indicates that the highly expressed genes are preferred to GC-rich in codon usage (Liu et al., 2004).
Previous studies have found that codon usage bias is not affected by nucleotide composition in Chlamydomonas reinhardtii (Naya et al., 2001) and Echinococcus spp. (Fernandez, Zavala & Musto, 2001) genomes that GC-rich in genomes. In R. palmatum, there is clear heterogeneity of codon usage among genes: R. palmatum favored the A/U-ending codons. Some previous studies have reported that the genes from dicot plant prefer the A/U-ending codons such as Malus domestica (Van Hemert & Berkhout, 2016), Myrica rubra (Li et al., 2016) and Lonicera macranthoides (Feng et al., 2013). The plant R. palmatum is a kind of dicot plant in general and our result was consistent with the data reported that shows an A/U-ending codons preference. Moreover, the ratio of A/U-ended codons and G/C-ended codons for the most frequently used codons is 22:8. The result was consistent with that of nucleotide composition above and the phenomenon was also similar to other species with richer AT contents, namely Kluyveromyces lactis, Saccharomyces cerevisiae and Pichia pastoris (Peixoto, Fernandez & Musto, 2004; Liu et al., 2019).
Conclusions
Codon usage bias is a common and a complicated natural phenomenon for various kinds of living beings (Banerjee & Roy, 2009). We can illuminate the regular patterns of evolution, find out some new genes, optimize heterogeneous expression system through the overall codon usage bias analysis (Galtier et al., 2018). With the rapid development of high throughput sequencing, the analysis of codon usage bias pattern based on genome and transcriptome data is increasing rapidly (Angov, 2011; Goodman, Church & Kosuri, 2013). Such analysis based on big data is very useful to better understand evolutionary mechanisms of species and translation selection force in shaping codon usage bias.
In our project, we carried out the codon usage bias analysis of R. palmatum genes based on the transcriptome data. The GC content in R. palmatum CDS was 46.57%, which indicated that the CDSs of R. palmatum were slightly AT rich. Furthermore, the optimal codons analysis suggested that the R. palmatum CDS were preferred to A/U-ending synonymous codons. All these results clarified that the nucleotide composition of R. palmatum plays a significant role in shaping codon bias. Meanwhile, codon bias in R. palmatum genes was also influenced by gene expression level. In addition, 28 optimal codons were figured out and most of the optimal codons ended with A or U, except UUG for Leu. After a series of analyses, the codon usage bias in R. palmatum is influenced by nucleotide composition, natural selection, mutation pressure, and gene expression level.
In conclusion, our data offers new perspectives for the codon usage pattern in R. palmatum and has made a firm foundation for the gene engineering in R. palmatum.