
Partial restoration of normal intestinal microbiota in morbidly obese women six months after bariatric surgery
- Published
- Accepted
- Received
- Academic Editor
- Stefano Menini
- Subject Areas
- Microbiology, Clinical Trials, Diabetes and Endocrinology, Nutrition, Metabolic Sciences
- Keywords
- Fecal microbiota, Bariatric surgery, Type 2 diabetes, Obesity, Clinical trial
- Copyright
- © 2020 Koffert et al.
- Licence
- This is an open access article distributed under the terms of the Creative Commons Attribution License, which permits using, remixing, and building upon the work non-commercially, as long as it is properly attributed. For attribution, the original author(s), title, publication source (PeerJ) and either DOI or URL of the article must be cited.
- Cite this article
- 2020. Partial restoration of normal intestinal microbiota in morbidly obese women six months after bariatric surgery. PeerJ 8:e10442 https://doi.org/10.7717/peerj.10442
Abstract
We studied the impact of bariatric surgery on the intestinal microbiota of morbidly obese study subjects. A total of 13 morbidly obese women (five of which had type 2 diabetes) and 14 healthy age- and gender-matched controls were recruited and the microbiota composition of fecal samples were determined by using a phylogenetic microarray. Sampling of the patients took place just one month before and 6 months after the operation. Within six months after bariatric surgery, the obese subjects had lost on average a quarter of their weight whereas four of the five of the diabetic subjects were in remission. Bariatric surgery was associated with an increased microbial community richness and Bacteroidetes/Firmicutes ratio. In addition, we observed an increased relative abundance of facultative anaerobes, such as Streptococcus spp., and a reduction in specific butyrate-producing Firmicutes. The observed postoperative alterations in intestinal microbiota reflect adaptation to the changing conditions in the gastrointestinal tract, such as energy restriction and the inability to process fiber-rich foods after bariatric surgery.
Introduction
The global obesity epidemic is still worsening affecting a total of 603.7 million adults and 107.7 million children with ominous implications for both physical and economic health (Collaborators GBDO et al., 2017). Several studies have shown that intestinal microbes contribute to the regulation of energy homeostasis, fat storage, and energy uptake, and are likely to play a role in obesity and its complications (Karlsson et al., 2013; Kootte et al., 2012; Krajmalnik-Brown et al., 2012). Indeed, the intestinal microbiota signatures, such as altered composition as well as reduction in taxonomic diversity and functional richness have been associated with obesity (Cotillard et al., 2013; Turnbaugh et al., 2009) and several experimental studies have shown a causal link between obesity and gut microbiota (Liou et al., 2013; Ridaura et al., 2013). In addition, aberrations of intestinal microbiota have been shown to be associated with the serum metabolome and may contribute to insulin resistance in non-diabetic subjects (Pedersen et al., 2016).
Initial studies suggested that obesity could be associated with an increased relative abundance of Firmicutes and decreased levels of Bacteroidetes (Furet et al., 2010; Ley et al., 2006). However, more recent studies have reported results ranged from an increase in total diversity to absence of change and even decrease in alpha-diversity (Damms-Machado et al., 2015; Louis et al., 2016; Patil et al., 2012). These may be explained by differences in diet, host genotype and physiology and the presence of comorbidities, such as type 2 diabetes (T2D) (Remely et al., 2016). Moreover, these studies addressed the number and not the activity of these bacterial phyla. A more recent study addressing the fecal metaproteome showed that bacteria belonging to the Bacteroidetes were less abundant, but metabolically much more active in morbidly obese versus non-obese subjects (Kolmeder et al., 2015).
In patients with morbid obesity bariatric surgery is currently the only effective treatment with long-term results of sustainable weight loss and remission or amelioration of obesity-related comorbidities (Adams et al., 2017; Puzziferri et al., 2014; Schauer et al., 2017; Sjostrom, 2013) The underlying mechanisms behind the surgically induced weight loss have not been fully elucidated. However, reduced food ingestion, increased satiety, increased gastric emptying and shift in bile acid metabolism have been suggested to have a role (Laferrere et al., 2008; Plum et al., 2011). In addition, increased diversity and changes in community composition of the intestinal microbiota have been reported after bariatric surgery, thus suggesting that some of its beneficial effects may be mediated by intestinal microbiota (Damms-Machado et al., 2015; Graessler et al., 2014; Palleja et al., 2016). Previously published studies on the effect of bariatric surgery on fecal microbiota are not consistent and suggest contradictory results concerning changes in fecal microbiota diversity after the surgery and between different surgery types (Lee et al., 2019; Paganelli et al., 2019; Sanchez-Alcoholado et al., 2019). The objective of this study was to characterize the microbiota of morbidly obese women and to evaluate the impact of bariatric surgery on microbiota composition.
Study Subjects and Methods
Study population
Morbidly obese study subjects were recruited from patients undergoing bariatric surgery procedure as part of their normal treatment at the Hospital District of Southwest Finland (Dadson et al., 2017; Koffert et al., 2018). The surgical inclusion criteria were age between 18–60 years and BMI ≥40 kg/m2 (or ≥35 kg/m2 with an additional obesity-related comorbidity). In addition to standard exclusion criteria for bariatric surgery patients with T2D requiring insulin treatment were excluded. Healthy study subjects were recruited to study protocol by advertisements in local newspaper from January to December in 2011. The inclusion criteria for the control population were body-mass index 18–27 kg m2, age 18–60 years, fasting plasma glucose less than 6.1 mM, and normal oral glucose tolerance test. Altogether 42 females were recruited for the study, including 27 obese subjects and 15 controls. For nine obese subjects, one of the time points was discarded due to the inability to PCR amplify the extracted DNA or low reproducibility of the phylogenetic microarray results (see below). Moreover, three obese subjects withdrew from the study for personal reasons, and further two subjects who had a successful microbiota profile only from a single time point were discarded. This yielded the final data set with 13 obese subjects who had successful microbiota profiles from both time points and 14 controls that were included in the analysis (Fig. 1). Of the 13 obese subjects, five had T2D and in eight had normal glycaemia. Only three study subjects with type 2 diabetes were on metformin medication. Written informed consents were obtained prior the studies. The protocol (NCT01373892/SLEEVEPET) was approved by the Ethics Committee of the Hospital District of Southwest Finland (ETMK 99/180/2010). The clinical study was performed at the Turku PET Centre, the University of Turku and Turku University Hospital (Turku, Finland) between January 2011 and October 2013 and fecal microbiota samples analyzed in 2014.
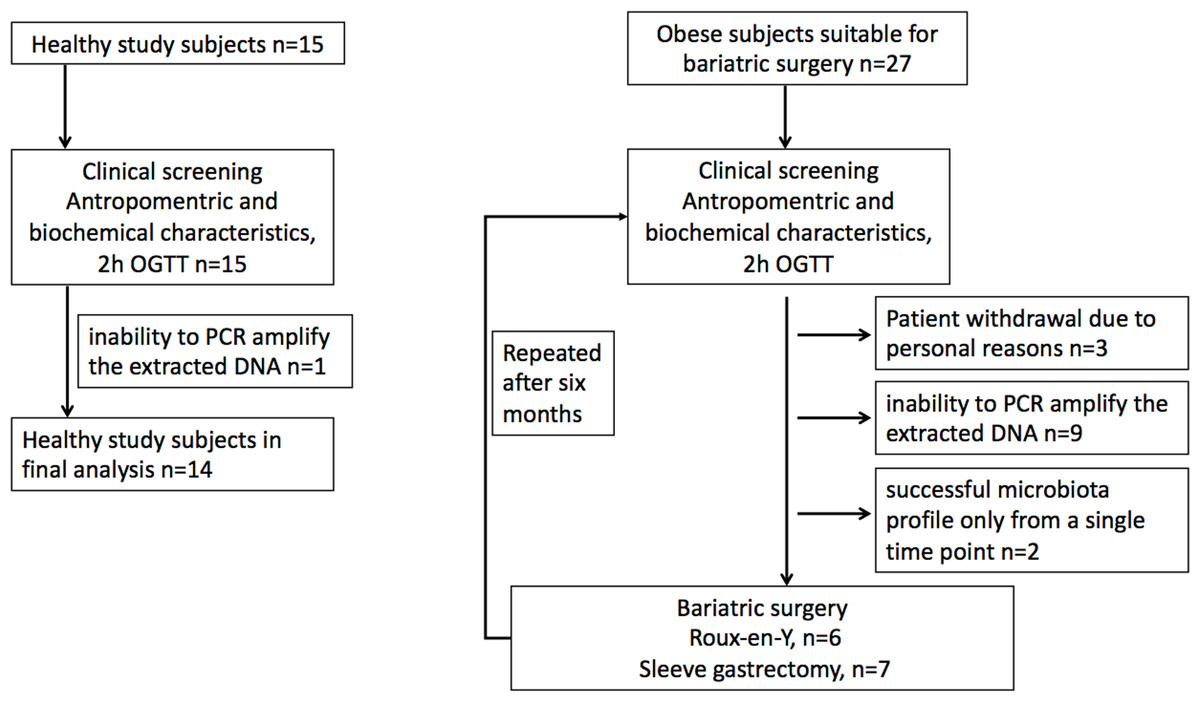
Figure 1: Study flowchart.
(A) Healthy study subjects. (B). Obese study subjects.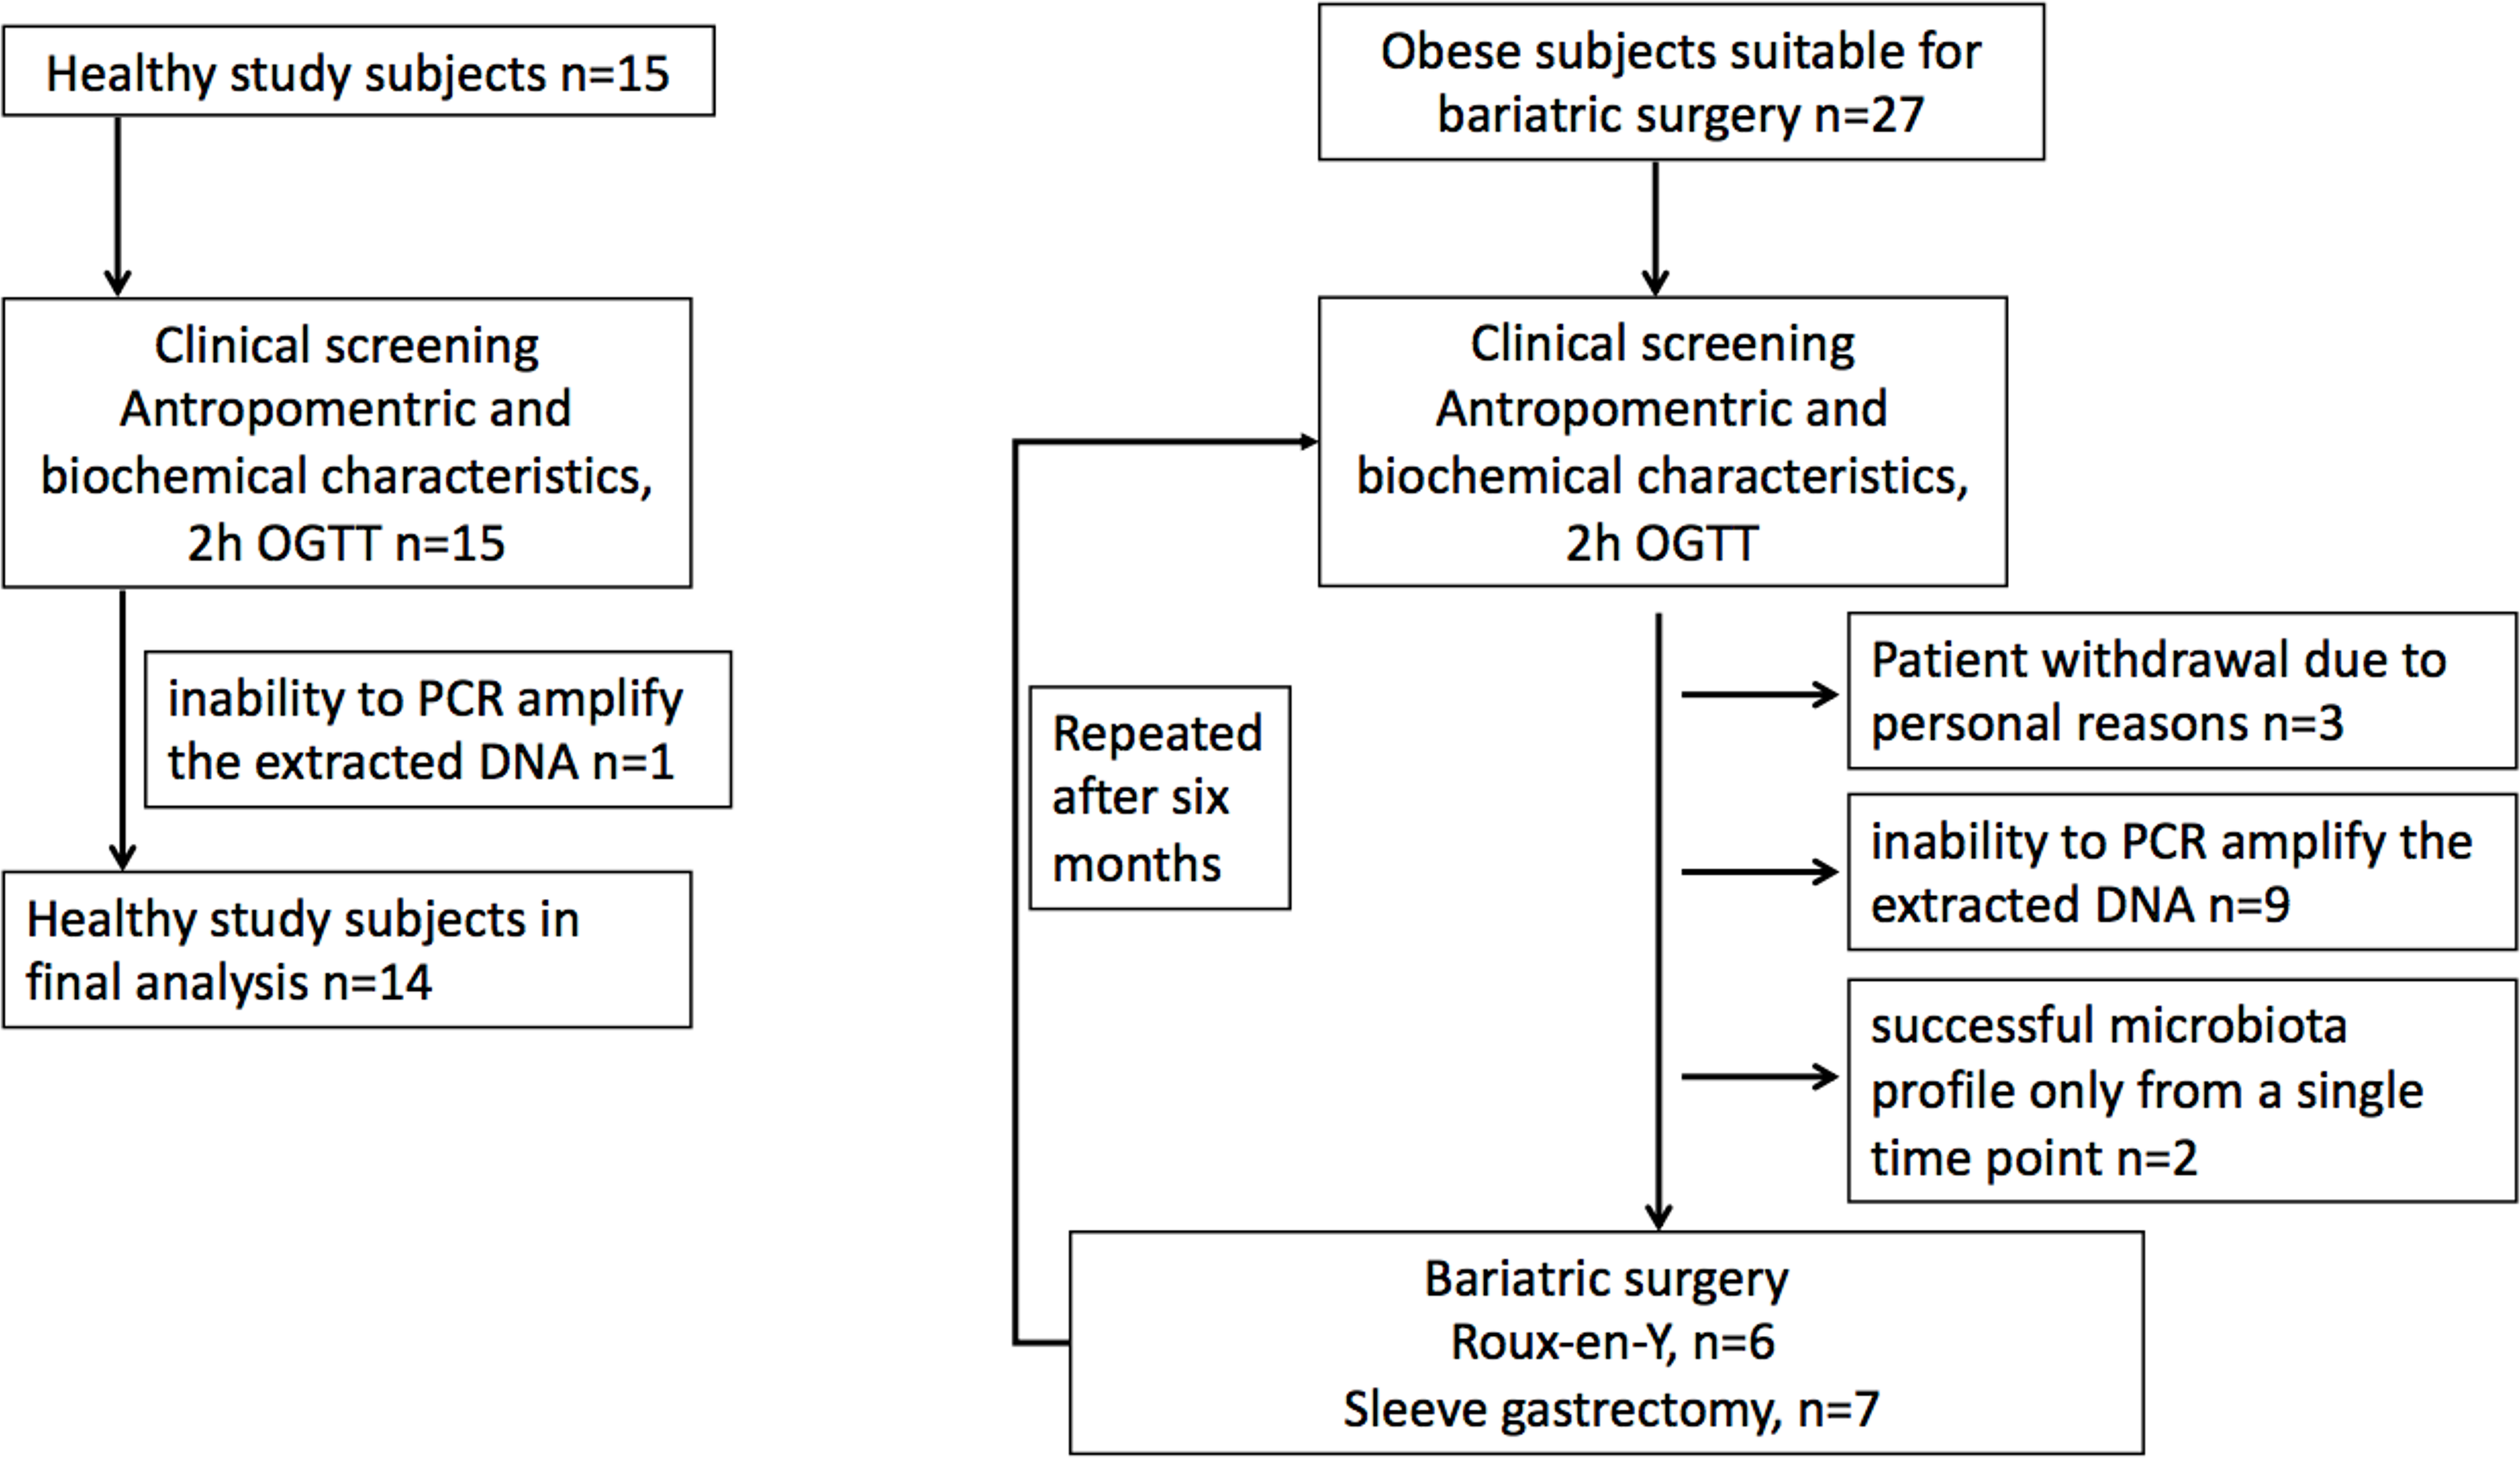
Study design
At screening visit, study subjects gave their signed approvement prior to their enrolment in to the study. The medical history was recorded, the physical examination, anthropometric measurements, blood and oral glucose tolerance tests were performed, and instructions for fecal sample collection were provided. On a separate study visit abdominal fat masses were assessed with MRI. Thereafter, obese subjects followed a very low-calorie diet (VLCD; 800kcal/day) for one month before the bariatric operation. Of the morbidly obese subjects, seven underwent sleeve gastrectomy and six Roux-en-Y gastric bypass (RYGB) surgery. All the morbidly obese study subjects received perioperative antibiotic Cefuroxime 3g intravenously. The post-operational phase was conducted six months after the surgery and all studies were repeated as in baseline. Food diaries were used to document dietary intake in healthy controls and before the VLCD and 6 months postoperatively in obese subject.
Fecal sample collection and microbiota profiling
Fecal samples for the controls were collected in a single time point and for the obese subjects both before the VLCD (one month before the surgery) and six months after the surgery. DNA from fecal samples was extracted with repeated bead-beating as described previously (Nylund et al., 2010) and used for phylogenetic profiling with the Human Intestinal Tract (HIT) Chip, a custom-made Agilent phylogenetic microarray (Rajilic-Stojanovic et al., 2009). The HITChip analysis allows phylotype-level profiling at a resolution of ∼0.1% relative abundance with >98% reproducibility (Claesson et al., 2009) based on >5,000 probes designed to target 16S rRNA gene sequences of over 1,000 intestinal bacterial phylotypes from 130 genus-like groups (defined by >90% 16S rRNA gene similarity). Further details on the sample processing, microarray, and hybridization protocols were reported previously (Rajilic-Stojanovic et al., 2009). The microarray hybridization data was extracted from scanned microarray images with the Agilent Feature Extraction software. The technical replicates were quantile-normalized with custom R scripts as previously described (Lahti et al., 2014), and reproducible hybridizations (Pearson r > 98%) were accepted for the analysis and stored in a custom MySQL database. Between-sample normalization was performed at probe level with the minimum–maximum method, and probe summarization at the phylotype-level (>98% 16S rRNA sequence similarity) was done with the frozen Robust Probabilistic Averaging (fRPA) method (Lahti et al., 2011; Lahti et al., 2013) and then to the genus (>90% 16S rRNA sequence similarity) and order-like 16S rRNA gene sequence groups by summing up phylotype abundances as described earlier (Lahti et al., 2014).The processing scripts are available at https://github.com/microbiome/HITChipDB. In this work, we focus primarily on genus-level variation.
Statistical analysis
The HITChip profiles were centered log-ratio transformation (CLR)-transformed before statistical testing to remove compositionality bias (Aitchison, 1986), and Euclidean distances for the CLR-transformed genus-level abundances were used as the beta diversity measure. For hierarchical clustering, we used complete linkage with Spearman correlation. The surgery effect on individual taxa between the matched obese subject time points 1–2 was quantified with a random effects linear model with subject as the random effect and time as the fixed effect (lmer R package). Unpaired t-test was used for two-group comparisons. Multi-group comparisons were performed with ANOVA and the Tukey post-hoc test. In order to reduce multiple testing, we removed from comparisons the rare taxa that were observed with <10% prevalence at >0.1% relative abundance. To further support the analysis, we verified the multi-group comparisons with non-parametric Kruskal-Wallis test and diagnostic plots. PERMANOVA (adonis in the vegan R package) was used for the group-wise community comparisons. The p-values were adjusted for multiple corrections with Benjamini–Hochberg method. The FDR<0.05 was considered statistically significant, and FDR<0.25 borderline significant. Spearman correlation of the probe-level HITChip signals were used for subject identification based on best match between the two timepoints. Microbiota richness and diversity were quantified from the probe-level HITChip data by observed probe count and Shannon index, respectively. Tools from the phyloseq (McMurdie & S, 2013) and microbiome (https://microbiome.github.io/tutorials/) R packages were used to support analysis and visualization.
Sample size for original study protocol in PET-imaging was determined by joint a priori power analysis based on longitudinal PET studies using 18F-FTHA (Karmi et al., 2010; Viljanen et al., 2009) which suggested that a sample size of 10+10 would be sufficient for establishing the predicted effects at P<0.05 with actual power exceeding 0.95. These study subjects were used for intestinal microbiota analysis.
Results
Effect of bariatric surgery on glucose metabolism
Before surgery, the obese study group was insulin resistant and had increased systemic inflammation compared to healthy controls (Table 1). In addition, the obese study subjects had higher HbA1c and 2-hour glucose concentrations in OGTT compared to healthy controls (Table 1). Bariatric surgery resulted in marked weight loss (on average 23%) with improved insulin resistance (Table 1). Furthermore, diabetes remission occurred in 80% (4/5) of the T2D subjects after surgery.
| Obese (n = 13) | ||||
|---|---|---|---|---|
| Anthropometrics | Controls (n = 14) |
Presurgery | p-value | Postsurgery |
| Sex (female/male) | 14/0 | 13/0 | ||
| Age (years) | 44 ± 10 | 43 ± 11 | 0,88 | 44 ± 10 |
| Weight (kg) | 62 ± 7.3 | 113 ± 17* | <0.01 | 86 ± 14 |
| BMI (kg m-2) | 22.8 ± 2.9 | 40.9 ± 4.2* | <0.01 | 31.4 ± 3.6* |
| Body fat (%) | 32 ± 5.8 | 49 ± 5.4* | <0.01 | 41 ± 3.7 |
| FFA (mM) | 0.50 ± 0.20 | 0.73 ± 0.29* | 0.62 | 0.78 ± 0.24* |
| Fasting glucose (mM) | 5.3 ± 0.6 | 6.0 ± 1.1 | 0.11 | 5.4 ± 0.9 |
| Fasting insulin (mU L-1) | 5.6 ± 3.6 | 11.0 ± 7.9* | 0.19 | 7.6 ± 5.0 |
| OGTT 2 h glucose (mM) | 5.6 ± 1.2 | 8.7 ± 2.8* | <0.01 | 4.8 ± 2.0 |
| T2D (n) | 0 | 5 | 1 | |
| uCRP (mg*l-1) | 0.8 ± 1.0 | 2.9 ± 2.5* | 0.013 | 0.9 ± 1.0 |
| HbA1c (%) | 5.6 ± 0.3 | 5.8 ± 0.7 | 0.01 | 5.3 ± 0.5 |
| HOMAIR (fraction) | 1.1 ± 0.9 | 3.1 ± 2.7* | 0.18 | 1.9 ± 1.5 |
Notes:
- HOMAIR
-
homeostatic model assessment for insulin resistance
- FFF
-
free fatty acids
- OGTT
-
oral glucose tolerance test
- T2D
-
type 2 diabetes
Dietary intake preceding and after surgery
Mean caloric intake was lower in obese subjects compared to healthy controls but the difference was only marginally significant (1,304 ± 570 kcal vs. 1,625 ± 518, p = 0.07, respectively). The total calorie intake decreased in obese subject by 35% on average after bariatric surgery (p < 0.01). Nutrient intake was lower postoperatively, while carbohydrate-, protein- and fat-intake decreased on average by 27% (p < 0.01), 18% (p < 0.01) and 6% (p = 0.04) respectively.
Control subjects form two distinct groups
Unsupervised hierarchical clustering of the genus-level profiles indicated two distinct subgroups among the control subjects (Fig. S1). These included 4 normal-weight control subjects with mean BMI 24.9 kg/m2 (group A) and 10 “lean” control subjects with a lower average BMI of 21.5 kg/m2 (group B). Differences in body fat and energy consumption were not significant. The group A controls had on average higher levels of bacteria related to Allistipes. In contrast, the group B controls had on average higher levels of bacteria belonging to Ruminococcus obeum, Coprococcus eutactus and Clostridium nexile (p < 0.25).
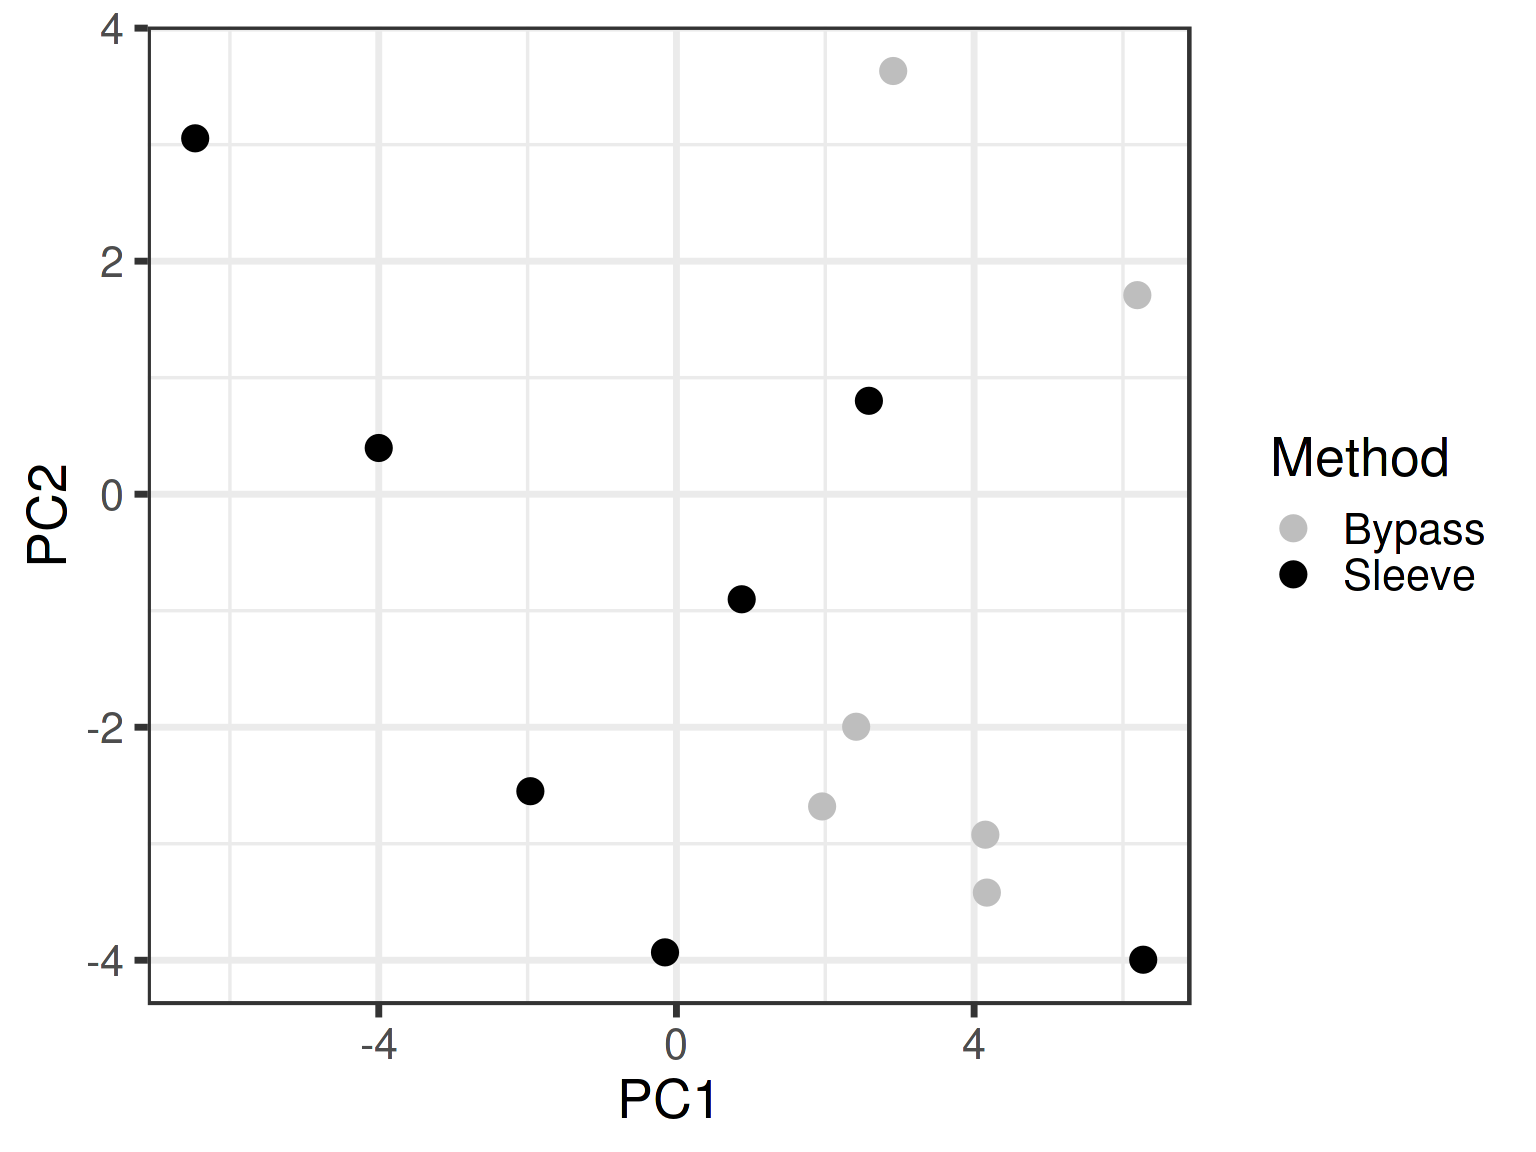
Surgery type has no effect on microbiota composition
No differences were observed between the alternative surgery procedures (bypass n = 6; sleeve n = 7) in post-surgery samples in community composition quantified by the overall beta diversity or individual genus-like groups (Fig. S2A). These groups were combined in the subsequent microbiota analyses.
Microbial richness shifts towards controls in patients following surgery
Before surgery, the average richness was significantly lower in the obese subjects compared to the group A controls (p = 0.01) and borderline significant compared to the group B controls (p = 0.12) (Fig. 2). After the surgery, the difference to group A controls was borderline significant (p = 0.14), and difference to the group B controls was not significant (p = 0.87).
Figure 2: Microbiota richness in the obese and control groups.
(A) The group-wise differences are significant for richness (p = 0.01), and borderline significant for diversity (p = 0.22). At the baseline time point (before surgery), the richness was lower in the obese subjects compared to the normal-weight controls (p = 0.01) and lean controls (borderline significant; p = 0.12). After the surgery, microbiota richness in the obese reached similar levels with the lean controls (p = 0.87) but remained somewhat lower compared to the normal-weight controls (p = 0.14). (B) The surgery was associated with a significant shift in the Bacteroidetes-Firmicutes ratio (p = 0.04), whereas the other differences were not significant.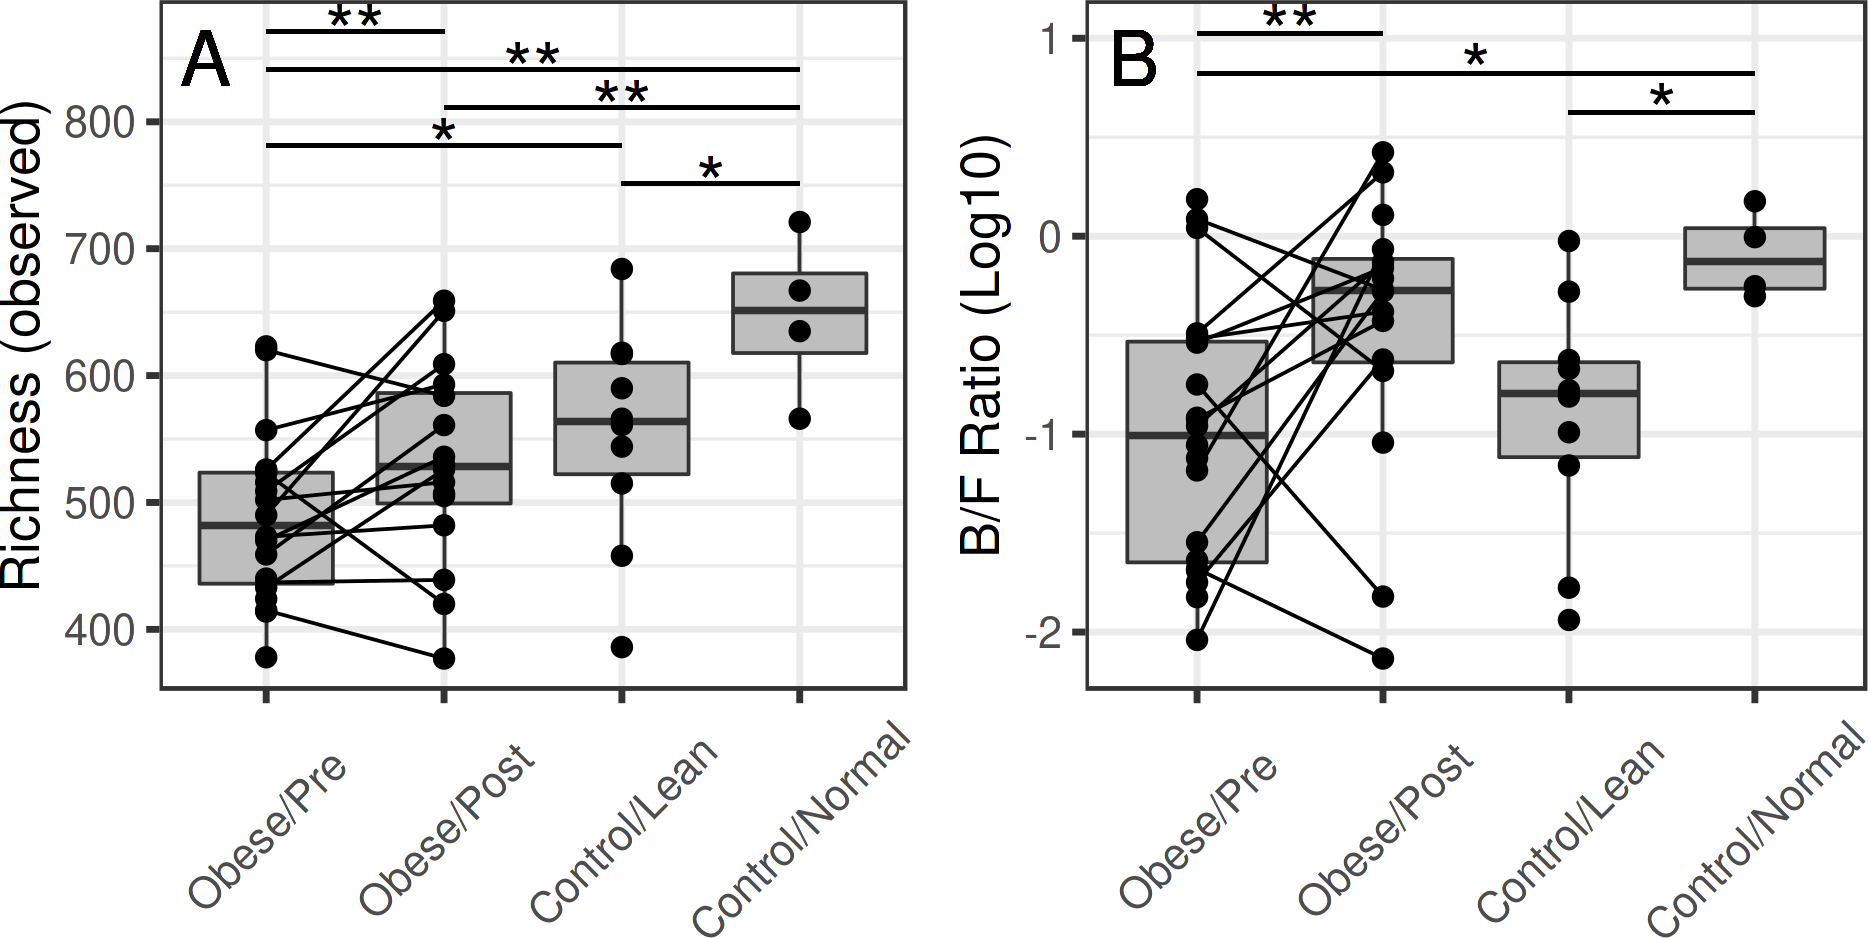
Microbiota community structure shows changes following bariatric surgery
Bariatric surgery was associated with a shift in the Bacteroidetes-Firmicutes ratio towards that of the control subjects (Fig. 2B). The overall differences in microbiota composition (beta diversity) between the obese and control subjects were not significant after the surgery. Notably, whereas the average abundance of Firmicutes decreased after surgery, specific members of the Firmicutes exhibited qualitatively different increasing shifts following the surgery (Fig. 3), indicating that the phylum-level comparison of the Bacteroidetes-Firmicutes ratio should be complemented by the analysis of specific members within these groups.
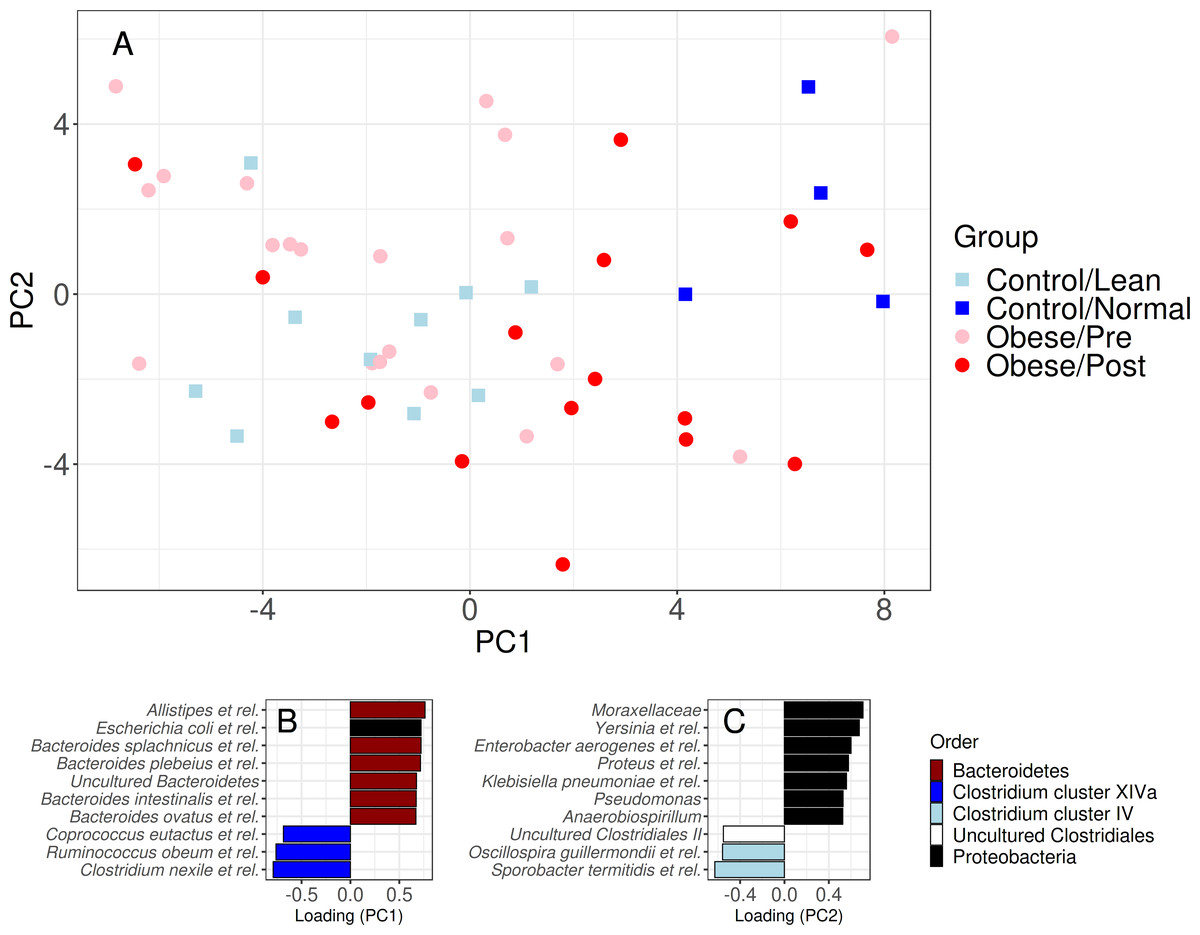
Figure 3: Community similarity before and after bariatric.
Sample ordination by genus-level community composition illustrates a significant shift from obese microbiota (red) towards group A control group (dark blue) following surgery (p < 0.05). The lower panel shows the ten most strongly associated genus-like groups for each ordination axis, indicating that surgery is, on average, associated with a reduction of genera from the Clostridium cluster XIVa and Proteobacteria groups, and an increase in Bacteroidetes, Clostridium cluster IV, and uncultured Clostridiales. For targeted analysis of changes in genus-level groups following surgery, see Fig. S2B.
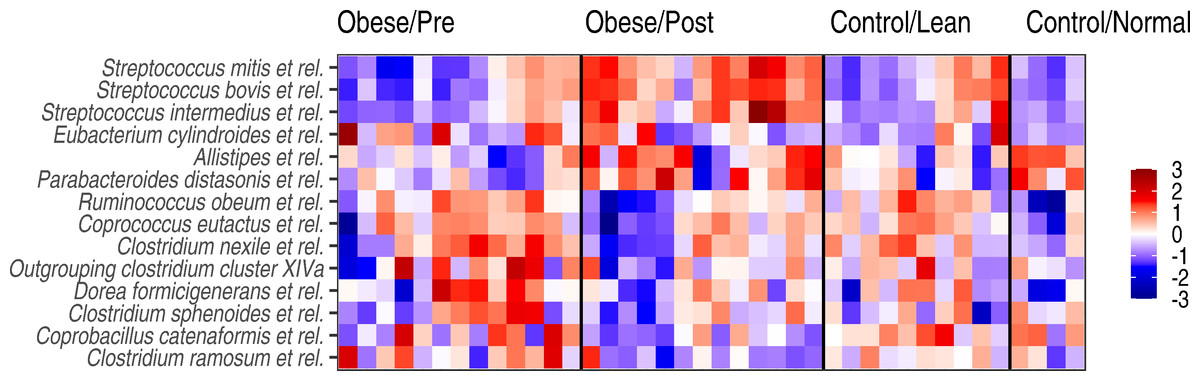
Figure 4: Genus-level microbiota signatures among the study subjects.
Abundance variation in the genus-level groups that exhibited significant changes following the surgery. Z-transformed log10 relative abundances (HITChip signal) are shown for each genus. The color code indicates increased (red) or decreased (blue) abundance compared to the overall mean abundance of the genus across all samples.
Genus-level shifts following the surgery
At the level of specific bacterial genera, bariatric surgery was associated with an increased abundance of specific members of bacteria belonging to the Bacteroidetes, Streptocooccus spp. (S. mitis and S. bovis.), as well as Sporobacter termitidis (Clostridium cluster IV) (Fig. 4), so that the abundances of these bacteria were shifting towards the group A controls. The observed shift towards these controls was evident also as a reduced abundance in specific members of the Clostridium cluster XIVa (including bacteria related to Ruminococcus obeum, Coprococcus eutactus, and other Clostridium groups) after surgery.
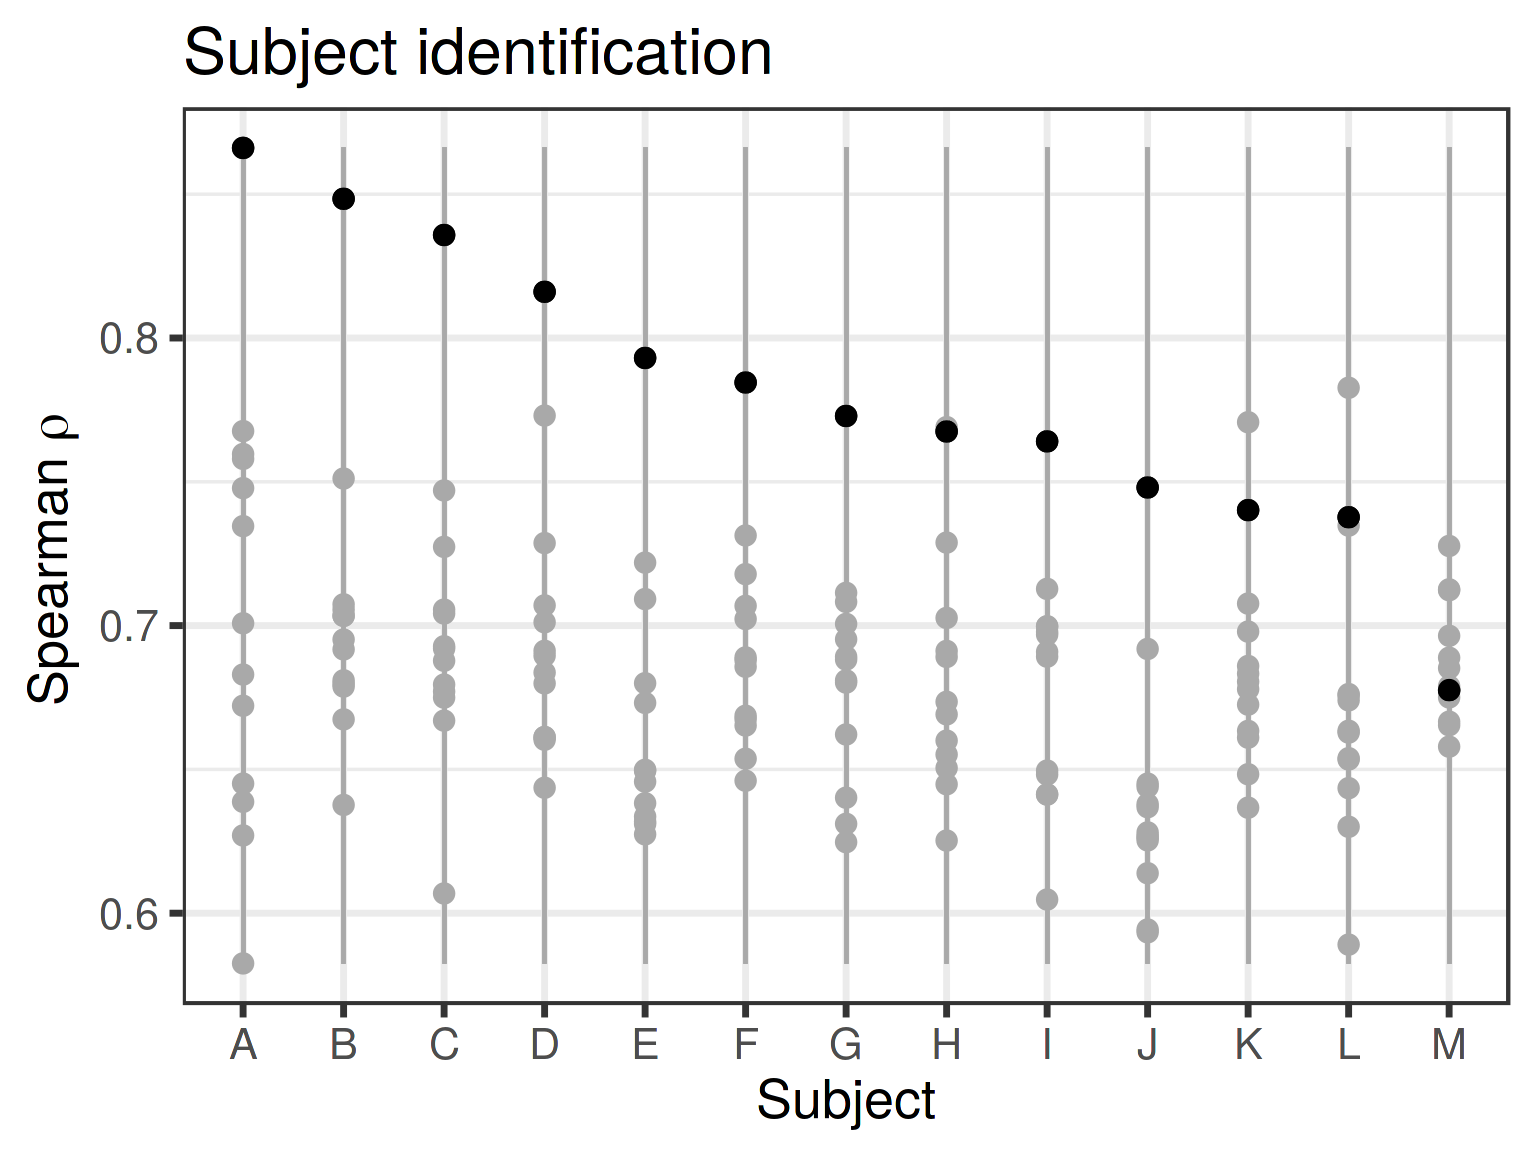
Individuality of microbiota composition
Microbial composition remained individual-specific and identifiable following surgery for most (11/14; 79%) subjects based on the closest match with the pre-surgery samples (see Methods). However, three subjects experienced so remarkable changes during the intervention that reliable subject identification based on microbiota composition was not possible after the surgery (best match was with a sample from another subject; Fig. S3). However, for two of these incorrectly identified subjects, the second best match was with the correct subject. For the third misidentified obese subject, his/her own pre-surgery sample was only the 9th best match, suggesting drastically altered microbiota composition or potential shift in community type following the surgery.

Figure 5: Metformin treatment and microbiota diversity.
Metformin treatment is associated with reduced microbiota diversity (p = 0.02).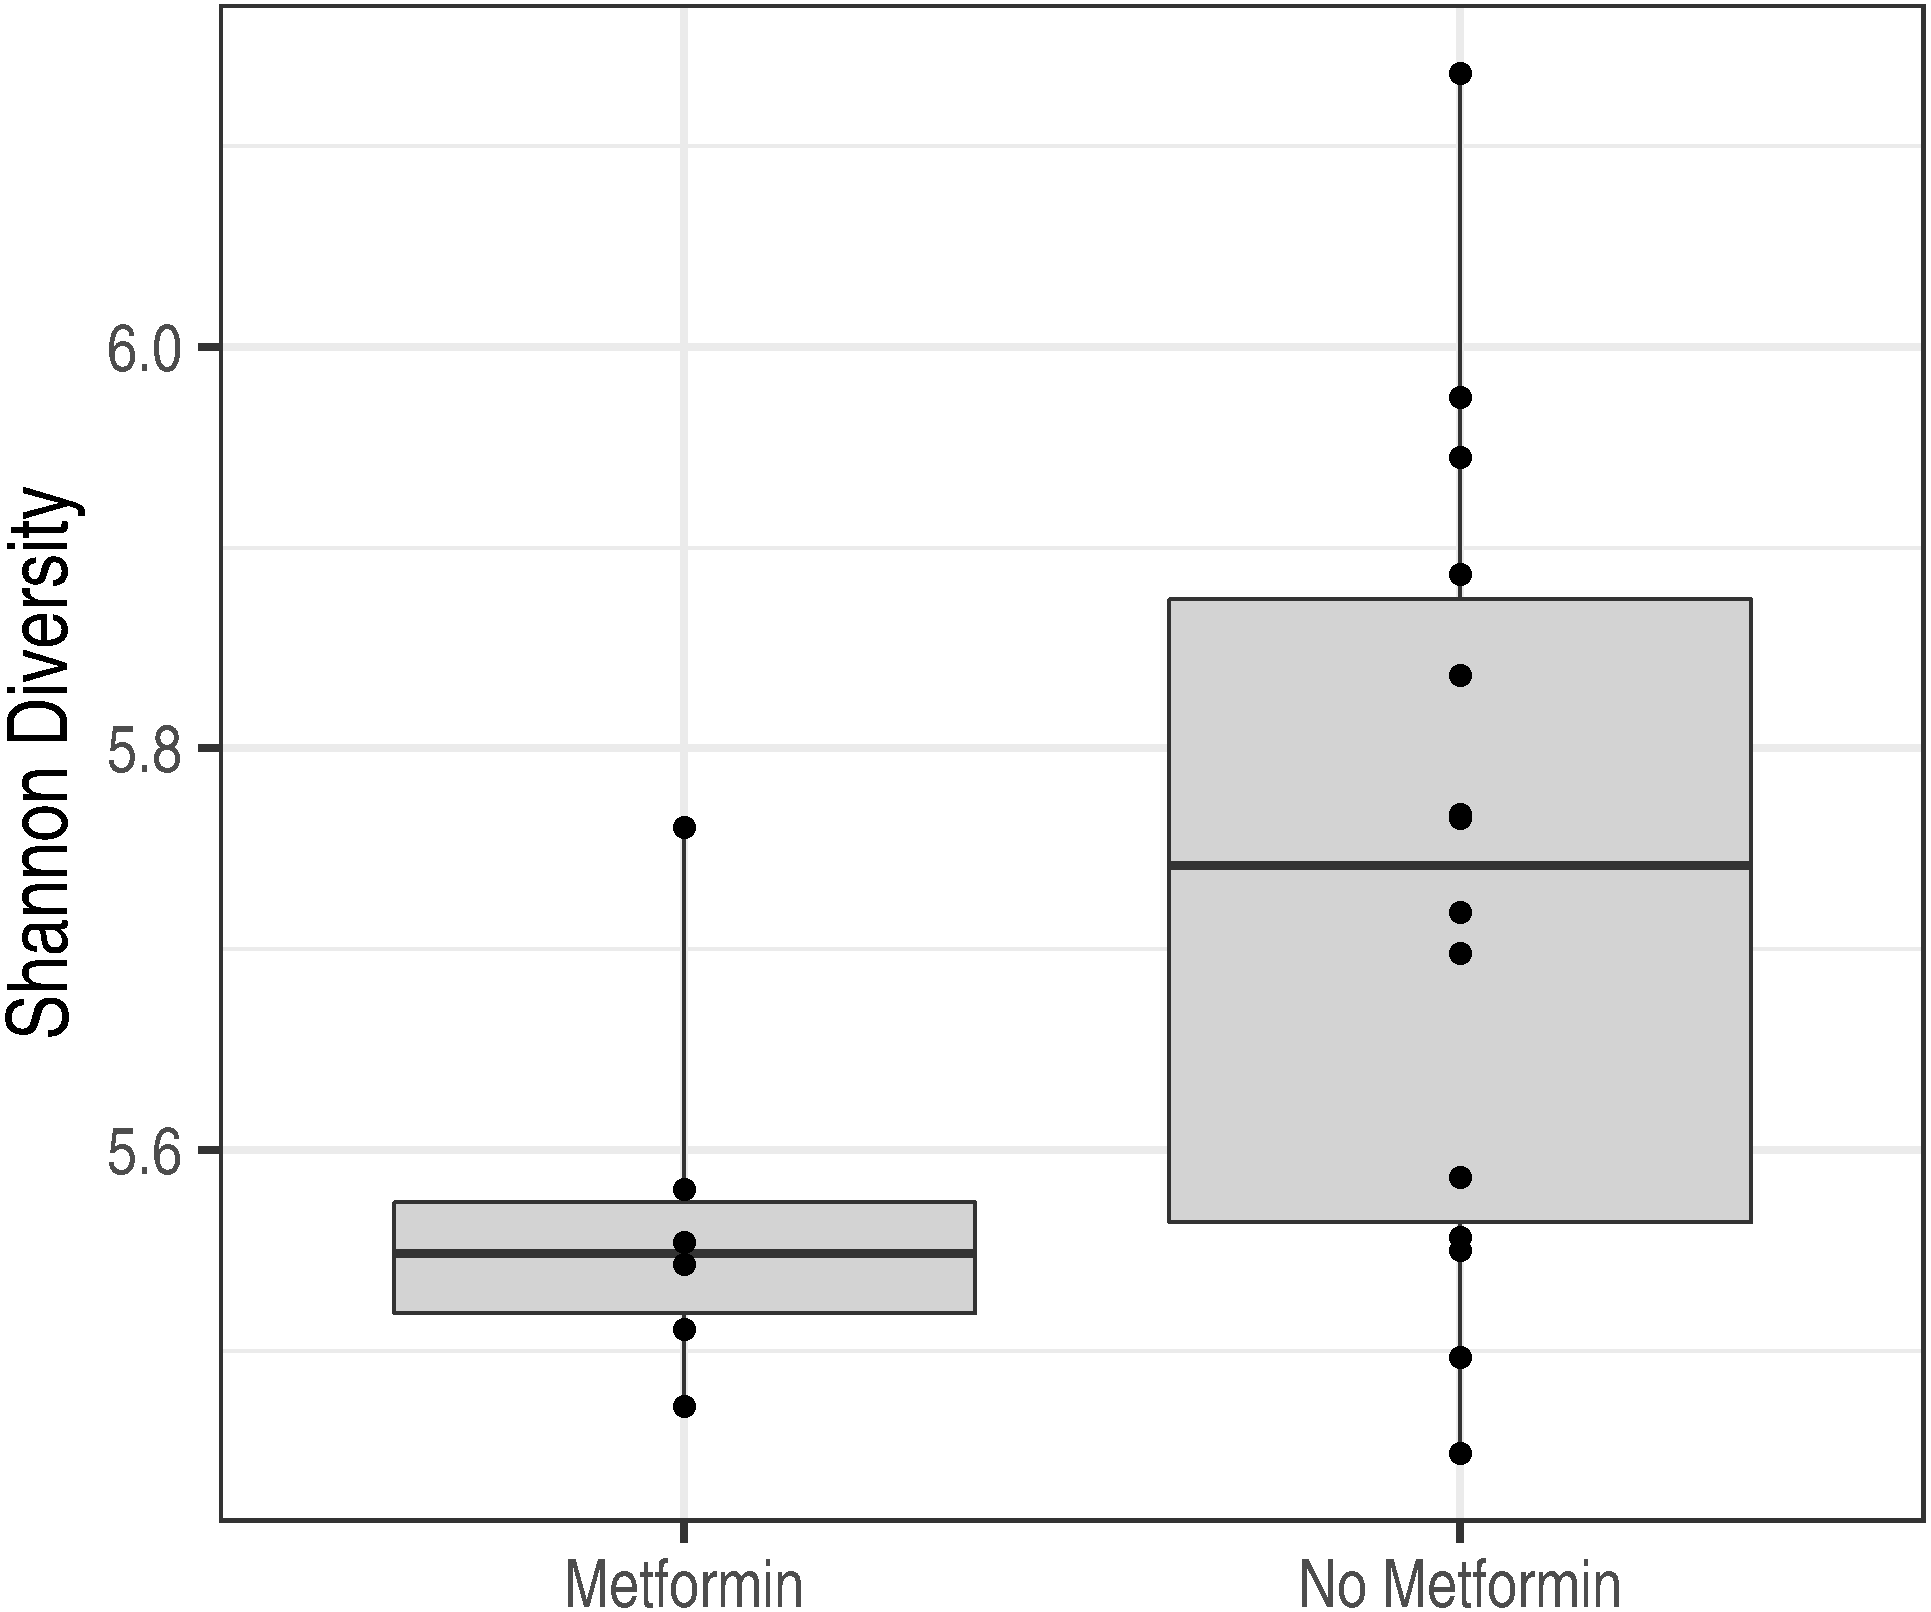
Effect of diabetes status
In addition, the microbiota characteristics of metformin-treated obese subjects (n = 3) and obese subjects with no metformin treatment (n = 10) were compared at the baseline time point. Diabetes status did not have a statistically significant effect on the overall microbiota composition as quantified by the standard permutation analysis of variance (PERMANOVA; p = 0.28). However, metformin was associated with a significant reduction in intestinal microbiota diversity (p = 0.02; Fig. 5). A similar non-significant trend is seen in microbiota richness (p = 0.21).
Discussion
In this study, the intestinal microbiota composition of morbidly obese females with and without T2D and the effects of bariatric surgery induced weight loss on intestinal microbiota composition and diversity were evaluated. The effect of bariatric procedure on microbiota signatures was characterized by increased microbiota richness, increased abundance of facultative anaerobes and decreased abundances of specific butyrate-producing Firmicutes.
Before bariatric surgery, the overall microbiota composition of the morbidly obese subjects was closer to the group B controls than group A controls. This potentially reflects the effect of calorie-restricted weight-loss diet in the obese group (Cotillard et al., 2013) as the patients undergoing bariatric surgery in Finland are required to lose approximately 5% of their weight before surgery. Six months after the operation, microbiota composition of the obese subjects had shifted towards the group A controls (Fig. 3). These shifts were observed both in the overall community composition (beta diversity), in specific genera, community richness and in Bacteroidetes-Firmicutes ratio. Despite the shifts observed, microbial composition remained individual-specific and identifiable following surgery for the most which is in line with current literature (Durack & Lynch, 2019; Healey et al., 2017). In a recent study conducted by Paganelli and her colleagues low-calorie diet and bariatric surgery per se only temporary declined fecal microbiota diversity and gradually these changes returned to baseline levels in six months (Paganelli et al., 2019). On the other hand, Lee’s research group documented increase in fecal microbiota diversity after the RYGB and drug-induced weight loss (Lee et al., 2019). All of these studies are limited by low number of study subjects and shortage of male study subjects in different intervention groups.
In previous studies, subjects with prediabetes or overt T2D have been reported to have a distinct microbiota profile compared to non-diabetic subjects (Allin et al., 2018; Qin et al., 2012). In current study, we did not observe differences in microbiota signatures related to the diabetic status at the baseline (p = 0.048). However, microbiota diversity was significantly decreased in metformin—treated diabetic subjects compared to diabetic subjects without medication (Fig. 5). This finding is in contrast to recent study by Forslund and colleagues, where decreased bacterial richness was detected among metformin-naive individuals with type 2 diabetes when compared to individuals treated with metformin (Forslund et al., 2015).
Increased relative abundances of facultative anaerobic microbes, such as Streptococcus spp. and Allistipes et rel. were observed after bariatric surgery. This is in line with previous studies reporting increased relative abundances of facultative anaerobic microbes from upper gastrointestinal tract (such as Streptococcus, Veillonella and Escherichia spp.) after bariatric surgery (Ilhan et al., 2017; Palleja et al., 2016). Paganelli’s research group showed that after the VLCD relative abundance of Streptococcae was decreased but the abundance gradually increased one week after the operation and these changes persisted even 6 months after the operation(Paganelli et al., 2019). These changes most likely reflect the changed anatomy of gastrointestinal tract and decreased exposure to gastric acids after operation. Postoperative microbiota changes observed here might reflect the microbiota adaptation to changing conditions in the gastrointestinal tract and energy restriction as well as infeasibilities of fiber-rich foods after bariatric surgery as shown by the increase in Bacteroidetes/Firmicutes ratio and by the reduced abundance of butyrate-producing bacteria. Moreover, a diet rich in resistant starch may not be tolerated after the bariatric surgery. Indeed, a reduction of one of the colonic starch degrading Ruminococcus obeum -related bacteria was observed in post-operative microbiota. Based on studies with dietary interventions for weight loss, restrictive diets seem to promote a reduction in intestinal microbiota diversity and a reduction in certain bacterial groups, such as butyrate-producing Firmicutes, Clostridium spp. Lactobacillus spp. and Bifidobacterium spp. (Damms-Machado et al., 2015; Graessler et al., 2014; Palleja et al., 2016). These changes seem to correlate to a reduction in the intake of complex carbohydrates rather than to a weight loss as such.
Given the fact that bariatric surgery rearranges the gut microbiota, it is worth noting the role of potential modulators of intestinal microbiota, such as prebiotics and synbiotics. In the study of Fernandes’s research group oral administration of a prebiotic (fructo-oligosaccharide) after RYGB promoted significant reduction in body weight, whereas both prebiotic and synbiotic supplements were not sufficient to promote significant improvement in the inflammatory markers (Fernandes et al., 2016). Unfortunately, this study lacks the data of change in fecal microbiota. Since bariatric surgery has shown to induce intestinal bacterial overgrowth, Woodard et al. randomized 44 patients undergoing RYGB to placebo or 2.4 billion colonies of Lactobasillus. This probiotic administration improved bacterial overgrowth, vitamin B12 availability, and weight loss after RNYGB (Woodard et al., 2009). Based on these findings further investigation in pre- and synbiotics with larger sample size and fecal microbiota sampling is warranted in the future.
During this study, we observed two distinct groups of control subjects with a distinct microbiota composition as well as differences in body-mass index and other host parameters. These groups were not included in the original study design, and hence the findings relating to the distinct control groups in this study are exploratory and limited in sample size. This observation highlights the microbiota signatures as an essential host feature that should be considered already in the study design. These findings should be further verified in an independent study.
There are some limitations in this study. First, study groups were small and while the findings are in line with current literature further research with larger cohorts is warranted. Second, only female subjects were studied, and thus the findings may not be generalized to males. Third, fecal samples were collected in surgery group only before the low-calorie diet and 6 months after the operation. Therefore, we can’t rule out that part of the microbiota changes was induced by presurgery diet. Fourth, HITChip is based on cross-hybridization of the complementary 16S rRNA sequences, and may therefore include noise from related sequences, and potential misclassifications between closely related species. For this reason, we have restricted the analysis on genus-level profiles. The other shortcoming of phylogenetic microarrays is that they quantify only the known community members that have been included on the microarray design. The HITChip has been designed to capture all major bacterial groups that have been reported in human gut microbiome; it may miss some rare groups that have low abundance and low population prevalence. On the other hand, this platform is standardized, highly reproducible, and cost efficient compared to sequencing depths that can reach the same sensitivity.
Conclusion
The intestinal microbiota composition of morbidly obese subjects shifted towards group A (“normal weight”) controls within six months after the bariatric surgery. This shift was detectable in the overall community composition, richness, Bacteroidetes/Firmicutes ratio, as well as in abundances of specific bacterial genera. However, the individuality of the microbiota community composition was preserved in most cases so that the microbiota profiles could be used to identify individuals before and after surgery. In addition, we observed that the control subjects clustered in two broad groups with a distinct microbiota composition characterized by differences in particular in Bacteroides, whose abundance was on average higher in the group A controls than in group B subjects (“lean” controls). Hence, broad community types might be an essential feature to include in the original study design in future studies.
Supplemental Information
Anonymized raw data
Genus-level abundance profiles quantified with the HITChip phylogenetic microarray and anonymized subject metadata including subject ID, treatment group, time point, microbiota diversity, BMI group, and diabetes status.
Hierarchical clustering of the control subjects based on the genus-level microbiota profiles (complete linkage; Spearman correlation)
The labels indicate the BMI (kg/m 2) for each study subject.
Community similarity highlighted for the post-surgery samples
No statistically significant difference is observed in the community composition between the Sleeve (black) and Bypass (gray) methods (p > 0.05; PERMANOVA).
Community similarity in the post-surgery samples
Average pairwise log2 fold-changes for the genus-like groups within the Bacteroidetes and Firmicutes that had significant or borderline significant shifts following surgery (pairwise test; p < 0.25).
Subject identification
Similarity between the microbiota profiles from each obese subject before surgery (horizontal axis) against all microbiota samples from the obese subjects after the surgery (vertical axis; Spearman correlation; the comparison values are connected by the solid vertical line). Spearman correlation for the correct hit is highlighted by black indicating the correlation between pre- and post-surgery samples for the given subject indicated on the horizontal axis. The subject can be identified after the surgery based on the Spearman correlation with pre-surgery sample in 10/13 cases (77%); for three subjects (23%) the highest Spearman correlation is with a sample from a different subject.