

Path sampling for atmospheric reactions: formic acid catalysed conversion of SO3 + H2O to H2SO4
- Published
- Accepted
- Received
- Academic Editor
- Christof Jäger
- Subject Areas
- Theoretical and Computational Chemistry, Kinetics and Reactions, Physical Chemistry (other), Thermodynamics and Statistical Mechanics
- Keywords
- Path sampling, Catalysis, Kinetics, Acid rain, Sulphuric acid, Atmospheric chemistry, AIMD, DFT, Transition state theory
- Copyright
- © 2020 Daub et al.
- Licence
- This is an open access article distributed under the terms of the Creative Commons Attribution License, which permits unrestricted use, distribution, reproduction and adaptation in any medium and for any purpose provided that it is properly attributed. For attribution, the original author(s), title, publication source (PeerJ Physical Chemistry) and either DOI or URL of the article must be cited.
- Cite this article
- 2020. Path sampling for atmospheric reactions: formic acid catalysed conversion of SO3 + H2O to H2SO4. PeerJ Physical Chemistry 2:e7 https://doi.org/10.7717/peerj-pchem.7
Abstract
Atmospheric reactions, hitherto studied computationally mainly with static computations in conjunction with transition state theories, can be further described via path sampling calculations. Here we report on an exploratory study of the formic acid catalysed hydrolysis of SO3 to produce H2SO4. We demonstrate that precise measurements of rate coefficients can be obtained in principle for such reactions with an acceptable expenditure of computational resources, and that new insights into the reaction can be obtained by the analysis of the path space explored via path sampling techniques.
Introduction
SO3 dispersed in the atmosphere reacts with water, generating H2SO4 which is one of the main contributors to acidic rain, as well as contributing to nucleation processes in the upper atmosphere. The SO3 · H2O complex can form readily, however early investigations of the hydrolysis of SO3 to form H2SO4 found the uncatalysed rate to be too low to explain the concentration of atmospheric H2SO4 (Wang et al., 1988; Hofmann & Von Ragué Schleyer, 1994; Loerting & Liedl, 2000). Further studies revealed that the formation of H2SO4 is catalysed by collisions with other atmospheric molecules (Akhmatskaya et al., 1997; Hazra & Sinha, 2011; Long et al., 2012; Torrent-Sucarrat, Francisco & Anglada, 2012; Bandyopadhyay, Kumar & Biswas, 2017; Sarkar, Oram & Bandyopadhyay, 2019), where the common denominator is the facilitation of a double proton transfer via the catalysing molecule (Kumar, Sinha & Francisco, 2016). The relative importance of collisions with different molecules is determined by both the atmospheric concentration of the colliding molecule and the species-dependent reaction rate. For example, while water vapour has a high atmospheric concentration, the reaction barrier remains quite high when an additional water molecule acts as the catalyst (Akhmatskaya et al., 1997; Long et al., 2012). On the other hand, NH3 is an effective catalyst, lowering the reaction barrier significantly, but its atmospheric concentration is comparatively low (Bandyopadhyay, Kumar & Biswas, 2017; Sarkar, Oram & Bandyopadhyay, 2019).
Recent work has highlighted the importance of formic acid, HCOOH, in catalysing the SO3 hydration reaction (Hazra & Sinha, 2011; Long et al., 2012). Static quantum chemical calculations of the initial and final states, combined with reaction kinetics and transition state theory (TST), show that the reaction becomes nearly barrier-less, and hence that HCOOH is an effective catalyst. Combined with the recent findings that formic acid concentrations in the atmosphere are higher than previously assumed (Millet et al., 2015; Chaliyakunnel et al., 2016), and the presence of formic acid in volatile organic compounds (VOCs) emitted in boreal forests (Rantala et al., 2015), it seems likely that the formic acid catalysed hydration of SO3 is a significant contributor to sulphuric acid concentrations in the atmosphere.
Investigations of gas phase SO3 hydration reactions, however, to our knowledge have heretofore only been performed by static calculations, with kinetics and dynamics only included via TST (Long et al., 2012) or Rice, Ramsperger, Kassel, Markus (RRKM) theory (Hazra & Sinha, 2011). In the present work, we aim to directly investigate the dynamics of the formic acid catalysed conversion of SO3 · H2O to H2SO4 via path sampling (Van Erp, 2007; Van Erp, Moroni & Bolhuis, 2003; Moroni, Bolhuis & Van Erp, 2004). The method has recently reached a sufficient level of maturity, both theoretically (Riccardi, Dahlen & Van Erp, 2017; Cabriolu et al., 2017) and computationally (Lervik, Riccardi & Van Erp, 2017; Riccardi et al., 2019a). Notable recent work using path sampling has focused on chemical or other transitions between states in aqueous systems, for example water auto-ionization (Moqadam et al., 2018), interactions between biomolecules (Riccardi et al., 2019c) and silicate condensation (Moqadam et al., 2017). The main focus of the present work is to demonstrate the application of path sampling to investigating a new class of gas-phase reactions.
The path sampling approach here chosen is the replica exchange transition interface sampling (RETIS) (Van Erp, 2007; Cabriolu et al., 2017). It permits the investigation of the path space, and thus the determination of a reaction rate, orders of magnitude faster than conventional simulations. This computational enhancement does not come at the cost of resolution since the method provides the same results, when converged, as infinitely long standard simulations. The RETIS methodology will be combined with ab initio molecular dynamics (AI-MD) simulations to predict the reaction rate of the uni-molecular SO3 hydration reaction with formic acid, considering different density functional theory (DFT) functionals and basis sets, and comparing the results with data available in the literature produced by more approximate methods (e.g., TST).
Materials and Methods
Description of the reaction and DFT methods
We perform DFT-based Born–Oppenheimer molecular dynamics (BO-MD) simulations using the QUICKSTEP module in CP2K (VandeVondele et al., 2005). Before beginning these simulations we considered several different combinations of DFT functionals and basis sets, first investigating the relative energies of the product and reactant states using NWChem (Valiev et al., 2010).
Snapshots of optimised geometries in the reactant (A1 and A2) and product (B1 and B2) states are displayed in Fig. 1. Other computational studies of SO3 hydration have considered the complete reaction pathway, including the formation of the pre-reactive complex via atmospheric collisions. In this study, we focus only on the uni-molecular reaction involving the double proton transfer from the water molecule via the formic acid to form sulphuric acid, that is
This reaction involves no collisions, and can be treated as an isomerization reaction, with first-order kinetics described by a single rate coefficient kAB with units of inverse time. In previous work, this uni-molecular rate coefficient has been computed using TST (Long et al., 2012) and RRKM theory (Hazra & Sinha, 2011). The uni-molecular reaction barrier height was found to be low (0.3 kJ mol −1 at the MP2/6-311++G(3df, 3pd) level of theory (Hazra & Sinha, 2011)) compared to the barrier for the water catalysed reaction.
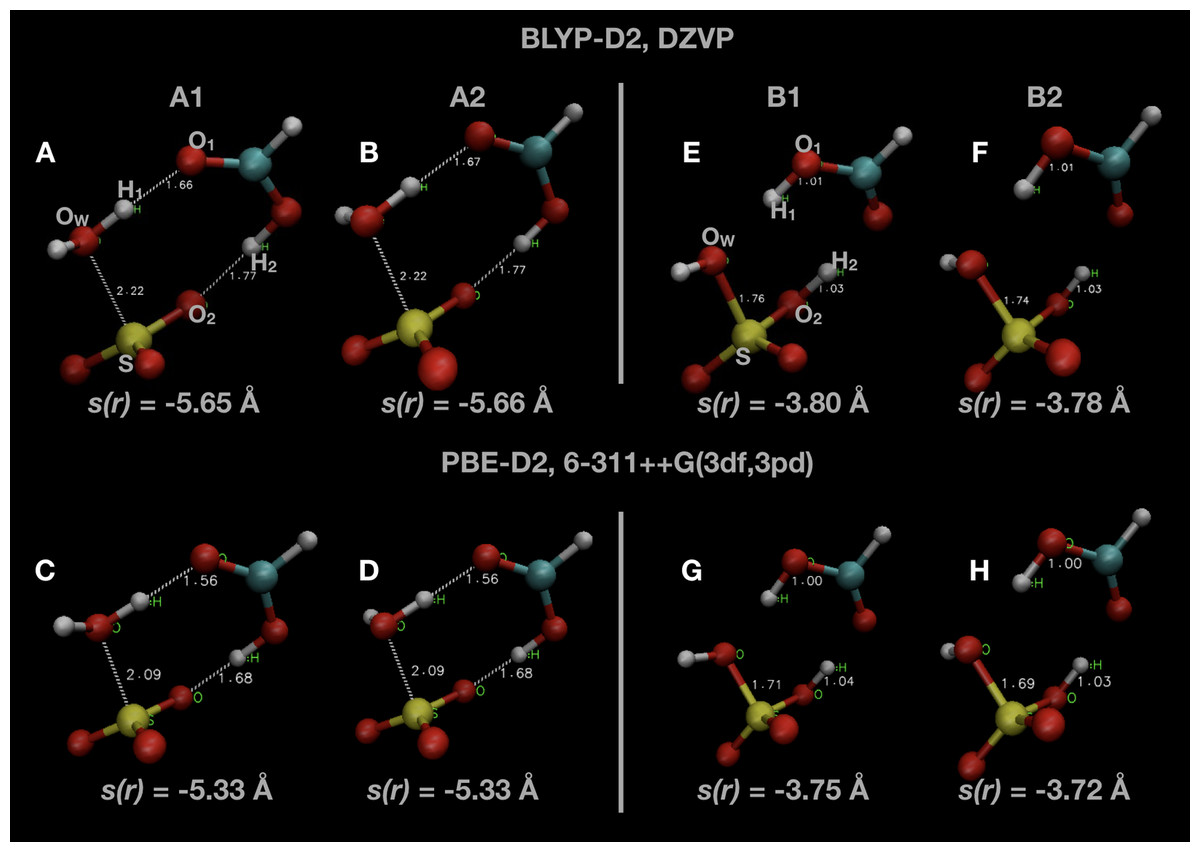
Figure 1: Snapshots of optimised initial states (A–D) and final product states (E–H) of the system.
Indicated atoms and inter-atomic distances are used in the definition of the order parameter s(r) defined in Eq. (1).
Two different local minima in both reactant and product states are present, differing only in the orientation of one OH bond initially belonging to the water molecule. The minimum in the reactant state (A1) differs from that reported in other investigations of this reaction (A2), but is only ∼1 kJ mol −1 lower in energy. The minimum energy in the product state (B2) is generally several kJ mol −1 lower in energy than the other local minimum (B1). We remark that we did not consider the final re-organization of the post-reaction H2SO4 · HCOOH complex into a lower energy conformation which is the true global minimum (Hazra & Sinha, 2011). The uni-molecular rate coefficient we measure is unaffected by this final rearrangement since it is a spontaneous process. We display some of these results along with comparisons with the literature in Table 1.
| Theory/basis set | EA1 | EA2 | EB1 | EB2 |
|---|---|---|---|---|
| BLYP/DZVP | 0.0 | 1.1 | 8.1 | 3.5 |
| BLYP/TZVP | 0.0 | 1.2 | 0.3 | −2.9 |
| B3LYP/TZVP | 0.0 | 1.1 | −17.4 | −22.3 |
| PBE/TZVP | 0.0 | 1.3 | −9.2 | −13.0 |
| PBE/6-311++G(3df, 3pd) | 0.0 | 1.0 | −13.9 | −18.4 |
| PBE/aug-cc-pVTZ | 0.0 | 1.2 | −12.5 | −16.5 |
| PBE0/TZVP | 0.0 | 1.3 | −27.3 | −32.4 |
| MP2/6-311++G(3df, 3pd) (Hazra & Sinha, 2011) | – | 0.0 | – | −32.4 |
| CCSD(T)//MP2/aug-cc-pV(T + d)Z (Long et al., 2012) | – | 0.0 | – | −42.5 (−41.0) |
Hybrid functionals such as B3LYP or PBE0 which include some of the Hartree–Fock exchange correlation are necessary to obtain DFT based results which are in good agreement with fully ab initio methods. However, using hybrid functionals in BO-MD simulations would be prohibitively expensive, especially for an exploratory study such as this one. In the end, in our BO-MD simulations, we compare two Generalized Gradient Approximation (GGA) DFT methods, with three different basis sets (Goedecker, Teter & Hutter, 1996). First, we use the BLYP functional (Becke, 1988; Lee, Yang & Parr, 1988) with the DZVP-MOLOPT-GTH basis functions, which we have previously used to investigate formic acid in bulk water (Murdachaew et al., 2016; Hänninen et al., 2018; Daub & Halonen, 2019). Although the BLYP results lack accuracy in terms of the comparative energies of the initial and final states, it was a relatively inexpensive methodology to use for initial investigation. Thereafter, the PBE functional (Perdew, Burke & Ernzerhof, 1996) and both the TZVP-MOLOPT-GTH and TZV2P-MOLOPT-GTH basis sets have been used. There are some differences between the basis sets implemented in NWChem and the plane-wave basis sets employed in CP2K, but respective double-zeta and triple-zeta basis sets should be similar. In particular, we note that the 6-311++G(3df, 3pd) Gaussian basis set produced comparable results to the TZV2P-MOLOPT-GTH basis set. All simulations, both with NWChem and CP2K, used the Grimme D2 dispersion correction (Grimme, 2004, 2006). All BO-MD simulations were performed in the microcanonical (NVE) ensemble in a cubic periodic box of fixed geometry with a box length of L = 8 Å (1 Å = 10−10 m).
Path sampling using RETIS
The estimation of a reaction rate via path sampling requires a numerical descriptor able to distinguish the product and reactant states and indicate the reaction progress: the order parameter. A proper selection of this parameter allows a more efficient sampling of the reaction pathway. In this study, we identify three different inter-atomic distances which all must decrease as the reaction proceeds. The parameter we introduce is the negative of the sum of these three distances (1)
The negative value is a technical necessity so that the value of the order parameter, s(r), will increase from the reactant to the product state. The atom indices indicated are labelled in Fig. 1, as well as the value of s(r) in some of the configurations shown. The value of s(r) in the optimised initial state(s) depends on the DFT method, changing from s(r) ≃ −5.65 Å in the BLYP calculations to s(r) ≃ −5.3 Å in the PBE calculations. Regardless of the DFT method, s(r) ≃ −3.75 Å in the optimised final state after the reaction.
The RETIS (Van Erp, 2007; Cabriolu et al., 2017) method has been adopted to properly sample the transition region. We will briefly describe the method here, and point interested readers to the existing literature for more details (Van Erp, 2007; Riccardi, Dahlen & Van Erp, 2017; Cabriolu et al., 2017; Lervik, Riccardi & Van Erp, 2017; Van Erp et al., 2016).
We define a set of ninter interfaces , with λi < λi + 1, sub-dividing the path between product and reactant states along the order parameter s(r). Configurations with s(r) < λ0 are defined as being in the reactant state A, while configurations with s(r) > are defined as being in the product state B. Furthermore, ninter −1 sets of path ensembles are defined which consist of all paths which start at λ0, proceed in the positive direction to cross λi at least once, and end by crossing either λ0 again or by crossing the final interface . An additional ensemble required to be defined in RETIS is the [0−] ensemble, containing all of the paths which begin at λ0, proceed in a backwards direction, and cross λ0 again.
Statistical mechanical arguments can be used to show that the reaction rate coefficient kAB can be expressed as (2) where the initial flux fA is determined from the average lengths of paths in the [0−] and [0+] ensembles (3) and the partial crossing probability term, PA(λi + i|λi), is the conditional probability that a path crosses interface λi + 1 given it has already crossed λi.
The initial points from which to generate a new path are determined with different Monte Carlo (MC) moves. In PyRETIS, the MC moves used are called shooting, time reversal and ensemble swapping, and were selected with a relative probability of 0.5, 0.25 and 0.25, respectively, according to the developers’ guidelines (Lervik, Riccardi & Van Erp, 2017).
In Table 2 we summarise all RETIS simulations with the same temperature T = 300 K included in this study. We have also completed a number of simulations at different temperatures to investigate the temperature dependence of the reaction rates. Different initial configurations corresponding to the two different reactant minima A1 and A2 were used. All initial paths were generated by the PyRETIS kick method (Lervik, Riccardi & Van Erp, 2017), whereby a path is constructed starting from the initial configuration by altering velocities at each step and only accepting the step if it increases the value of s(r). In some cases, after a short equilibration run simulations were restarted by using the PyRETIS load function (Riccardi et al., 2019a) to start from the final path accepted in the first simulation. In general, initial paths generated by kick (an approach based on a combination of Monte Carlo and BO-MD) can require many cycles to find physically realistic reaction paths; in this particular study, the initial paths agree closely with the real reaction pathways found using RETIS. To facilitate the reproduction of our findings, the inputs files will be provided to the PyRETIS developers to be uploaded on the software website, according to the Open Data initiative (Riccardi, Pantano & Potestio, 2019b).
| DFT + basis set | Init. cfg. | ninter | λ0/Å | λninter−1/Å | ncycles | tsim/ps |
|---|---|---|---|---|---|---|
| BLYP, DZVP | A1 | 7 | −5.65 | −4.0 | 1,331 | 644 |
| BLYP, DZVP | A1 | 10 | −5.7 | −3.8 | 1,015 | 916 |
| BLYP, DZVP | A2 | 7 | −5.65 | −4.0 | 914 | 458 |
| PBE, TZVP | A1 | 8 | −5.25 | −3.9 | 999 | 325 |
| PBE, TZVP | A2 | 8 | −5.25 | −3.9 | 1,009 | 324 |
| PBE, TZV2P | A1 | 8 | −5.25 | −3.9 | 996 | 339 |
| PBE, TZV2P | A2 | 7 | −5.3 | −3.9 | 993 | 318 |
| PBE, TZV2P | A1 | 6 | −5.7 | −3.9 | 756 | 647 |
| BLYP, DZVP (250 K) | A1 | 10 | −5.8 | −4.0 | 975 | 1,265 |
| BLYP, DZVP (250 K) | A2 | 6 | −5.7 | −4.0 | 891 | 447 |
| PBE, TZV2P (250 K) | A1 | 6 | −5.65 | −3.9 | 519 | 533 |
| PBE, TZV2P (275 K) | A1 | 6 | −5.65 | −3.9 | 530 | 496 |
| PBE, TZV2P (325 K) | A1 | 6 | −5.65 | −3.9 | 937 | 539 |
| PBE, TZV2P (350 K) | A1 | 6 | −5.65 | −3.9 | 988 | 520 |
Results
As shown in Eq. 2, the computed reaction rate coefficient, kAB, is derived from the initial flux fA multiplied by the total crossing probability Pcross. The value of fA × Pcross at the end of ncycles of the RETIS simulations is reported in Fig. 2. The value of kAB obtained via path sampling using the RETIS methodology is directly comparable with the uni-molecular rate coefficient describing the double proton transfer reaction forming H2SO4. We show the average result obtained at the end of ncycles of all RETIS simulations using a given DFT method, basis set and temperature. Our most accurate estimate at T = 300 K has been obtained via PBE calculations with the TZV2P basis set, kAB = 3.5 × 10⁻⁴ fs−1, with a statistical error of ∼50%. For comparison, a computation of the rate coefficient at T = 300 K based on TST and reaction kinetics calculations (see column 6 of Table S4 in the Supporting Information for Long et al., 2012) gave an estimate of kAB = 1.9 × 10⁻³ fs−1, while calculations based on the RRKM kinetic theory (see Table 7 in the Supporting Information for Hazra & Sinha, 2011) gave an estimate of kAB = 4.6 ± 0.1 × 10⁻⁴ fs−1. Overall, our predicted rate coefficient is in reasonable agreement with previous estimates in the literature, despite the fact that we underestimate the energy difference between the reactant and product states (see Table 1). We might reasonably expect that a RETIS calculation using a hybrid functional such as PBE0 with a more accurate energy difference would result in a somewhat larger rate coefficient. Unfortunately, at the present time the computational resources required for such calculations leave the use of hybrid functionals in path sampling calculations beyond our reach.
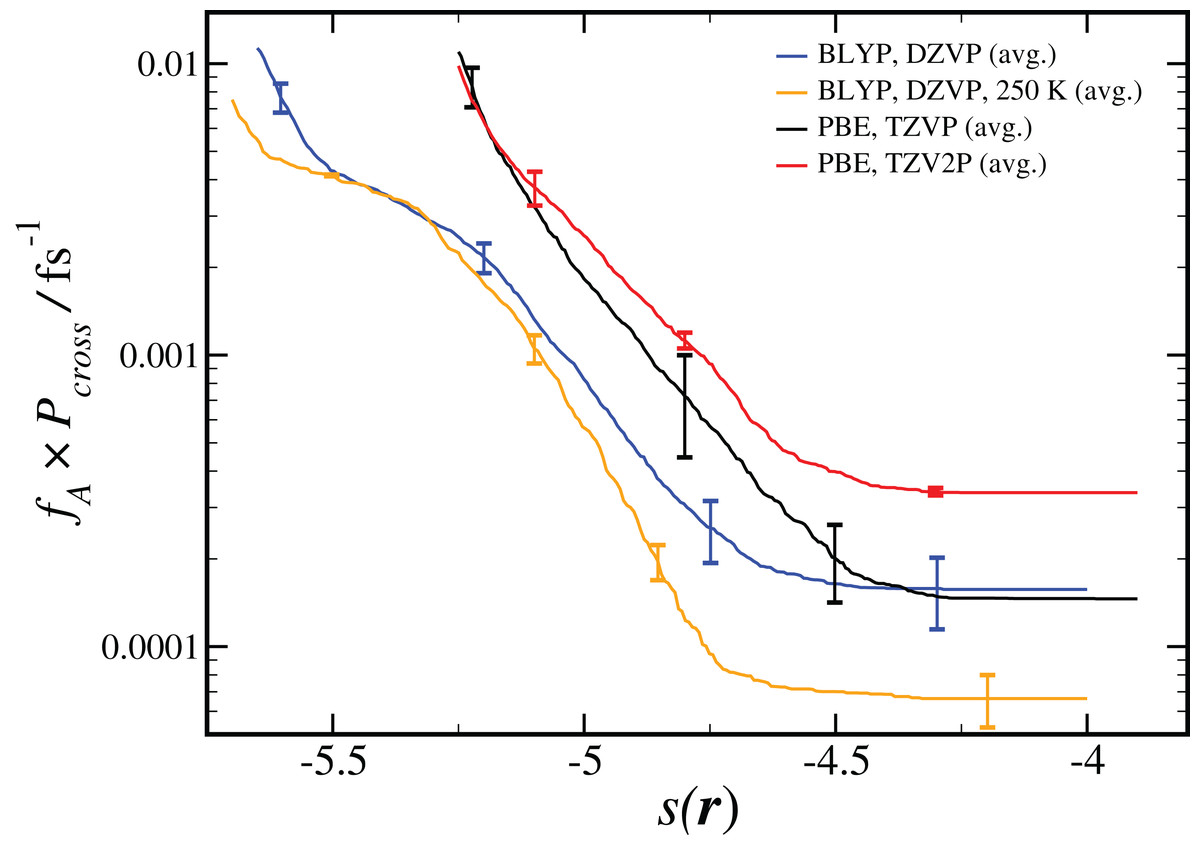
Figure 2: Results from RETIS calculation of the uni-molecular reaction rate (fA × Pcross), as a function of the order parameter s(r) defined in Eq. (1).
Results for a given DFT method, basis set and temperature are averaged over the different initial configurations and sets of interfaces shown in Table 2, with the standard error in the mean displayed for representative points. All results are calculated at T = 300 K unless otherwise noted.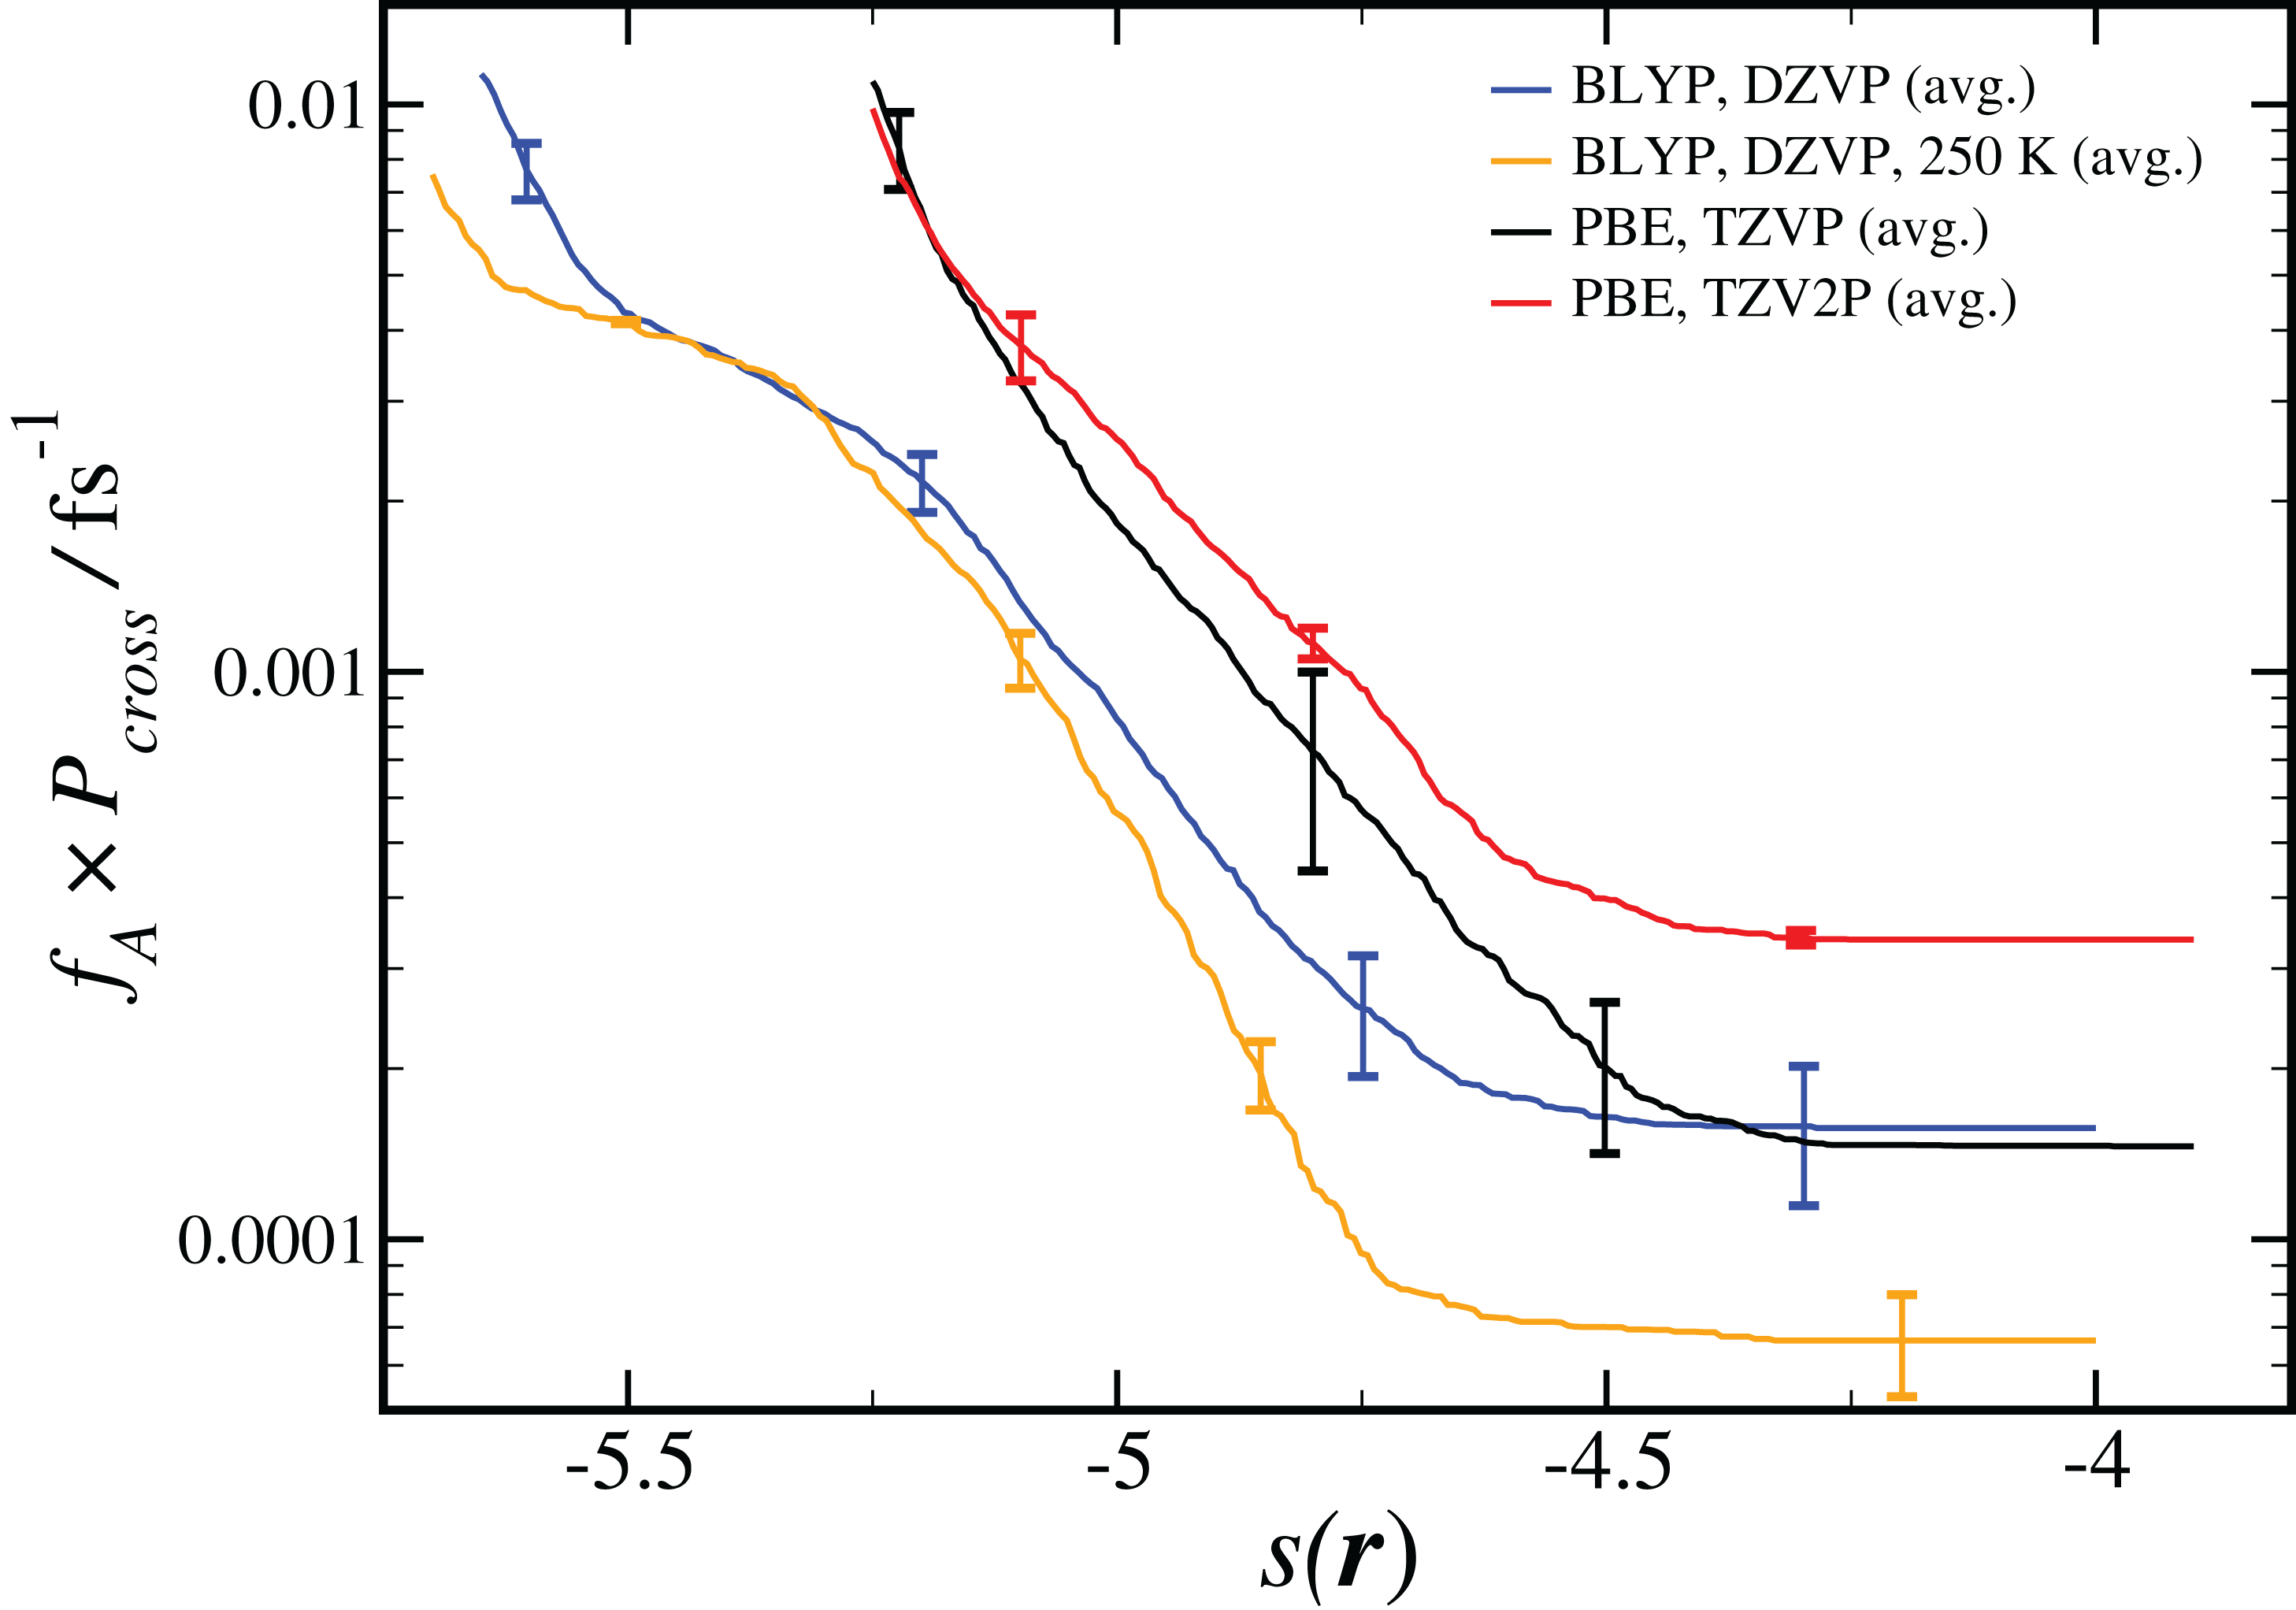
Our estimated rate coefficients kAB reported in Fig. 2 include a total of at least 300 ps of simulation data for each RETIS run. In Fig. 3 we show the final value of kAB (i.e., the value of kAB at the maximum value of s(r)) as a function of the RETIS cycle number for the PBE calculation using the TZV2P basis set. This plot shows that our results are well-converged, and in fact that reliable results could have been obtained from a simulation using only half the data, or less. More careful optimisation of the interface positions λi would also help the results to converge with less total simulation time.
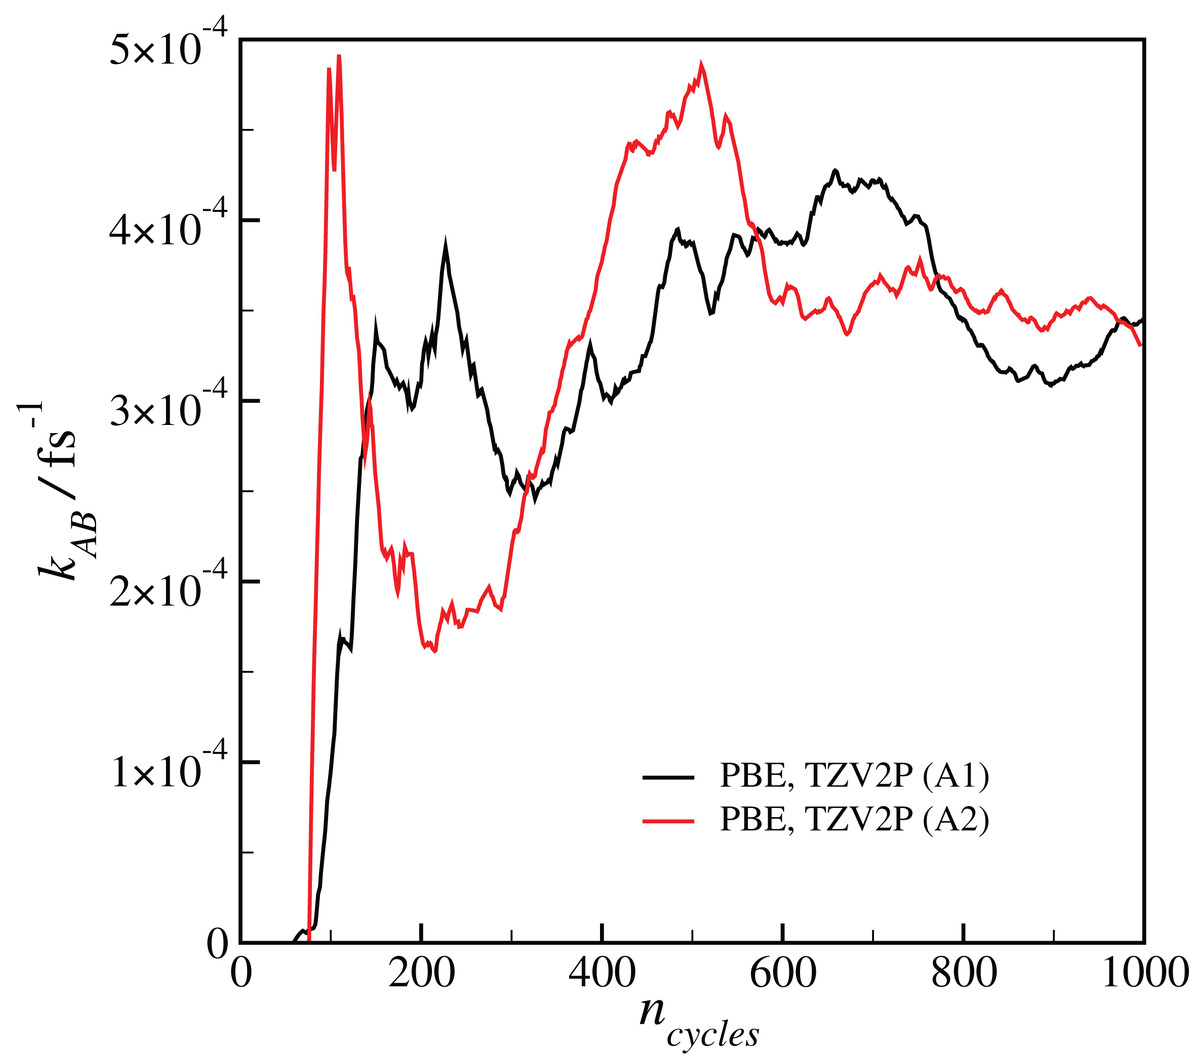
Figure 3: Plot of the calculated final reaction rate kAB as a function of the RETIS cycle ncycle for the two calculations with the PBE functional and the TZV2P basis set.
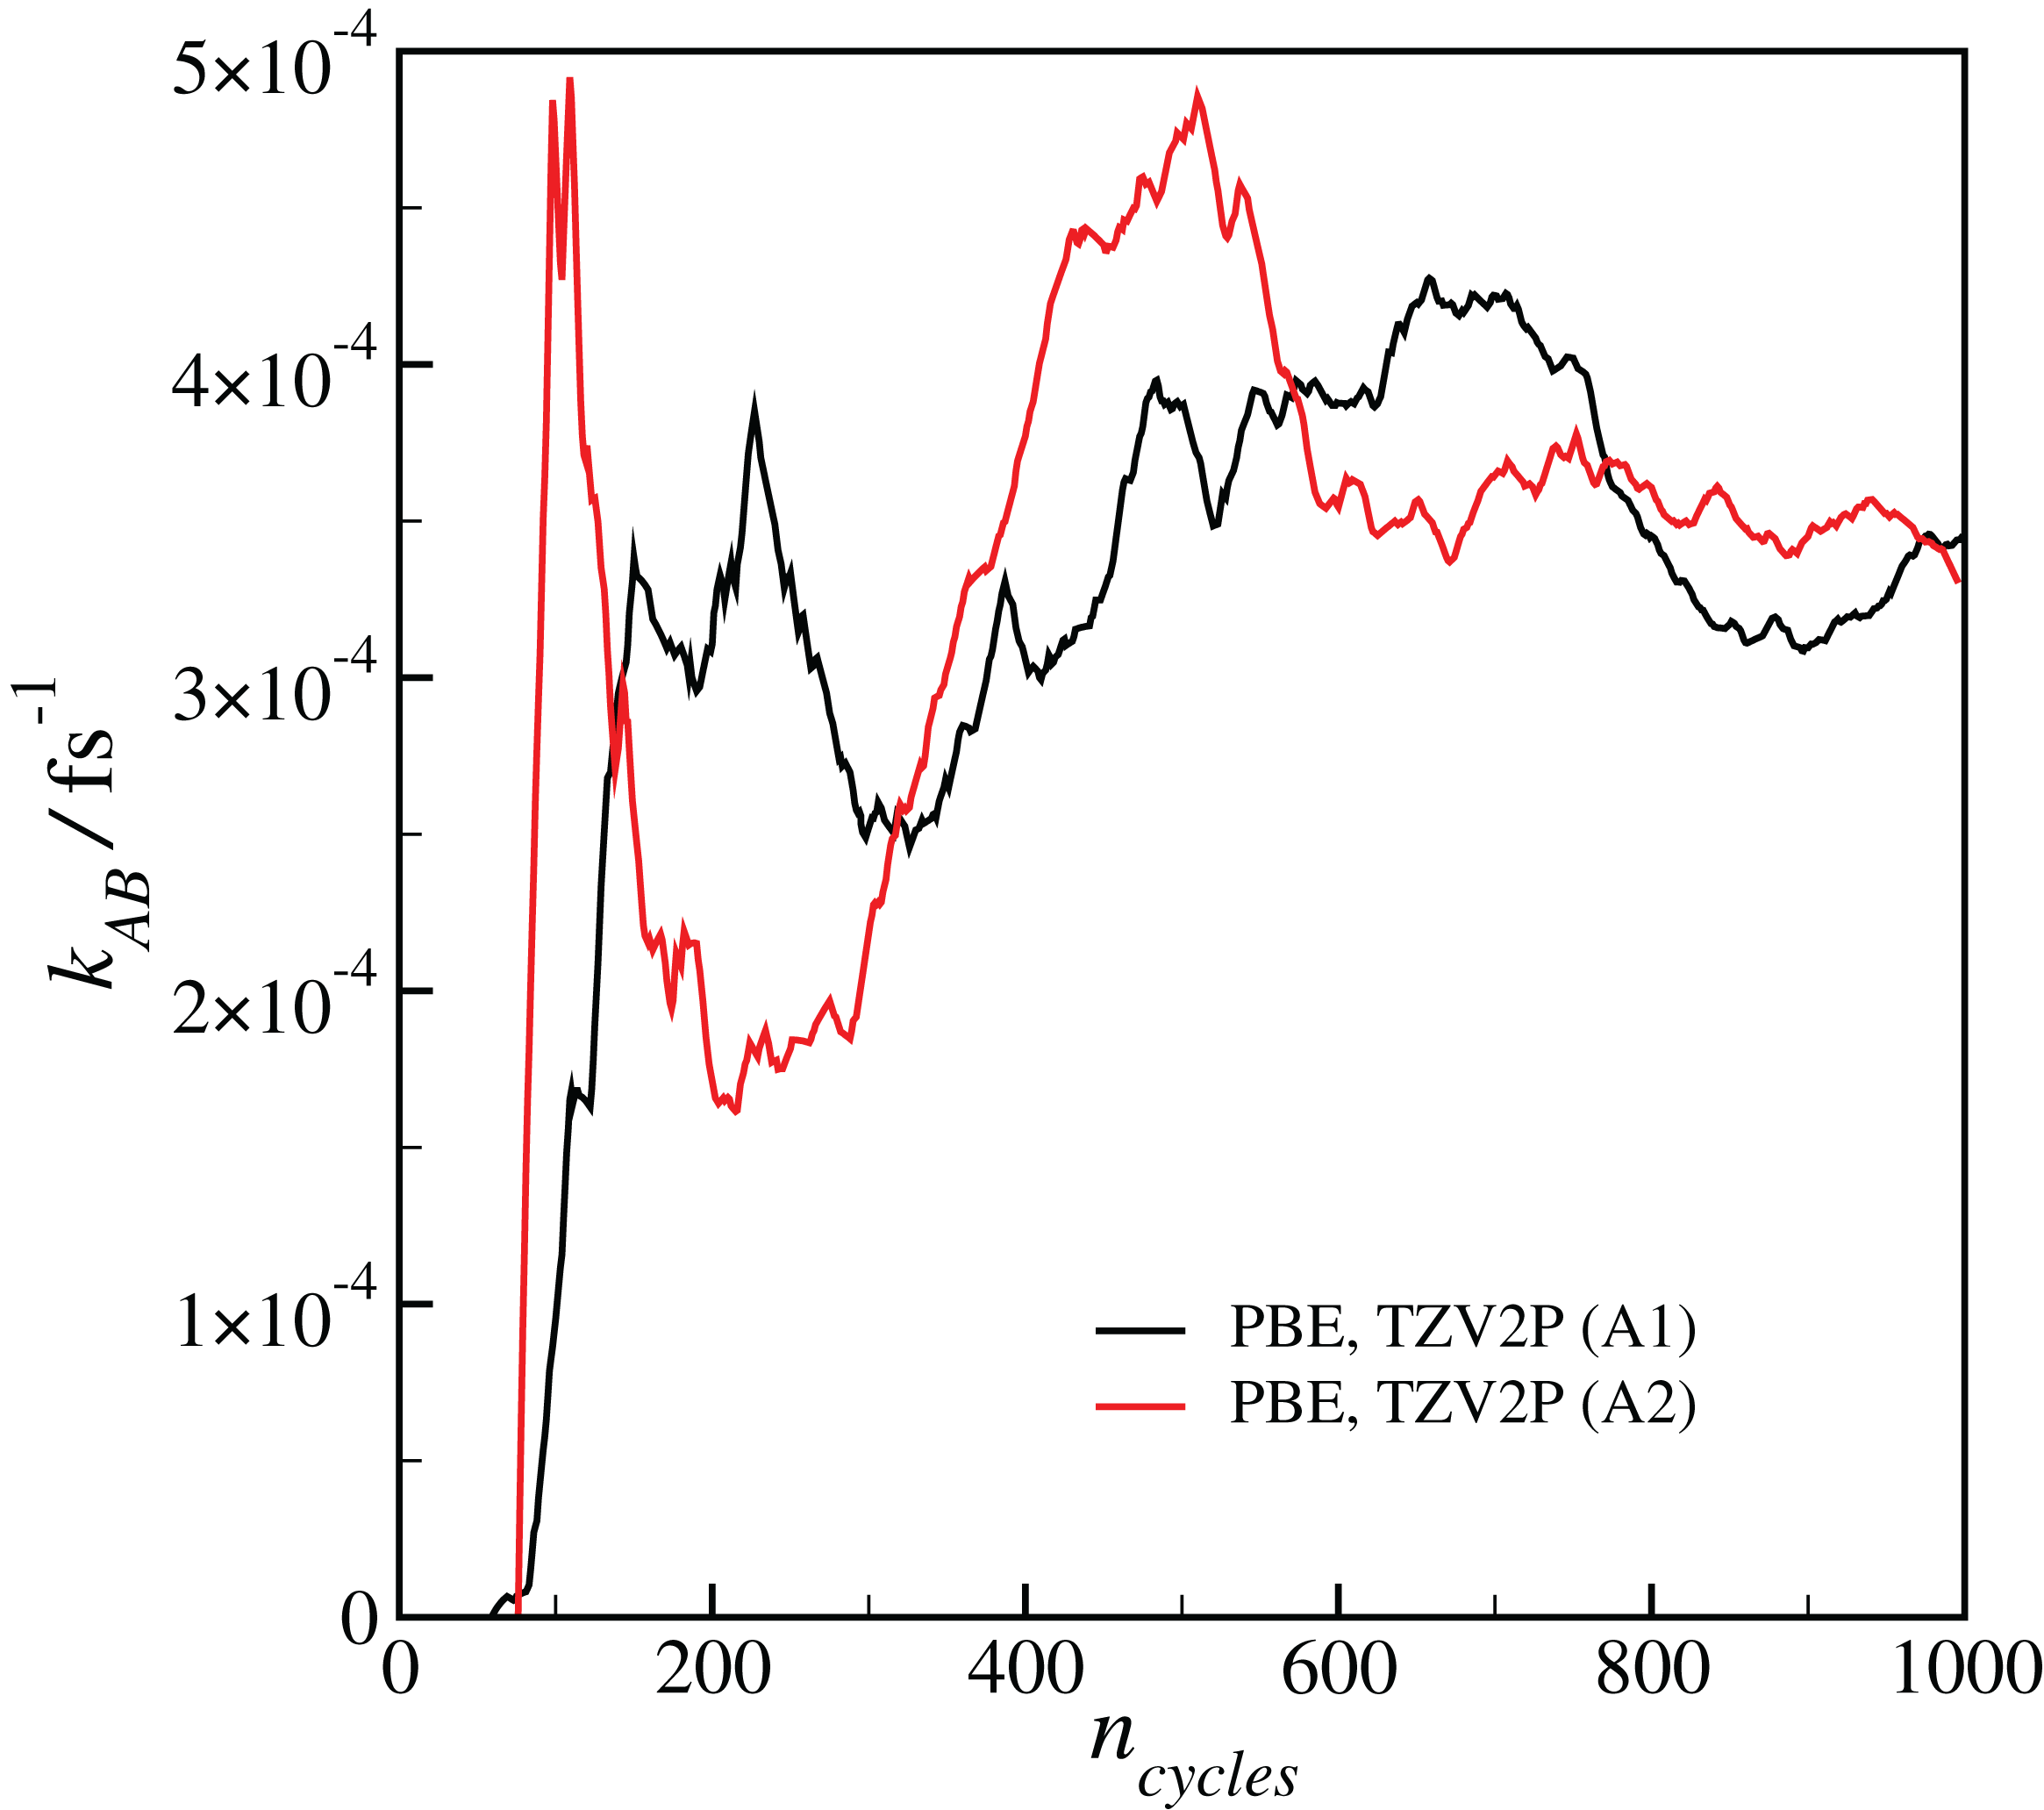
Comparison of results using the same basis set and level of theory (BLYP, DZVP) at two different temperatures (300 K and 250 K) showed that the RETIS simulations predict a smaller rate coefficient at lower temperature. While this may make intuitive sense, it disagrees with the TST results, which predict an increase in the uni-molecular rate coefficient at lower temperature (Long et al. (2012), see column 6 of Table S4 of the Supporting Information). Subsequently, we performed a series of simulations using the most reliable basis set and level of theory available to us (i.e., PBE, TZV2P), at a series of temperatures ranging from T = 250 to 350 K. This approach should allow us to directly compare the temperature dependence observed in the TST calculation with the results of the RETIS method. We summarise these results in Fig. 4.
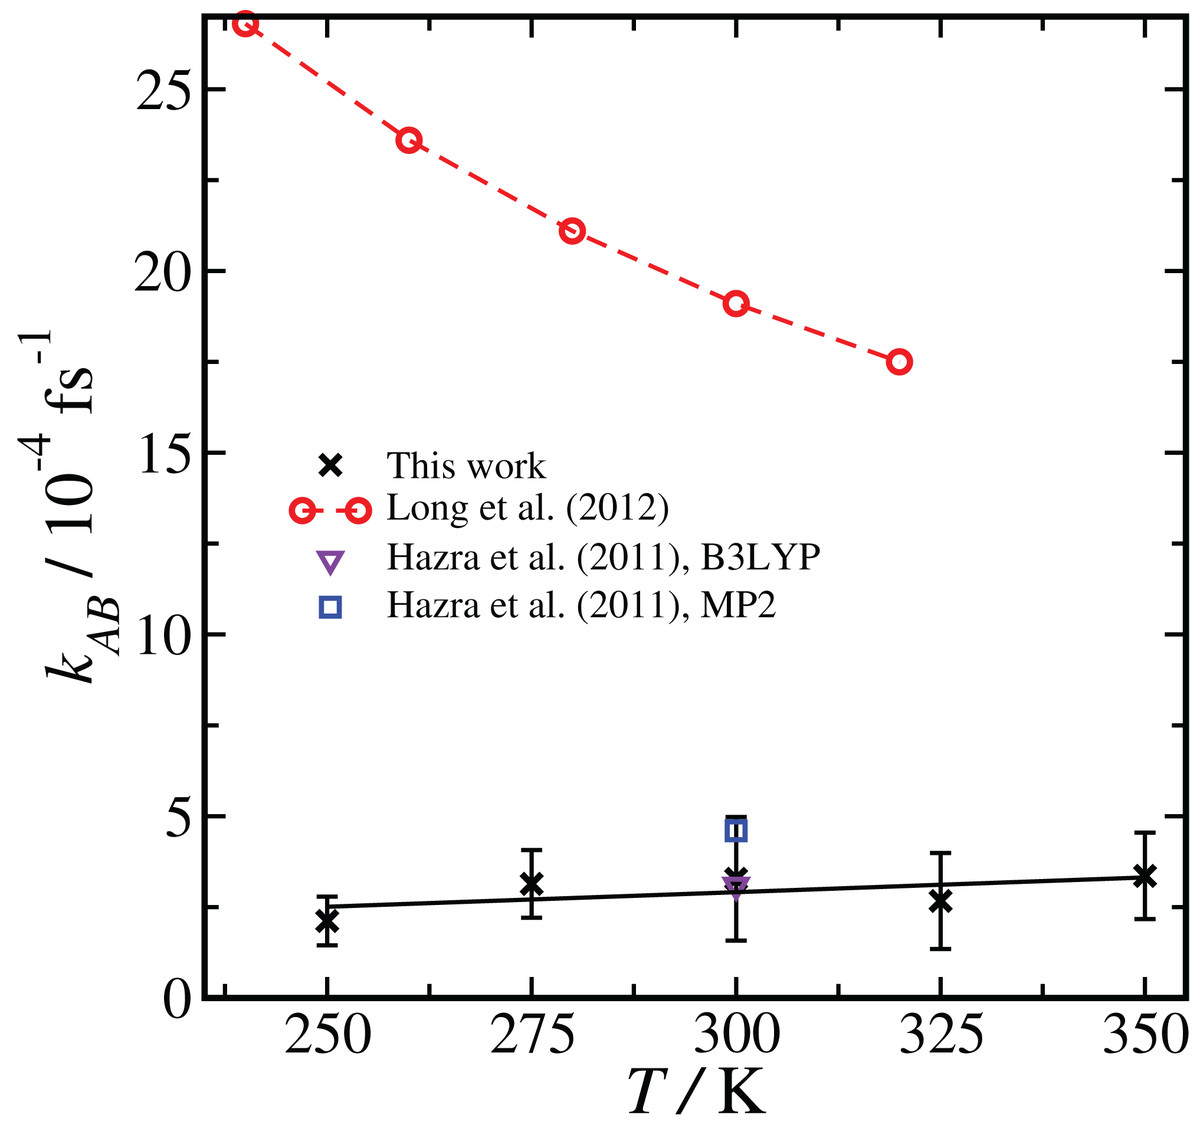
Figure 4: Temperature dependence of the reaction rate coefficient kAB, comparing our results with RETIS and the PBE functional and the TZV2P basis set with previous literature results using TST and RRKM theories.
Error bars are one standard deviation in the mean. The black line is from a linear regression of the RETIS data.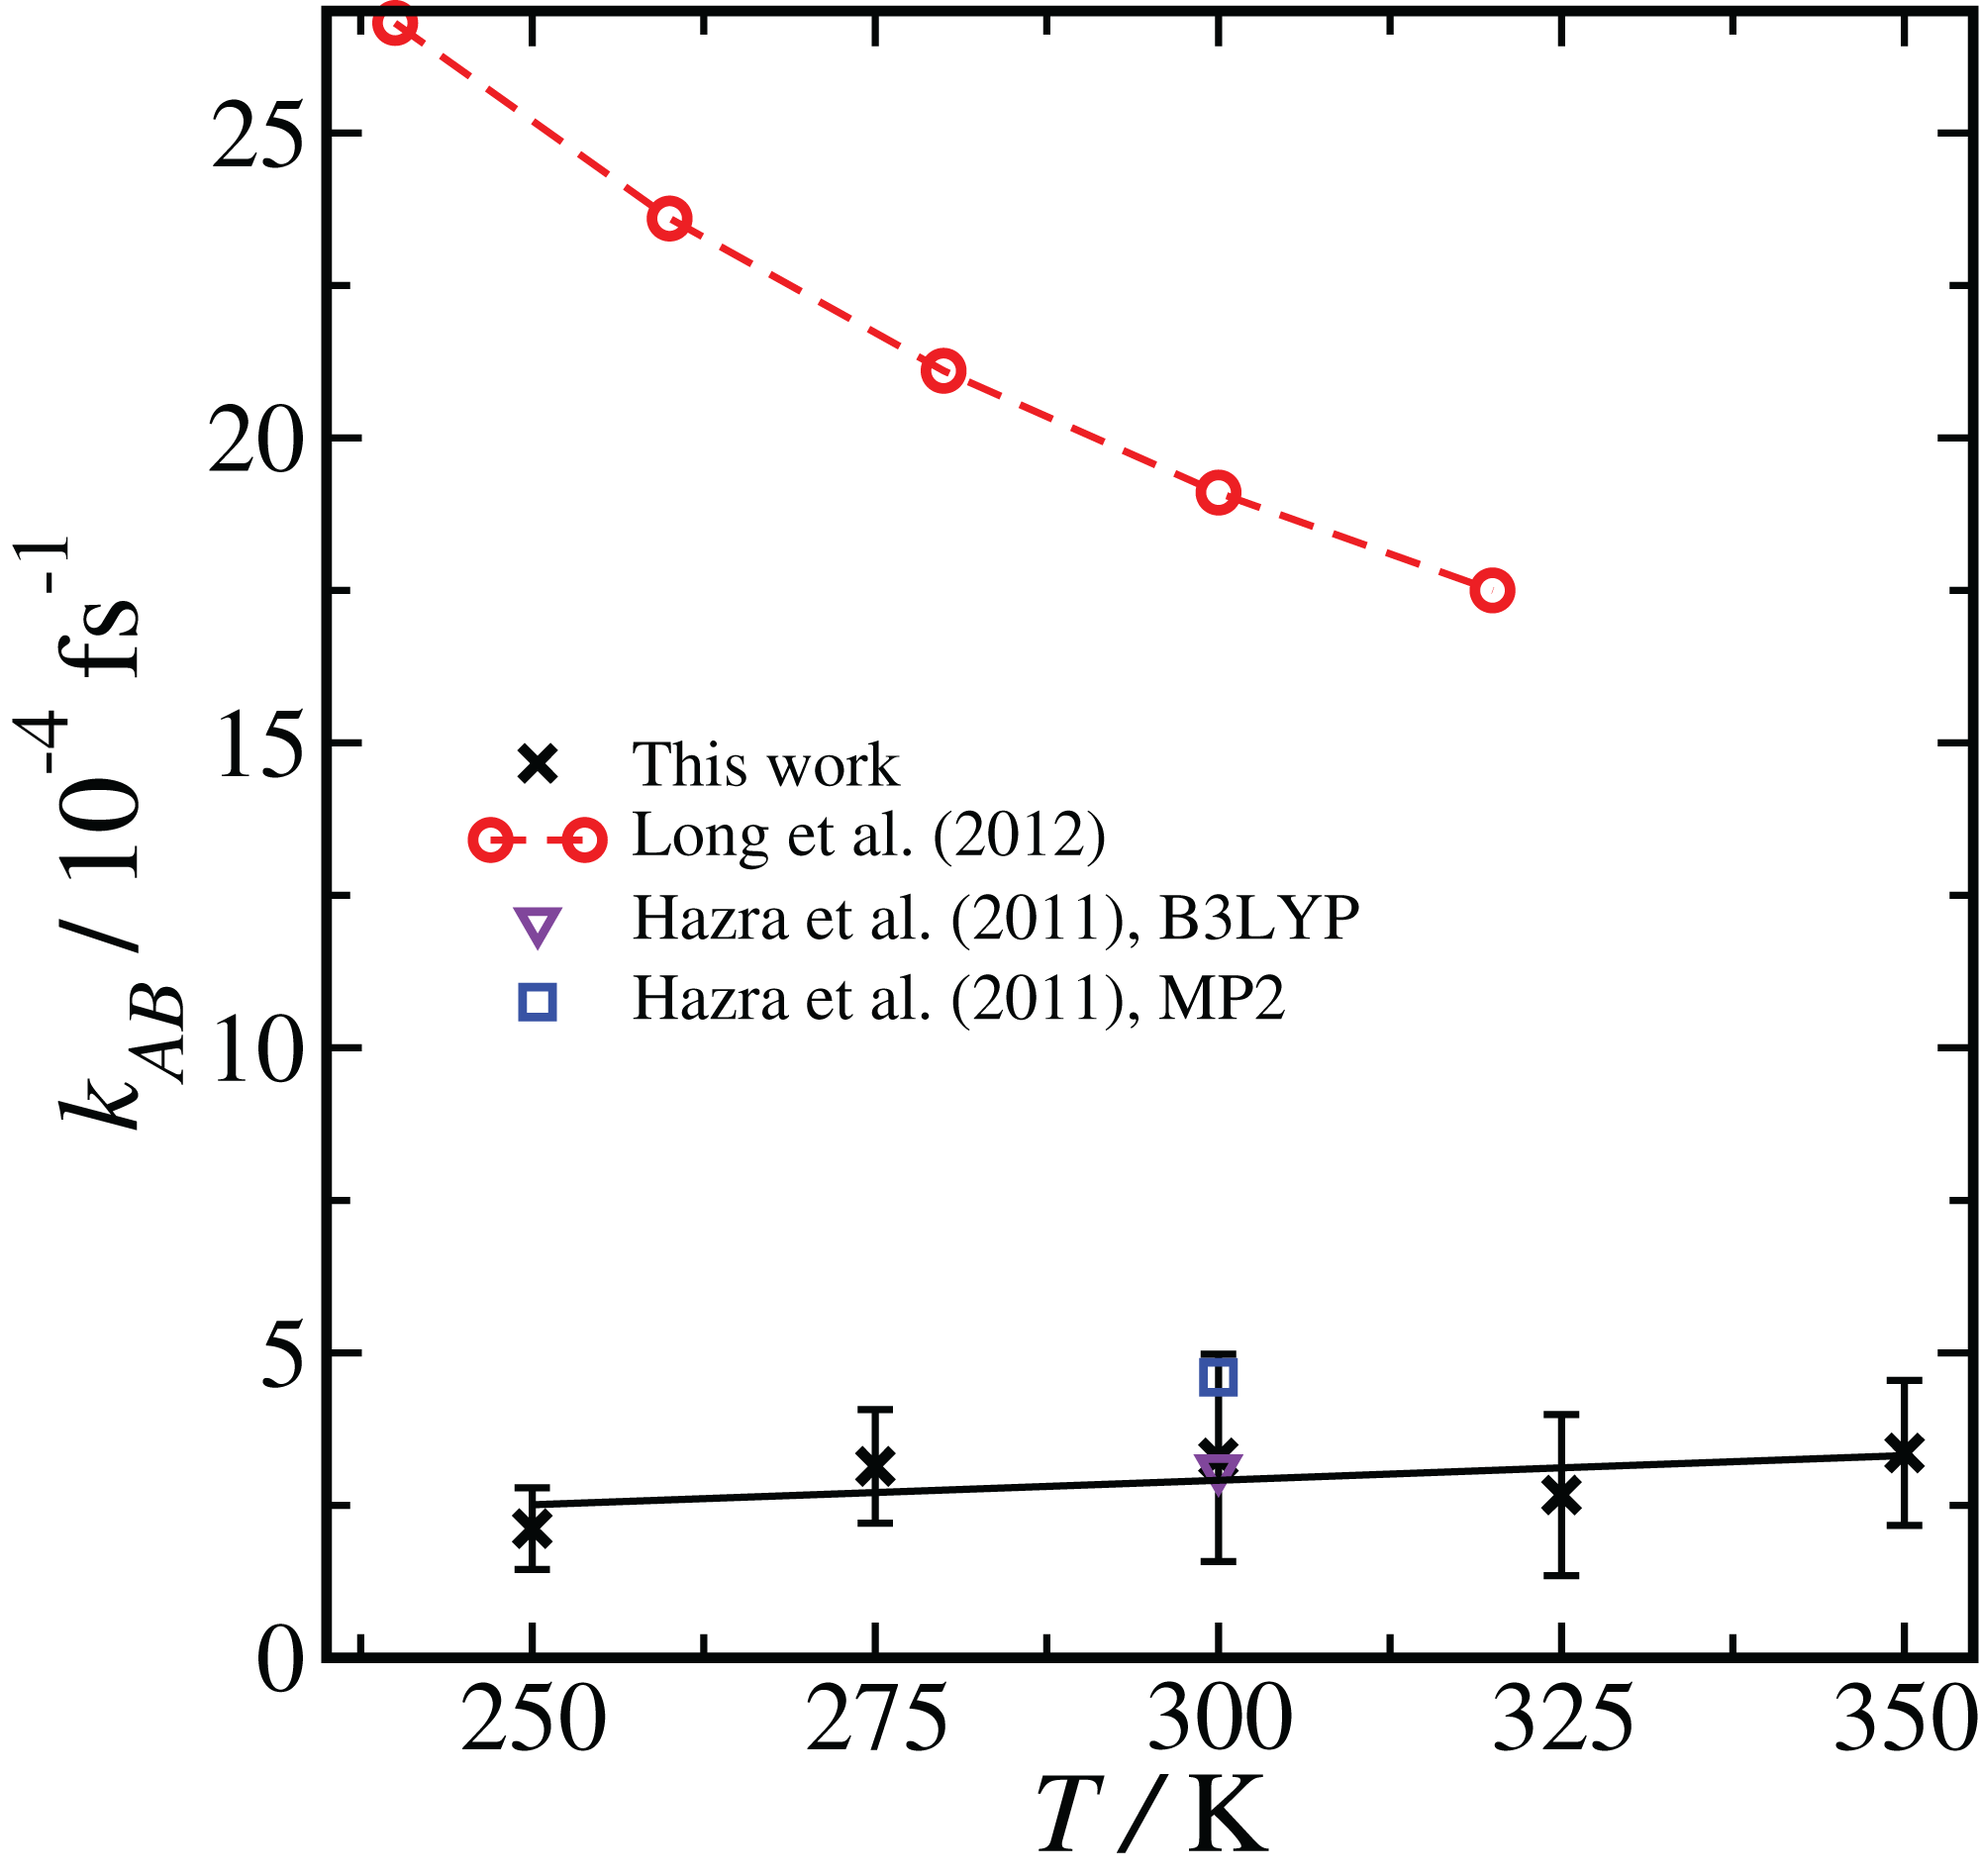
The rate coefficient seems to be lower at T = 250 K, consistent with the BLYP data shown in Fig. 2, however over the full range of temperature we have sampled we cannot measure any statistically meaningful correlation between kAB and T. This lack of temperature dependence is in contrast with the monotonic decrease in the uni-molecular reaction rate predicted by TST. It is unlikely that this temperature dependence (or lack thereof) would qualitatively change if the basis set or level of theory were changed.
In the path sampling approach, the temperature dependency of the rate coefficient arises from entropic contributions which are directly computed, and complicating factors such as vibrational anharmonicity are implicitly included. In TST or RRKM, on the other hand, entropic contributions are considered, but in a way that depends on certain assumptions about, for example, the harmonic nature of the vibrational potentials used to construct the vibrational partition function. The rather different temperature dependence of the rate coefficient on we have observed points toward how direct methods like RETIS might lead to different insights into reaction pathways. At the same time, in this case the reaction barrier is low and the uni-molecular reaction rate is very fast compared with the initial collision rate, and therefore the uni-molecular rate coefficient does not play a major role in determining the overall reaction rate (Long et al., 2012).
To investigate the reaction pathway, frame density plots can be used to visualise, in path space, the values of different descriptors. The visualisation and analysis tool of PyRETIS, PyVisA (O. Aarøen, E. Riccardi, 2019, unpublished data), has been used to plot the transition in different path spaces. Correlations, even if partial, can then be detected allowing direct analysis of the transition pathways available from the RETIS simulations. Details about the entire reaction, and not just the static reactant and product states, can be extracted for the whole transition region.
We have examined the three interatomic distances which contribute to our order parameter s(r), as well as the order parameter itself. Those interatomic distances are defined in accordance with the atom labels shown in Fig. 1. In Fig. 5 we display four different correlation plots considering only the accepted paths belonging to the outermost ensemble, i.e. with −4.6 Å < s(r) < −3.9 Å. In the top two figures, the variation in the distance between S and OW, , and the distance are shown. These are both plotted versus the order parameter s(r). All three of the individual components of s(r) are strongly correlated with the order parameter, as shown by the high values of the correlation variable r2.
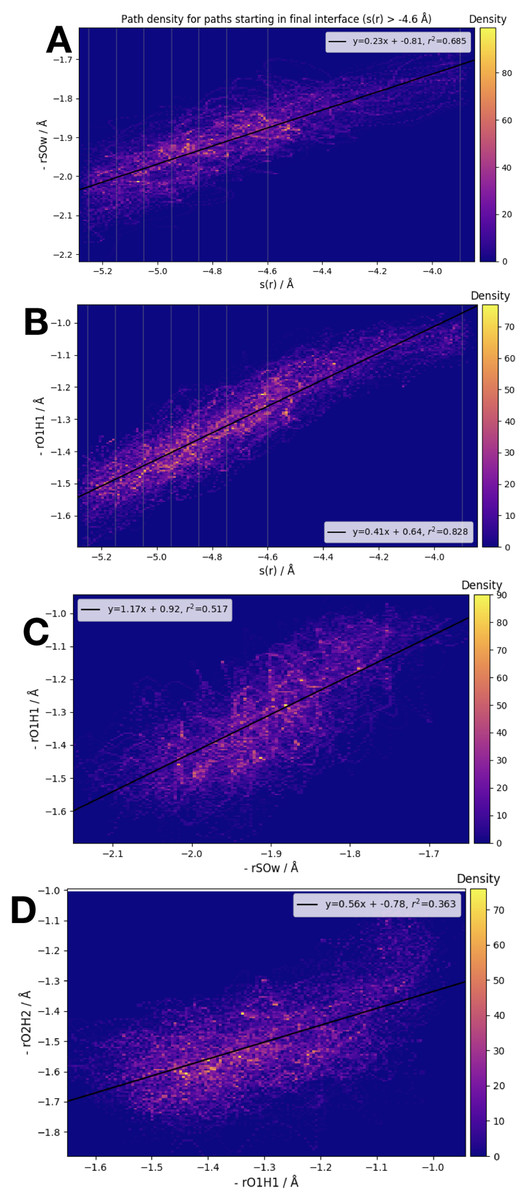
Figure 5: Frame densities for trajectories beginning in the final RETIS ensemble (−3.9 Å > s(r) > −4.6 Å).
Interface locations λi are indicated by the vertical lines when s(r) is plotted on the horizontal axis. (A) vs. s(r), (B) vs. s(r), (C) vs. and (D) vs. .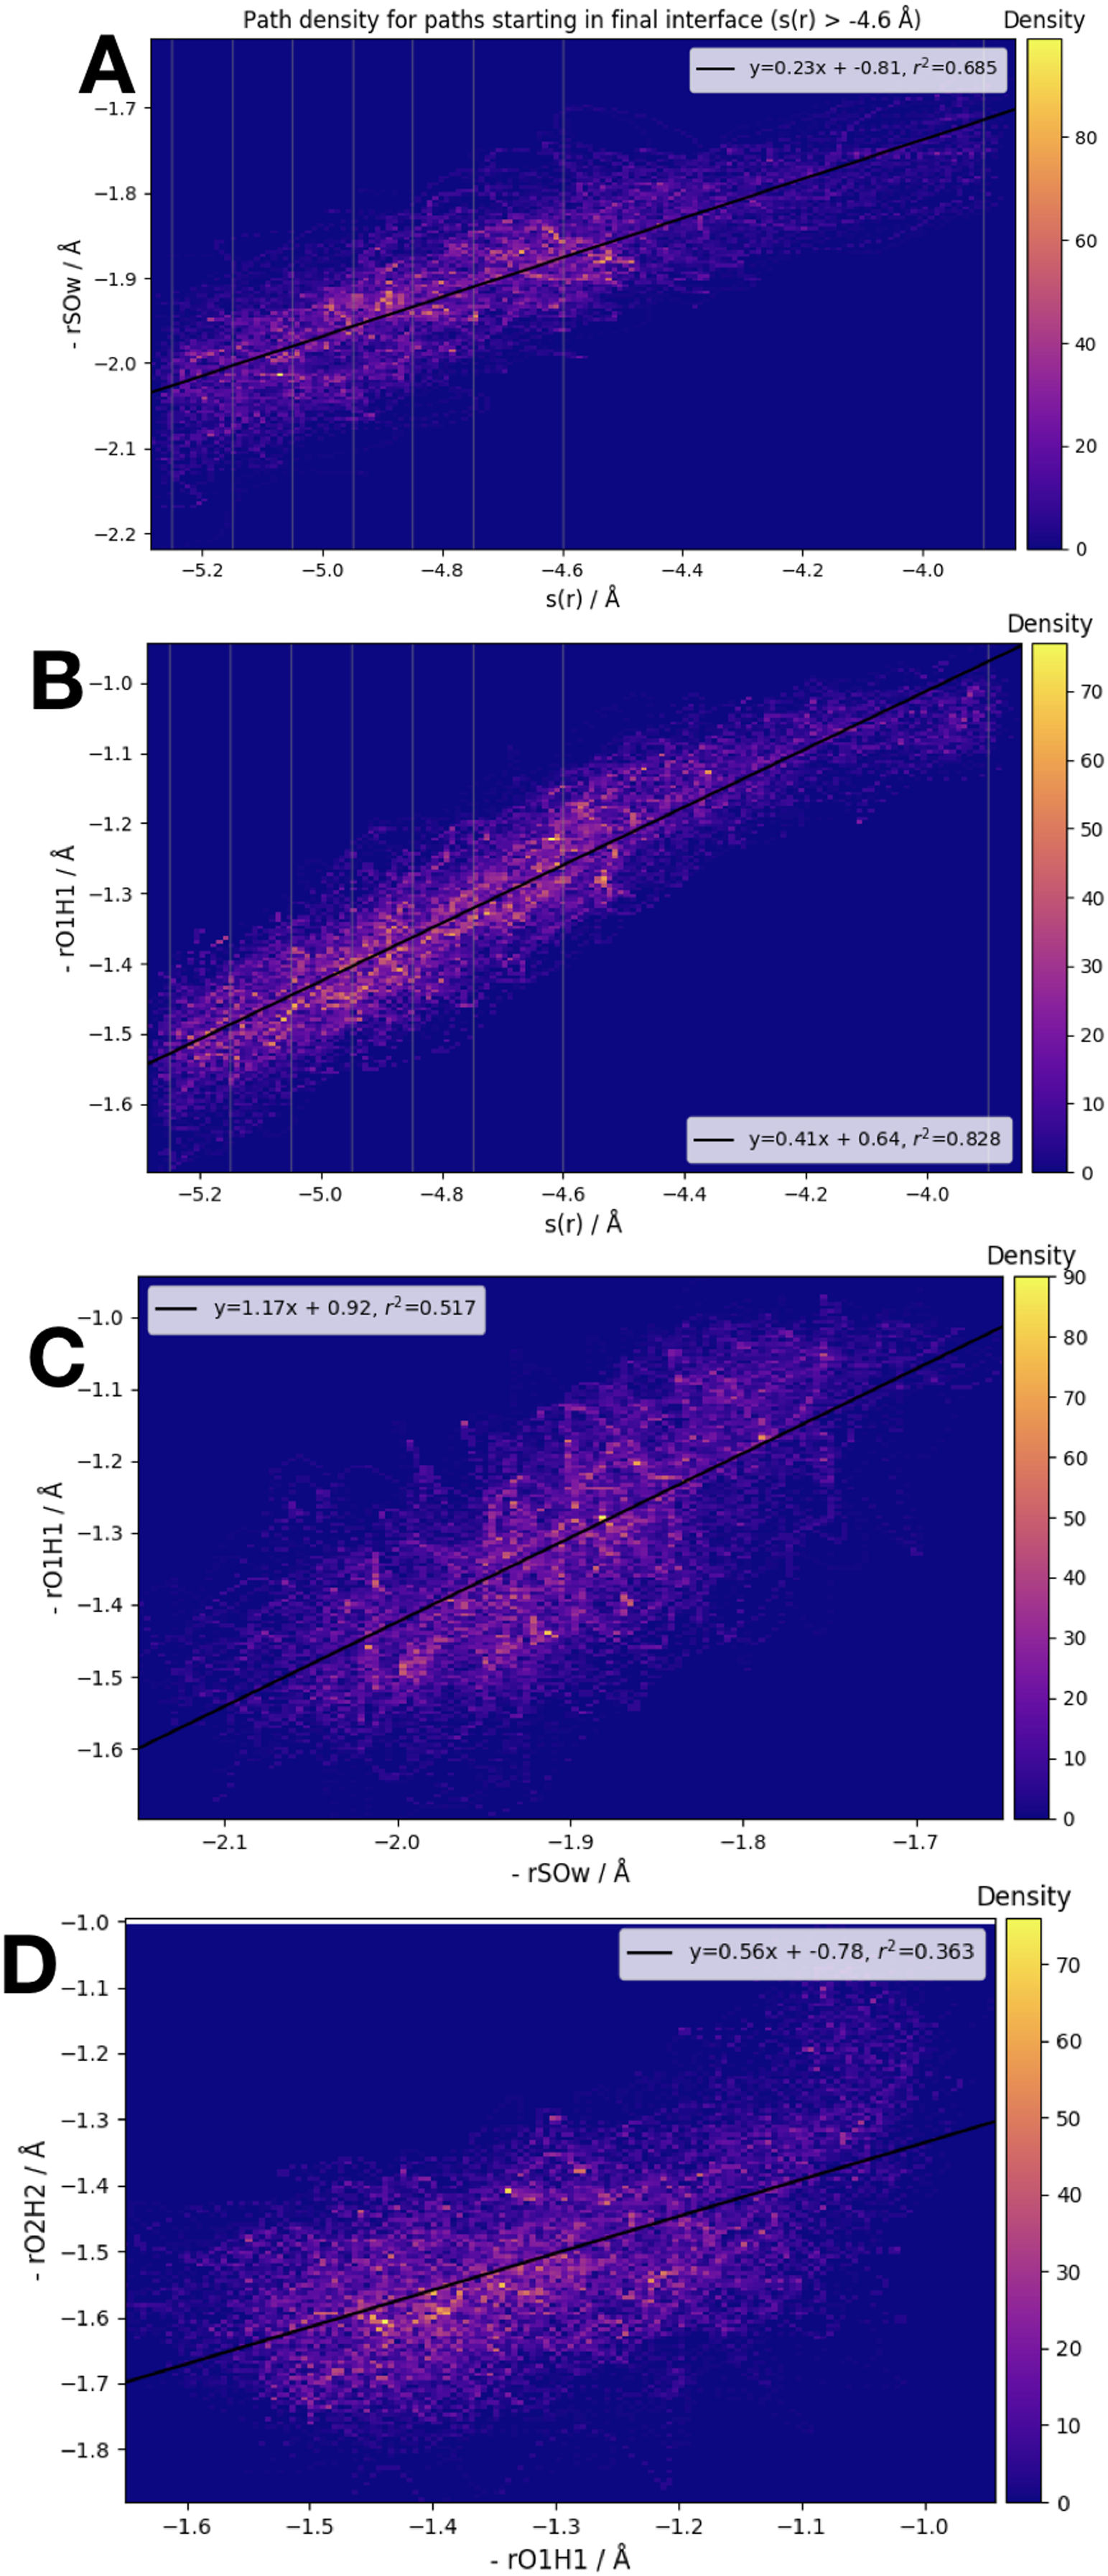
When looking at the correlation between the individual inter-atomic distances themselves (see bottom 2 plots of Fig. 5), the strongest correlation exists between and . Comparing to Fig. 1, this seems sensible; as the reaction proceeds the distance between the (initial) water oxygen and the sulphur atom varies at the same time as the water hydrogen atom nearest the formic acid begins to transfer over to the formic acid molecule. Correlations with the third component of s(r), that is, , the distance between the acidic hydrogen and the closest SO3 oxygen, are considerably weaker. According to the bottom right plot of Fig. 5, it seems that is almost constant until < 1.1 Å, at which point suddenly changes from ∼1.4 Å down to 1.2 Å. In other words, we suggest that the final step in the double proton transfer reaction is the change in , and it does not begin without the other parts of the reaction having occurred. These findings are consistent with, and further explain the limited data about the transition region available from a TST investigation, which showed that rO1H1 ∼ 1.2 Å at the transition state, while is larger, ∼1.4 Å at the transition state (Long et al., 2012).
Conclusions
We have made use of path sampling BO-MD simulations to study the hydrolysis of SO3 when catalysed by formic acid. We discuss in detail the reaction pathway(s) that can describe the conversion from SO3 + H2O to H2SO4. The mechanism has been highlighted and the overall rate computed with different levels of theory.
Our estimate of the uni-molecular rate coefficient for the reaction compares well with previous estimates using TST or RRKM theory (Hazra & Sinha, 2011; Long et al., 2012). Both methods have strengths and weaknesses. On the one hand, the static TST and RRKM calculations can be done with higher levels of theory and larger basis sets than we can handle with BO-MD and the currently available computational resources. It is also impossible, at the current state-of-the-art, to include the contributions of zero-point energy and tunnelling in the path sampling simulations. On the other hand, the kinetic theories are limited by their use of harmonic approximations to compute the vibrational partition functions which enter into the kinetic calculations (Long et al., 2012; Duncan, Bell & Truong, 1998). Path sampling, instead, is inherently dynamical, and the impact of vibrational anharmonicity is implicitly included. Being able to visualise the entire reactive landscape with path sampling, and not just the transition state itself, can also lead to new physical insights unavailable in traditional analyses based on TST or other kinetic theories. A more concerted attempt to carefully compare methodologies for reaction rate calculations would be a worthwhile subject for further study.
We want to emphasise that our results do not consider the complete SO3 hydrolysis reaction, for example, the formation of the pre-reactive complex by atmospheric collisions. Our promising results encourage a broader application of the RETIS approach, which will be a goal pursued in forthcoming works. As the outset of this study, our stated focus was to demonstrate the effectiveness of path sampling to study a relatively simple uni-molecular gas-phase reaction. We acknowledge that in this case the uni-molecular reaction rate is much faster than the initial collision rate, and so overall H2SO4 formation in the atmosphere is not controlled by the uni-molecular reaction. The overall reaction was studied in great detail by previous researchers (Hazra & Sinha, 2011; Long et al., 2012), and our current results do not challenge their general conclusions.
The path sampling approach has here been successfully applied with BO-MD to study an atmospheric reaction. Our work highlights the advantage of studying relatively small gas-phase clusters compared with bulk aqueous phases, as the application of methods for studying rare events in combination with BO-MD is significantly eased in such small systems. We showed that path sampling can be exploited to efficiently generate ensembles of reactive paths and precise estimates of the reaction rate in gas-phase reactions of interest in atmospheric chemistry. The promising approach and results here reported are intended as an initial step towards a broader study of atmospherically relevant reactions using these novel sampling methods, including their application in our ongoing investigations into formic acid deprotonation (Murdachaew et al., 2016; Daub & Halonen, 2019).
Supplemental Information
Initial configurations.
Initial configurations in .xyz format used to start PyRETIS simulations, obtained from geometry optimization using PBE with the TZVP basis set and Grimme D2 dispersion correction.