
Effects of Sr2 + on the preparation of Escherchia coli DH5α competent cells and plasmid transformation
- Published
- Accepted
- Received
- Academic Editor
- Rodolfo Aramayo
- Subject Areas
- Biochemistry, Bioengineering, Microbiology
- Keywords
- Escherchia coli, Response surface methodology, Competence, Transformation mechanism
- Copyright
- © 2020 Wang et al.
- Licence
- This is an open access article distributed under the terms of the Creative Commons Attribution License, which permits unrestricted use, distribution, reproduction and adaptation in any medium and for any purpose provided that it is properly attributed. For attribution, the original author(s), title, publication source (PeerJ) and either DOI or URL of the article must be cited.
- Cite this article
- 2020. Effects of Sr2 + on the preparation of Escherchia coli DH5α competent cells and plasmid transformation. PeerJ 8:e9480 https://doi.org/10.7717/peerj.9480
Abstract
Bacterial gene transformation used with Escherichia coli as a desired microorganism is one of the important techniques in genetic engineering. In this study, the preparation of E. coli DH5α competent cells treated with SrCl2 and transformation by heat-shock with pUC19 plasmid was optimized by Response Surface Methodology (RSM). Other five E. coli strains including BL21 (DE3), HB-101, JM109, TOP10 and TG1, three different sizes plasmids (pUC19, pET32a, pPIC9k) were used to verify the protocol, respectively. The transformation mechanism was explored by scanning electron microscope combined with energy dispersive spectrometer (SEM-EDS), atomic absorption spectroscopy (AAS) and Fourier-transform infrared spectroscopy (FT-IR). An equation of regression model was obtained, and the ideal parameters were Sr2 + ions of 90 mM, heat-shock time of 90 s and 9 ng of plasmid. Under this conditions, the transformation efficiency could almost reach to 106 CFU/µg DNA. A small change of the cell surface structure has been observed between E. coli DH5α strain and competent cells by abovementioned spectrum technologies, which implied that a strict regulation mechanism involved in the formation of competent cells and transformation of plasmids. An equation of regression model for the competent cells preparation and plasmid transformation could be applied in gene cloning technology
Introduction
Escherichia coli is extensively applied in genetic engineering as a desired microorganism for various cloning experiments. In 1970, Mandel & Higa (1970) firstly found E. coli K12 strains treated with calcium chloride solution was easy to be infected by λ phage DNA by a short-time heat shock. Besides, it was proven that the plasmid DNA could also enter the bacteria by the same method by Cohen & Chang (1972). Thereafter, the chemical transformation methods (Nørgard, Keem & Monahan, 1978; Dagert & Ehrlich, 1979; Zhang, Xu & Xu, 2004) have continuously been modified with various combinations of chemical solutions including different cations (Mg2+, Ca2+, Sr2+, Ba2+, Mn2+, K+, Na+, Rb+), PEG, DMSO (Chung & Miller, 1988; Chan et al., 2013) and glycerin Shanehbandi et al. (2013). Considering the practicality and convenience of different artificial methods, more efficient exogenous gene transfer systems also have been developed by physical or chemical methods, including chemical procedures (Inoue, Nojima & Okayama, 1990; Sarkar, Choudhuri & Basu, 2002a; Sarkar, Choudhuri & Basu, 2002b; Song et al., 2007), high-voltage electroporation (Dower, Miller & Ragsdale, 1988; Dunny, Lee & LeBlanc, 1991; Sheng, Mancino & Birren, 1995), a biolistic propulsion system (Shark et al., 1991), liposome-mediated DNA transfer (Kawata, Yano & Kojima, 2003), microwaves and ultrasounds assisted DNA transfer (Zarnitsyn & Prausnitz, 2004; Fregel, Rodriguez & Cabrera, 2008; Tripp, Maza & Young, 2013; Deeks et al., 2014) and chemical-physical (Rb+, sepiolite and nanomaterials) induced transformation (Ren et al., 2017; Ren, Na & Yoo, 2018; Ren et al., 2019), etc. The transformation efficiency (104∼108 CFU/µg DNA) of different strains can obviously be obtained from these methods described.
Each of the methods mentioned above has their advantages in transformation efficiency, the corresponding experimental complexity and cost-effective limitations (Chen, Christie & Dubnau, 2005; Ren et al., 2017). However, the higher transformation efficiency in each chemical-mediate method all depended on the function of CaCl2. This implied Ca2+ ions played the key role in the preparation and transformation process of the competent cells by plasmid, that can be affected by the growth of the bacterial strain, plasmid DNA concentration, heat shock temperature and duration, cold incubation duration of CaCl2 treated cells (Singh et al., 2010). The various strains showed the different transformation efficiency with the same treatment method (Ren et al., 2017). In our previous study (Wang et al., 2013; Liu et al., 2014), the transformation efficiency with pUC19 plasmid DNA was almost equal between the cells prepared by CaCl2 and SrCl2 treatment, respectively. Whereas, how much concentration of Sr2+ resulted in maximum transformation efficiency compared with Ca2+ has not yet been reported up to now, and the exact mechanism of SrCl2-mediated artificial transformation process is still largely obscure.
Chemical transformation was referred to as one of the most important techniques in genetic manipulation. The transformation efficiency depended upon several factors, including cation type, cation concentration, treatment time, thermal shock, and incubation time (Huff et al., 1990; Cosloy & Oishi, 1973; Chan et al., 2002; Broetto et al., 2006; Singh et al., 2010). Bacterial transformation is a fundamental technology to deliver engineered plasmids into bacterial cells, which is essential in industrial protein production, chemical production, etc. Hence, a novelty statistical method could be applied in the experimental design for higher transformation efficiency. Response surface methodology (RSM) consists of a group of mathematical and statistical methods, initiates from the design of experiment (DOE) that is generally considered an effective statistical technique for optimizing complex processes, due to its obvious advantages, e.g., the reduced number of experimental trials needed to evaluate multiple parameters and their interactions, less laborious and lesser time-consuming (Khuri & Mukhopadhyay, 2010; Bezerra et al., 2008). An optimal process with the mathematical equations is obtained by determining the significant factors affecting an experiment and reducing the number of experimental runs while maximizing output through the data generated. As one of the RSM, Box-Behnken Design (BBD) (Ferreira et al., 2007) is introduced to optimize the preparation of E. coli DH5 α prepared with SrCl2 andthe transformation with pUC19. The optimal conditions are verified by different E. coli strains with different size of plasmid DNA, including pUC19, pET32a and pPIC9k, respectively. In addition, the transformation mechanism is preliminarily explored by SEM, EDS, AAS and FT-IR, respectively.
Material and Methods
Bacterial strains and plasmids
E. coli DH5α, JM109, Top10, TG1, HB101 and BL21 strains were employed for the plasmid DNA acceptor and purchased from Sangon Biotech (Shanghai) Co., Ltd. Plasmids pUC19, pET32a and pPIC9k (with an inserted gene encoding ampicillin resistance) were purchased from Solarbio life science (Beijing) Co., Ltd. The plasmid was dissolved in TE buffer (10 mM Tris-HCl, 1.0 mM EDTA, pH 7.6), and the concentration was measured by their absorbance at 260 nm.
Chemicals, media, and culture conditions
MgCl2, CaCl2, SrCl2 and other reagents used were all of analytical reagent grade. Reagents were purchased from Sangon (Shanghai, China) Biotech Co., Ltd. Tryptone and yeast extract were purchased from Oxoid (England). E. coli strains preserved on LB agar plates at 37 °C. Ampicillin (100 µg/ml) purchased from Sigma was added into the medium for screening the transformants.
Preparation of competent cells
Competent cells were prepared according to Sambrook & Russell (2006) with some necessary modifications. In detail, a large size (2–3 mm) E. coli colony on LB agar plate was picked into three mL of LB liquid medium and the inoculum was cultured at 37 °C, 200 rpm for 12–16 h. The cultures of E. coli were diluted 100-fold with the fresh LB medium until OD600 reached at approximate 0.4–0.5. Then, the cultures were immediately cooled down to 0 °C by pouring it into a 50 mL sterile and prechilled centrifuge tube, and then centrifuged at 4000 rpm for 10 min at 4 °C. The supernatant was poured off and the cell pellets were resuspended with 30 mL 100 mM of different sterile and prechilled solution (only with MgCl2, CaCl2, SrCl2, BaCl2 and MnCl2. respectively). The mixture was centrifuged again under the same condition. Subsequently, two mL solution containing 15% (v/v) glycerol was added into the tube to resuspend the cell pellets. The treated cells were gently kept in an ice-water bath for 5 min, then packaged in a 1.5 mL Eppendorf tube in a volume of 100 µL/tube. The competent cells were stored at −80 °C until further use.
Standard procedure for transformation
The competent cells were transformed with pUC19 plasmid DNA according to Sambrook & Russell (2006). An aliquot (0.1 mL) of competent cells mixed with 1.0 µL pUC19 DNA (1 ng/L) dissolved in TE buffer (10 mM Tris-HCl, 1.0 mM EDTA, pH 7.6) were heated shock 90 s at 42 °C, and then the mixture was kept on ice for 30 min. After the incubation, 0.9 mL of LB medium were added into the mixture and cultured again with shaking at 37 °C for 1 h. 100 µL aliquots of the culture were spread on LB agar plates with 100 µg/mL of ampicillin, which was incubated at 37 °C for 12–16 h. Transformation efficiency was expressed as the number of ampicillin-resistant transformants obtained and was calculated based on the colony-forming units (CFU) per µg DNA used (Sambrook & Russell, 2006).
Optimization of transformation of plasmid by RSM
Based on single-factor experiments, RSM with 3 factors and 3 levels was used to estimate the effect of each factor on the transformation efficiency of E. coli DH5α competent cells as outlined in Table 1, in which −1, 0, l represented the high, medium and low level, respectively. SrCl2 concentration (X1), heat shock time (X2) and the amount of pUC19 plasmid DNA (X3) were employed as the independent variables, the transformation efficiency as the response value was performed during the RSM analysis. All the series of trials in the BBD experiment were listed in Table 2, including the encoded and non-coded values of the experimental variables and 17 experimental points. Five replications (13–17) were used to evaluate the pure error. A quadratic polynomial model was used to analyze the relationship between transformation efficiency (Y) and the independent variables, then data were fitted to the following equation. where Y represented the measured correlation response combined with each factor level; β0, βi, βii and βij represented the regression coefficients for intercept, linear, quadratic and interaction terms, respectively; xi and xj were independent variables of the coding. Design-Expert Software (Trial Version 8.0.5, Stat-Ease Inc., Minneapolis, MN, USA) was used to estimate the response of each set of experimental design and optimized conditions. The applicability of the quadratic polynomial model was tested by the regression coefficient R2. The significance of the regression coefficients was checked using the F-value and P-value.
| Factors | Levels | ||
|---|---|---|---|
| −1 | 0 | 1 | |
| X1 SrCl2 concentration (mmol/L) | 60 | 80 | 100 |
| X2 Heat shock time (s) | 75 | 90 | 105 |
| X3 the amount of pUC19 plasmid DNA (ng) | 7 | 9 | 11 |
| No. | Sr2+ concentration (mmol/L) | Heat-shock time (s) | Amount of DNA (ng) | Transformation efficiency (CFU/µg of plasmid DNA) |
|---|---|---|---|---|
| 1 | −1 | −1 | 0 | 0.66 ×10⁵ |
| 2 | 1 | −1 | 0 | 7.68 ×10⁵ |
| 3 | −1 | 1 | 0 | 0.52 ×10⁵ |
| 4 | 1 | 1 | 0 | 3.28 ×10⁵ |
| 5 | −1 | 0 | −1 | 0.62 ×10⁵ |
| 6 | 1 | 0 | −1 | 5.16 ×10⁵ |
| 7 | −1 | 0 | 1 | 5.82 ×10⁵ |
| 8 | 1 | 0 | 1 | 6.87 ×10⁵ |
| 9 | 0 | −1 | −1 | 5.47 ×10⁵ |
| 10 | 0 | 1 | −1 | 3.08 ×10⁵ |
| 11 | 0 | −1 | 1 | 4.87 ×10⁵ |
| 12 | 0 | 1 | 1 | 3.66 ×10⁵ |
| 13 | 0 | 0 | 0 | 1.56 ×10⁶ |
| 14 | 0 | 0 | 0 | 1.63 ×10⁶ |
| 15 | 0 | 0 | 0 | 1.45 ×10⁶ |
| 16 | 0 | 0 | 0 | 1.57 ×10⁶ |
| 17 | 0 | 0 | 0 | 1.79 ×10⁶ |
SEM and EDS assay
E. coli DH5α cells and competent cells were immobilized with 2.5% glutaraldehyde, washed three times with PBS buffer (pH 7.2, 0.2 M), and vacuum freezing dried (FD-1A-50, Boyikang, Beijing, China), respectively. These dried cells were coated with a thin layer of gold under reduced pressure and examined using a SEM system (JSM-5900LV, JEOL, Japan) at an acceleration voltage of 10 kV with an image magnification of 10000 × ∼50000 ×. A series of SEM images were recorded to analyze the surface difference between E. coli DH5α and the competent cells. The content of strontium ions in the cell surface was measured by EDS (JEOL, Japan).
AAS analysis
one mL of the competent E. coli DH5α cells was centrifuged at 10,000 rpm for 5 min and 0.5 mL of the supernatant was transferred to a 50 mL volumetric flask and diluted with 0.1% HNO3 solution. The optical density of this solution was measured by air-acetylene flame atomic spectrum (AAS, Z-5000, Hitachi, Japan) at 460.73 nm with the lamp current of 5 mA and spectral bandwidth of 0.5 nm. The acetylene and the airflow rate were set as 1.7 L/min and 6.0 L/min, respectively The concentration of Sr2+ was calculated according to the linear regression equation of the standard curve (Y = 0.061x □0.0061, R2 = 0.9998, linear range of 0.5–6.5 µg/mL), in which, the horizontal and vertical coordinates represented the concentration of Sr2+ (g/mL) and OD460.73, respectively.
FT-IR spectroscopy analysis
The freezing-dried E. coli DH5α and competent cells were prepared via the KBr pressed-disc method (Xiang, Sai & Yu, 2002). The functional groups difference on the cell surface was recorded by FT-IR spectrometer (Nexus670, Nicolet, American) with the range of 4,000–400 cm−1 at a resolution of four cm−1. All spectra were acquired over 20 scans.
Statistical analysis
All data were shown as mean ± SD values by three replicates. The difference was to be significant when P < 0.05. Statistical analysis was performed using the OriginPro software package 8.5 (OriginLab Corp.) and the Design-Expert software version 8.0.5 (Stat-Ease Inc., Minneapolis, MN, USA).
Results
Effects of different divalent metal ions on transformation efficiency
Five strains of E. coli were treated by five kinds of divalent metal ions (100 mM) under the same condition and then transformed with 10.0 ng pUC19. The results shown in Fig. 1 displayed that the transformation efficiency of strains treated by Mg2+ or Mn2+ was lower than those prepared by Ca2+, Sr 2+ or Ba2+. The transformation efficiencies of E. coli BL21, DH5α, HB101 and JM109 induced by CaCl2 were the highest. However, E. coli TG1 and TOP10 treatment with SrCl2 obtained the highest transformation efficiencies. Differences between these strains maybe could take account for this phenomenon. Some receptor proteins existed in the surface of E. coli cells, such as outer membrane proteins (OmpA, OmpC and so on), responsing the signal of divalent metal ions, and then the receptor signalling pathways were triggered for the absorption of exogenous DNA (Aich et al., 2012; Finkel & Kolter, 2001). Moreover, the previous reports displayed RNase, DNase, β-galactosidase and alkaline phosphatase could be released on the cell surface or extracellular by osmotic shock (Nossal & Heppel, 1966). The different strains also showed different changes (permeability, enzyme activities) with the chemical treatment. The different enzymatic reactions in the cells may be activated or inhibited by the metal ions. For example, nuclease can hydrolyze DNA with the assistant of Mg2+ or Mn2+ to reduce the transformation efficiencies for different plasmids.
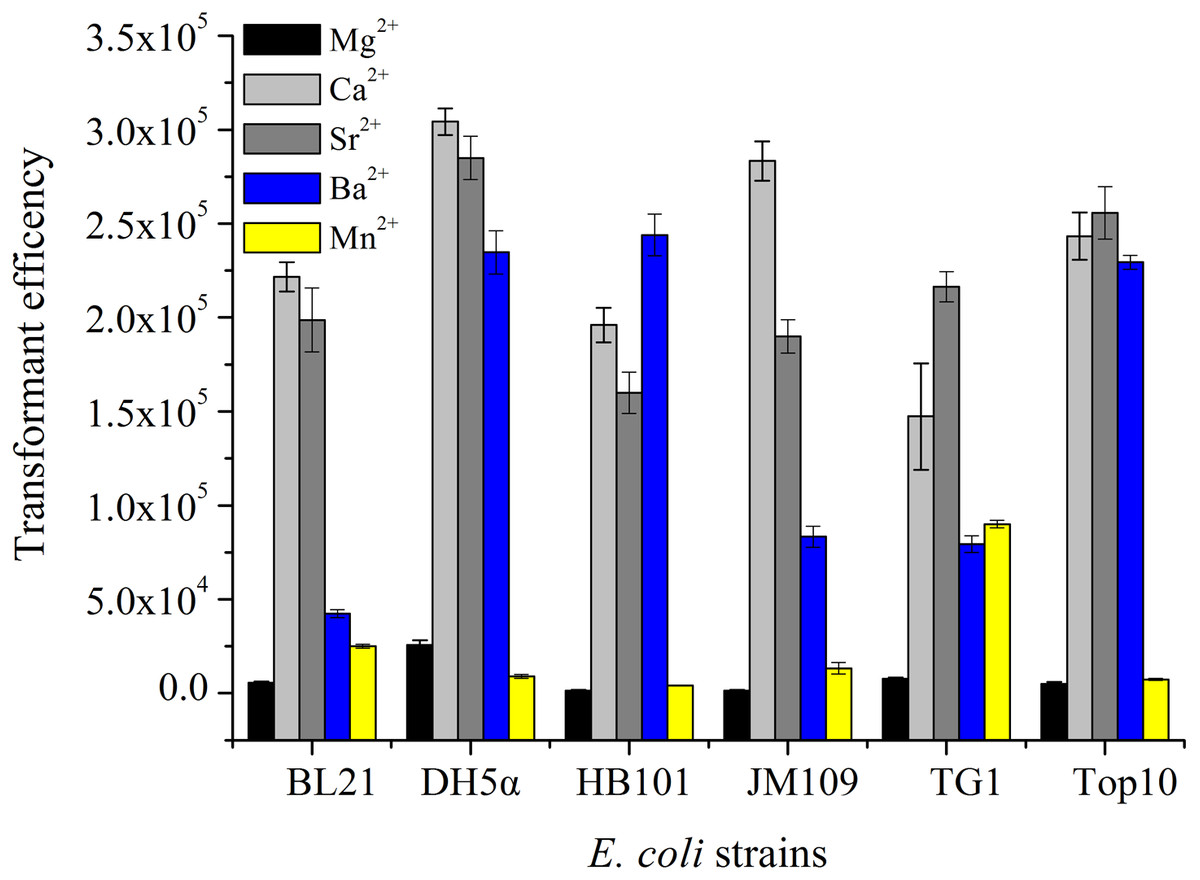
Figure 1: The transformation efficiency of E. coli strain treated by different divalent metal ions.
Six strains of E. coli were used to prepare competent cells treated by the concentration of 100 mM of five kinds of divalent metal ions under the same condition and transformed with 10 ng pUC19 plasmid DNA.
Effects of Sr2+ concentration on transformation efficiency
As we all know, divalent metal ions and their concentration play an important influence on the formation of competent cells and transformation efficiency for exogenous DNA. In this experiment, the effects of different Sr2+ concentrations on transformation efficiency were examined, while Heat-shock time and the amount of pUC19 plasmid DNA was fixed at 45 s and 10.0 ng. Plots of transformation efficiency against Sr2+ concentrations were shown in Fig. 2A, the transformation efficiency was significantly enhanced when the concentration of Sr2+ increased from 20 mM to 80 mM, and the value reached at a maximum at the concentration of 80 mM Sr2+. However, transformation efficiency kept stable between the Sr2+ treatment of 80 mM and 100 mM, and then decreased gradually when the amount of Sr2+ exceeded 100 mM.

Figure 2: Transformation efficiency affected by the different various factors.
(A) Effects of different Sr2+ concentrations on transformation efficiency were examined, while heat-shock time and the amount of pUC19 plasmid DNA was fixed at 45 s and 10 ng. (B) Effects of heat-shock time on transformation efficiency was studied, and the other conditions such as Sr2+ concentration, the amount of pUC19 plasmid DNA were as well fixed at 80 mM and 10 ng. (C) Effects of the amount of plasmid on transformation efficiency were determined as well. the other conditions such as Sr2+ concentration, heat-shock time was fixed at 80 mM and 90 s. All operations were performed three duplicates.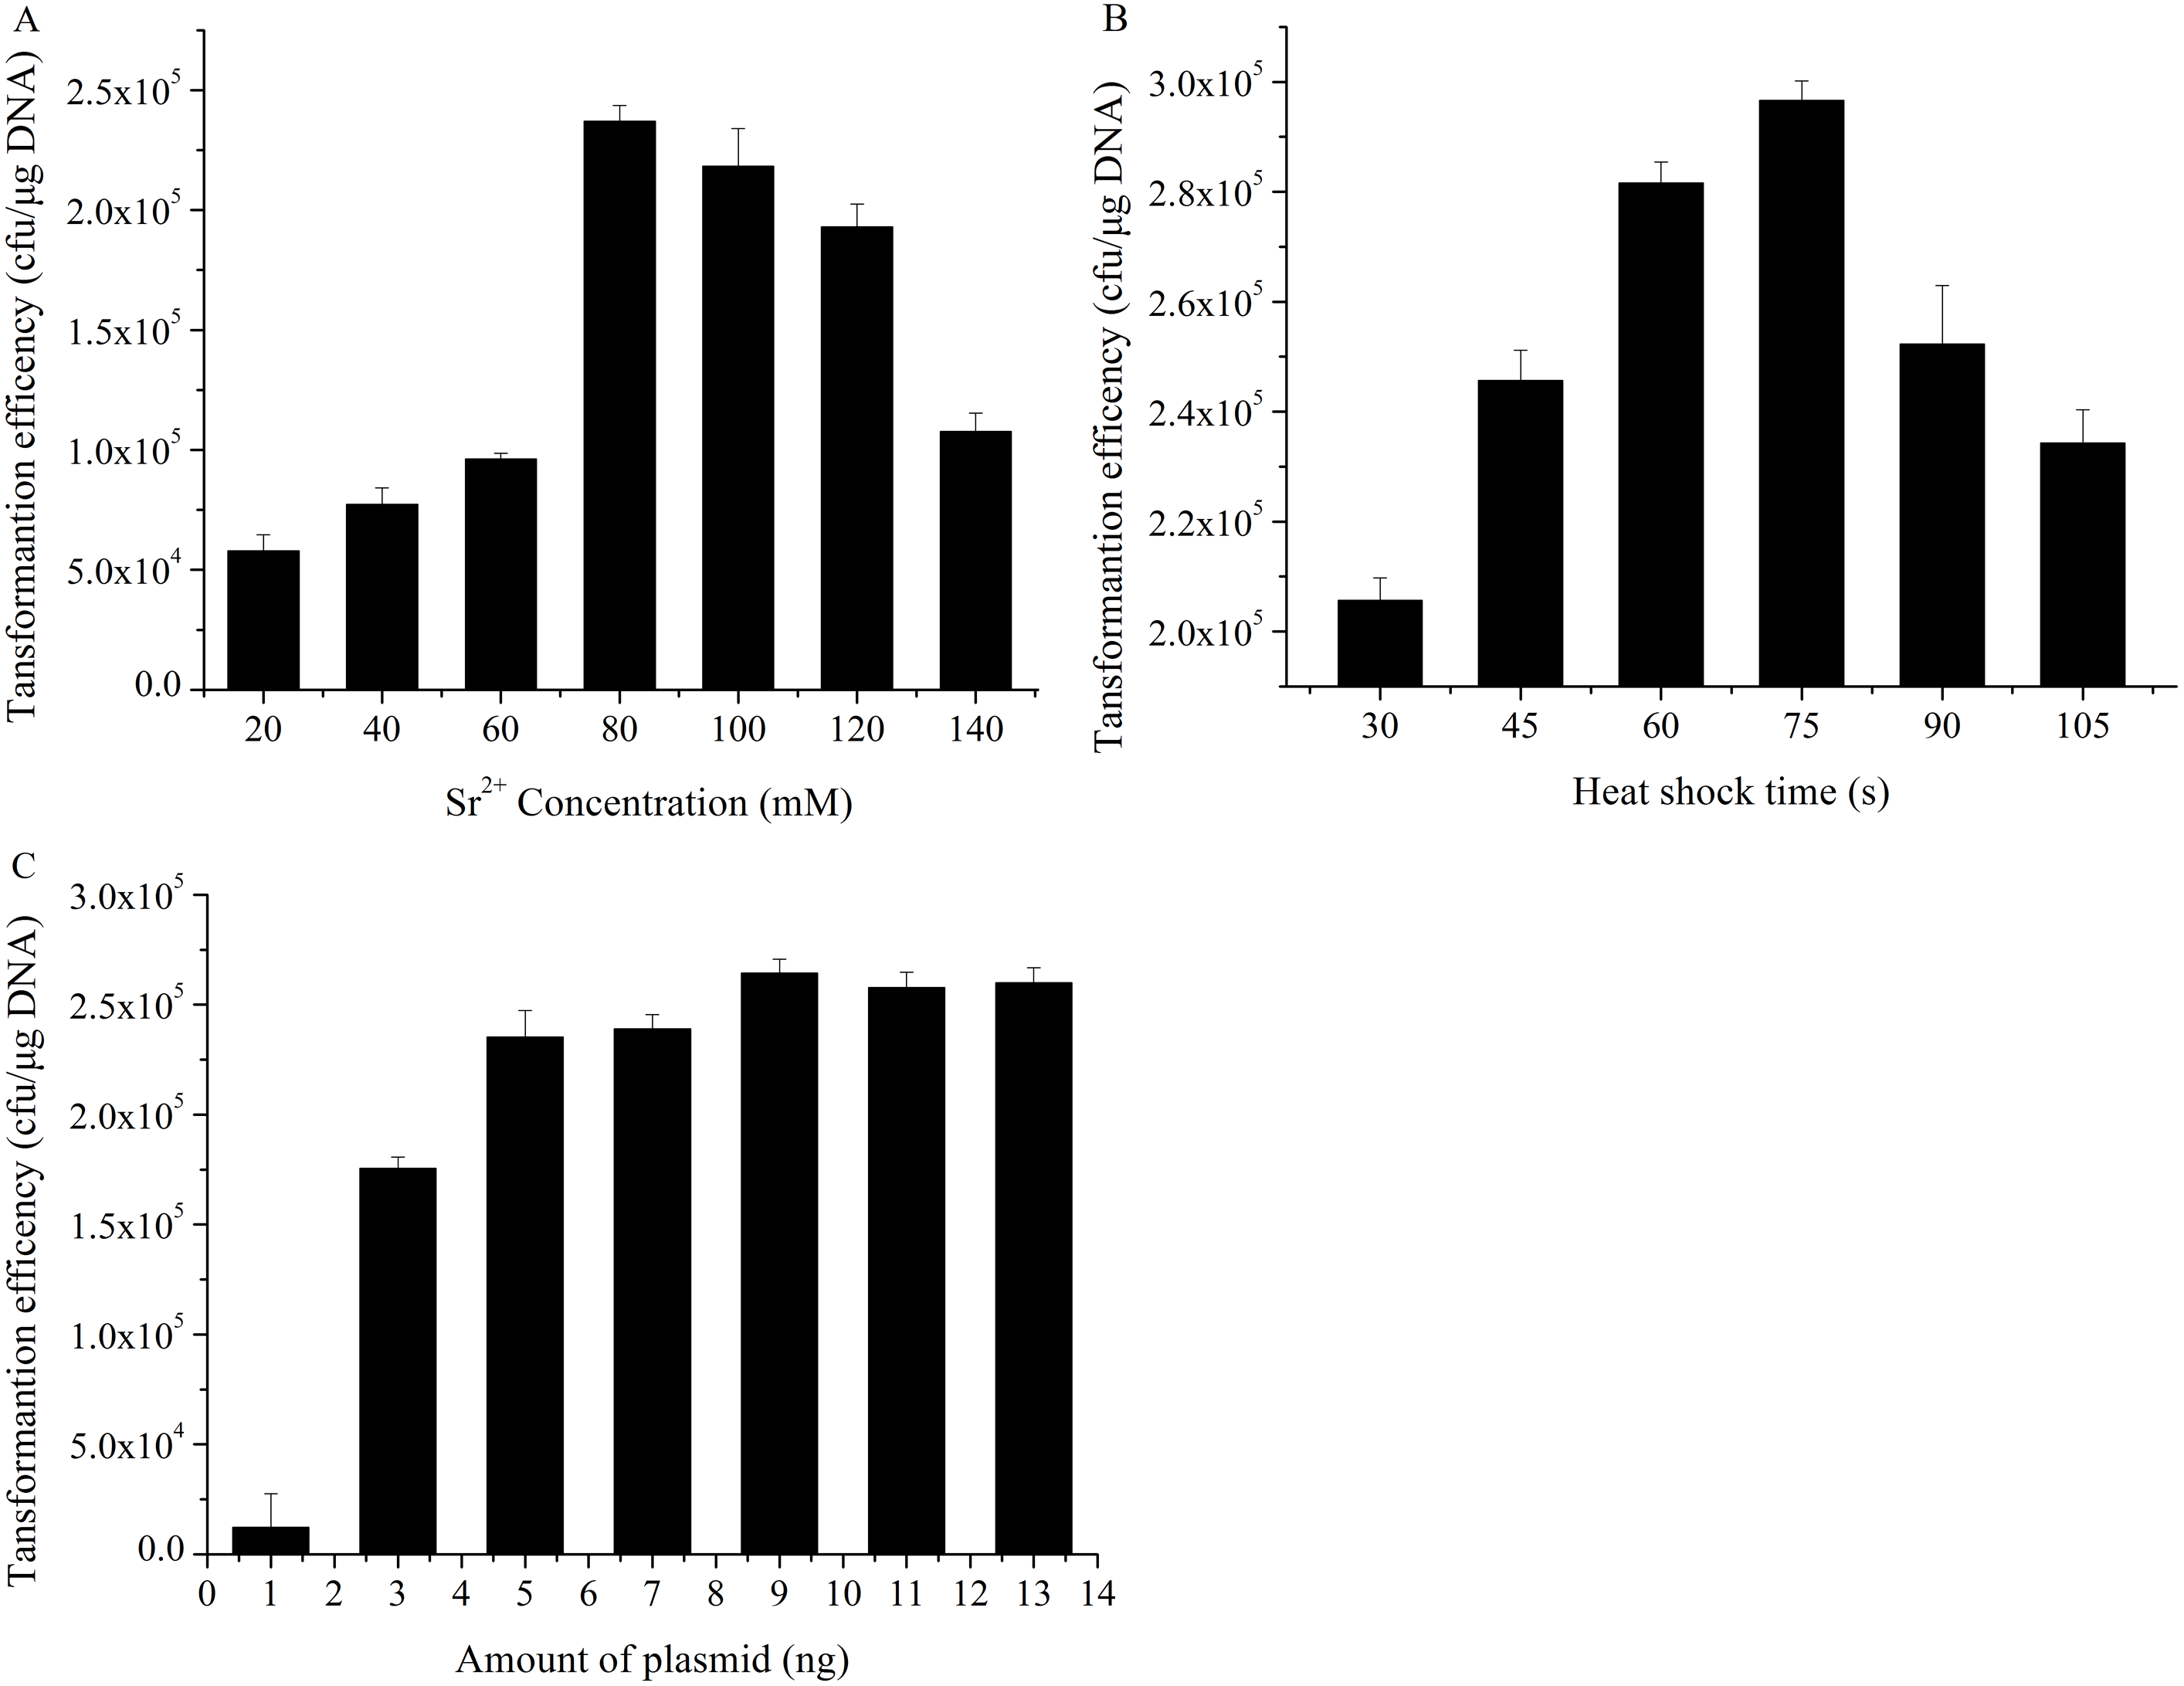
Effects of heat-shock time on transformation efficiency
Many heat-shock proteins existed in E. coli cell surface, such as GroEL, which has an exclusive role in plasmid transforming into E. coli (Aich et al., 2011). The effects of different heat-shock time such as 30 s, 45 s, 60 s, 75 s, 90 s and 105 s on transformation efficiency were explored, and Sr2+ concentration, the amount of pUC19 plasmid DNA was fixed at 80 mM and 10 ng. As shown in Fig. 2B, the transformation efficiency increased with the increase of the heat-shock in the range of 30–90 s and exhibited the maximum value at 90 s. However, the longer heat shock treatment, the lower transformation efficiency was obtained, which possibly be explained by the cell damage and protection theory. Once the cells were stimulated for a long period of heat-shock, some proteins on the cell surface could reduce cell damage by shutting down some pathways, so the transformation efficiency declined (Chung, Niemela & Miller, 1989; Claverys & Martin, 2003).
Effects of the amount of plasmid on transformation efficiency
When the Sr2+ concentration of 80 mM and heat-shock time of 90 s was fixed, the effects of the various amount of plasmid on transformation efficiency were studied. As illustrated in Fig. 2C, maximum transformation efficiency could be obtained with 9.0 ng of pUC19 plasmid, then declined with the increasing of the DNA amount, which may be attributed to that the repulsive forces increased with the more addition of negatively-charged pUC19 plasmid, the reduction of random collisions between DNA molecules and competent cells resulted in transformation efficiency decline (Broetto et al., 2006).
Optimization of the parameters on transformation efficiency
According to the single-factor experiment results, three independent variables (SrCl2 concentrations, heat-shock time, the amount of pUC19 plasmid DNA) with three levels (Listed in Table 2) were performed for developing the model. The transformation efficiency was regressed to a second-order polynomial function shown in the following equation: where Y denoted transformation efficiency, X1, X2 and X3 represented SrCl2 concentrations (mM), heat-shock time (s) and the amount of pUC19 plasmid DNA (ng) in coded values, respectively. Table 3 showed the analysis of variance (ANOVA) for the fitted quadratic polynomial model. Based on this analysis, F-value of 71.59 and P-value < 0.01 indicated that the response surface quadratic model was significant difference. The ANOVA of the quadratic regression model showed that experimental data for transformation efficiency had a correlation coefficient (R2) of 0.9893 for the calculated model, which implied that the experimental results were agreement with the theoretical values predicted by the polynomial model. The model was suitable for application in the competence cells preparation and plasmid transformation. The Lack of Fit (F-value of 0.13) was not significant compared with pure error, which further indicated this model could accurately predict the preparation of competent cells and plasmid transformation. The data in Table 3 showed that all the linear coefficients (X1, X2) and quadratic term coefficients (X, X, X) significantly affected the transformation efficiency (P <0.05). To further understand the relationship between the three independent variables in transformation efficiency, the three-dimensional response surface were plotted in Fig. 3. The interactive effects of SrCl2 concentration and heat-shock time, DNA concentration and heat-shock time, and SrCl2 concentration and DNA concentration on the transformation efficiency of E. coli DH5α with pUC19 plasmid were displayed in Figs. 3A–3C, respectively. It was observed that the transformation efficiency enhanced gradually up to a threshold level with the increase of Sr2+ concentration, as well as heat-shock time, the amount of pUC19 plasmid. Then, the transformation efficiency slightly decreased beyond this level. The maximum transformation efficiency in E. coli DH5α predicted by the model was 1.63 ×10⁶, when Sr2+ concentration, heat shock time, the amount of pUC19 plasmid DNA were set at 83.87 mM, 88.47 s, and 9.05 ng, respectively. Considering the operability in actual production, the optimal conditions could be modified as follows: Sr2+ concentration of 90.0 mM, heat-shock time of 90 s, the amount of pUC19 plasmid DNA of 9 ng. The average transformation efficiency obtained under these conditions was (1.76 ± 0.21) ×106 (n = 3). These results confirmed that the response model was sufficient to optimize the preparation of E. coli DH5α competent cells and transformation for pUC19 plasmid. Thereafter, other 5 strains of E. coli were chosen to verify the optimal conditions with different size of plasmid including pUC19 (2.68 kb), pET32a (5.9 kb) and pPIC9k (9.27 kb). The results were shown in Fig. 4, the strain (E. coli DH5α and JM109) with a higher transformation efficiency was obtained, and the transformation efficiency decreased with the increase of molecular weight of the plasmid. A similar result was described by Chan et al. (2002).
| Sources | SSa | DFb | MSc | F value | Significance |
|---|---|---|---|---|---|
| Model | 6.16 ×10¹² | 9 | 6.85 ×10¹¹ | 71.58562 | <0.0001** |
| X1 | 5.31 ×10¹¹ | 1 | 5.31 ×10¹¹ | 55.45105 | 0.0001** |
| X2 | 8.27 ×10¹⁰ | 1 | 8.27 ×10¹⁰ | 8.642465 | 0.0217* |
| X3 | 3.43 ×10⁹ | 1 | 3.43 ×10⁹ | 0.358188 | 0.5684 |
| X1X2 | 4.54 ×10¹⁰ | 1 | 4.54 ×10¹⁰ | 4.746211 | 0.0658 |
| X1X3 | 7.62 ×10⁹ | 1 | 7.62 ×10⁹ | 0.796378 | 0.4018 |
| X2X3 | 3.5 ×10⁹ | 1 | 3.5 ×10⁹ | 0.366159 | 0.5642 |
| X | 2.03 ×10¹² | 1 | 2.03 ×10¹² | 212.4936 | <0.0001** |
| X | 1.51 ×10¹² | 1 | 1.51 ×10¹² | 157.757 | <0.0001** |
| X | 1.38 ×10¹² | 1 | 1.38 ×10¹² | 143.8017 | <0.0001** |
| Residue | 6.7 ×10¹⁰ | 7 | 9.57 ×10⁹ | ||
| Lack of fit | 6.06 ×10⁹ | 3 | 2.02 ×10⁹ | 0.132688 | 0.9356 |
| Pure error | 6.09 ×10¹⁰ | 4 | 1.52 ×10¹⁰ | ||
| Cor total | 6.23 ×10¹² | 16 |
Notes:
Note: The data with “**” represented extremely significant difference (P <0.01); the data with“*” represented significant difference (0.01 <P <0.05), respectively. SSa, sum of squares. DFb, degree of freedom. MSc, mean square.

Figure 3: Three-dimensional response surface and contour plots of transformation efficiency against Sr2+ concentrations, heat-shock time and the amount of plasmid.
Actual factors of were set at 0 in coded levels, respectively. All operations were performed three duplicates. (A). The interaction effect between Sr2+ concentrations and heat-shock time on transformation efficiency; (B). The interaction effect between Sr2+ concentrations and amount of plasmid on transformation efficiency; (C). The interaction effect between heat-shock time and amount of plasmid on transformation efficiency.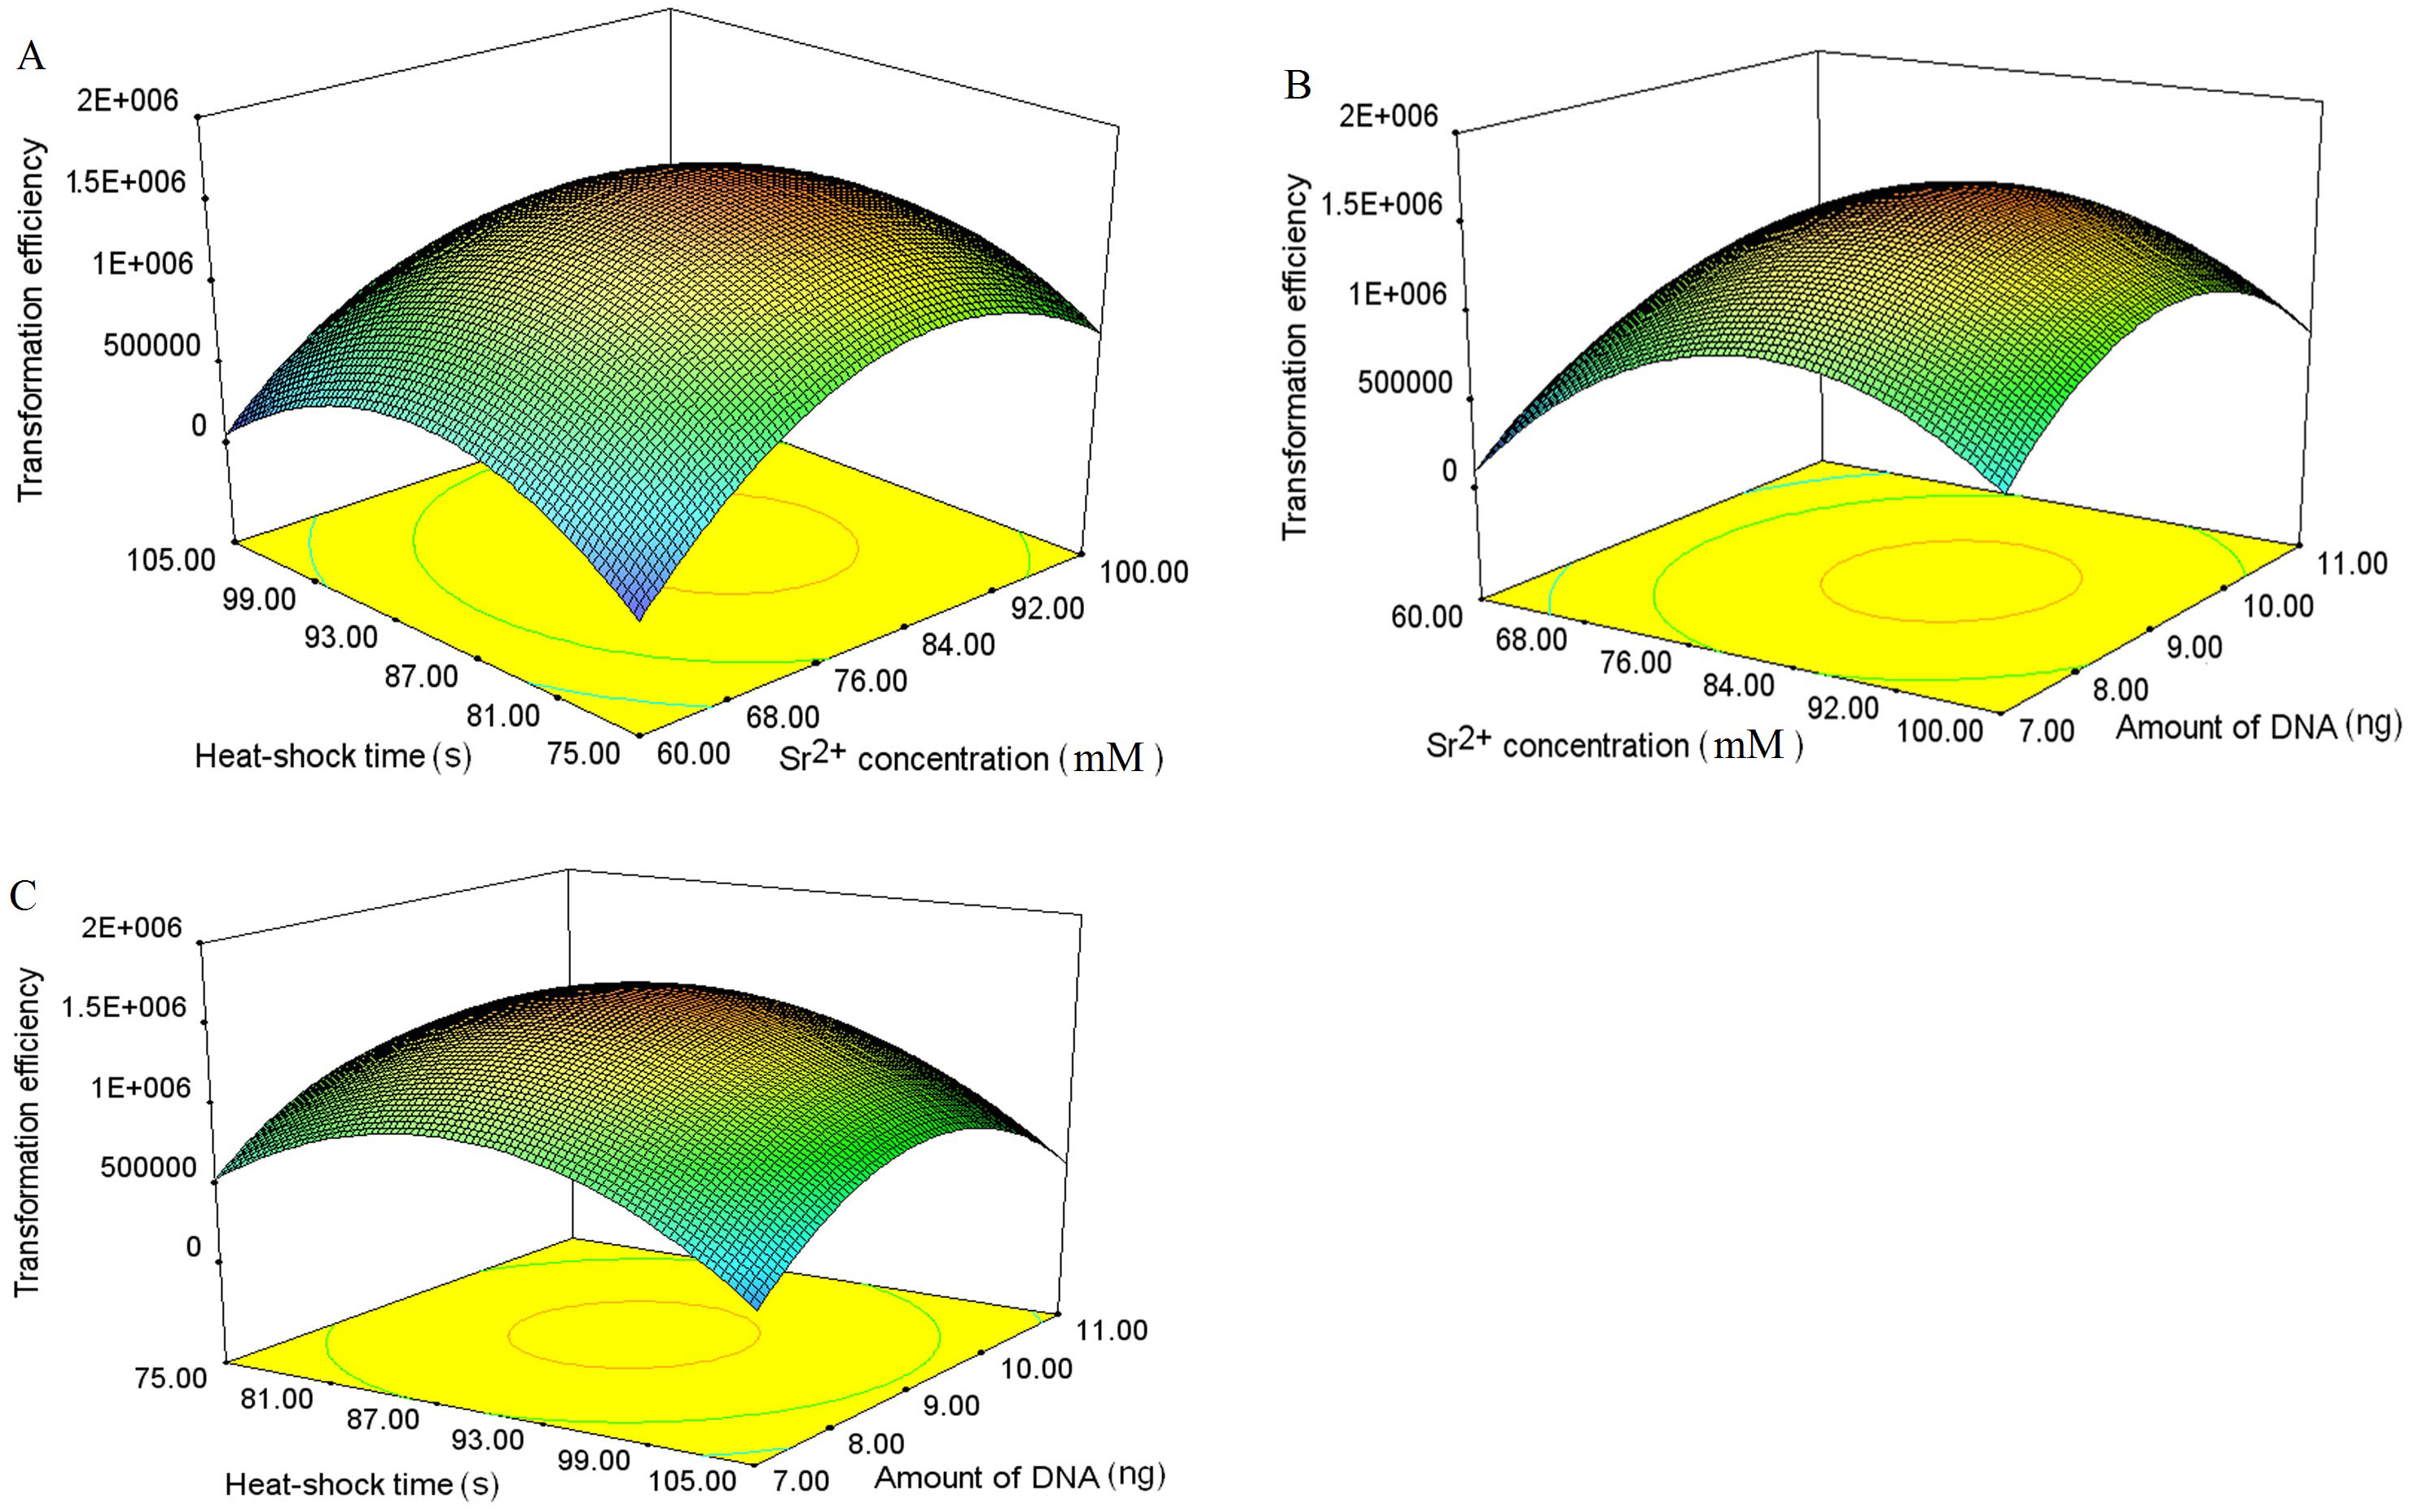
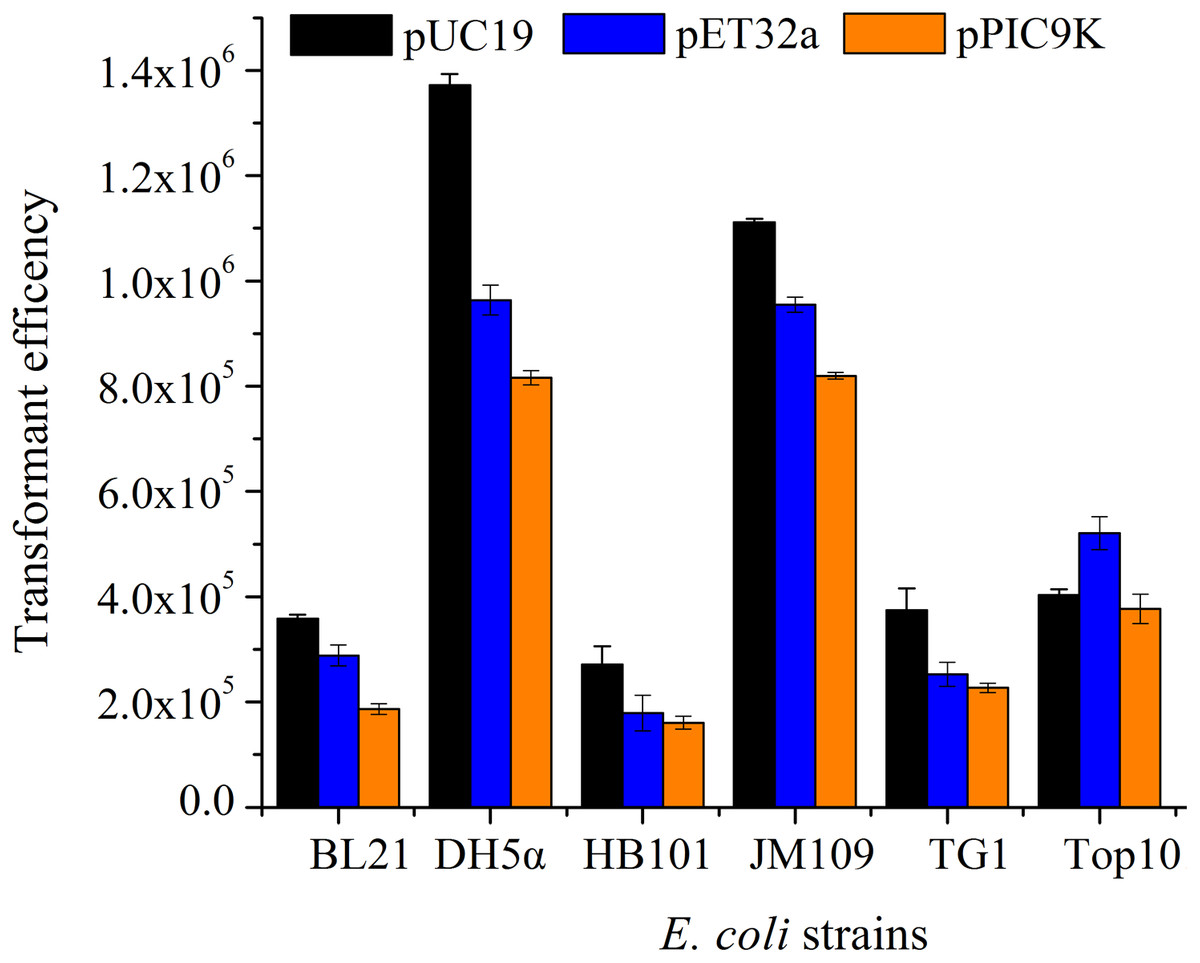
Figure 4: The transformation efficiency of various E. coli strains prepared by SrCl2 method for different plasmids.
The different E. coli strains were treated by sterile and prechilled SrCl2 (90.0 mM), and transformed with 9 ng plasmid at 42 °C for 90 s. Transformation efficiency was calculated in accordance with the colony forming unit (CFU) per µg DNA. All operations were performed three duplicates.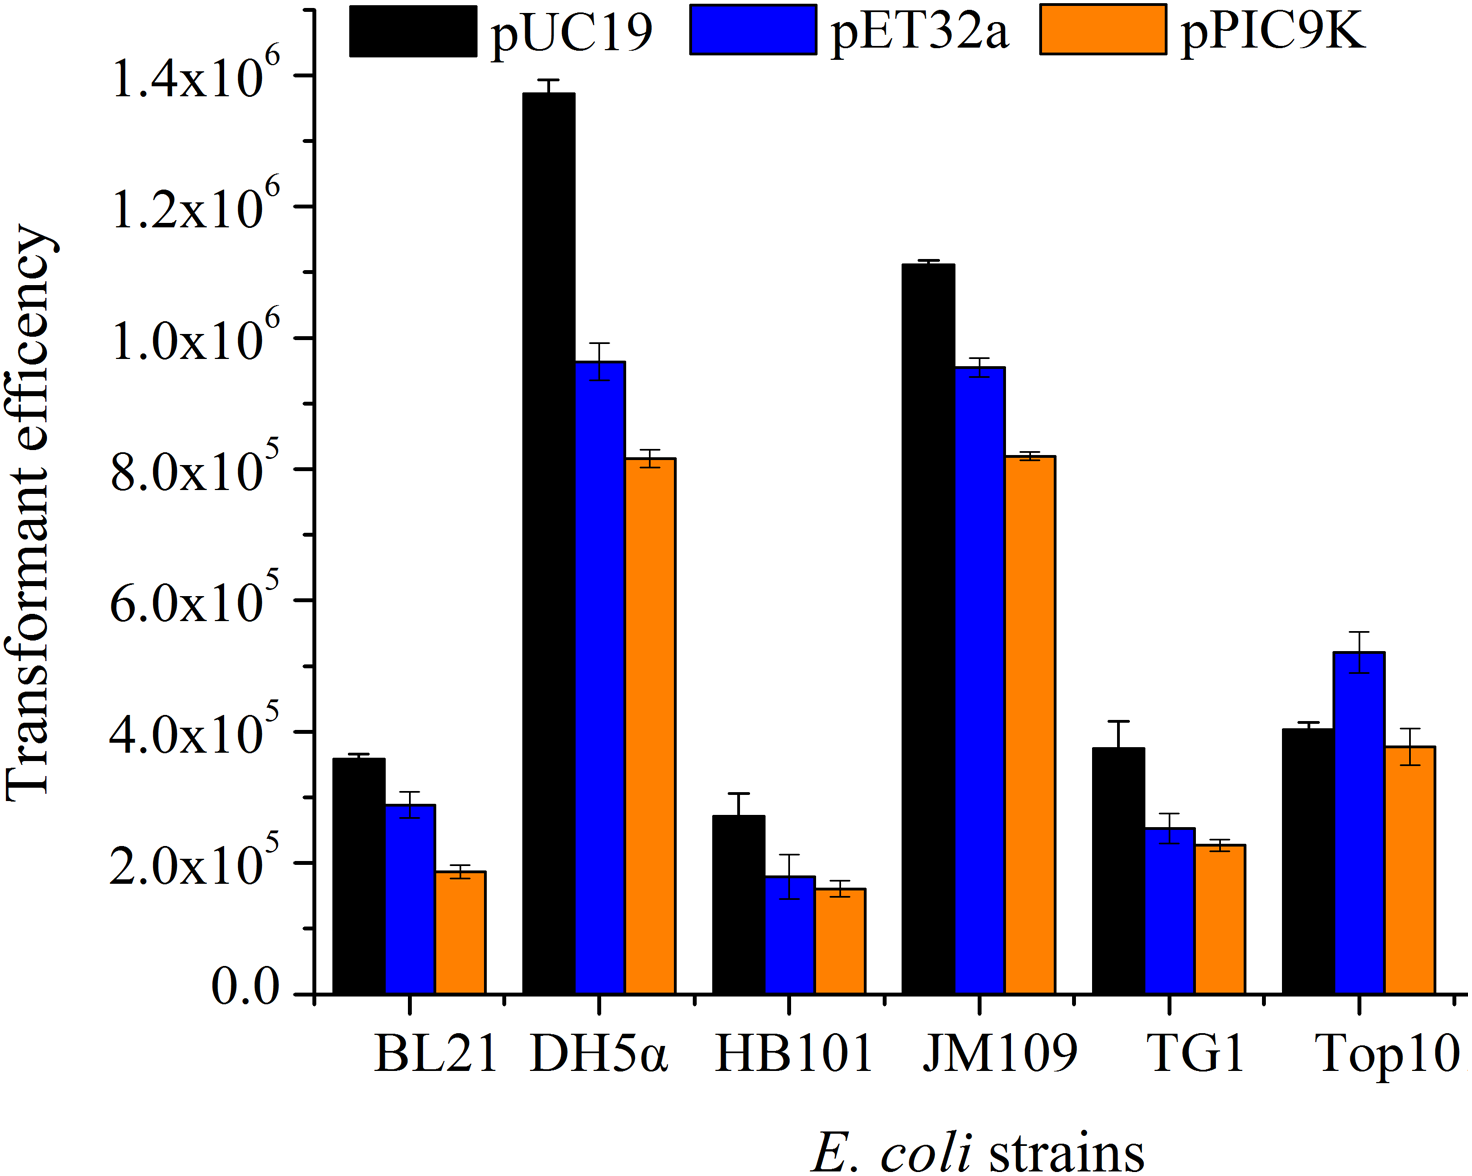
Surface observation with SEM and determination of content of Sr2+ in the cell surface
SEM is a useful method for checking the higher resolution of cell surfaces (Li et al., 2004; Panja et al., 2008). The surface structure of E. coli DH5α competent cells treated with 90 mM SrCl2 and E. coli DH5α cells were observed by SEM at a magnification of 10,000 and 50,000, as shown in Fig. 5. E. coli DH5α cells showed the typical rod-shaped bacteria with the length of 1.63–2.54 µm, a width of 0.63–0.9 µm (Fig. 5A), and the cells treated by Sr2+ kept rod-shaped characteristics with a typical length of 1.63–2.12 µm, a width of 0.43–0.81 µm (Fig. 5B). The cells treated with Sr2+ seemed to gather together, which attributed to the cell surface charge is changed. The cell’s shape and size almost remained unchanged between the two groups. However, the surface of the treatment cells appeared rough and wrinkled morphology (Fig. 5D) compared with that of normal cells (Fig. 5C). To check whether Sr2+ only attached to the cell surface, the contents of Sr2+ on the surface between the normal cells and competent cells were determined using an SEM-EDS as shown in Fig. 6. The contents of Sr2+ on the surface of competent cells was significantly higher than that of normal cells, which implied that a part of Sr2+ remained on the surface of the competent cells. The content of Sr2+ in the supernatant of E. coli DH5α treated with 90 mM of Sr2+ was measured by AAS. The content of Sr2+ concentration was measured 82.15 mM according to the calibration curve of SrCl2 solution, which illustrated that a small part of Sr2+ may be entered into the cells or adsorbed on the surface of the cells. Based on the analysis results of EDS, we deduced Sr2+ indeed was adsorbed on the cell surface, and whether Sr2+ could enter into cells needs further research.
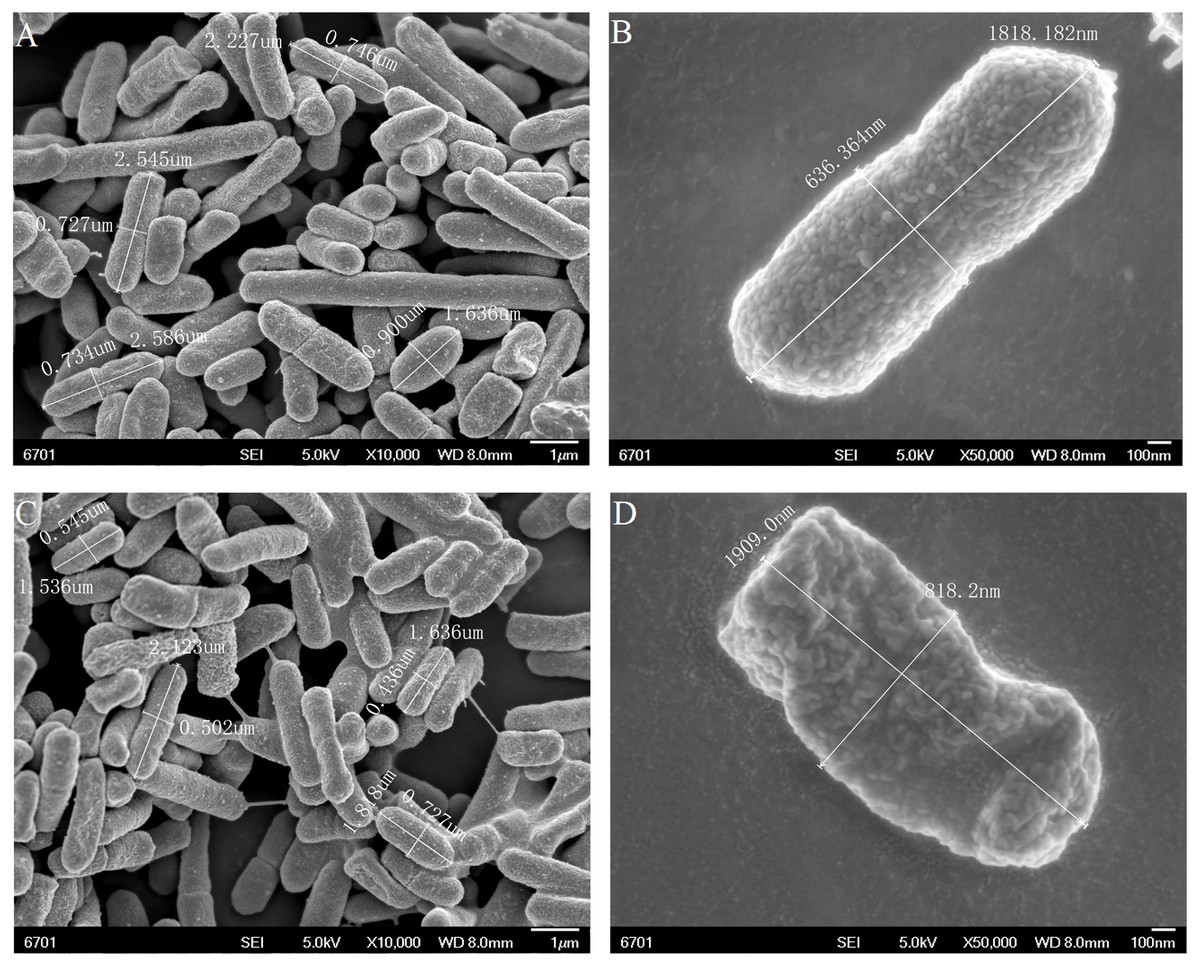
Figure 5: The surface of the E. coli DH5α competent cells and E. coli DH5 α cells by SEM analysis.
The iced-drying E. coli DH5 α cells and competent cells were coated with a thin layer of gold under reduced pressure. The surface morphology of E. coli DH5 α cells at 10000× (A) and 50000× (B), that of competent cells at 10000× (C) and 50000× (D) observed at magnifications of 10000×∼50000× using a SEM system at a 10 kV acceleration voltage.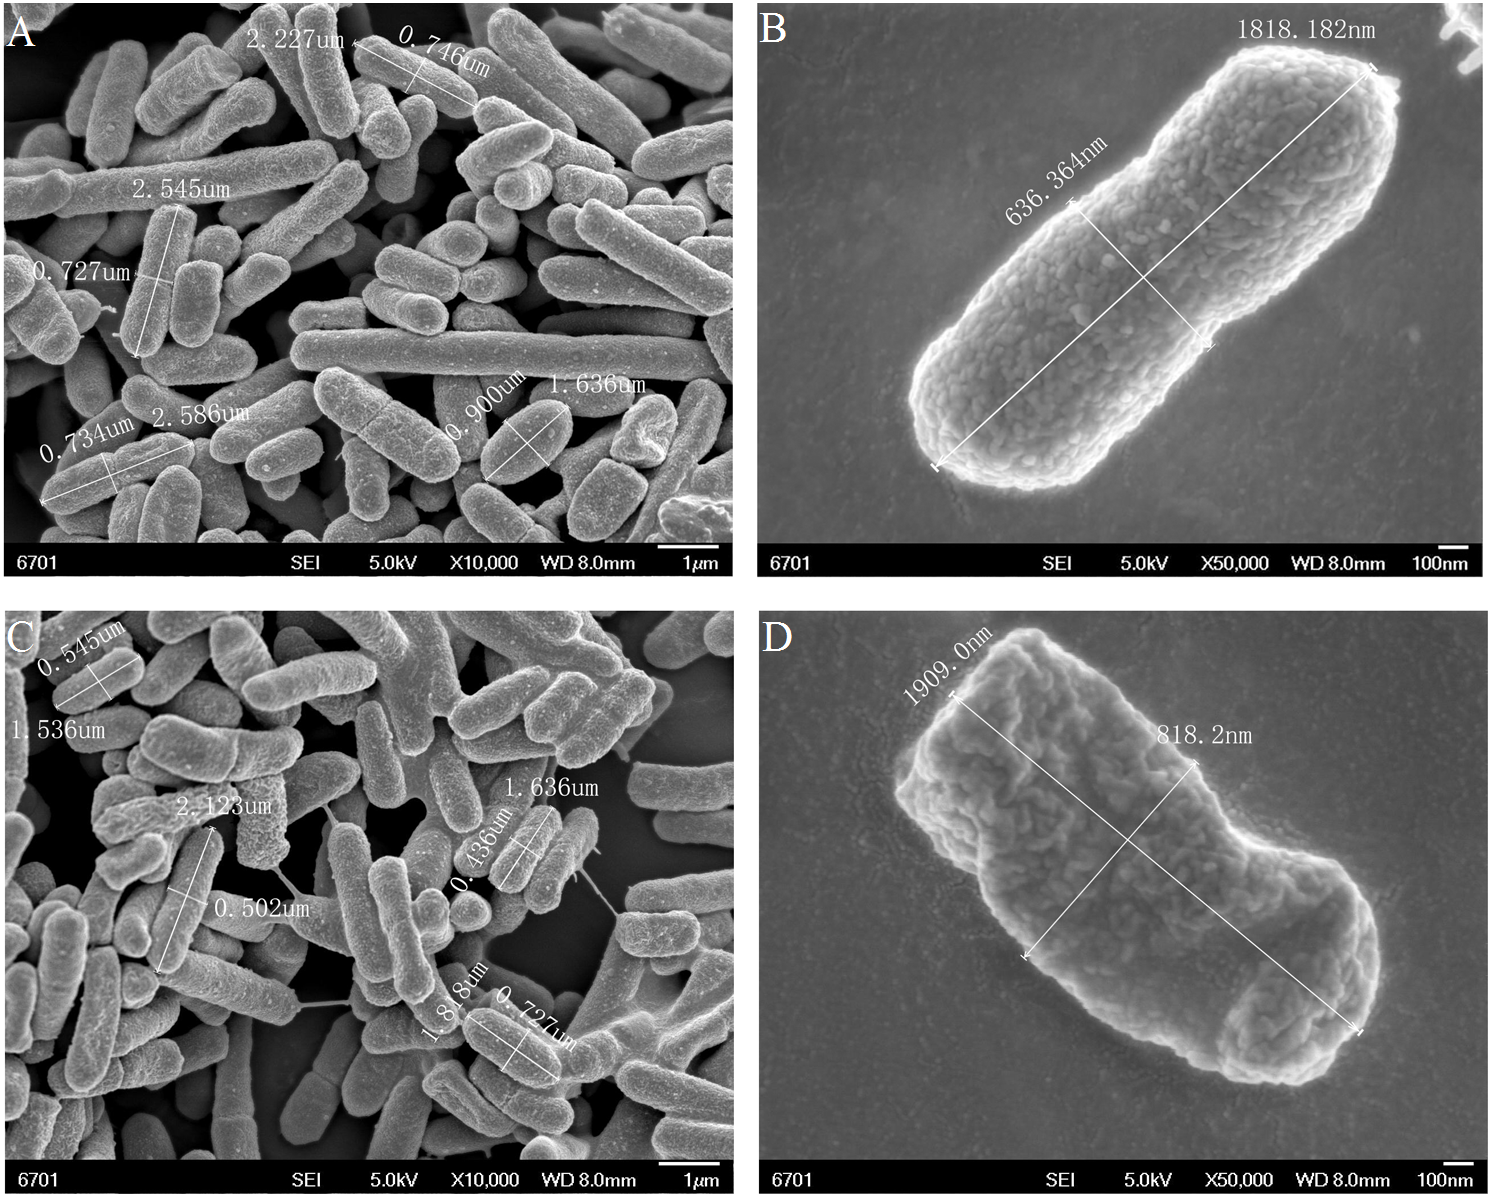
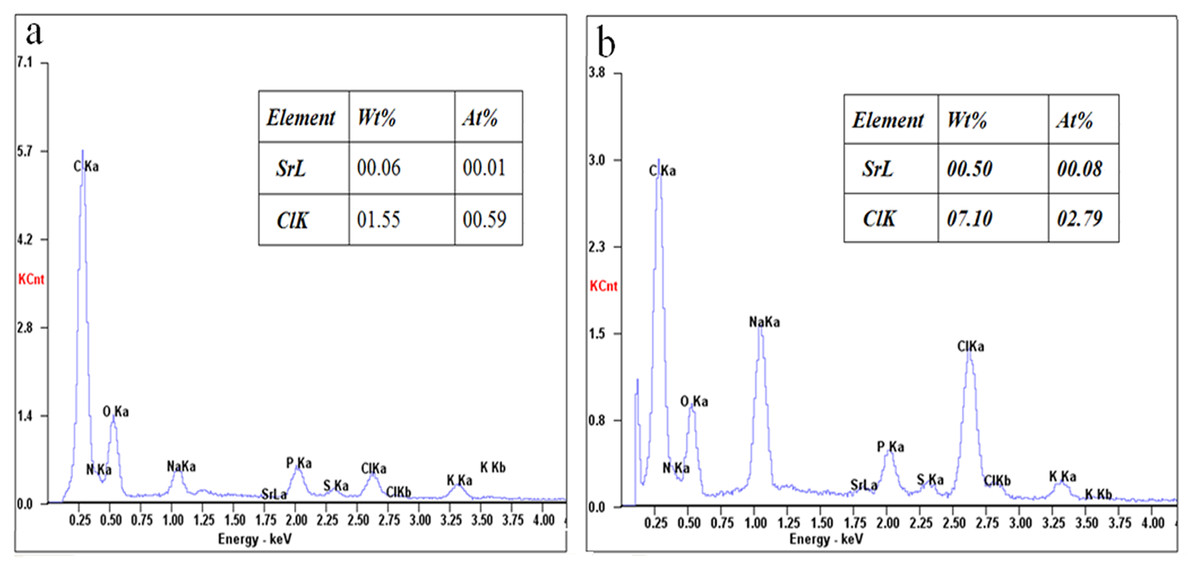
Figure 6: The content of Sr2+ ions on the cell surface between the E. coli DH5α competent cells and E. coli DH5α cells by SEM-EDS analysis.
The iced-drying E. coli DH5α cells and competent cells were coated with a thin layer of gold under reduced pressure. The content of Sr2+ ions on the cell surface of the E. coli DH5α cells (A) and E. coli DH5α competent cells (B) was determined by SEM-EDS analysis.
FT-IR analysis
Fourier transform infrared spectrum (FT-IR) could not only provide molecular groups characteristics of vibration absorption spectrum band but also detect the change of the molecular groups and the strain identification (Hellwig, Stolpe & Friedrich, 2004; Carlos et al., 2011). FT-IR of E. coli DH5α cells and competent cells were all shown in Fig. 7. A detailed analysis of FT-IR absorbance spectra of the strains was presented as follow: the peak at 1,060 cm−1 was attributed to a sugar absorbance, which was mainly caused by the C-OH stretch or the P-O-C stretch form polysaccharide skeleton vibration. A spectral feature between 1,220 cm−1 and 1,384 cm−1 was assigned to the symmetric stretching vibration νs (PO) and symmetric stretching vibration νas (PO) of the phosphodiester group of nucleic acid molecules (Muntean et al., 2014). An obvious absorption peak at 1,456.82 cm−1 was assigned to a stretching vibration of asymmetric bending vibration δs (CH3) of methyl in a protein molecule. The peaks at 1,537.01 cm−1 and 1,614 cm−1 were regarded as the stretching vibration of C-N, C=O and the bending vibration of N-H from protein amide (Goormaghtigh, Cabiaux & Ruysschaert, 1994). The peaks at 2,919.46 cm −1 νas (CH2) and 2,937.17 cm−1 νas (CH3) were the typical stretching vibration of C-H of aliphatic carbon chain, which reflected the essential feature of E. coli cell wall including the information of fatty acids, membrane proteins and other amphiphilic molecules (Muntean et al., 2014). A broad peak at near 3417 cm−1 has been assigned to the stretching vibration of O-H, N-H from polysaccharides, fatty acids and proteins (Goormaghtigh, Cabiaux & Ruysschaert, 1994; Muntean et al., 2014). According to the above description, the cell displayed slightly different after the Sr2+ treatment (Fig. 7), which was consistent with the SEM observation. The differences of the relative intensity and the peak area mainly occurred at 1,537.01 cm −1, 1,384.66 cm−1, 1,220.74 cm−1 and 1,060.67 cm−1 among three cells, which implied that the cell surface structure including phospholipids and membrane proteins. The lipopolysaccharide could generate some changes by the combination with Sr2+. The results were similar to those described in SEM-EDS and AAS analysis.
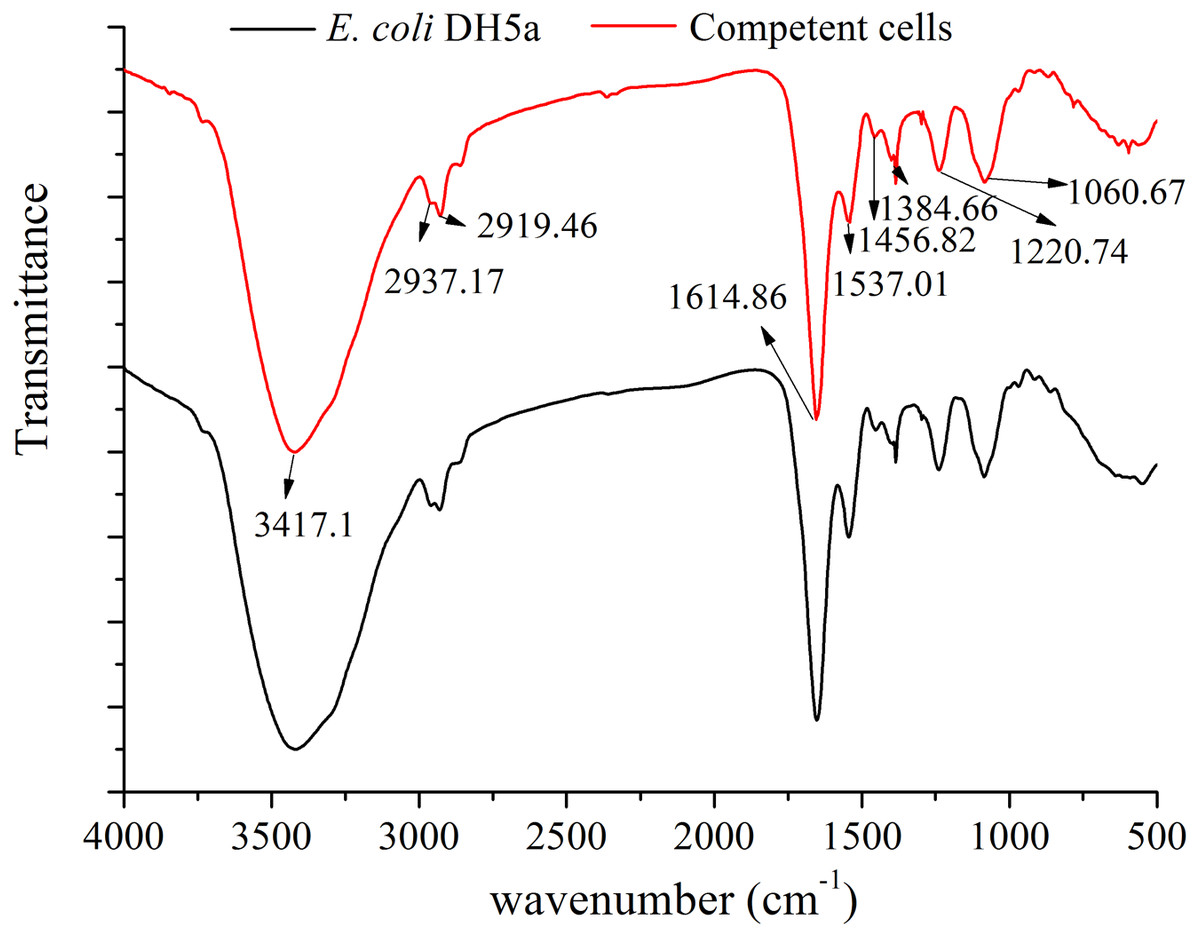
Figure 7: FT-IR of E. coli DH5α cells and competent cells.
E. coli DH5α and competent cells prepared by SrCl2 method was recorded by FT-IR spectrometer (Nexus670, Nicolet, American) with the range of 4,000–400 cm−1 at a resolution of four cm−1.
Discussions
The development of competent cells is one of the key techniques for introducing foreign DNA into cells. Many literature have reported the development of chemo-transformation, physical-assisted transformation, electrotransformation and other new nanocarrier-mediated transformation (Chan et al., 2013; Choi et al., 2013; Brito et al., 2017; Roychoudhury, Basu & Sengupta, 2009; Ren et al., 2019). Among these methods, the chemical artificial transformation was regarded as the simple and efficient bacterial transformation technique. E. coli X1776 was optimally transformed by pBR322 DNA and a higher efficiency was obtained under the following conditions: 100 mM C MgCl2aCl2 in 5 mM Tris buffer (250 mM KCl and 5 mM MgCl2, pH 7.6) (Nørgard, Keem & Monahan, 1978). Ren et al. (2017), described a chloride (RbCl)-based chemical-physical method that the best transformation efficiency for E.coli DH5α was obtained 4.3 ×10⁶ CFU/µg of pUC19 plasmid, in which glycerol (2.6%), MnCl2 (2.5 M), potassium acetate (0.1 M) and CaCl2 (100 mM) was used as transformation solution. Choi et al. (2013) also exhibited a new bacterial transformation method by magnesium and calcium aminoclays, and a transformation efficiency of up to 2 ×10⁵ CFU/µg pBBR122 in E. coli XL-1 and Streptococcus mutans (KCTC 3065). According to the abovementioned description, these divalent cations (Mg2+, Mn2+, Ba2+, Sr2+), especially Ca2+ ions played the most important roles in higher transformation efficiency and displayed different transformation efficiency for various strains. The important factors of competent cells preparation and transformation included the growth state of bacteria, kinds of the metal ions, the concentration of the metal ions, duration of ice bath, incubation time at 42 °C and concentration of plasmid DNA, which had significant effect on the transformation efficiency.
Hence, more efficient methods should be established and employed for multiple microorganisms. In this study, the preparation of E. coli DH5α competent cells treated with SrCl2 and the transformation by heat-shock with pUC19 plasmid were optimized by RSM. An equation of the regression model and the optimized value for generation of competent cells and transformation was obtained and was verified by the other five E. coli strains with different size of plasmids. The transformants approximately reached to 106 CFU/µg DNA, which was sufficient for the gene clone and expression. The ideal parameters to obtain maximum transformation efficiency in E. coli DH5α strain with pUC19 plasmid DNA was Sr2+ of 90 mM, heat-shock time of 90 s, the amount of pUC19 plasmid DNA of 9 ng. However, the precise details of transformation mechanisms remain vague (Aich et al., 2012; Claverys & Martin, 2003; Wang, Sun & Ma, 2016; Ren et al., 2019). Some researchers considered that cell membranes fluidity was weakened by using cations (e.g., Na+, Mg2+, Ca2+, Ba2+) and low temperature (ice-water bath). The phosphate groups and other negatively charged groups (hydroxyl and the carboxyl group) on the bacterial cell membrane could bind with these cations, that played a bridge to introduce the exogenous DNA to permeabilize the membrane to absorb plasmid DNA. Panja et al. summarized the cations form stable coordination compounds to promote DNA into the cells by eliminating electrostatic repulsion between DNA and lipo-polysaccharide (LPS) molecules on the outer membrane (Panja et al., 2006; Panja et al., 2008). As an amphiphile, DMSO or glycerin could further improve the efficiency, which might be due to the fact that amphiphiles promotes a better bond between the cation and the outer membrane, thereby facilitate DNA-membrane contact (Hanahan, 1983). While some other reports indicated the cations and cold-hot alternation in the process of transformation causes the cell membrane to transform into a more regular packing structure with a less fluid-like behavior. This solidified membrane may increase the permeability to DNA, which may be due to the complex forming of PHB/Ca2+/PPi leading to small pores in the membrane structure (Addison, Chu & Reusch, 2004; Huang & Reusch, 1995; Pavlov et al., 2005). Meanwhile, the pores could be enlarged by adding of other bioorganic compounds, such as 10% ethanol (Sarkar, Choudhuri & Basu, 2002a; Sarkar, Choudhuri & Basu, 2002b; Sharma, Singh & Gill, 2007) and cyclodextrins (Aachmann & Aune, 2009). It was recommended to incorporate more unsaturated lipids into the membrane at lower temperatures to maintain membrane fluidity (Aachmann & Aune, 2009). Since the membrane is more flexible, this seems to relieve DNA uptake during the shock and recovery phases. In this paper, we preliminarily explored the transformation mechanism by SrCl2 method. The results showed that the surface between E. coli DH5α and competent cells treated with 90 mM SrCl2 appeared rough and wrinkled and shrank by SEM analysis. A part of Sr2+ was adsorbed on the cell surface, which implied that Sr2+ played a role in foreign DNA entering into the competent cells by the interaction between Sr2+ andthe cell surface. Also, FT-IR differences of the relative intensity and the area of the peak between E. coli DH5α and competent cells mainly occurred at 1,537.01 cm−1, 1,384.66 cm−1, 1,220.74 cm−1 and 1,060.67 cm−1, respectively. These wavenumbers were related to the phosphate group, hydroxyl and carboxyl group involved in phospholipids, membrane proteins, and lipopolysaccharide (LPS) on the cell surface. The results further were verified by SEM-EDS and AAS, some Sr2+ ions were adsorbed on the cell surface, and others may be entered into the cells. However, whether Sr2+ could enter into the cell, and why the higher transformation efficiency must be achieved by divalent metal ions such as Mg2+, Ca2+, Sr2+, Ba2+ and Mn2+, rather than K+, Na+, Co2+, Zn2+ and Al3+, these questions need to be further explored. Although many studies have shown that membrane proteins and environmental stress factors played important roles in the formation of competent cells and transformation, the mechanisms are still not well known until now. Based on all of these phenomena and conclusions, we also speculate that the transformation is not only a kind of microbial physiological phenomenon but also a physicochemical and biochemical process (Yoshida & Sato, 2009; Aune & Aachmann, 2010), in which complex regulatory mechanisms maybe existed (Finkel & Kolter, 2001; Claverys & Martin, 2003; Aich et al., 2011).
Conclusion
In this study, E. coli competent cells were prepared by the SrCl2+ treatment, and the method was optimized by Response Surface Methodology (RSM). The differences between the normal cells and competent cells were analyzed by multispectral techniques, that revealed the minor changes occurred and strict regulatory mechanisms existed in E. coli cells.