
Validation of Plasmodium falciparum deoxyhypusine synthase as an antimalarial target
- Published
- Accepted
- Received
- Academic Editor
- Erika Braga
- Subject Areas
- Biochemistry, Cell Biology, Microbiology, Molecular Biology, Parasitology
- Keywords
- Hypusination, glmS riboswitch, PfDHS, Deoxyhypusine synthase, Plasmodium falciparum, PfeIF5A, Antimalarial, Drug target
- Copyright
- © 2019 Aroonsri et al.
- Licence
- This is an open access article distributed under the terms of the Creative Commons Attribution License, which permits unrestricted use, distribution, reproduction and adaptation in any medium and for any purpose provided that it is properly attributed. For attribution, the original author(s), title, publication source (PeerJ) and either DOI or URL of the article must be cited.
- Cite this article
- 2019. Validation of Plasmodium falciparum deoxyhypusine synthase as an antimalarial target. PeerJ 7:e6713 https://doi.org/10.7717/peerj.6713
Abstract
Background
Hypusination is an essential post-translational modification in eukaryotes. The two enzymes required for this modification, namely deoxyhypusine synthase (DHS) and deoxyhypusine hydrolase are also conserved. Plasmodium falciparum human malaria parasites possess genes for both hypusination enzymes, which are hypothesized to be targets of antimalarial drugs.
Methods
Transgenic P. falciparum parasites with modification of the PF3D7_1412600 gene encoding PfDHS enzyme were created by insertion of the glmS riboswitch or the M9 inactive variant. The PfDHS protein was studied in transgenic parasites by confocal microscopy and Western immunoblotting. The biochemical function of PfDHS enzyme in parasites was assessed by hypusination and nascent protein synthesis assays. Gene essentiality was assessed by competitive growth assays and chemogenomic profiling.
Results
Clonal transgenic parasites with integration of glmS riboswitch downstream of the PfDHS gene were established. PfDHS protein was present in the cytoplasm of transgenic parasites in asexual stages. The PfDHS protein could be attenuated fivefold in transgenic parasites with an active riboswitch, whereas PfDHS protein expression was unaffected in control transgenic parasites with insertion of the riboswitch-inactive sequence. Attenuation of PfDHS expression for 72 h led to a significant reduction of hypusinated protein; however, global protein synthesis was unaffected. Parasites with attenuated PfDHS expression showed a significant growth defect, although their decline was not as rapid as parasites with attenuated dihydrofolate reductase-thymidylate synthase (PfDHFR-TS) expression. PfDHS-attenuated parasites showed increased sensitivity to N1-guanyl-1,7-diaminoheptane, a structural analog of spermidine, and a known inhibitor of DHS enzymes.
Discussion
Loss of PfDHS function leads to reduced hypusination, which may be important for synthesis of some essential proteins. The growth defect in parasites with attenuated Pf DHS expression suggests that this gene is essential. However, the slower decline of PfDHS mutants compared with PfDHFR-TS mutants in competitive growth assays suggests that PfDHS is less vulnerable as an antimalarial target. Nevertheless, the data validate PfDHS as an antimalarial target which can be inhibited by spermidine-like compounds.
Introduction
The incidence of malaria has declined around the world in recent years, with a 21% reduction reported worldwide during the period 2010–2015 (World Health Organization, 2016). Programs to eliminate the disease in endemic countries could be thwarted by evolving Plasmodium falciparum parasite resistance to artemisinin-combination therapies that are widely used to treat and prevent infections (Woodrow & White, 2017). New drugs with novel modes of action are needed to combat drug-resistant parasites. Identification of novel drug targets should accelerate the development of such antimalarials.
Polyamines are nitrogenous base compounds that are essential for cellular proliferation and development. Malaria parasites synthesize large amounts of polyamines, in which spermidine is a major metabolite present in all stages of development (Teng et al., 2009). Moreover, several different polyamine analogues possess antimalarial activity, suggesting that polyamine metabolism constitutes novel drug targets (reviewed in Clark et al. (2010)). One of the main uses of spermidine in eukaryotes is for hypusination of translation initiation factor 5A (eIF5A) protein; two enzymes are required for this post-translational modification, namely deoxyhypusine synthase (DHS) and deoxyhypusine hydrolase (reviewed in Park et al. (2010)). P. falciparum possesses a single gene encoding eIF5A, and functional studies of the parasite eIF5A protein have shown that it is a substrate for hypusination (Molitor et al., 2004). Malaria parasites also possess canonical enzymes for hypusination of eIF5A, and the P. falciparum DHS enzyme (PfDHS) uses eIF5A protein as a substrate for incorporation of spermidine (Kaiser et al., 2007). The enzymatic activity of PfDHS is inhibited by N1-guanyl-1,7-diaminoheptane (GC7), a known inhibitor of human DHS enzyme (Kaiser et al., 2007). Hypusination of eIF5A by PfDHS is likely to be essential since P. falciparum is moderately sensitive to growth inhibition by GC7 (Kaiser et al., 2001) and no insertions of piggyBac transposon within the PfDHS gene are tolerated (Zhang et al., 2018). The orthologous gene encoding DHS enzyme in the murine malaria parasite P. berghei is essential, since clonal transgenic P. berghei parasites with knockout of the DHS gene cannot be isolated (Kersting et al., 2016), and P. berghei DHS knockout parasites have a severe growth defect causing them to rapidly disappear from host animals co-infected with other transgenic parasites (Bushell et al., 2017).
In this study, we investigated PfDHS function in transgenic P. falciparum parasites. The glmS riboswitch tool (Prommana et al., 2013) was used to attenuate PfDHS expression. Attenuation of PfDHS expression led to defects in hypusination of eIF5A and growth of transgenic parasites. Moreover, attenuation of PfDHS expression specifically sensitized parasites to GC7, a known inhibitor of PfDHS enzyme activity.
Materials and methods
Ethics statement
Human erythrocytes were obtained from donors after providing informed written consent, following a protocol approved by the Ethics Committee, National Science and Technology Development Agency, Pathum Thani, Thailand, document no. 0021/2560.
Construction of DNA transfection vectors
A total of 1,493 bp of homologous targeting sequence from the PF3D7_1412600 gene encoding deoxyhypusine synthase (PfDHS) was PCR-amplified from P. falciparum strain 3D7 genomic DNA using primers pGFP_glmS_DHSF and GFP_glmS_DHSR (Table S1) and Phusion® DNA polymerase (Thermo Fisher Scientific, Waltham, MA, USA) following the manufacturer’s recommendations. The pGFP_glmS and pGFP_M9 plasmids carrying glmS riboswitch element and the M9 inactive variant, respectively, (Prommana et al., 2013) were first modified to remove unnecessary hsp86 promoter and REP20 sequences by digestion with AflII and BglII. The digested plasmids were religated to create Sim_ pGFP_glmS and Sim_pGFP_M9 vectors. The PfDHS targeting sequence was cloned into NheI and KpnI (New England Biolabs [NEB], Ipswich, MA, USA) digested vectors using a Gibson assembly kit (NEB). A total of 960 bp of homologous targeting sequence from the PF3D7_1364900 gene encoding ferrochelatase (PfFC) was PCR-amplified from P. falciparum strain 3D7 genomic DNA using primers PfFCSacIIF and PfFCKpnIR (Table S1) and GoTaq® DNA polymerase (Promega Corporation, Madison, WI, USA) following the manufacturer’s recommendations. The PfFC targeting sequence DNA was digested with SacII and KpnI restriction enzymes (NEB) and cloned into pGFP_glmS plasmid (Prommana et al., 2013) digested with the same enzymes.
Plasmodium falciparum culture and DNA transfection
Plasmodium falciparum strain 3D7 (reference strain) and transgenic parasite derivatives were cultured in vitro following the standard method (Trager & Jensen, 1976), with the modification of 0.5% Albumax I (Gibco™, Thermo Fisher Scientific, Waltham, MA, USA) replacing human serum (Cranmer et al., 1997). Human O+ erythrocytes were obtained from donors after obtaining their written informed consent. 2% hematocrit was used for most parasite cultures, with slightly higher hematocrit (up to 4%) used during blasticidin selection steps of DNA transfection. Parasites were synchronized to ring stages by sorbitol treatment (Lambros & Vanderberg, 1979). Approximately 50 μg of plasmid DNA was used for each parasite transfection experiment. Transfection was performed by the method of direct transfection of infected host cells (Wu et al., 1995) or invasion of DNA-loaded erythrocytes (Deitsch, Driskill & Wellems, 2001). Transgenic parasites were selected by treatment with 2 μg/mL blasticidinS-HCl (Gibco™), which was added to parasite culture 48 h post-transfection. Parasites were cultured under drug selection until resistant parasites emerged (3 weeks), after which the drug was removed and culture continued for 2 weeks. The drug on-off cycle (2 weeks each) was repeated to enrich for integrant parasites in the population. Integrants were detected by PCR assay. Genomic DNA samples were obtained for genotypic analysis of transgenic parasites using a Genomic DNA Mini Kit (Blood/Cultured Cell) (Geneaid Biotech, New Taipei City, Taiwan). Integration at the PfDHS locus was checked using primers DHS_intF and 3UTRpbDT_glmSR (Table S1). PCRs contained 20 ng of genomic DNA, 500 nM of each primer, one unit of Phusion polymerase (Thermo Scientific™, Thermo Fisher Scientific, Waltham, MA, USA) and 2.5 mM MgCl2. The reaction conditions were: 98 °C for 3 min followed by 35 cycles of 98 °C 10 s, 52 °C 30 s, and 72 °C for 90 s, and final extension at 72 °C for 5 min. The presence of transfected DNA in transfection experiments to modify the PfFC gene was checked using primers BglIIPfFCF and 3UTRpbDTglmSR (Table S1). A control PCR to amplify the PfFC coding region and thus verify template DNA quality was performed using primers BglIIPfFCF and PfFCKpnIR (Table S1). PCR assays of the PfFC locus contained 20 ng of genomic DNA, 100 nM of each primer, one unit of GoTaq polymerase (Promega Corporation), and 2.5 mM MgCl2. The reaction conditions were: 95 °C for 2 min followed by 30 cycles of 95 °C 45 s, 53 °C 45 s, and 62 °C for 2 min 30 s, and final extension at 62 °C for 5 min.
Clonal lines of integrant transgenic parasites were established by limiting dilution in 96-well culture plates. A single clonal line from each transfection experiment, verified as integrant, was randomly selected for further study. Clonal lines PfDHS_glmS (active riboswitch) and PfDHS_M9 (inactive riboswitch) with integration at the PfDHS locus were obtained (Fig. S1). The clonal line PfFC_glmS (active riboswitch) with integration at the PfFC locus was obtained. Plasmid integration in clonal transgenic lines was verified by Southern blot (Figs. S1 and S2). A total of 20 µg samples of genomic DNA were digested overnight with restriction enzymes (NEB). BamHI and AflII enzymes were used for the PfDHS locus and SpeI and HindIII enzymes were used for the PfFC locus. Digested DNA samples were separated by electrophoresis and transferred by capillary action to Hybond N+ nylon membrane (GE Healthcare, Chicago, IL, USA). Probes were synthesized by PCR using primers pGFP_glmS_DHSF and GFP_glmS_DHSR for the PfDHS locus, and PfFCSacIIF and PfFCKpnIR for the PfFC locus (Table S1) as described above. Probe labeling, hybridization, and detection were performed using a DIG High Prime DNA labeling and Detection Starter Kit II (Roche Diagnostics, Basel, Switzerland) following the manufacturer’s instructions. The integrant transgenic parasite line described in (Prommana et al., 2013), referred to here as PfDHFR-TS_glmS, was used for growth studies. This parasite has a modified PF3D7_0417200 gene encoding P. falciparum dihydrofolate reductase-thymidylate synthase (PfDHFR-TS) with integration of GFP and glmS riboswitch sequences.
Confocal microscopy
Specimens of transgenic parasites PfDHS_glmS, PfFC_glmS, PfDHFR-TS_glmS, and 3D7 parental parasites were analyzed on a model FV 1,000D IX81 confocal laser scanning microscope (Olympus, Shinjuku, Japan). A 100× oil immersion objective lens (1.4 NA) was used. Parasite mitochondria were stained with 1 mM Mitotracker (Invitrogen™, Carlsbad, CA, USA; Thermo Fisher Scientific, Waltham, MA, USA) for 45–60 min at 37 °C. Parasite nuclei were stained with Hoechst 33342 (Invitrogen™) diluted 1:1,000 in RPMI medium (Gibco™) for 5 min at 37 °C. GFP signal was detected with an Argon laser 488 nm (500 nm excitation/600 nm emission; laser power 15%; high detector sensitivity 741 V; gain = 1 and offset = 12%), Mitotracker signal was detected with a yellow diode laser 559 nm (575 nm excitation/675 nm emission; laser power 15%; high detector sensitivity 641 V; gain = 1 and offset = 0%, and Hoechst signal was detected with a UV laser diode 405 nm (425 nm excitation/475 nm emission; laser power 10%; high detector sensitivity 615 V; gain = 1, and offset = 14%). Images were obtained using a scan speed of 10.0 μs/pixel and were analyzed using FV10-ASW 3.0 Viewer software (Olympus, Shinjuku, Japan).
Western immunoblot of PfDHS-GFP protein
A total of 15 mL cultures of ring-stage PfDHS_glmS and PfDHS_M9 synchronized parasites at 5% parasitemia and 3% haematocrit were treated with 0, 1.25, 2.5, and 5.0 mM GlcN for 24 h and harvested. Parasites were liberated from host cells by saponin lysis and washed with 1× PBS buffer (Thermo Scientific™) containing 1× EDTA-free protease inhibitor cocktail (Sigma-Aldrich, Merck KGaA, Germany) and 0.7 µg/mL pepstatin (Sigma). Parasite proteins were extracted by freeze-thaw rupture. Protein lysate was diluted in NuPAGE™ LDS sample buffer (4×, Thermo Scientific™) and stored at −80 °C. A 10 µg sample from each protein lysate was separated in NuPAGE 4–12% Bis-Tris Protein Gel (Invitrogen™) with 1× NuPAGE MOPS SDS running buffer (Invitrogen™). Proteins were transferred for 1.5 h at 30 V onto Immobilon-P PVDF membrane (Merck-Millipore, Merck KGaA, Germany) in 1× NuPAGE transfer buffer (Invitrogen™) by using a XCell II Blot system (Invitrogen™). Total protein was detected by Ponceau-S (Sigma) staining and an image of the stained membrane was captured on a flatbed scanner. After scanning, the Ponceau-S stain was removed from the membrane by washing with water. The destained membrane was incubated in blocking solution (5% non-fat skimmed milk in 1× TBST buffer; 10 mM Tris-base, 15 mM NaCl, pH 8.0, 0.05% Tween 20) for 1 h. PfDHS-GFP protein was immunodetected with 1:5,000 dilutions of rabbit anti-GFP polyclonal antibody (#PA1-19431; Thermo Scientific™) and goat anti-rabbit IgG antibody conjugated with HRP (#SC-2004; Santa-Cruz Biotechnology, Dallas, TX, USA). Proteins were detected by chemiluminescence using Pierce ECL Western Blotting Substrate (Thermo Scientific™). The intensity of the PfDHS-GFP band was measured by densitometry from the scanned image of the exposed X-ray film using the Image J program (Schneider, Rasband & Eliceiri, 2012). The immunodetected protein band signals were normalized to total protein signal in each lane. The percent relative intensities of PfDHS-GFP are intensities in GlcN treatment conditions relative to the untreated control.
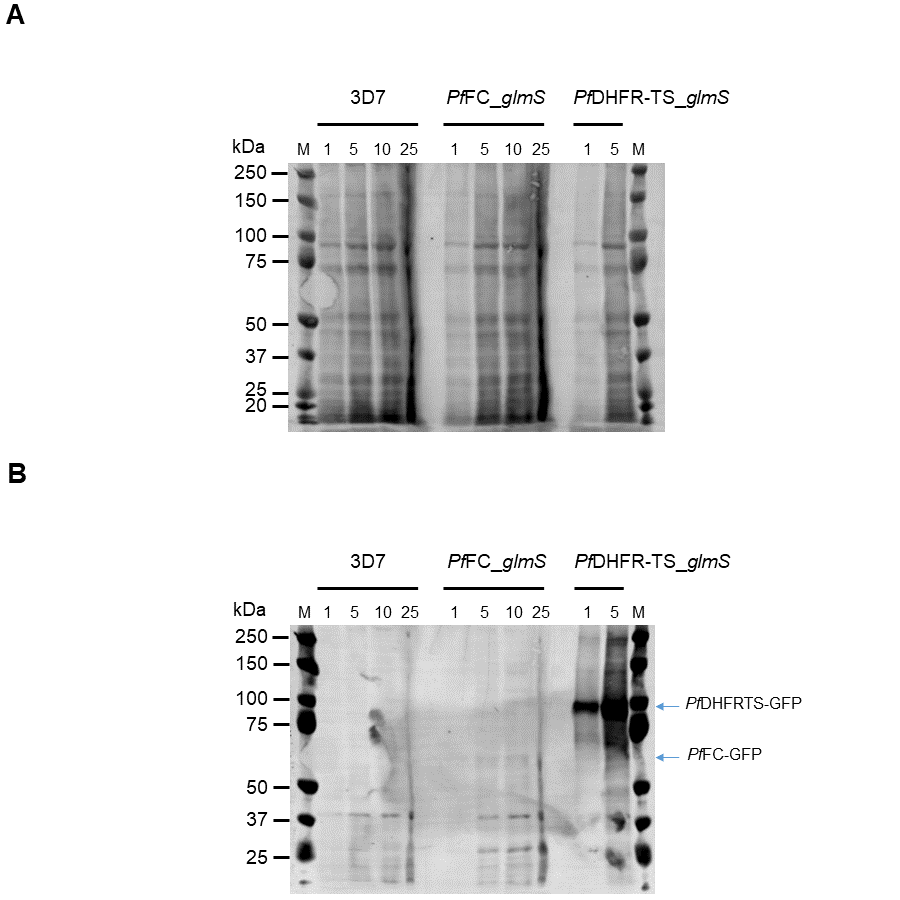
Western immunoblot of PfDHFRTS-GFP and PfFC-GFP protein
PfFC_glmS, PfDHFR-TS_glmS, and 3D7 parasites were cultured and synchronized as described above and harvested at the trophozoite stage. Parasites were liberated from erythrocytes by saponin lysis. Parasites were resuspended in 1× NuPAGE LDS sample buffer in a ratio of parasite cell/buffer volume of 2 × 10⁶ parasites/mL and incubated at 95 °C for 10–15 min for protein extraction. Insoluble material was separated by centrifugation. Protein samples from 1 × 10⁶, 5 × 10⁶, 10 × 106, or 25 × 106 parasites were separated by electrophoresis as described above for PfDHS-GFP Western immunoblot. Precision Plus Protein™ Dual Color Standards (Bio-Rad, Hercules, CA, USA) were used as a protein ladder. Proteins were transferred to Immobilon-FL PVDF membrane (Merck) as described above for PfDHS-GFP Western immunoblot. After transfer, membranes were stained with REVERT™ Total Protein Stain (LI-COR Biosciences, Lincoln, NE, USA). Total protein was visualized using an Odyssey® CLx system (LI-COR) in the 700 nm channel. After imaging, REVERT stain was removed by washing with REVERT Reversal Solution (LI-COR) and water. The membrane was then incubated in Odyssey blocking buffer (TBS) (LI-COR) for 1 h with 80 rpm shaking. The blocked membrane was incubated in Odyssey blocking buffer (TBS) with 0.2% (v/v) Tween 20 and 1:2,000 diluted rabbit anti-GFP polyclonal antibody (#G1544; Sigma) overnight with 80 rpm shaking. The membrane was then washed with 1× TBST (1× TBS with 0.05% Tween 20) and incubated in Odyssey blocking buffer (TBS) with 0.2% Tween 20 and IRDye 800CW 1:20,000 diluted goat anti-rabbit IgG (LI-COR) for 1 h at room temperature in the dark. The membrane was scanned in the 800 nm channel and images were analyzed using Image Studio Software (LI-COR).
Hypusination assay
A total of 10 mL P. falciparum sorbitol-synchronized cultures at approximately 2% hematocrit and 1% ring-stage parasitemia were treated with 0, 2.5, or 5.0 mM GlcN for 72 h. Parasites were harvested and liberated from erythrocytes by saponin lysis. Parasite pellets were resuspended in 1% Triton-X100 in 1× PBS buffer and incubated at 4 °C for 20 min to extract protein. Protein samples from approximately 5 × 10⁶ parasites were separated by electrophoresis as described above for PfDHS-GFP Western immunoblot. Precision Plus Protein Kaleidoscope Prestained Protein Standards (Biorad) were used as a protein ladder. Proteins were transferred to Immobilon-FL PVDF membrane (Merck) and processed before detection with Odyssey CLx as described above. The blocked membrane was incubated in Odyssey blocking buffer (TBS) with 0.2% (v/v) Tween 20 and 1:5,000 diluted rabbit anti-hypusine polyclonal antibody (#ABS1064; Merck) for 1 h with 80 rpm shaking. The membrane was then washed with 1× TBST (1× TBS with 0.05% Tween 20) and incubated in Odyssey blocking buffer (TBS) with 0.2% Tween 20 and IRDye 680RD Goat anti-Rabbit IgG (LI-COR) for 1 h at room temperature in the dark. The membrane was scanned in the 700 nm channel and images were analyzed using Image Studio Software (LI-COR). Total protein loading in each lane was quantified by the sum of pixels minus background in rectangular objects spanning polypeptides 15–150 kDa. The major band of hypusinated protein signal assumed to be PfeIF5A (17.6 kDa) was normalized to the total protein signal in each lane and expressed relative to the control lane (zero mM GlcN treatment).
Nascent protein synthesis (puromycilation) assay
Nascent protein synthesis was assessed using the puromycilation assay (Schmidt et al., 2009). This assay is based on the incorporation of the translation inhibitor puromycin into nascent peptide chains by actively translating ribosomes (Nathans, 1964). A previous report showed that this assay is suitable for P. falciparum (McLean & Jacobs-Lorena, 2017). Synchronized P. falciparum cultures were treated with GlcN for 72 h as described above for hypusination assay. After GlcN treatment, puromycin (Sigma) was added to a final concentration of 5 μM and parasites were incubated at 37 °C for an additional 10 min. The parasitized red blood cells were then washed with incomplete medium and parasites were liberated from erythrocytes by saponin lysis. Protein samples were obtained from approximately 5 × 10⁶ parasites, separated by electrophoresis, transferred to PVDF membrane and processed before detection as described above for hypusination assay. After blocking, the membrane was incubated in Odyssey blocking buffer (TBS) with 0.2% (v/v) Tween 20 and 1:10,000 diluted mouse anti-puromycin monoclonal antibody clone 12D10 (Merck) for 1 h with 80 rpm shaking. The membrane was washed with 1× TBST (1× TBS with 0.05% Tween 20) and incubated in Odyssey blocking buffer (TBS) with 0.2% Tween 20, IRDye 800CW Goat anti-Mouse IgG (LI-COR) for 1 h at room temperature in the dark. The membrane was washed with 1× TBST (1× TBS with 0.05% Tween 20) and 1× TBS buffer before scanning in the 800 nm channel. Total protein and puromycilated peptides in each lane were quantified by the sum of pixels minus background in rectangular objects spanning polypeptides 15–150 kDa. The puromycilated peptide signal was normalized to the total protein signal in each lane and expressed relative to the control lane (zero mM GlcN treatment). The puromycilation assay was validated using P. falciparum synchronized cultures at mostly trophozoite stage. Parasites were pre-treated with growth-inhibitory compounds cycloheximide (1, 10, or 100 µM); dihydroartemisinin (0.01, 0.10, or 1 µM), and GC7 (50, 100, or 1,000 µM) for 1 h prior to puromycin exposure.
Competitive growth assay
P. falciparum transgenic parasite line PfFC_glmS was used as a control. The growth of a test transgenic line with riboswitch element integrated at a putative essential gene was normalized to that of the PfFC_glmS control. The control and test transgenic lines were first cultured separately and synchronized as described above. Ring-stage synchronized parasites were diluted to approximately 0.5% parasitemia. A new culture was established by combining control and test transgenic parasite cultures (5 mL of each) into the same culture plate. Samples were taken from the parasite co-culture every 4 days for 21 days (10 growth cycles). At each sampled time-point, the culture reached a parasitemia of approximately 2.5%, consisting of mostly trophozoite stage parasites. The culture was then diluted to approximately 0.1% parasitemia in fresh medium. The parasite culture plates were placed in a refrigerator on “ring” days for 5–7 h to maintain high synchronization (Yuan et al., 2014). Parasite pellets were harvested and used for genomic DNA extraction. The co-culture was conducted under standard and gene attenuation (2.5 or 5.0 mM GlcN inducer added) conditions, in which fresh GlcN was added after each time-point. The effect of GlcN on development of control parasites 3D7 and PfFC_glmS was assessed by counting ring and trophozoite stage parasites separately from Giemsa-stained thin smears.
Quantitative PCR assay of transgenic parasite ratios in competitive growth experiments
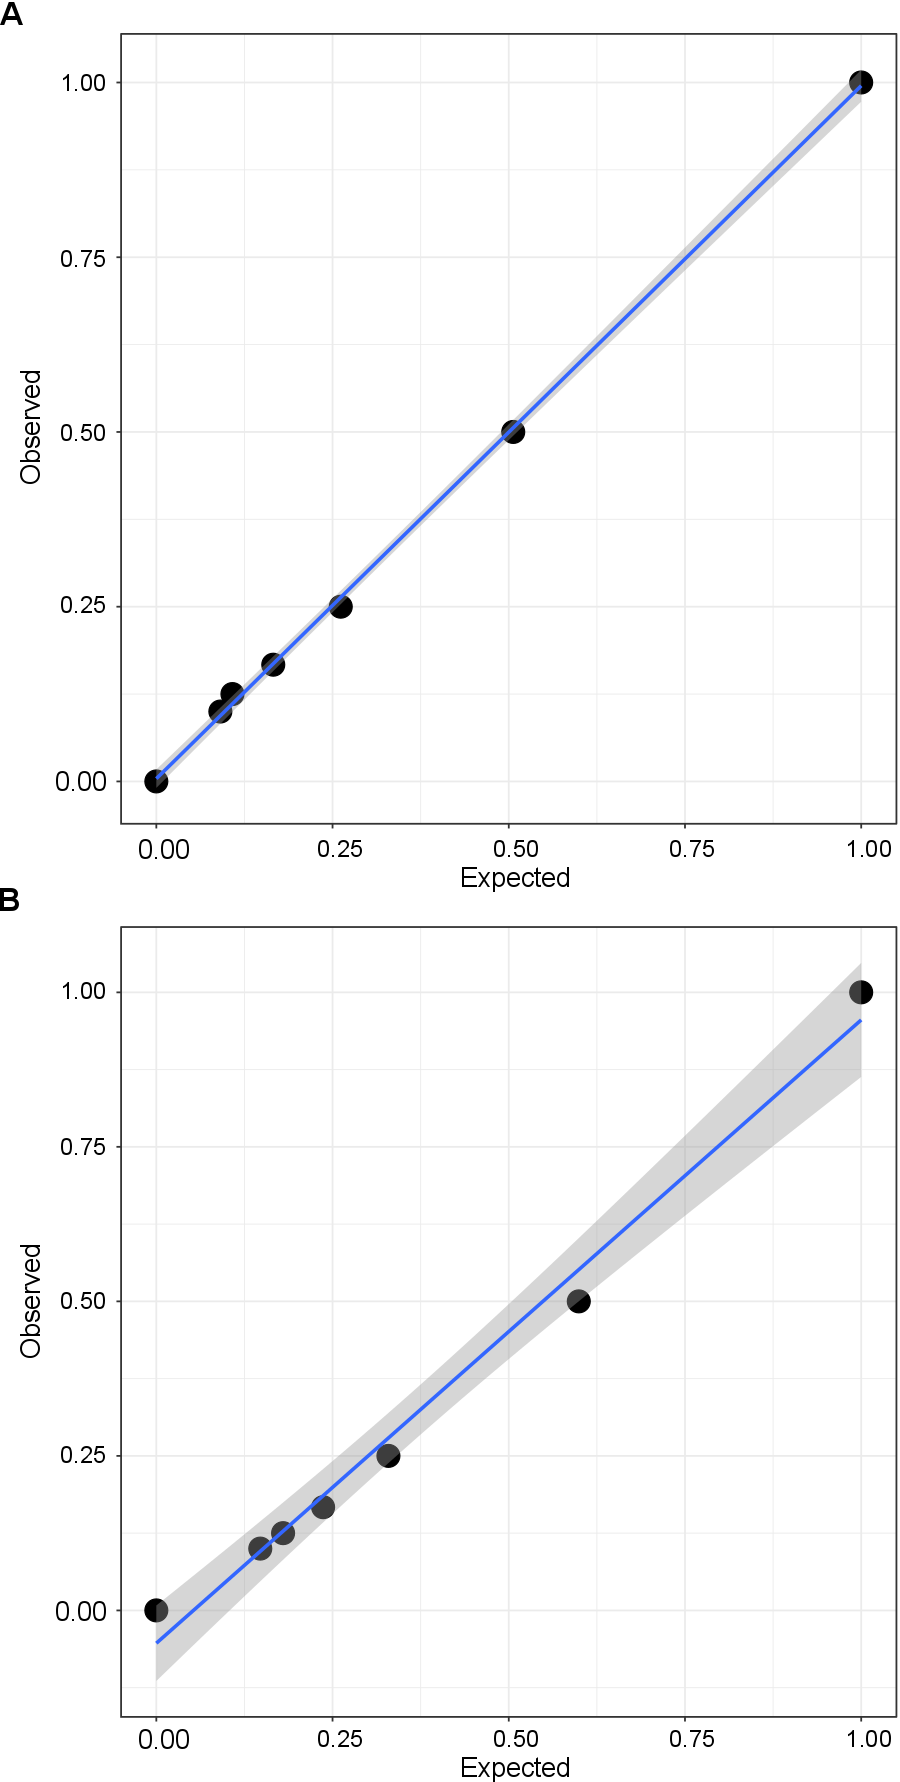
Primers for quantitative PCR (qPCR) assays were designed to amplify specific discriminatory sequences in transgenic parasites tested in competitive growth assays. The discriminatory sequences spanned the fusion boundary between the 3′ end of the modified target gene and the GFP coding region. The LDH-F and LDH-R primers (Table S1; amplicon 221 bp) were also designed to amplify the PF3D7_1324900 (L-lactate dehydrogenase) gene, which is present at single copy in all parasites and is used for normalization of template DNA input. qPCR experiments were performed using a CFX96 Touch Real-Time PCR Detection System (Biorad) and SsoFast EvaGreen Supermix (Biorad) in 20 μL reaction volumes, as recommended by the manufacturer. All primer pairs performed with similar efficiency (96–103%, linear regression R2 > 0.99). Amplicons of the expected size were obtained only from the expected template genomic DNA, as assessed by agarose gel electrophoresis and melt-curve analysis. The PfDHS_glmS and PfDHS_M9 parasites were quantified from the DHS-GFP amplicon (188 bp, primers DHS-F and DHS-R; Table S1), the PfDHFR-TS-glmS parasite (Prommana et al., 2013) was quantified from the TS-GFP amplicon (190 bp, primers DHFRTS-F and DHFRTS-R; Table S1), and the PfFC-glmS parasite was quantified by the FC-GFP amplicon (125 bp, primers FC-F and FC-R; Table S1). The quantitative range of qPCR assays was determined using purified genomic DNA extracted from transgenic parasites that were mixed in different ratios (Fig. S3).
Dose-response growth inhibition assays
The growth of parasites was monitored under different concentrations of growth inhibitors in dose-response assays as described previously (Aroonsri et al., 2016). To assess the effect of GlcN on growth inhibition, parasites were co-treated with 2.5 mM GlcN. The growth inhibitory compounds tested included N1-guanyl-1,7-diaminoheptane (GC7; Sigma), cycloheximide (CYC; Sigma), and pyrimethamine (PYR; Sigma). Stock solutions of growth inhibitors were prepared fresh for each experiment, in which compounds were dissolved in DMSO (CYC and PYR) or culture medium (GC7). Compounds were diluted in culture medium, in which the maximum concentration of DMSO did not exceed 0.1%. Control wells with no growth inhibitory compound contained 0.1% DMSO.
Statistical analysis
All statistical analysis was performed using R 3.4.3 (R Core Team, 2017). For analysis of Western immunoblot, hypusination, and puromycilation assay data, Welch’s two-tailed one-sample t-tests (Welch, 1947) were performed by testing the null hypothesis that sample means of test signal normalized to untreated control was not different from one. Tests with P < 0.05 were considered significant.
The lme4 package (Bates et al., 2015) was used to perform a linear mixed effects analysis of the relationship between parasite growth and time in competitive growth assays. For validation experiments with 3D7 parental and PfFC-glmS control transgenic lines, the percentage of ring or trophozoite-infected cells was taken as the growth variable. In experiments with PfDHFR-TS-glmS, PfDHS_glmS, and PfDHS_M9 transgenic parasites, growth relative to the PfFC-glmS control transgenic parasite determined by qPCR was taken as the growth variable. GlcN treatment (with doses as factors) was modeled as a fixed effect. Individual parasite cultures grown on different days were modeled as random effects, with random intercepts included in the model for the effect on growth over time. Linear models were constructed from the data using maximum likelihood. The null model was that growth varies as a function of time. The full model was that growth varies as a function of time, with GlcN treatment and its interaction with time as fixed effects. Significant differences in model fitting were assessed by likelihood ratio test, with P < 0.05 considered significant. Fitted models were plotted using the visreg package (Breheny & Burchett, 2017).
Normalized growth values from dose-response assays were analysed using the drc package (Ritz & Streibig, 2005). To allow proper comparison of EC50 values between the −GlcN and +GlcN conditions, the maximum and minimum growth values were assigned as shared and constant between the two conditions, such that only two parameters (slope and EC50) varied between the −GlcN and +GlcN conditions. EC50 ratios, associated S.Es and t-statistics were calculated from the two-variable parameter fitted models using the EDcomp function in the drc package. EC50 ratios were considered significant at P < 0.001.
In silico modeling of PfDHS protein structure and GC7 binding
A three-dimensional structure of the PfDHS tetramer was constructed by the SWISS-MODEL Server (Waterhouse et al., 2018). The program selected the X-ray crystal structure of Form I human DHS complexed with NAD as the homology template (Umland et al., 2004); PDB ID: 1RLZ. Ligand binding site identification and characterization was performed using SiteMap version 3.6, Schrödinger, LLC, New York (Halgren, 2009). The grid type was set as coarse and other settings were default. The putative ball-and-chain motif encompassing residues Ile30–Pro45 of each PfDHS subunit was removed prior to ligand binding site analysis. Ligand binding sites with scores greater than 1.0 were considered significant. Molecular docking of GC7 at the substrate-binding pocket was performed using Glide (Friesner et al., 2004). A grid receptor was generated around the binding pocket with addition of void volume around NAD cofactor. The structure of Form II human DHS complexed with NAD and GC7 (Umland et al., 2004); PDB ID: 1RQD was used for comparison of PfDHS and human DHS substrate binding pockets.
Results
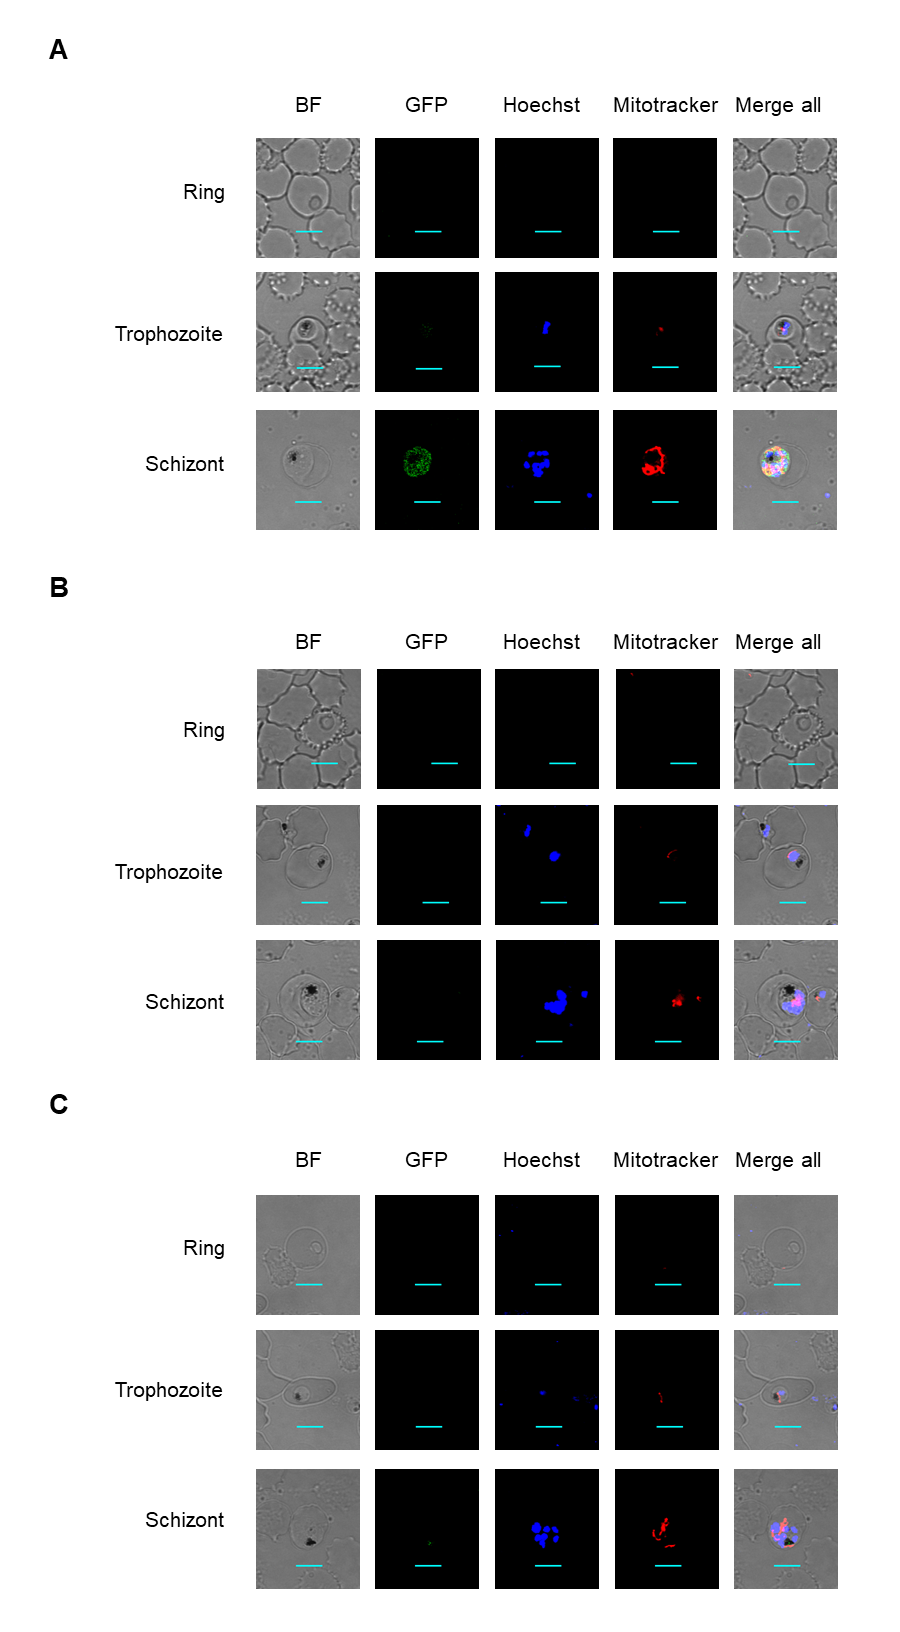
Clonal transgenic P. falciparum parasite lines PfDHS_glmS and PfDHS_M9 were established with integration of glmS riboswitch and the M9 inactive variant, respectively, at the PfDHS encoding gene PF3D7_1412600. The DNA vectors used for integration also contain GFP gene sequence for C-terminal tagging of the target protein. Fluorescent parasites with GFP signal in the parasite cytoplasm were observed in ring, trophozoite, and schizont stages for the PfDHS_glmS parasite (Fig. 1). Western immunoblotting with anti-GFP antibody revealed a species that migrated slightly larger than predicted for PfDHS-GFP fusion protein (85.1 kDa) from PfDHS_glmS and PfDHS_M9 parasites (Fig. 2). PfDHS-GFP protein was significantly attenuated in the PfDHS_glmS parasite treated for 24 h with GlcN, with up to fivefold reduction observed with 5.0 mM GlcN. In contrast, no significant reduction of PfDHS-GFP protein was observed with GlcN treatment in the PfDHS_M9 parasite with an inactive riboswitch.
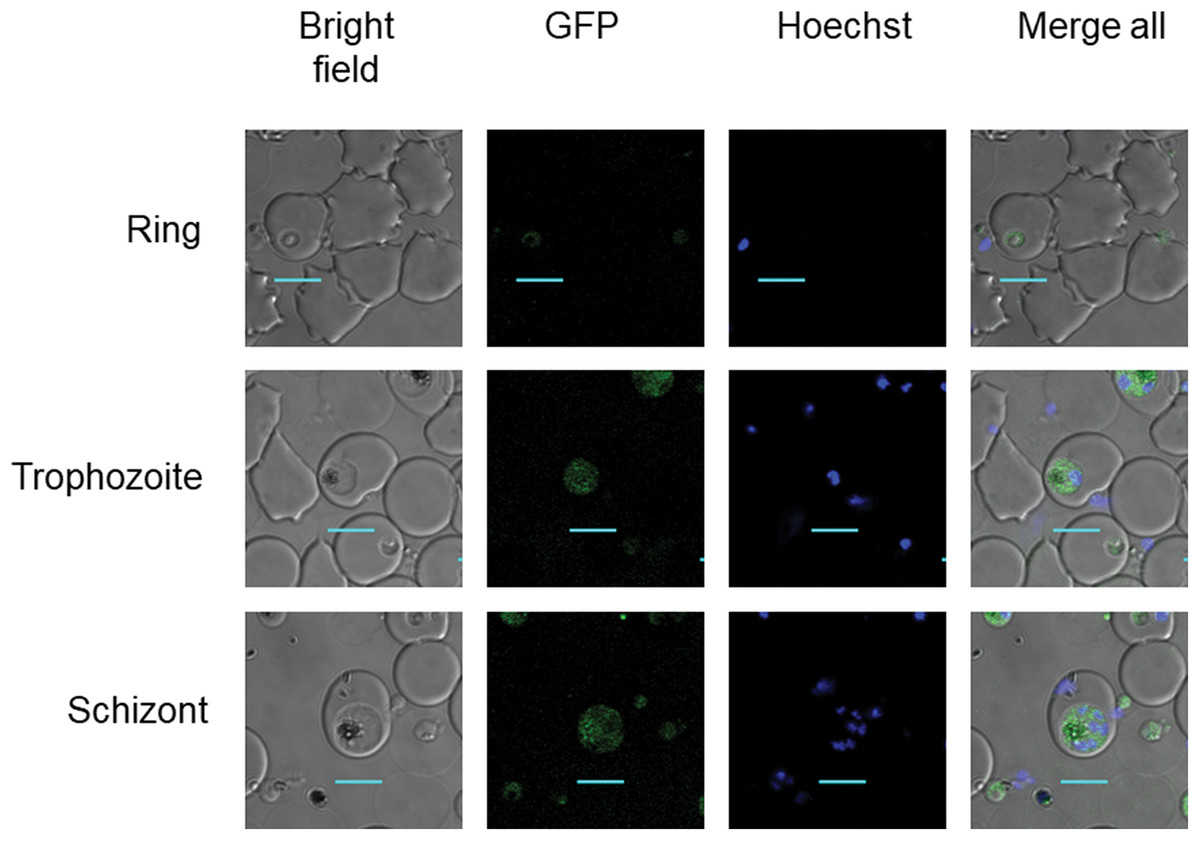
Figure 1: PfDHS protein localization in transgenic parasites.
Representative confocal microscopic images of PfDHS_glmS parasites expressing GFP-tagged PfDHS protein at ring, trophozoite, and schizont stages. Parasite nuclei were stained with Hoechst 33342. Composite images from merging Hoechst and GFP fluorescence signals with the Bright-field image are shown in the panels on the far-right. Scale bars = 5 µm.
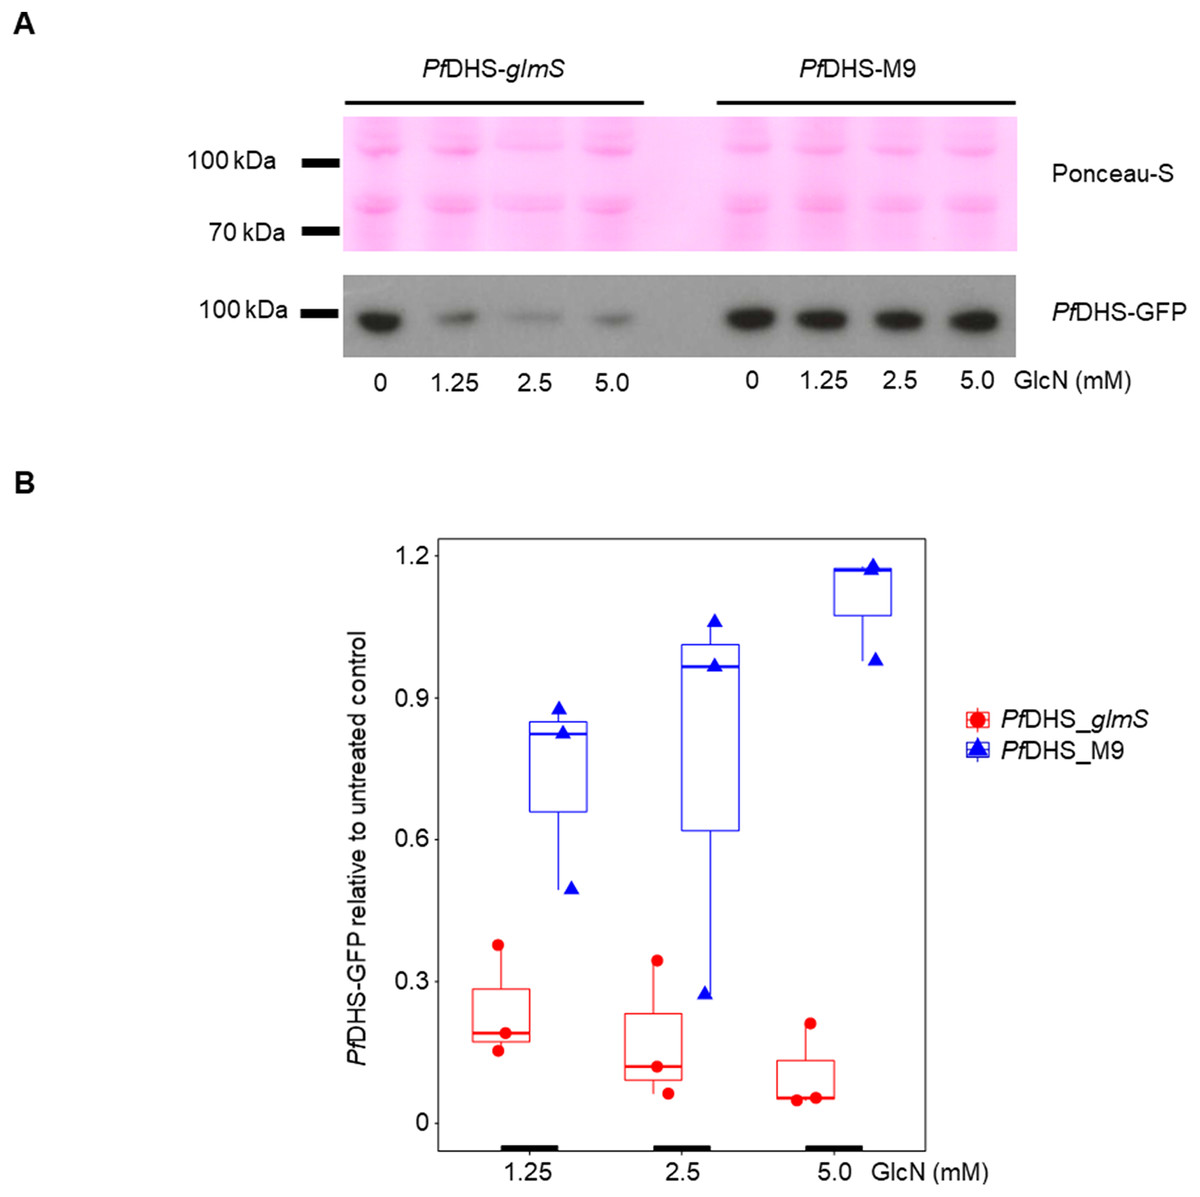
Figure 2: Attenuation of PfDHS expression in transgenic parasites.
(A) Representative Western immunoblot results from detection of GFP-tagged PfDHS protein (PfDHS-GFP) in PfDHS_glmS and PfDHS_M9 transgenic parasites. Soluble protein extracts were obtained from approximately 10 × 106 parasites treated for 24 h with 0, 1.25, 2.50, and 5.00 mM glucosamine (GlcN). Proteins were separated in 4–12% NuPAGE gel and transferred to PVDF membrane. Total protein was stained on the membrane using Ponceau-S (top panel) and PfDHS-GFP protein was detected using anti-GFP antibody (bottom panel). The migrations of PageRuler Plus Prestained Protein ladder (Thermo Scientific, Waltham, MA, USA) standards are indicated on the left. The images are cropped for clarity. Full-length, uncropped blot images are shown in Fig. S4. (B) Quantified Western immunoblot results. The signal intensity of the PfDHS-GFP protein band was normalized to the total protein and the PfDHS-GFP protein signal intensity in the sample lane from untreated parasites. The data from three independent experiments are shown for each parasite line. P-values from one-sample t-tests: 0.0082 (PfDHS_glmS, 1.25 mM GlcN); 0.011 (PfDHS_glmS, 2.5 mM GlcN); 0.0035 (PfDHS_glmS, 5.0 mM GlcN); 0.15 (PfDHS_M9, 1.25 mM GlcN); 0.45 (PfDHS_M9, 2.5 mM GlcN), and 0.24 (PfDHS_M9, 5.0 mM GlcN).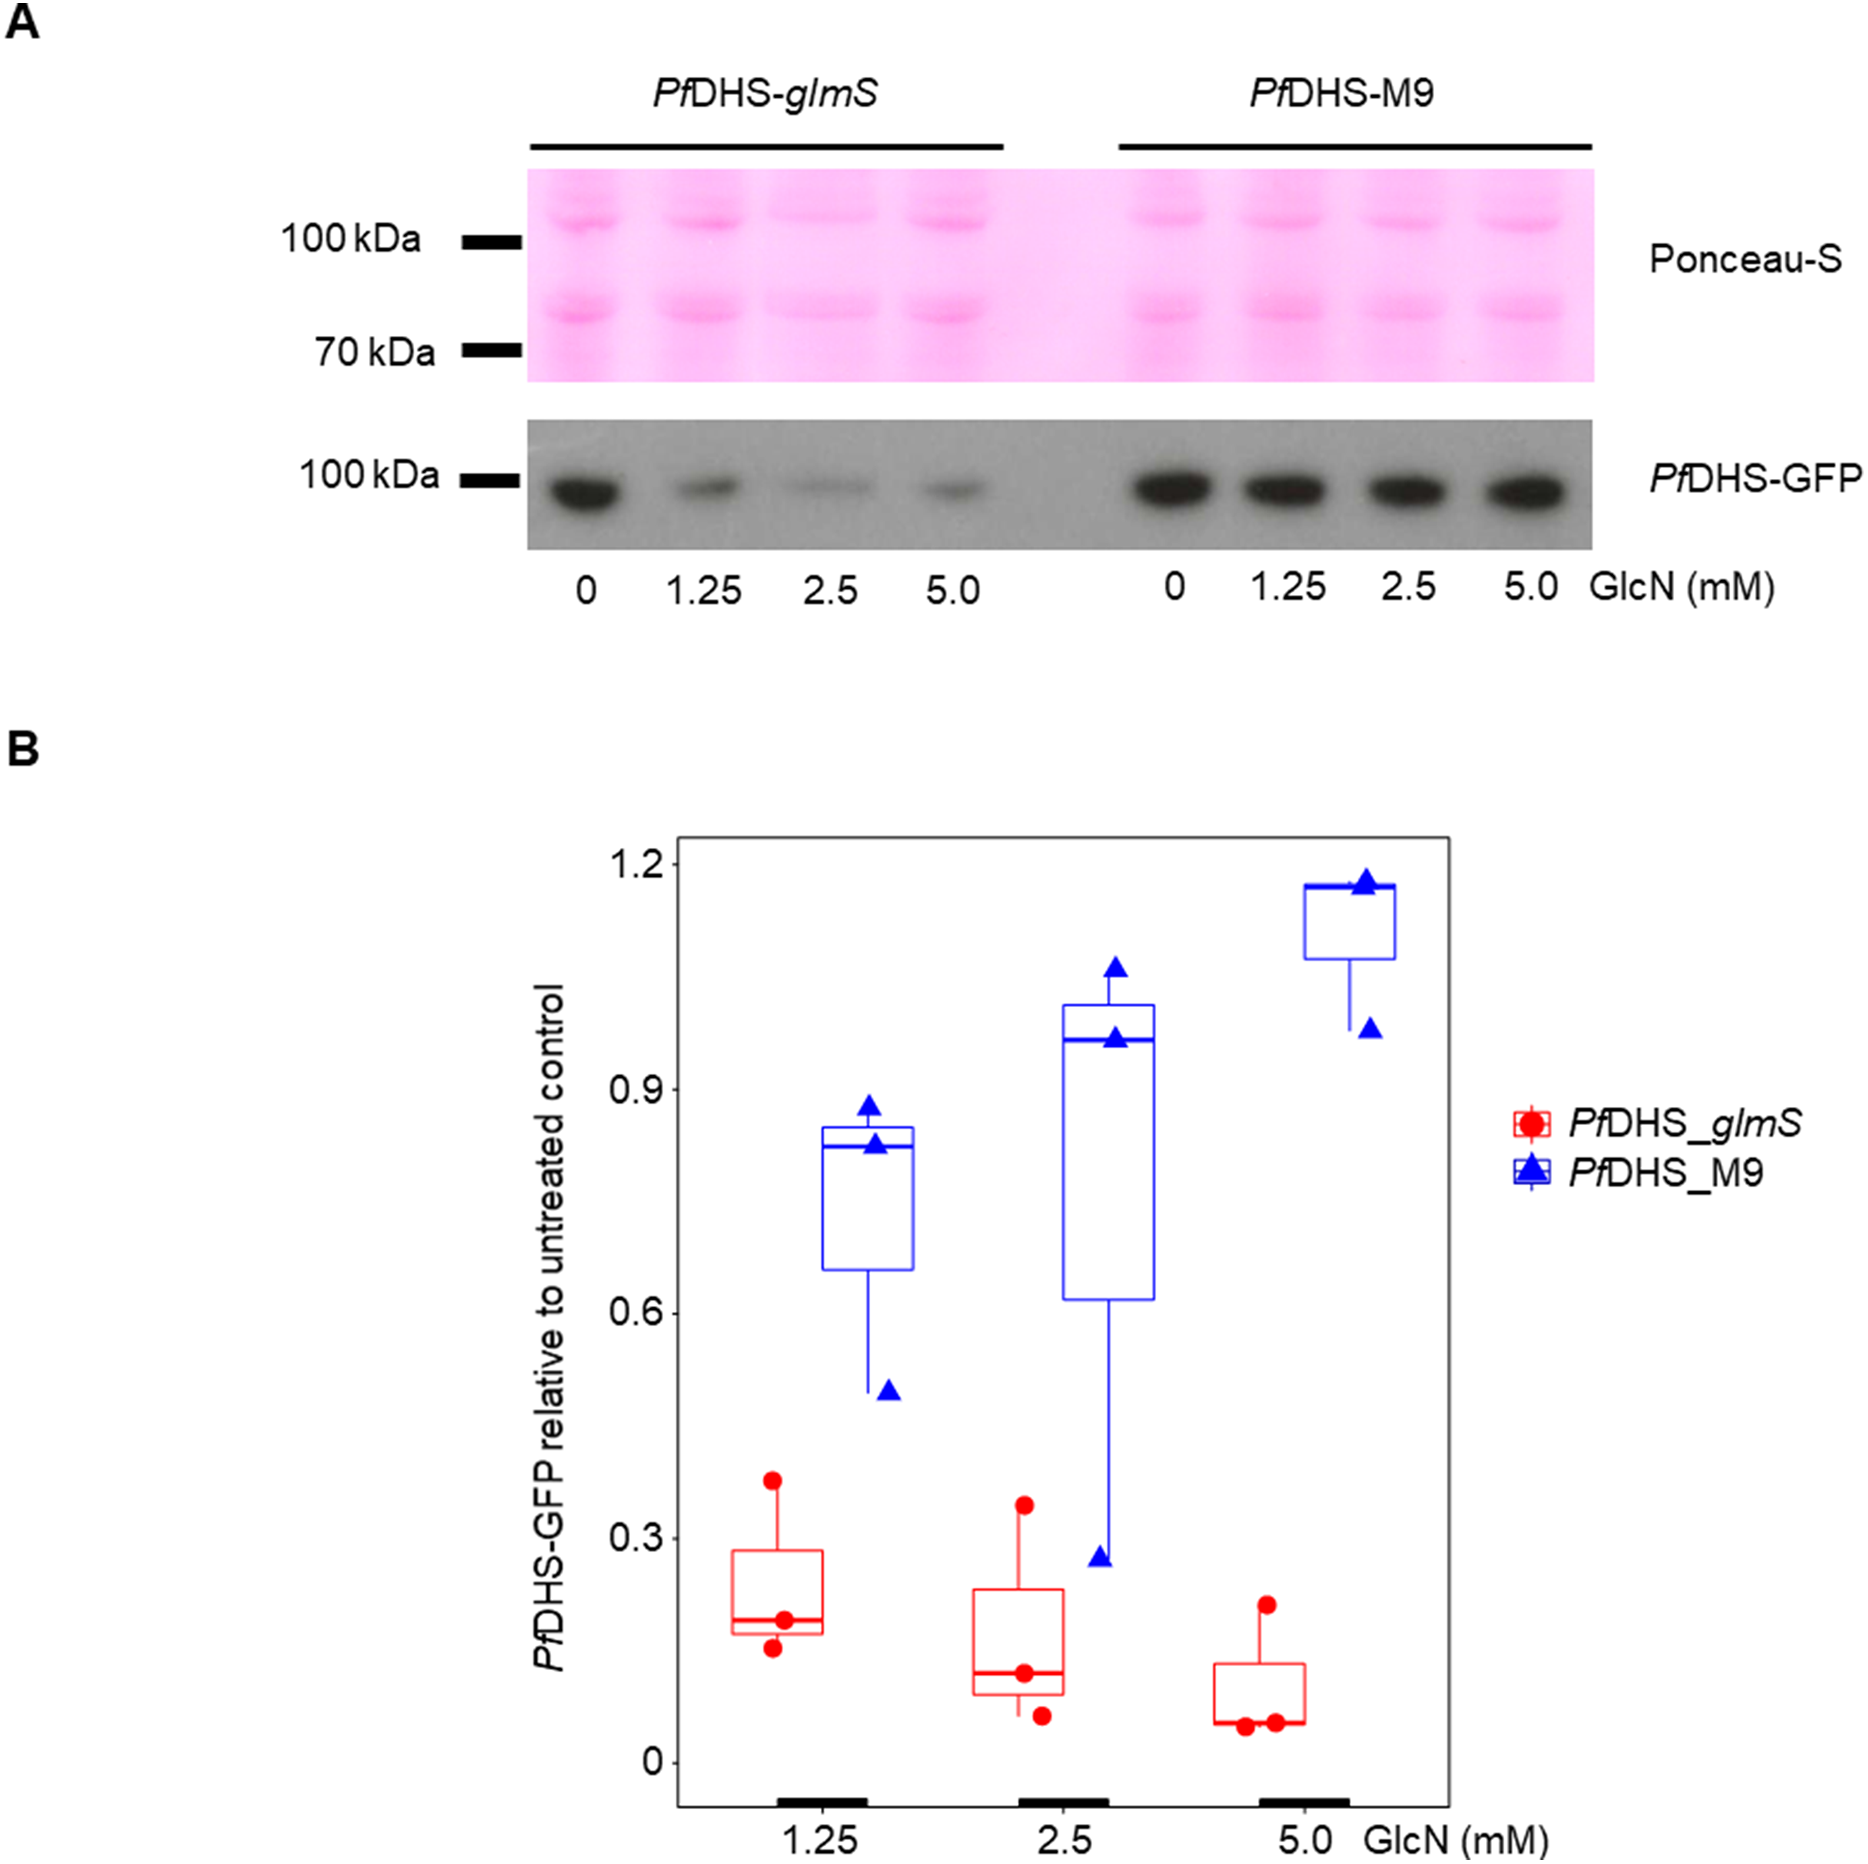
Since the primary function of DHS enzyme in eukaryotes is hypusination of eIF5A protein, hypusination was quantified using a commercial anti-hypusine antibody in transgenic parasites. A major protein species (<20 kDa) was detected by Western immunoblotting with this antibody which matches the predicted molecular weight of P. falciparum eIF5A (17.6 kDa) and is the approximately the same size as PfeIF5A detected with anti-eIF5A antibodies (Foth et al., 2008). However, additional evidence, for example, peptide mapping is needed to confirm that this species is PfeIF5A. GlcN treatment led to significantly reduced hypusinated protein signal in PfDHS_glmS parasites treated with GlcN compared with untreated controls, although this effect was rather small with <30% mean reduction at 5.0 mM GlcN (Fig. 3). In contrast, GlcN treatment had no significant effect on hypusination in PfDHS_M9 parasites. We infer from this result that reduction of PfDHS expression leads to concomitant reduction of hypusinated protein. Hypusination is thought to be essential for the translation elongation function of this protein (Park et al., 2010). We tested whether reduced hypusination could affect protein synthesis by nascent protein synthesis (puromycilation) assay in PfDHS_glmS and PfDHS_M9 parasites. Nascent protein was quantified by the incorporation of puromycin into elongating peptide chains, detected as the signal from Western immunoblotting with anti-puromycin antibody. Short pre-treatments of parasites with lethal (>EC50) concentrations of CYC and DHA known to cause arrest of protein synthesis in P. falciparum (Hoepfner et al., 2012; Rottmann et al., 2010; Shaw et al., 2015; McLean & Jacobs-Lorena, 2017) led to markedly reduced puromycilation signal in both transgenic parasites, validating the assay (Fig. S5). Puromycilation signal was not significantly different in either parasite treated with GlcN for 72 h prior to puromycin labeling compared with parasites with no GlcN pre-treatment, suggesting that attenuation of PfDHS expression has little effect on the global translation level during this period (Fig. 3). Moreover, GlcN-treated parasites do not show any gross morphological defect (Fig. S6) and proliferation over 72 h is unaffected by GlcN (Fig. S7). These data suggest that the slight reduction of hypusination in parasites with attenuated PfDHS function is tolerated for short periods.

Figure 3: Hypusination and nascent protein synthesis assays.
Ring-synchronized PfDHS_glmS and PfDHS_M9 transgenic parasites were treated with 0, 2.5, or 5.0 mM glucosamine (GlcN) for 72 h. For assays of nascent protein synthesis, parasites were subsequently treated with 5 µM puromycin for 10 min prior to harvesting of parasites. Protein was extracted from parasites and separated in 4–12% NuPAGE gel. Representative data are shown in parts (A–C). The images in parts (A) and (B) are cropped for clarity. Full-length, uncropped blot images are shown in Fig. S5. (A) Total protein stained with REVERT. (B) Hypusination assay results. A band corresponding to Plasmodium falciparum eIF5A (17.6 kDa) was detected with anti-hypusine polyclonal antibody. (C) Nascent protein synthesis assay. Puromycilated, nascent peptides were detected with anti-puromycin monoclonal antibody. (D) Quantified hypusination assay results from eight independent experiments. P-values from one-sample t-tests: 7.0e-4 (PfDHS_glmS, 2.5 mM GlcN); 0.0020 (PfDHS_glmS, 5.0 mM GlcN); 0.25 (PfDHS_M9, 2.5 mM GlcN), and 0.25 (PfDHS_M9, 5.0 mM GlcN). (E) Quantified puromycilation assay results from seven (PfDHS_glmS) and eight (PfDHS_M9) independent experiments. P-values from one-sample t-tests: 0.13 (PfDHS_glmS, 2.5 mM GlcN); 0.10 (PfDHS_glmS, 5.0 mM GlcN); 0.58 (PfDHS_M9, 2.5 mM GlcN), and 0.42 (PfDHS_M9, 5.0 mM GlcN).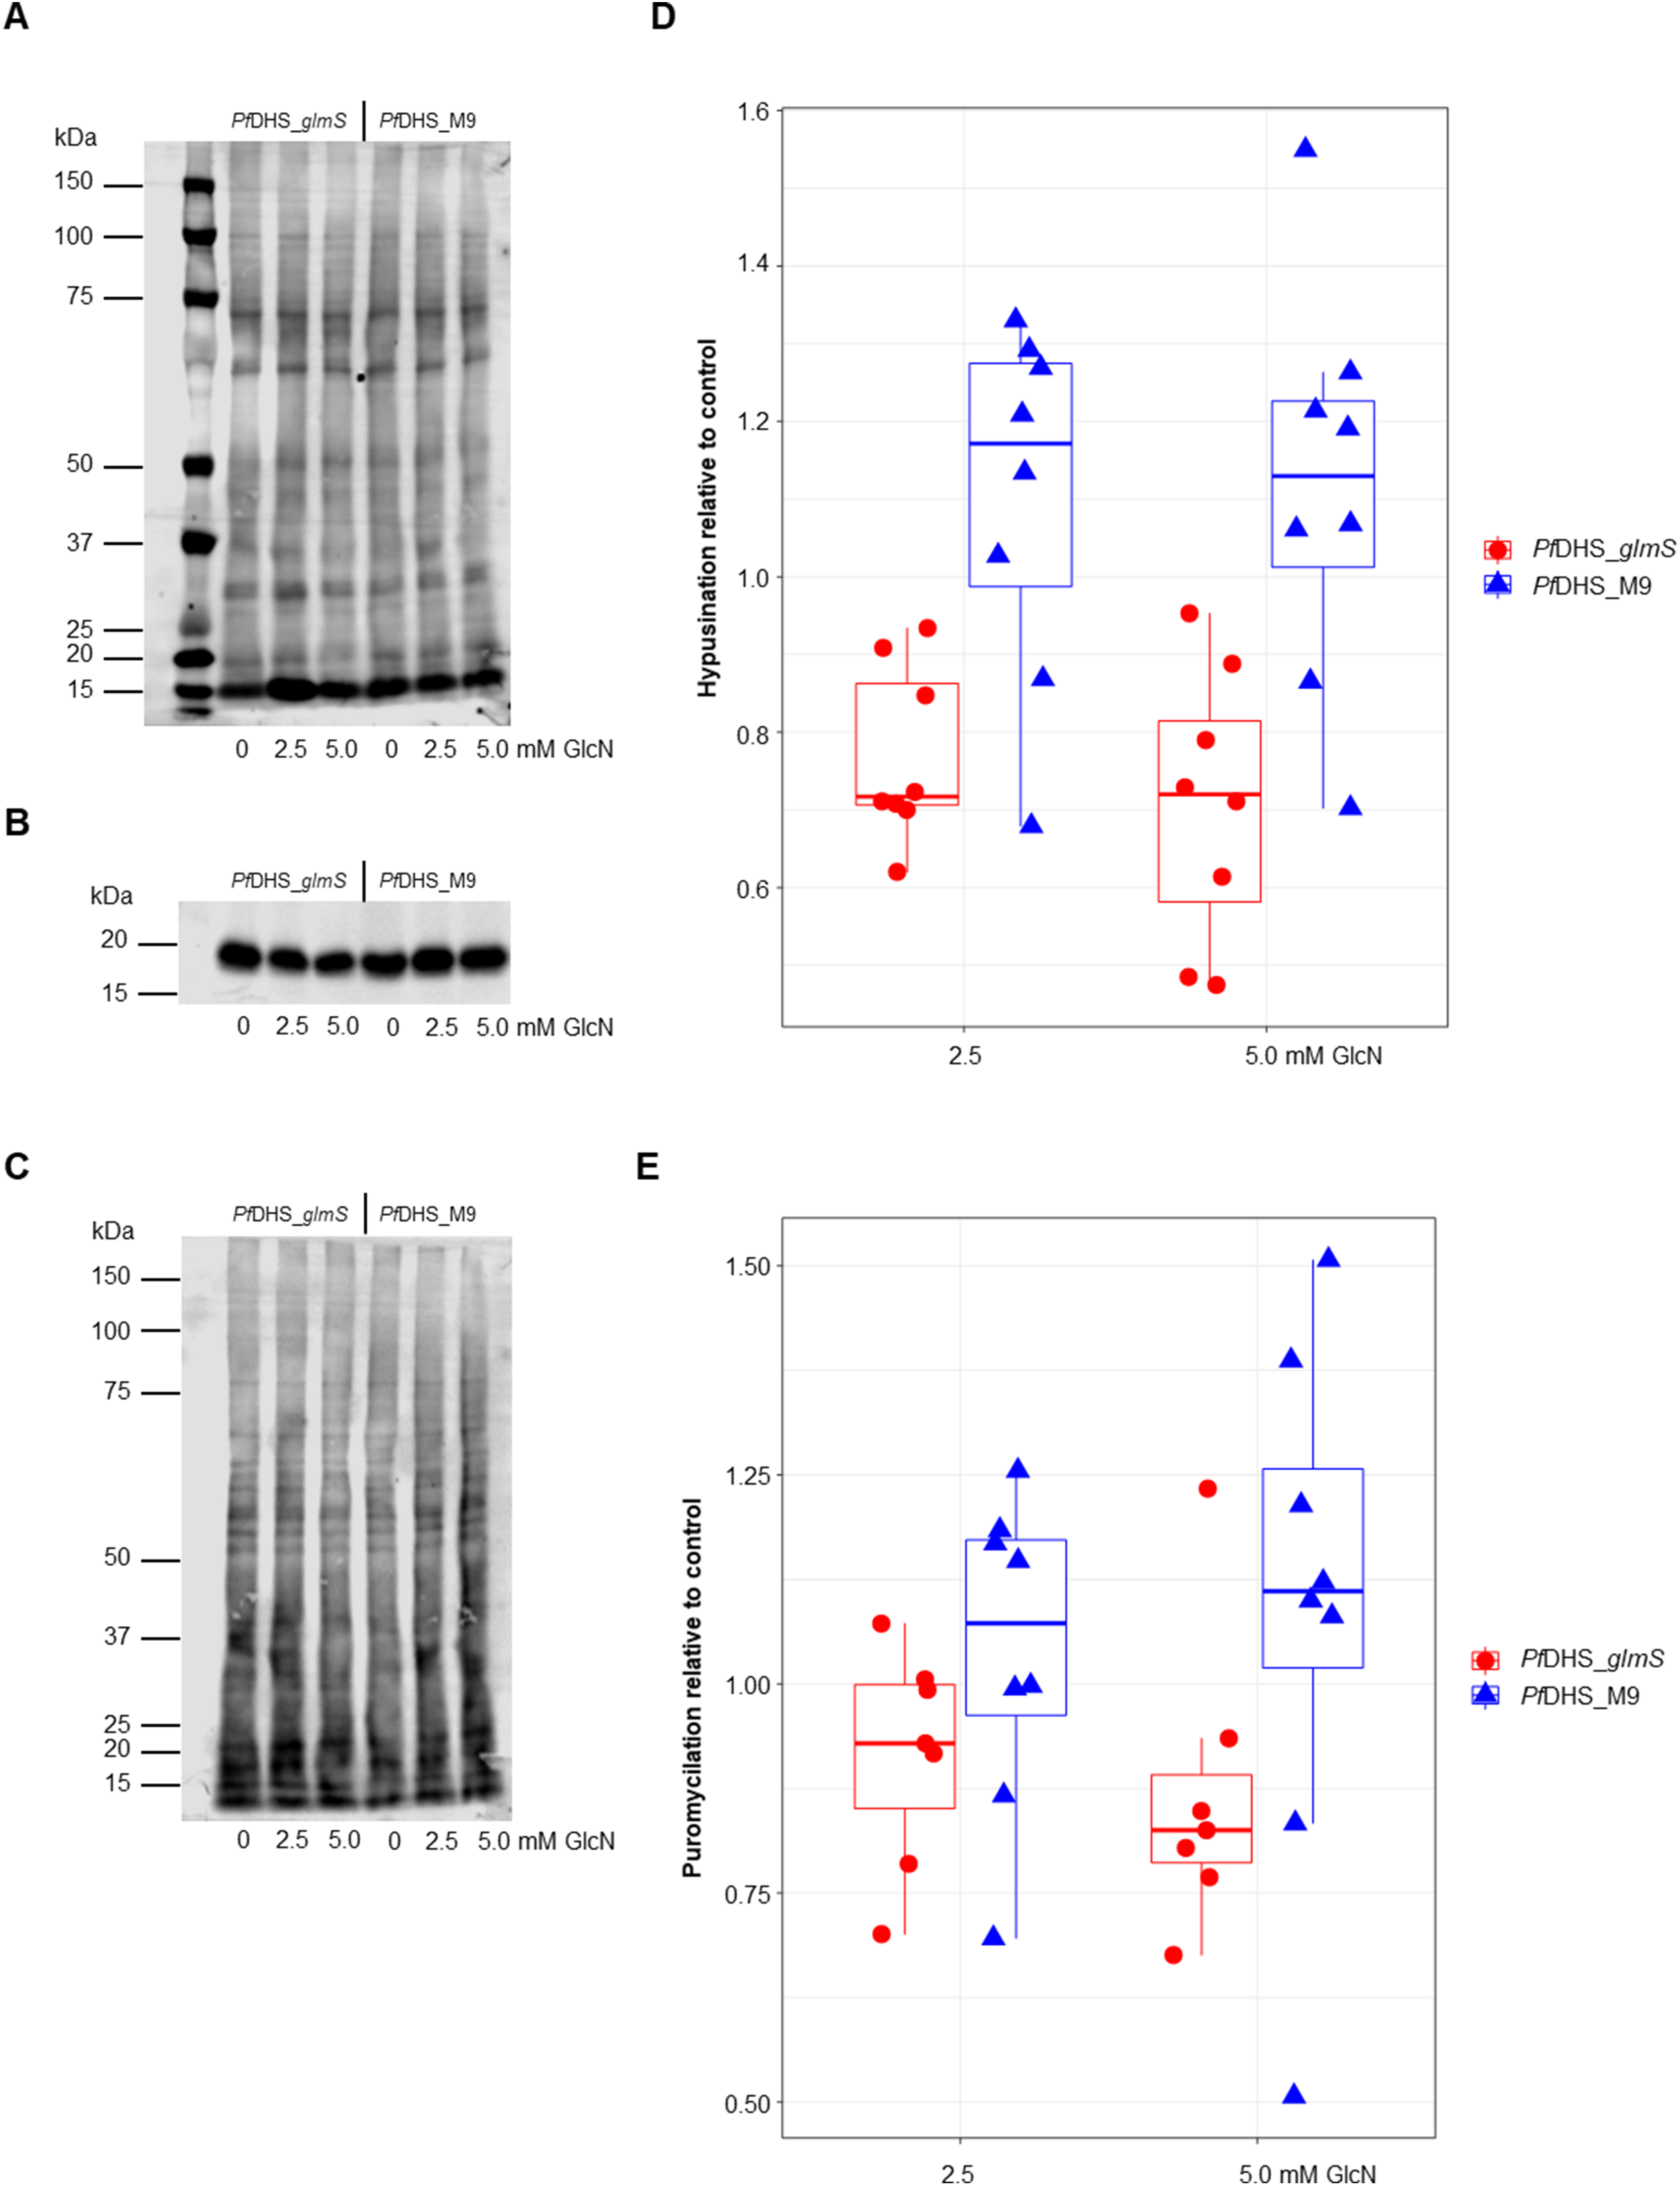
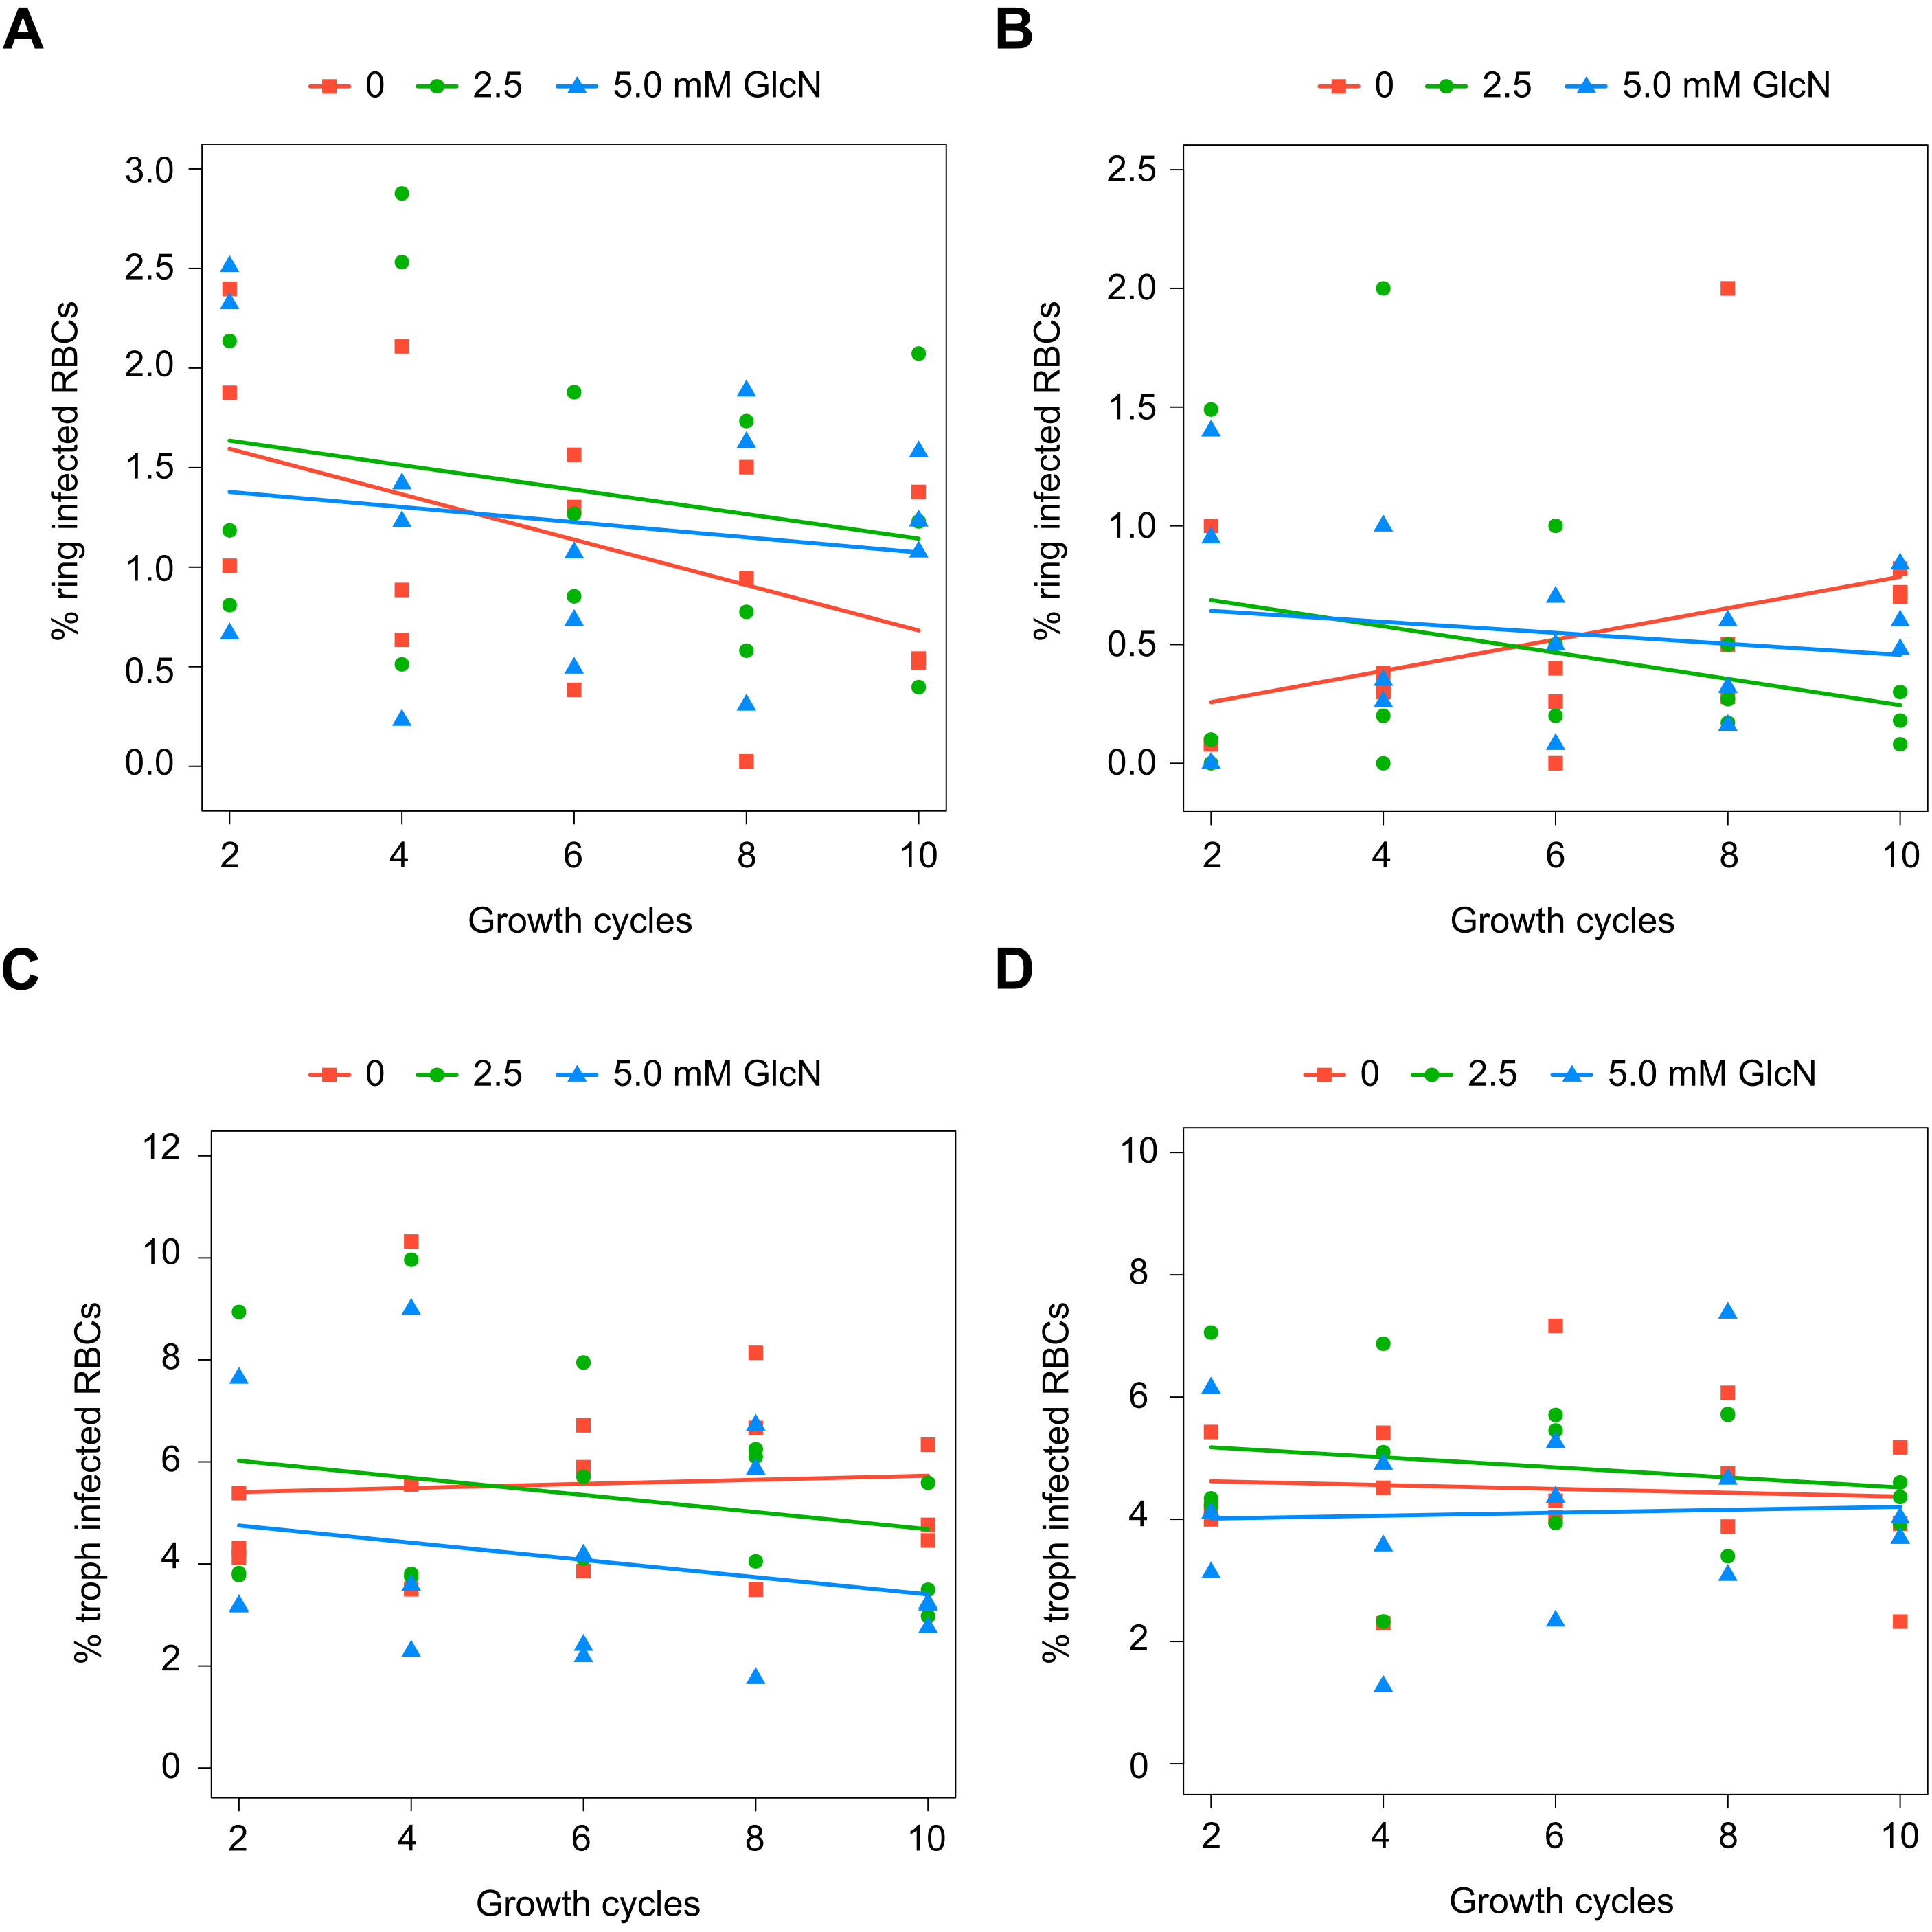
Although attenuation of PfDHS gene expression is not deleterious in the short term, prolonged loss of PfDHS activity could lead to a growth defect. In the standard growth assay, parasite cultures are initiated at low parasite density, for example, 0.1% parasitemia, and growth assessed over the first two cycles (up to 96 h). For some essential genes, glmS riboswitch-mediated attenuation of expression can cause a significant growth defect under these conditions, for example, PfDHFR-TS (Prommana et al., 2013), PfPTEX150 (Elsworth et al., 2014), PfRhopH2 (Counihan et al., 2017; Ito, Schureck & Desai, 2017) and PfRhopH3 (Ito, Schureck & Desai, 2017). However, glmS riboswitch- mediated attenuation of other essential genes such as PfPMV (Sleebs et al., 2014) and PfFP3 (Xie et al., 2016) failed to show a growth defect in the standard growth assay. The inability to detect growth defects in the standard growth assay is due to factors such as insufficient attenuation, functional overlap/redundancy with related proteins and stage-specific target protein function. For growth assays longer than two cycles, dilution of cells is necessary to prevent overgrowth of controls. Transgenic parasites obtained by single cross-over recombination must be maintained under a drug selective regimen, for example, blasticidin, otherwise they can be outgrown by wild-type revertants. To account for possible growth confounding effect of the transgenic selective regimen, a control transgenic parasite (PfFC_glmS) was created with integration of the glmS riboswitch at the ferrochelatase (PfFC) gene. The PfFC gene is dispensable during intra-erythrocytic stages, since the growth of clonal transgenic parasites with knockout of this gene is not significantly different from wild-type (Ke et al., 2014; Sigala et al., 2015). We could not assess localization or riboswitch-mediated attenuation of PfFC-GFP protein in the PfFC_glmS parasite, since no green fluorescent PfFC_glmS parasites were observed by microscopy (Fig. S8), and the weak signal of putative PfFC-GFP protein was difficult to distinguish from background in Western immunoblotting experiments (Fig. S9). We validated the PfFC_glmS parasite as a control in growth experiments by assessing its growth in comparison with 3D7 wild-type parasite under different GlcN treatments. Over the course of 10 growth cycles, treatment with 2.5 or 5.0 mM GlcN has no significant effect on ring or trophozoite development for both 3D7 and PfFC_glmS parasites (Fig. S10).
We established a competitive growth assay in which transgenic parasites are cultured for 10 growth cycles. The extended growth period in this assay allows for detection of latent defects that are apparent only after several growth cycles have elapsed. In this assay, a test transgenic parasite is co-cultured with the control PfFC_glmS transgenic parasite. The growth of test transgenic parasite was assessed by measuring the test:control transgenic parasite ratio by qPCR. The use of the control PfFC_glmS parasite allowed us to monitor growth without correction of dilution factors. Relative growth of the PfDHS_glmS parasite was significantly reduced under GlcN treatment (Fig. 4A). In contrast, GlcN had no significant effect on the relative growth of the PfDHS_M9 parasite (Fig 4B). Competitive growth assay of the PfDHFR-TS_glmS parasite revealed a more severe growth defect when treated with GlcN in which PfDHFR-TS_glmS parasites declined more rapidly (Fig. 4C). The results from competitive growth assays showed that attenuation of PfDHS expression causes a growth defect, indicating that this gene is likely to be essential. As a further test of this gene’s essentiality and validation as an antimalarial target, chemogenomic profiling using antimalarial compounds was performed. In this approach, glmS riboswitch-mediated attenuation of target gene expression sensitizes the parasite to antimalarials acting on that target (Aroonsri et al., 2016). Chemogenomic profiling of transgenic parasites was performed with growth-inhibitory compounds differing in their mode of action (Fig. 4D). The PfDHS_glmS parasite is significantly more sensitive to GC7, a known inhibitor of PfDHS enzyme activity in vitro (Kaiser et al., 2007), when co-treated with GlcN. We noted though that the log2 EC50 (–GlcN/+GlcN) ratio is less than one for the PfDHS_glmS parasite. In contrast, the PfDHS_M9 parasite is not significantly more sensitive to GC7 when co-treated with GlcN. GlcN co-treatment does not significantly increase the sensitivity of either parasite to control drugs which do not target the PfDHS, including CYC, a known inhibitor of the ribosome (Obrig et al., 1971; Schneider-Poetsch et al., 2010), and PYR, which targets PfDHFR-TS (Aroonsri et al., 2016).
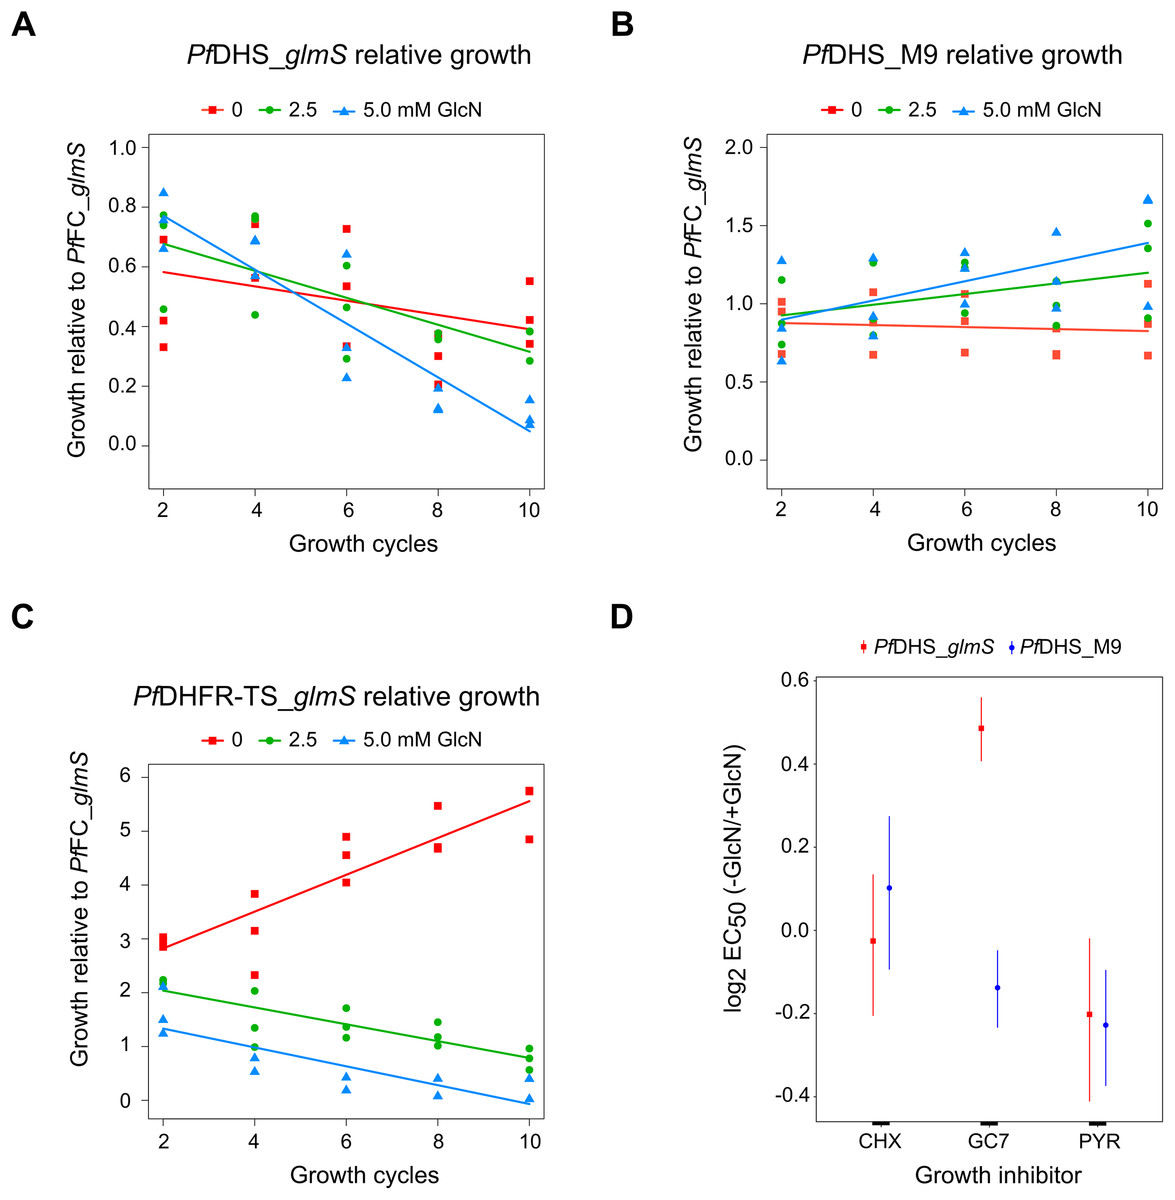
Figure 4: Growth phenotypes of transgenic parasites.
Effects of glucosamine (GlcN) on the growth of transgenic parasites in co-culture experiments are shown in parts (A–C). Test transgenic parasites PfDHS_glmS (A), PfDHS_M9 (B) and PfDHFR-TS_glmS (C) were combined with control PfFC_glmS parasites in a 1:1 ratio and co-cultured. Samples were taken from the culture every two growth cycles until the tenth cycle. The ratio of test:control transgenic parasite at each time-point was determined by qPCR using primers specific for each transgenic parasite. This ratio was taken as the relative growth value for modelling. The data from three independent experiments for each condition are shown. The lines on the graphs are the linear mixed effect models of growth at the indicated treatment doses of GlcN. P-values from likelihood ratio test: 0.0024 (PfDHS_glmS); 0.19 (PfDHS_M9); 3.9e-11 (PfDHFR-TS_glmS). Part (D) shows the effect of GlcN on modulating transgenic parasite sensitivity to growth inhibitory compounds. Dose-response assays were performed with (2.5 mM) or without GlcN co-treatment. Three or four independent experiments were performed for each condition. The growth inhibitory compounds tested included cycloheximide (CHX), N1-guanyl-1,7-diaminoheptane (GC7) and pyrimethamine (PYR). The 50% inhibitory concentration of each compound (EC50) was determined by analysis of dose-response data for PfDHS_glmS and PfDHS_M9 transgenic parasites. The dose-response data and fitted curves are shown in Fig. S11. The estimated log2 ratio of EC50 between the −GlcN and +GlcN conditions together with CI95 is shown for each compound and transgenic parasite. P-values comparing log2 EC50 (–GlcN/+GlcN) estimates: 0.76 (PfDHS_glmS, CHX); 2.0e-15 (PfDHS_glmS, GC7); 0.030 (PfDHS_glmS, PYR); 0.28 (PfDHS_M9, CHX); 0.0031 (PfDHS_M9, GC7); 9.0e-4 (PfDHS_M9, PYR).
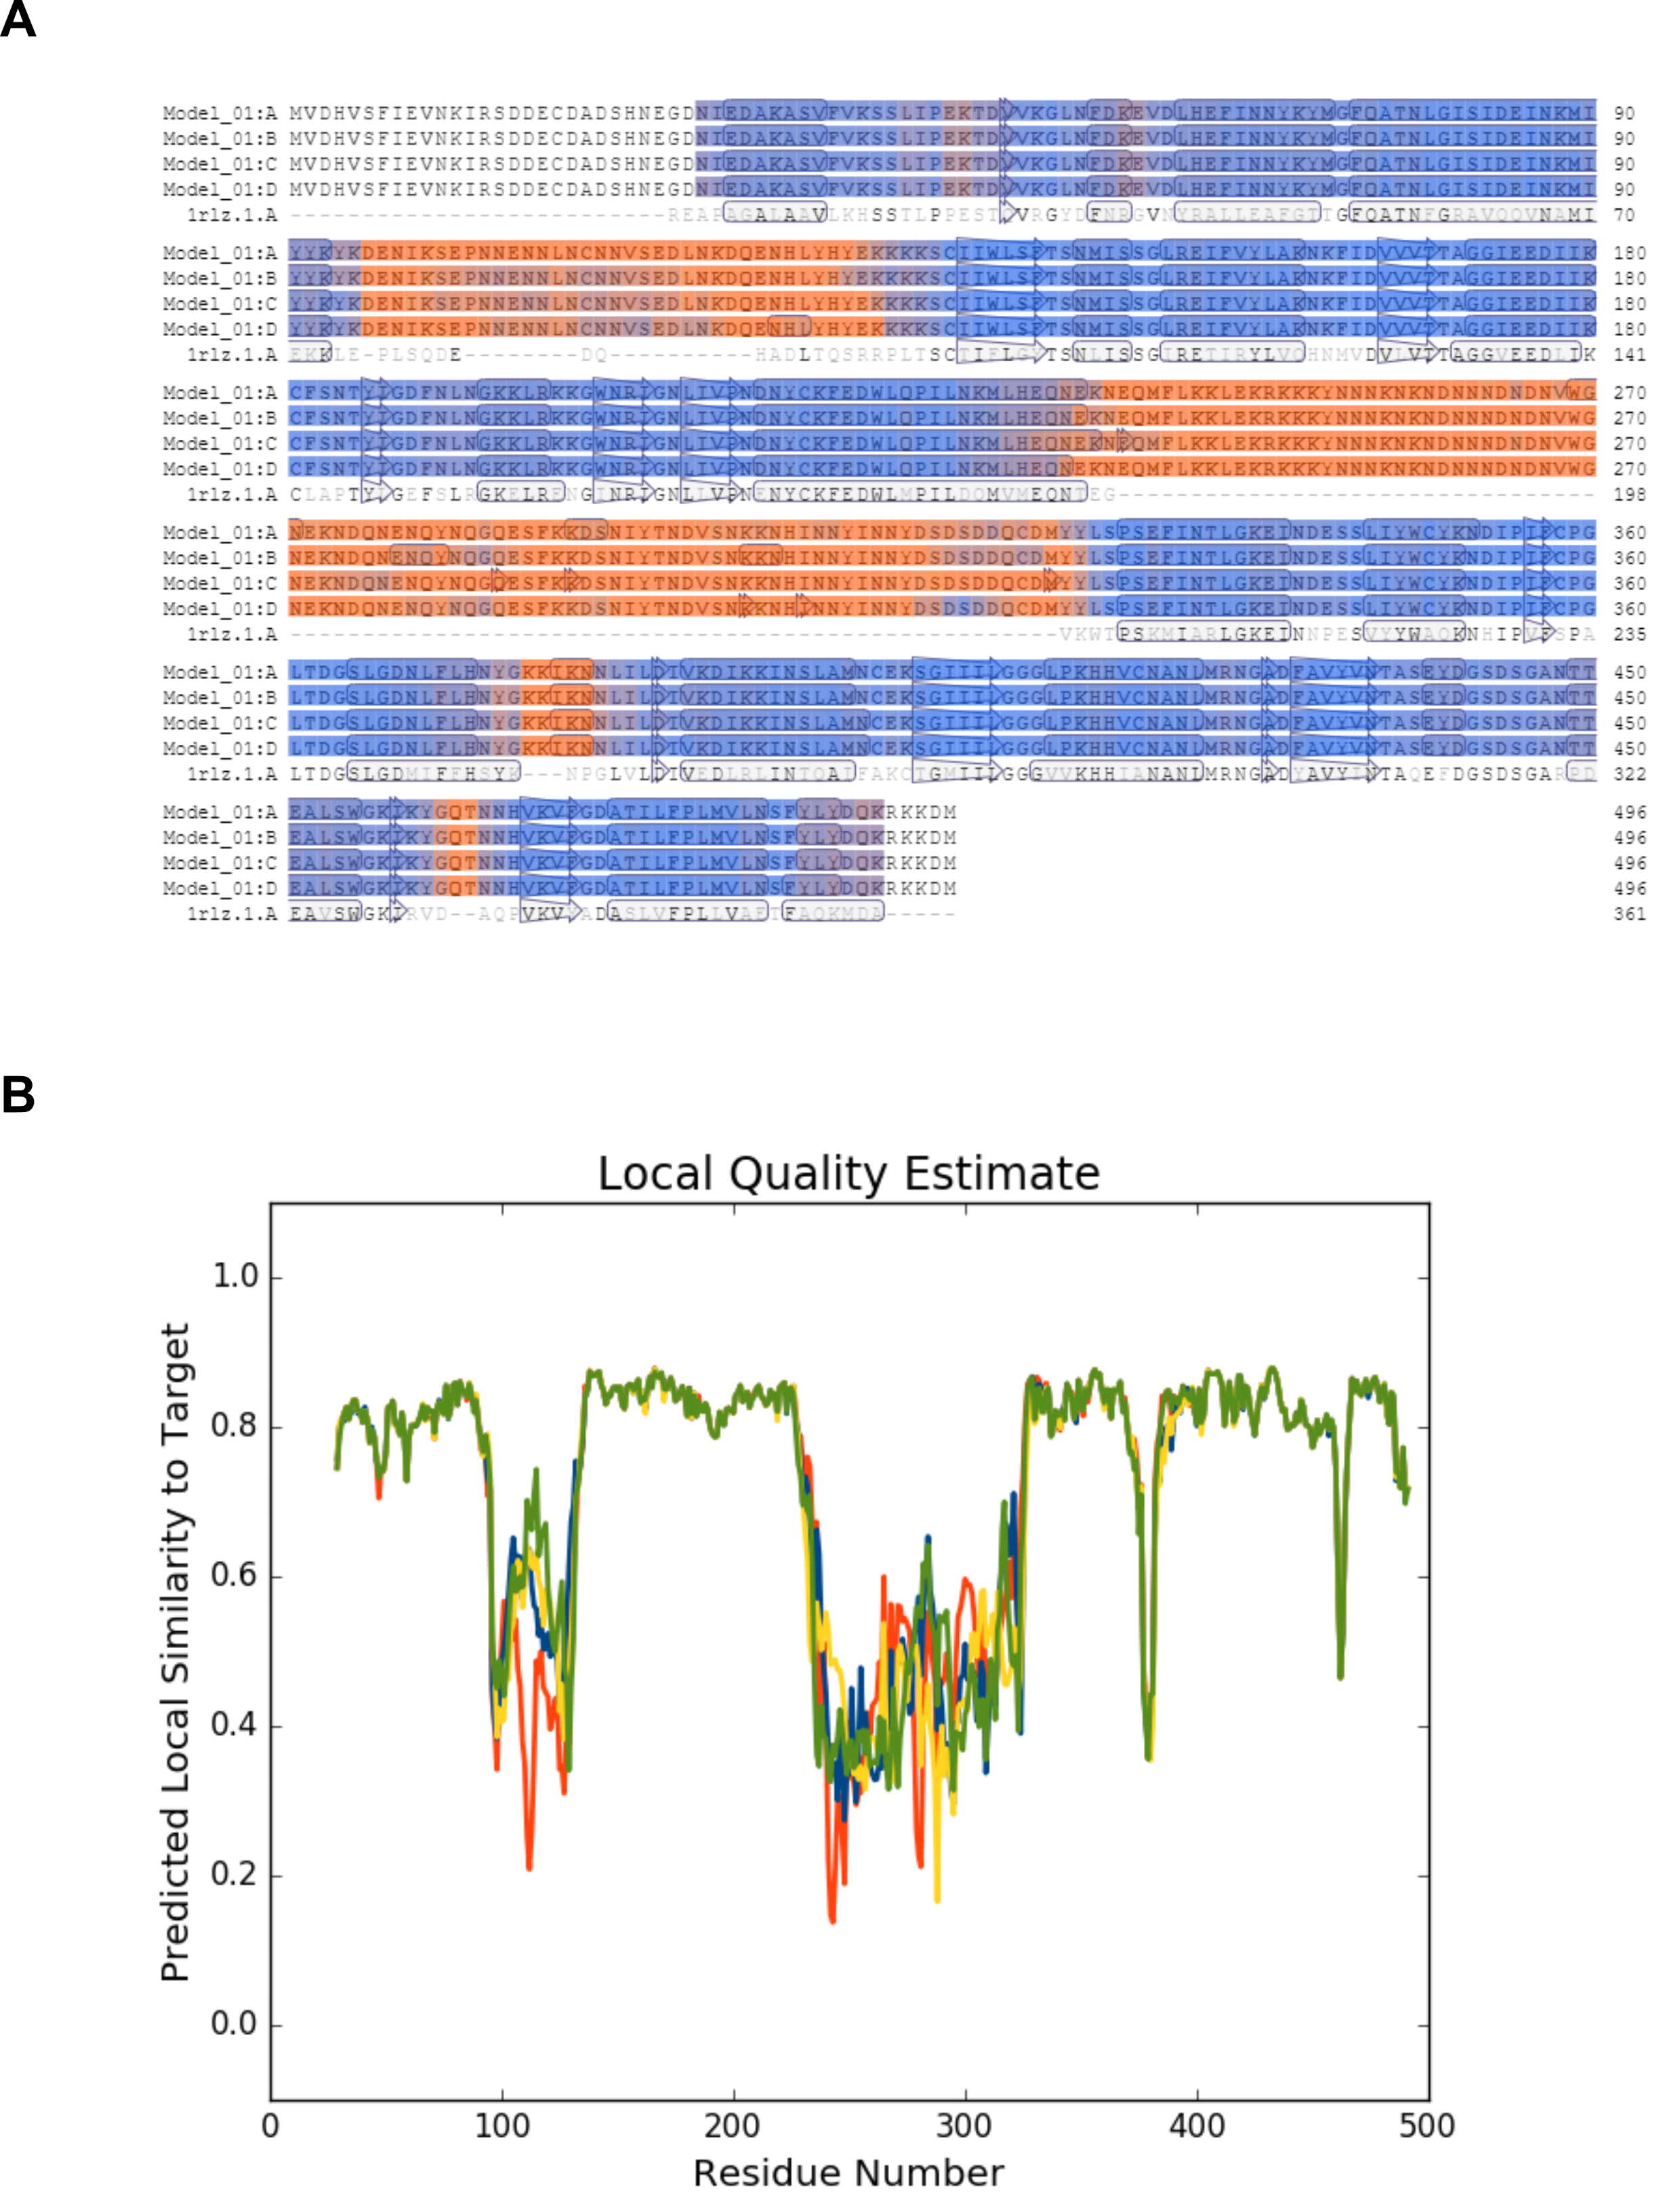
In order to assess the feasibility of PfDHS as a target for rationally designed inhibitors, structural study was performed. A three-dimensional structure of PfDHS was constructed by homology modeling using a human DHS crystal structure (Fig. 5). The quality of the PfDHS structure core is estimated to be high with most residues showing QMEAN scores greater than 0.7. The periphery of the PfDHS structure is of lower estimated quality owing to inserts not present in the human DHS protein (Fig. S12). Ligand binding site analysis identified two binding sites with significantly high scores. The top-scoring site with a site score of 1.16 corresponds to the putative substrate binding pocket occupied by spermidine or a competitive inhibitor such as GC7. The tetramer substrate binding pockets are arranged in a sandwich homodimer manner with two sites per homodimer interface (Fig. 6A). The substrate binding pockets in each PfDHS subunit are connected in a tunnel-like fashion highly similar to human DHS (Fig. 6B). Comparison of residues in the vicinity of the substrate binding pocket between PfDHS and human DHS revealed conservation of key interacting residues in PfDHS including Asp368, Asn420, Gly442, Ser443, and Glu451 (Fig. 6C). SiteMap also identified other residues conserved between human and PfDHS that may interact with GC7, or contribute to the environment favorable for GC7 binding (Figs. 6D and 6E). SiteMap detected a second ligand binding site in PfDHS with a site score of 1.01. This site is located in-between the two insertion loops of PfDHS and adjacent to a putative ball-and-chain motif (Fig. S13). The ball-and-chain motif regulates access to the substrate binding pocket, and becomes disordered upon substrate or inhibitor binding (Liao et al., 1998; Umland et al., 2004).
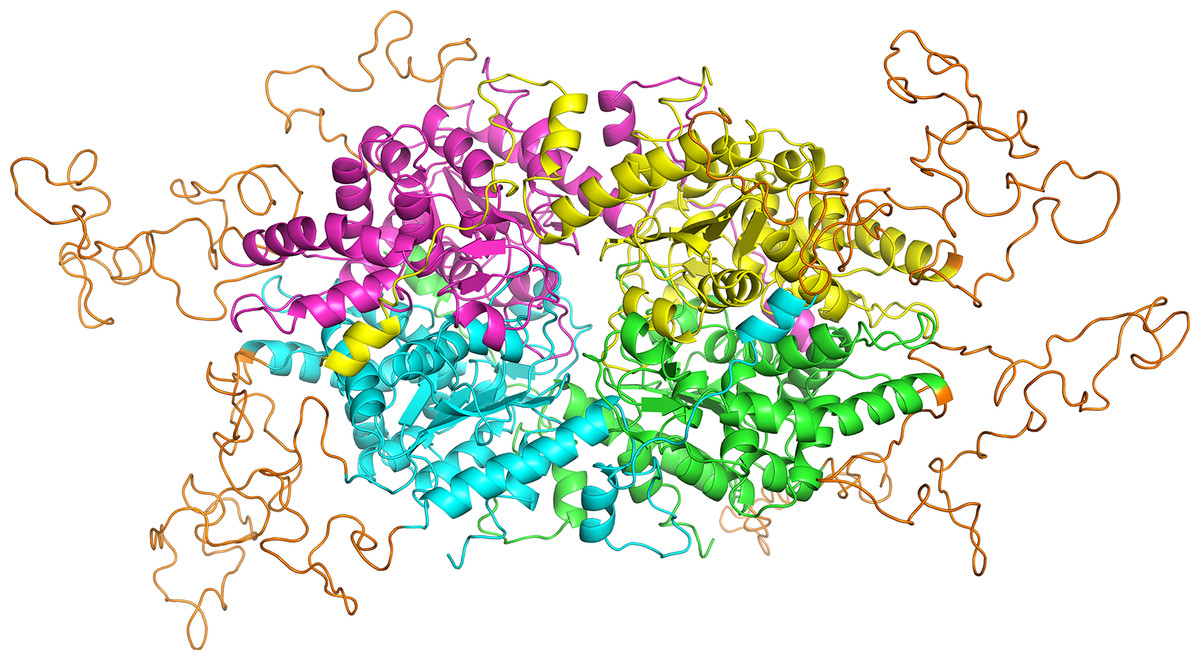
Figure 5: Homology model of PfDHS structure.
The modeled PfDHS structure is a tetramer of subunits. The subunit cores are colored in magenta, yellow, cyan, and green. PfDHS insertion loops with no homologous residues in human DHS are colored in orange. The alignment of PfDHS with human DHS template (PDB: 1RLZ) is shown in Fig. S12.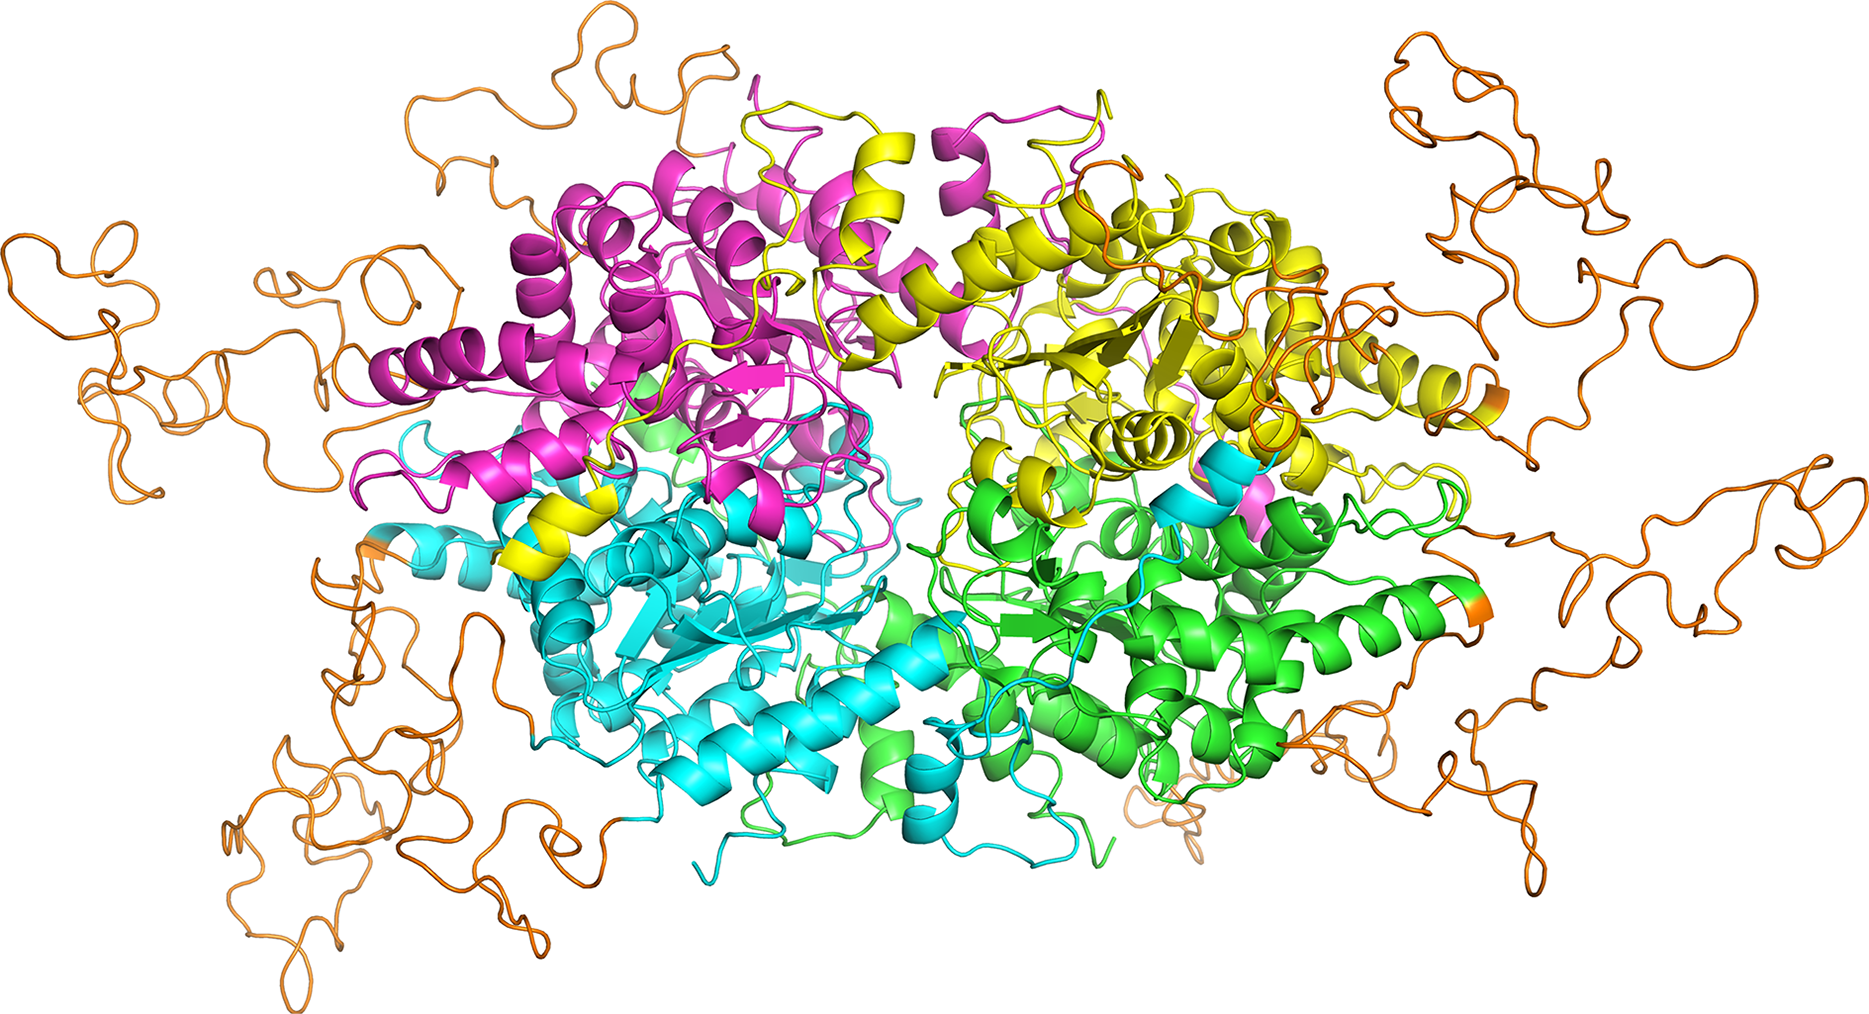
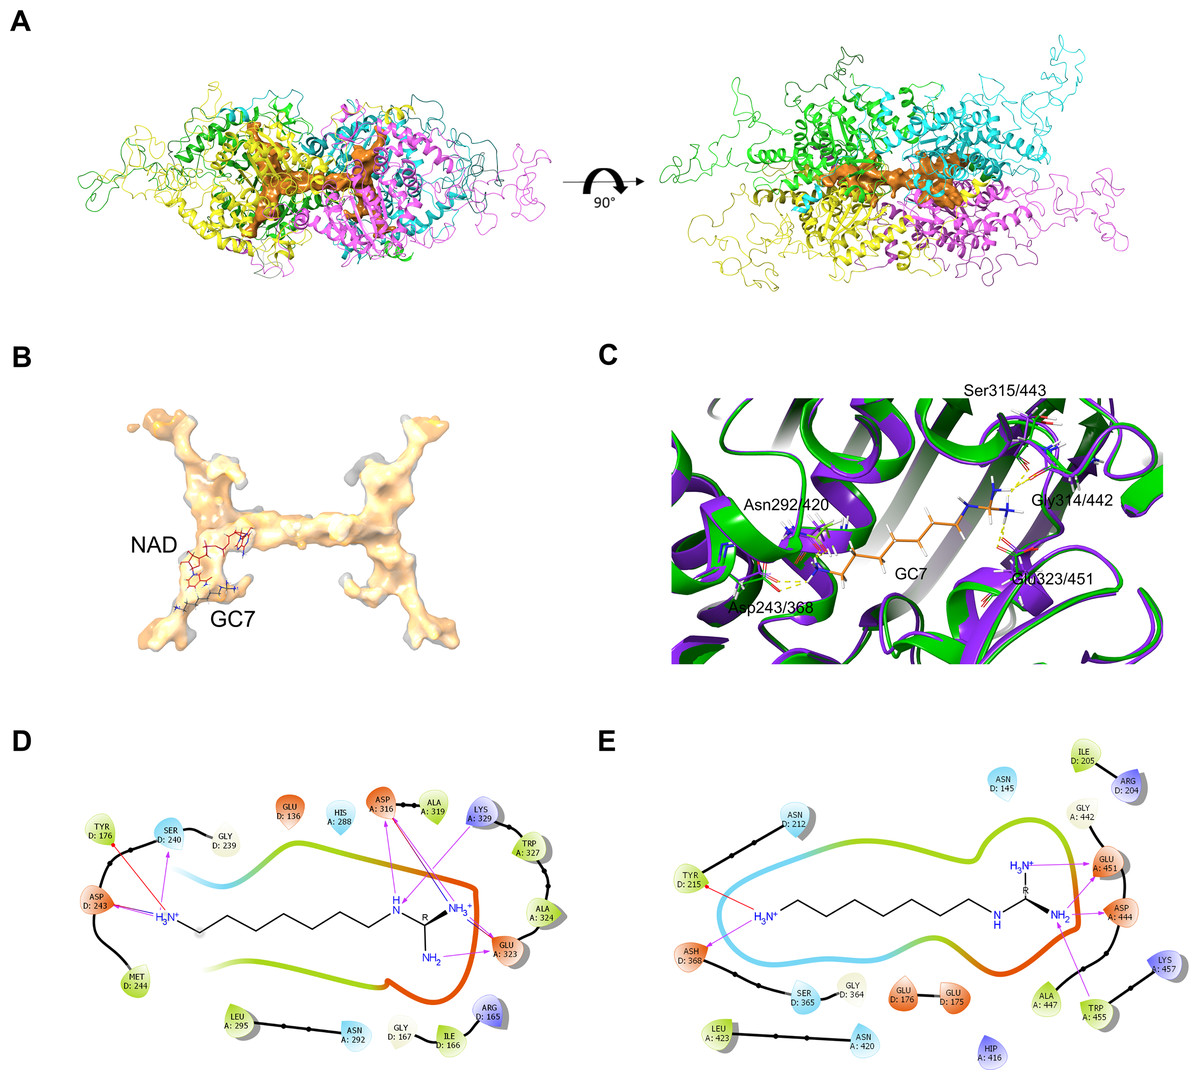
Figure 6: PfDHS putative substrate binding pocket and GC7 interaction.
(A) PfDHS homology model with the top scoring ligand binding site identified by SiteMap in orange. PfDHS tetramer subunits are colored in magenta, yellow, cyan, and green. An alternative view of the same structure rotated 90 degrees is shown on the right. (B) Superposition of the human DHS (PDB: 1RQD) substrate binding pocket (gray) with PfDHS top scoring ligand binding site identified by SiteMap (orange). The NAD and GC7 molecules co-complexed with human DHS are shown for one subunit. (C) Superposition of the human DHS (PDB: 1RQD) GC7 binding domain (green) and corresponding region in PfDHS (purple). Key conserved DHS residues interacting with GC7 are shown, with numbering of human DHS residues followed by the PfDHS counterpart. (D) Interaction map of human DHS and (E) PfDHS residues in the GC7 binding domain. Residues are numbered according to which subunit (A–D) they belong to. Interactions between residues and GC7 are shown by arrows. Red arrow depicts π cation, blue arrows salt-bridge and magenta arrows hydrogen bond interactions.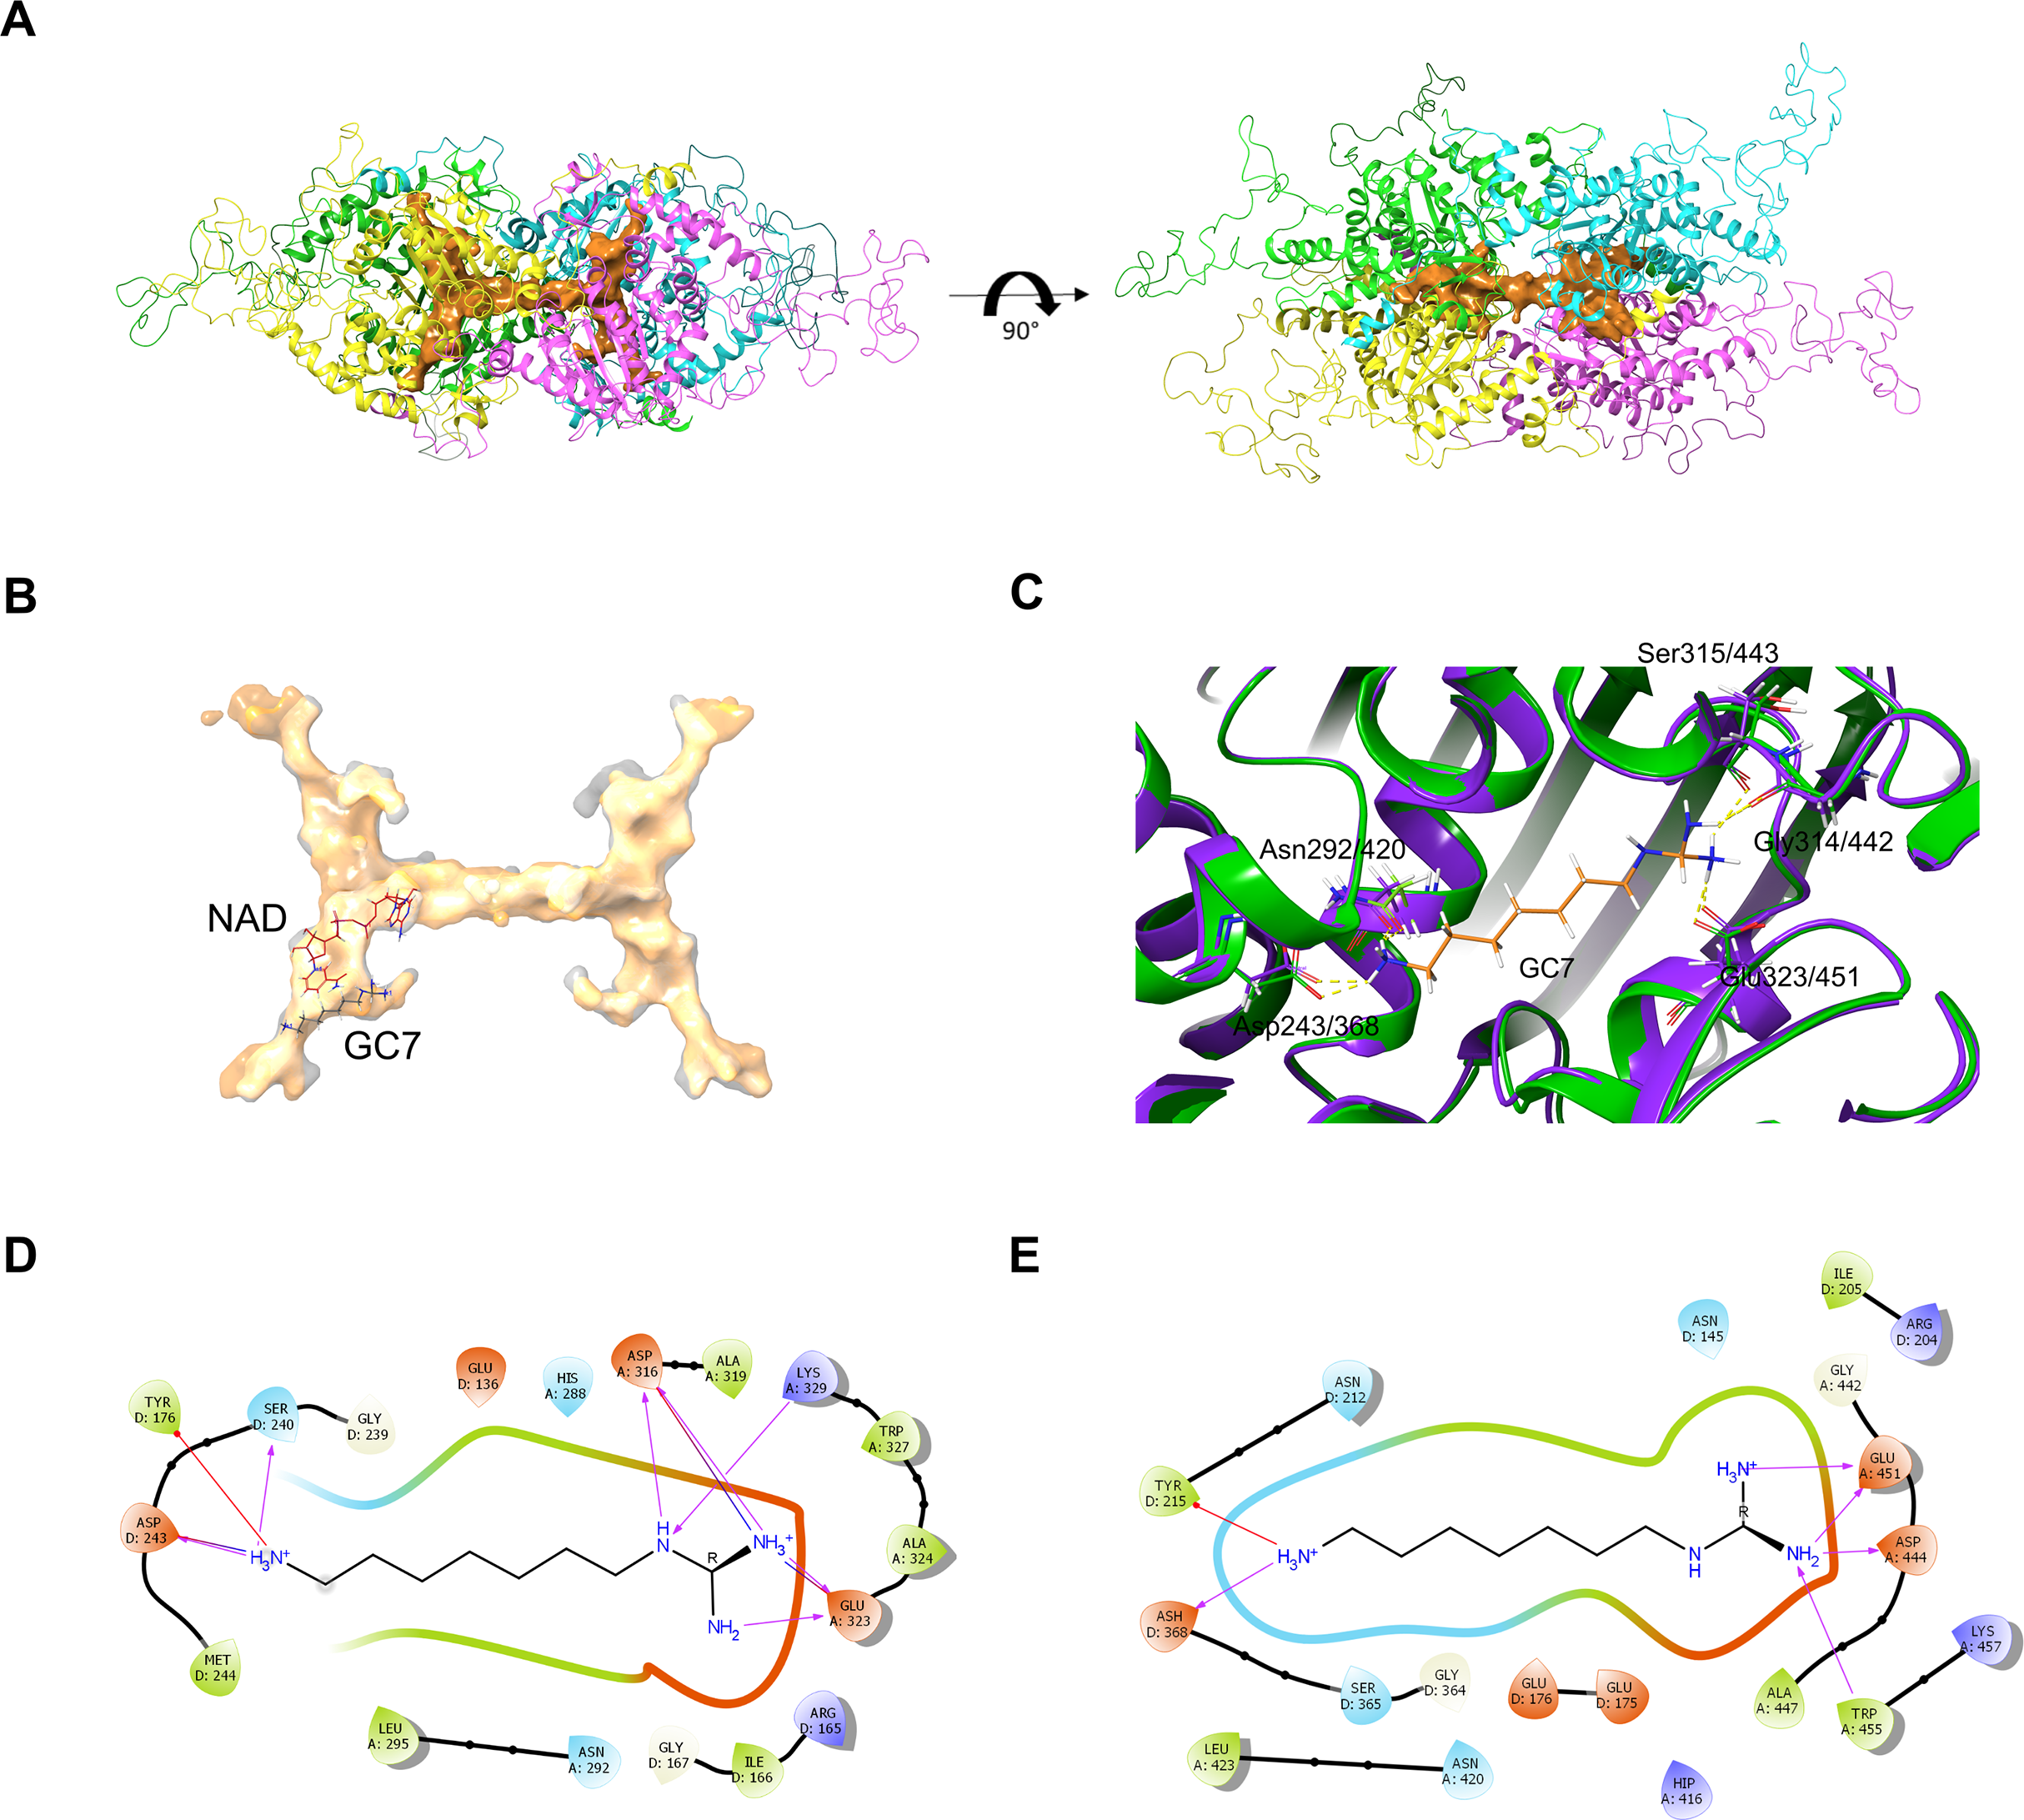
Hypusinated eIF5A is thought to be important for translation elongation at poorly translated codons, especially consecutive proline-coding codons (Dever, Gutierrez & Shin, 2014). Polyproline motifs are numerous in unicellular eukaryotes such as Saccharomyces cerevisiae yeast with 769 genes containing PPP or PPG coding motifs (Mandal, Mandal & Park, 2014). Moreover, 136/1110 of yeast essential genes (Zhang, 2004) contain polyproline coding motifs. The essential genes with polyproline motifs therefore represent 136/5175 (2.6%) of the total yeast protein-coding genes. We therefore performed a bioinformatic survey of the P. falciparum proteome for proteins with polyproline motifs that may require hypusinated eIF5A for optimal synthesis following a previous rationale (Mandal, Mandal & Park, 2014). 257 proteins with PPP or PPG motifs were found (Table S2), of which insertions of piggyBac transposon are not tolerated in the corresponding coding regions for 128 genes (Zhang et al., 2018). Using the rationale that P. falciparum genes devoid of piggyBac transposon insertions are essential, 128/2680 essential genes thus contain polyproline-coding motifs. The essential genes with polyproline motifs in P. falciparum therefore represent a similar proportion of the total protein coding genes (128/5305; 2.4%) as in yeast. Among the 142 orthologous genes also with polyproline coding motifs in P. berghei, 58 are essential, 16 cause slow growth when disrupted, and 18 are dispensable (Bushell et al., 2017).
Discussion
Hypusine modification of eIF5A is essential in different eukaryotic organisms. In this study, we have validated the DHS enzyme, which is responsible for the first step in the hypusination pathway, as an antimalarial target in P. falciparum. We created transgenic parasites with modification of the PfDHS gene for phenotypic study. The modification included a C-terminal GFP tag, which facilitated monitoring of PfDHS protein. Confocal microscopy revealed a cytoplasmic localization of GFP-tagged PfDHS protein, which is consistent with the localization of the mammalian DHS protein (Sievert et al., 2012). The cytoplasmic localization may be important to localize eIF5A protein, as DHS-knockout mice show accumulation of nuclear eIF5A (Pällmann et al., 2015). We were able to attenuate PfDHS expression approximately fivefold in the PfDHS_glmS parasite with similar efficiency to that obtained for other essential genes using the same reverse-genetic system (Prommana et al., 2013; Sleebs et al., 2014; Elsworth et al., 2014; Xie et al., 2016; Counihan et al., 2017; Thériault & Richard, 2017). The attenuation of PfDHS expression in this transgenic parasite is specifically induced by GlcN treatment, since GlcN does not reduce expression of the same gene in the PfDHS_M9 parasite, which differs only by two nucleotide substitutions at the glmS riboswitch cleavage site that nullify RNA self-cleavage (Winkler et al., 2004).
Attenuation of PfDHS expression in the PfDHS_glmS causes a growth defect, although the decline of PfDHS_glmS parasites in culture is less rapid than PfDHFR-TS-attenuated parasites. These data suggest that PfDHS is essential and explain why no insertions of piggyBac transposon are tolerated in this gene (Zhang et al., 2018). However, inducible null mutants (e.g., created by using the DiCre inducible knockout method (Collins et al., 2013)) are required for definitive proof of essentiality. The slow decline of PfDHS-attenuated parasites suggests that the residual hypusinated protein is sufficient to support viability for at least one growth cycle, perhaps because hypusinated protein is long-lived. In support of this explanation, the level of hypusinated protein in PfDHS-attenuated parasites is modestly reduced. A total of 60% reduction of hypusinated eIF5A in a conditional mutant of yeast with attenuated DHS expression is deleterious (Galvão et al., 2013), suggesting that a certain level of hypusinated eIF5A is necessary for eukaryote cell growth. Alternatively, the growth defect in PfDHS-attenuated parasites could be due to loss of hypusination and/or a “moonlighting” function of PfDHS. To test possible “moonlighting” functions of PfDHS, data from catalytically inactive PfDHS mutants are required. Although the slow decline of PfDHS-attenuated parasites could be attributed to incomplete attenuation of PfDHS expression, decline of null PfDHS mutants in growth assays may not be much more rapid since null DHS mutants of yeast can undergo several cell divisions before arrest (Park, Joe & Kang, 1998).
The competitive growth assay developed in this study is suitable for monitoring of growth over extended periods and demonstrating latent (more than two growth cycles) growth defects. Our method has the advantage that no correction for dilution factors is necessary, which could introduce substantial error. However, we have not performed head to head comparisons of the competitive growth assay with other methods to assess accuracy. The competitive growth assay could be scaled-up by pooling parasites with glmS riboswitch modifications of different genes and monitoring the growth of each mutant by next-generation sequencing, similar to that described for mutants carrying piggyBac insertions (Bronner et al., 2016). The competitive growth assay is an alternative to the plaque-based growth assay, which has been used to demonstrate latent growth defects in essential invasion genes (Thomas et al., 2016). The small size of plaques make quantification difficult, especially if a scanner of sufficiently high resolution is not available. Slow growing mutant parasites may also have failed to reach a sufficiently critical mass at the end of the assay period such that no plaque is visible and the growth defect over-estimated. The growth defects of mutant parasites inferred from plaque assay can be confounded by competition with wild-type parasites (Lehmann et al., 2018). Furthermore, the plaque-based growth assay is an end-point assay and so cannot provide information of growth dynamics like the competitive growth assay.
From the latent growth defect in PfDHS mutants, PfDHS can be considered a less vulnerable antimalarial target than other essential genes such as PfDHFR-TS. Information of target vulnerability is important for antimalarial development. It may be difficult to develop potent antimalarial derivatives from hit compounds obtained by high throughput screening if the target has a low vulnerability. This is because inhibitors of less vulnerable targets need to bind the target with very high affinity to ensure that almost all target activity is inhibited at therapeutic doses for antimalarial efficacy. In contrast, compounds against the most vulnerable targets (for which even small reductions in activity are deleterious to the parasite) may only need to have moderate binding affinity for high antimalarial efficacy. Furthermore, knowledge of target vulnerability could be important for consideration of how easily resistance could evolve. Resistance mutations in less vulnerable targets that cause a small reduction of inhibitor binding affinity could render drugs ineffective. If a panel of mutants with the expression of different essential genes attenuated using the glmS riboswitch or another reverse genetic tool was available, competitive growth assays could be performed to systematically compare target vulnerabilities and triage targets for antimalarial development.
PfDHS-attenuated parasites are significantly more sensitive to growth inhibition by GC7, suggesting that the primary in vivo target of this compound is PfDHS. The slow decline of genetically attenuated PfDHS parasites in competitive growth assays suggests that some of the antimalarial effect of GC7 observed in standard antimalarial assays, in which growth is assessed over shorter periods, could be attributed to inhibition of secondary targets (off-targeting). The log2 EC50 (–GlcN/+GlcN) ratio for GC7 against the PfDHS_glmS parasite is markedly lower than the ratios for antifolates against the PfDHFR-TS_glmS parasite (Aroonsri et al., 2016). Low EC50 ratios are consistent with off-targeting. In support of this inference, GC7 has reported off-target effects in human cells, including induction of autophagy independently of eIF5A activity (Oliverio et al., 2014). Alternatively, the low EC50 ratio for GC7 against the PfDHS_glmS parasite may not be due to off-targeting if the level of PfDHS activity remaining in the +GlcN condition is still in excess of what is required for growth.
The inference that PfDHS is the primary antimalarial target of GC7 is supported by the in silico modeling data, which show conservation of substrate binding pocket and PfDHS residues putatively involved with GC7 interaction. The high conservation of substrate binding pocket could make the design of antimalarials specific to the PfDHS target challenging. However, the modeled PfDHS structure reveals a second potential ligand binding site that could also be exploited for rational drug design. The second site overlaps insert residues not present in human DHS and a putative ball-and-chain motif. Compounds binding to this site thus could act as allosteric inhibitors by preventing access of protein substrates to the substrate binding pocket for deoxyhypusine modification. X-ray structural data of PfDHS could provide important insights into PfDHS for drug design not revealed by in silico modeling, including the roles of the ball-and-chain motif and inserts peripheral to the core.
The primary function of hypusinated eIF5A for translation elongation, particularly of polyproline motifs may be conserved in P. falciparum, as a number of its proteins contain these motifs. Although P. falciparum has markedly fewer polyproline-motif proteins than yeast, the number of these proteins that are essential with respect to the total protein complement is similar. Insufficient synthesis of one or more essential protein could be responsible for the growth defect in PfDHS attenuated mutants, although proteomic data are needed to test this hypothesis. The small number of polyproline motif proteins in P. falciparum that potentially require hypusinated PfeIF5A for their production could explain why global protein synthesis (in the short term) is not significantly reduced when PfDHS function is attenuated.
Conclusions
The loss of PfDHS function leads to a growth defect, suggesting that this gene is essential. However, definitive proof from null mutants is required to conclude essentiality. Loss of PfDHS function leads to reduction of hypusination, which may affect synthesis of some proteins. PfDHS is not as vulnerable a target as other essential genes such as PfDHFR-TS, although it can be targeted by antimalarials such as GC7.
Supplemental Information
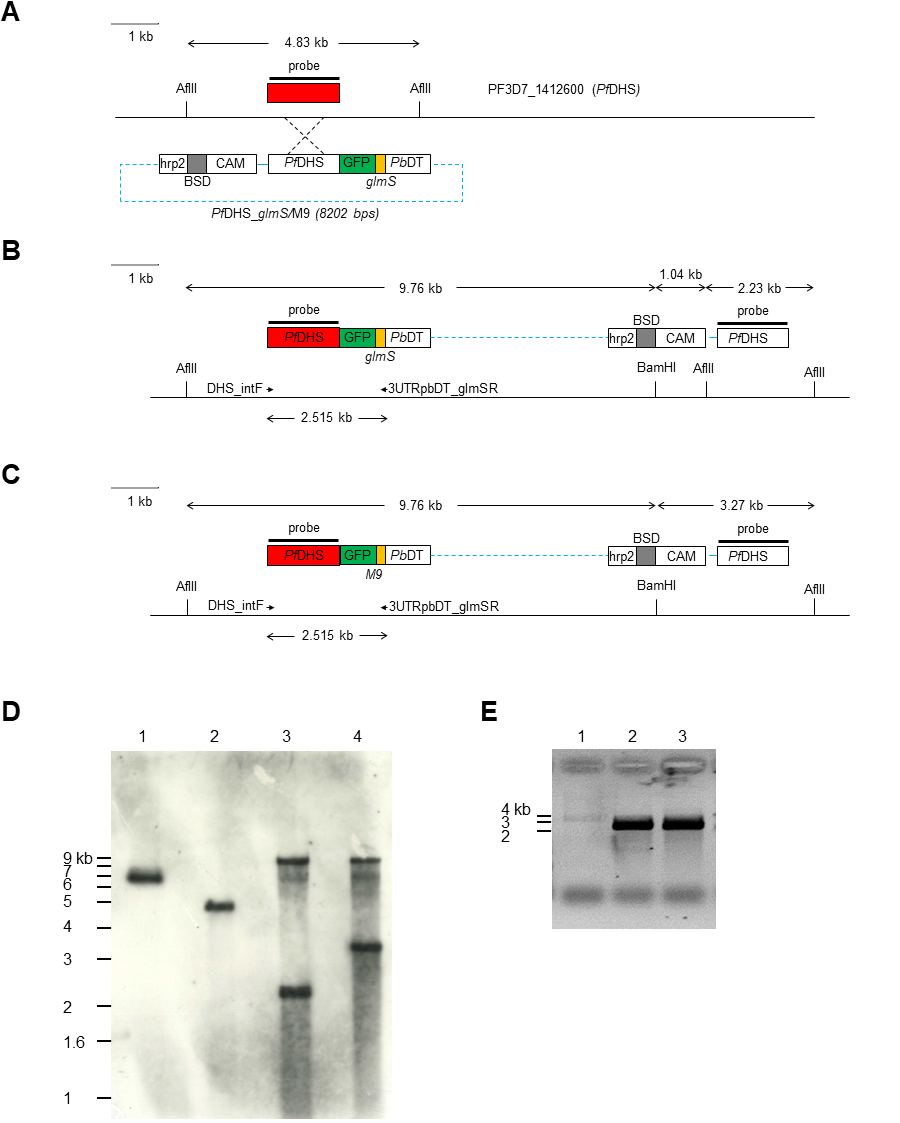
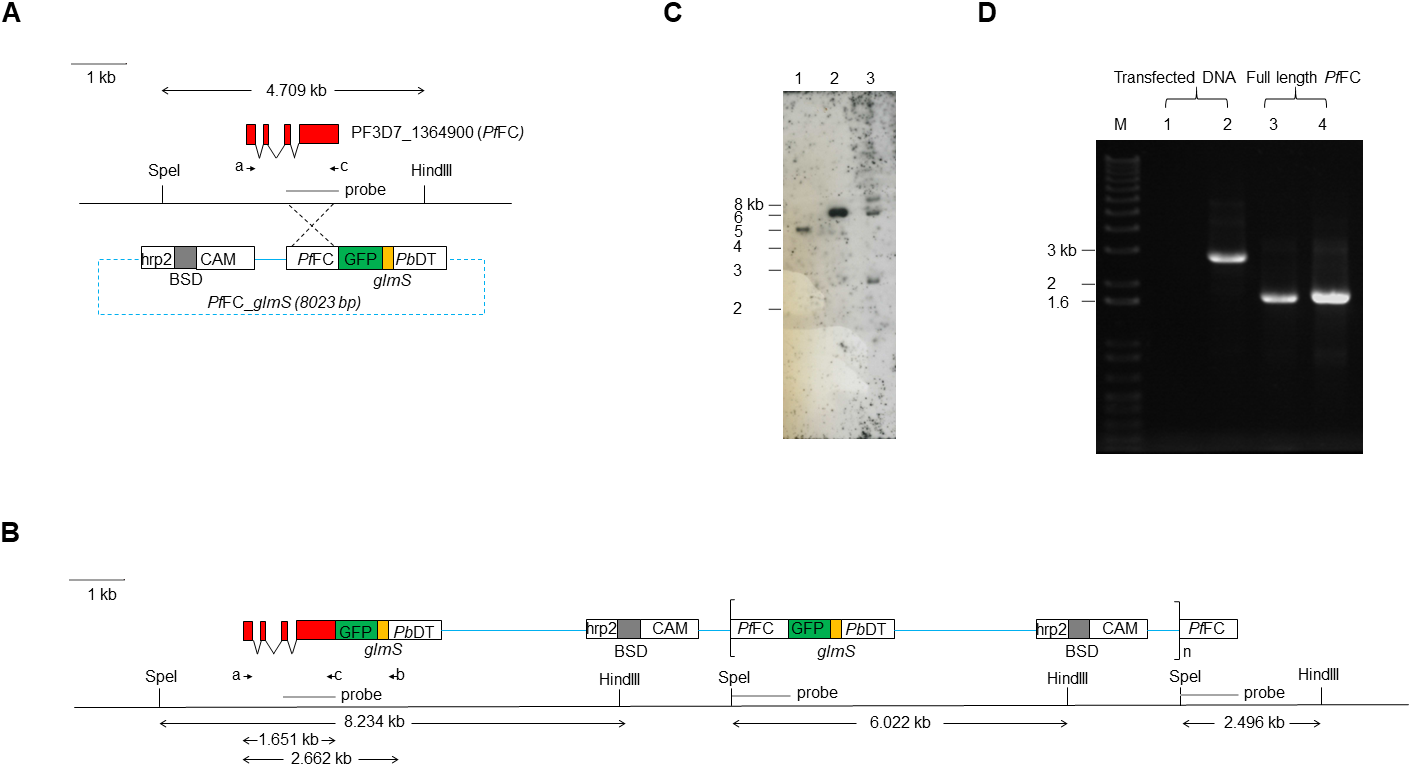
Transgenic modification of the PfDHS gene.
(A) Schematic diagram of the Plasmodium falciparum 3D7 genomic region encompassing the PF3D7_1412600 (PfDHS) gene, drawn to scale. The PfDHS annotated gene model exon is indicated by a red box. The locations of AflII restriction sites and the Southern blot probe hybridizing region are indicated on the genomic DNA line. The transfection plasmids PfDHS_glmS and PfDHS_M9 integrated into the PfDHS locus in transgenic parasites via single-crossover recombination, as indicated by the dashed lines. Functional elements in transfection plasmids are depicted as boxes: the blasticidin-S-deaminase (BSD) selection marker gene, camodulin gene promoter (CAM), histidine-rich protein two gene terminator (hrp2), PfDHS homologous targeting sequence (PfDHS), GFP gene (GFP), glmS riboswitch (wild-type or M9 variant; glmS), and P. berghei dihydrofolate reductase-thymidylate synthase gene terminator (PbDT). Plasmid backbone (not to scale) is depicted as a dashed blue line. (B) Schematic diagram of the PfDHS gene region in transgenic parasites with integrated PfDHS_glmS plasmid (all elements drawn to scale). The locations of BamHI and AflII restriction sites and the Southern blot probe hybridizing regions are indicated on the genomic DNA line. The locations of DHS_intF and 3UTRpbDT_glmSR primer binding sites for integration-specific PCR assay are indicated by arrows. (C) Schematic diagram of the PfDHS gene region in transgenic parasites with integrated PfDHS_M9 plasmid (all elements drawn to scale). The locations of BamHI and AflII restriction sites and the Southern blot probe hybridizing regions are indicated on the genomic DNA line. The locations of DHS_intF and 3UTRpbDT_glmSR primer binding sites for integration-specific PCR assay are indicated by arrows. (D) Southern blot of P. falciparum genomic DNA. DNA samples were digested with BamHI and AflII, separated by agarose electrophoresis and blotted onto a Hybond N+ nylon membrane (GE healthcare). The membrane was hybridized with a DIG-labeled DNA probe synthesized by PCR using primers pGFP_glmS_DHSF and GFP_glmS_DHSR. DNA samples: lane 1, PfDHS_glmS plasmid DNA (7155 bp); P. falciparum 3D7 parental parasite genomic DNA; lane 2, PfDHS_glmS transgenic parasite genomic DNA; lane 4, PfDHS_M9 transgenic parasite genomic DNA. The migrations of one kb+ DNA ladder (Invitrogen) bands are indicated on the left. (E) Agarose gel of PCR products for integration-specific PCR assay. PCRs were conducted with genomic DNA templates from different parasites: lane 1, P. falciparum 3D7 parental parasite; lane 2, PfDHS_glmS transgenic parasite; lane 3, PfDHS_M9 transgenic parasite. The migrations of one kb+ DNA ladder (Invitrogen) bands are indicated on the left.
Transgenic modification of the PfFC gene.
(A) Schematic diagram of the Plasmodium falciparum 3D7 genomic region encompassing the PF3D7_1364900 (PfFC) gene, drawn to scale. The PfFC annotated gene model exons are indicated by red boxes. The PfFC_glmS transfection plasmid integrated into the PfFC locus in transgenic parasites via single-crossover recombination, indicated by the dashed lines. Functional elements in transfection plasmids are depicted as boxes: the blasticidin-S-deaminase (BSD) selection marker gene, camodulin gene promoter (CAM), histidine-rich protein two gene terminator (hrp2), PfFC homologous targeting sequence (PfFC), GFP gene (GFP), glmS riboswitch (glmS), and P. berghei dihydrofolate reductase-thymidylate synthase gene terminator (PbDT). Plasmid backbone (not to scale) is depicted as a dashed blue line. The locations of SpeI and HindIII restriction sites and the Southern blot probe hybridizing region are indicated on the genomic DNA line. (B) Schematic diagram of the PfFC gene region in transgenic parasites with integrated PfFC_glmS plasmid (all elements drawn to scale). The locations of BglIIPfFCF and 3UTRpbDT_glmSR primer binding sites for integration-specific PCR assay are indicated by arrows labeled “a” and “b,” respectively. The PfFCKpnIR control primer binding site is indicated by an arrow labeled as “c.” The locations of SpeI and HindIII restriction sites and the Southern blot probe hybridizing regions are indicated on the genomic DNA line. (C) Southern blot of P. falciparum genomic DNA. DNA samples were digested with HindIII and SpeI, separated by agarose electrophoresis and blotted onto a Hybond N+ nylon membrane (GE healthcare). The membrane was hybridized with a DIG-labeled DNA probe synthesized by PCR using primers BglIIPfFCF and PfFCKpnIR. DNA samples: lane 1, P. falciparum 3D7 parental parasite genomic DNA; lane 2, PfFC_glmS plasmid DNA; lane 3, PfFC_glmS transgenic parasite genomic DNA. The migrations of one kb+ DNA ladder (Invitrogen) bands are indicated on the left. (D) Agarose gel of PCR products. PCR assay for transfected DNA (Transfected DNA) was conducted using primers BglIIPfFCF and 3UTRpbDT_glmSR. Control PCRs for verifying DNA template (full length PfFC) were conducted using primers BglIIPfFCF and PfFCKpnIR. DNA templates: P. falciparum 3D7 parental parasite (lane 1 and lane 3); PfFC_glmS transgenic parasite (lane 2 and lane 4). Lane M, one kb+ DNA ladder (Invitrogen).
Validation of qPCR assay for measuring ratios of genomic DNA from transgenic parasites.
Purified genomic DNA samples from transgenic parasites were mixed in various ratios according to Nanodrop measurements of DNA concentrations. The qPCR abundances of DHS-GFP, TS-GFP, and FC-GFP amplicons were normalized to the LDH amplicon and were used to calculate DNA ratios. Pearson’s coefficient of correlation of observed ratios from qPCR data and expected ratios from known DNA concentration was calculated in R. (A) Correlation of observed and expected ratio of PfDHS_glmS and PfFC_glmS genomic DNA (Pearson’s r = 0.9996; P = 4.2 e-09). CI95 for linear fit are shaded in gray. (B) Correlation of observed and expected ratio of PfDHFR-TS_glmS and PfFC_glmS genomic DNA (Pearson’s r = 0.9939; P = 5.6e-06). CI95 for linear fit are shaded in gray.
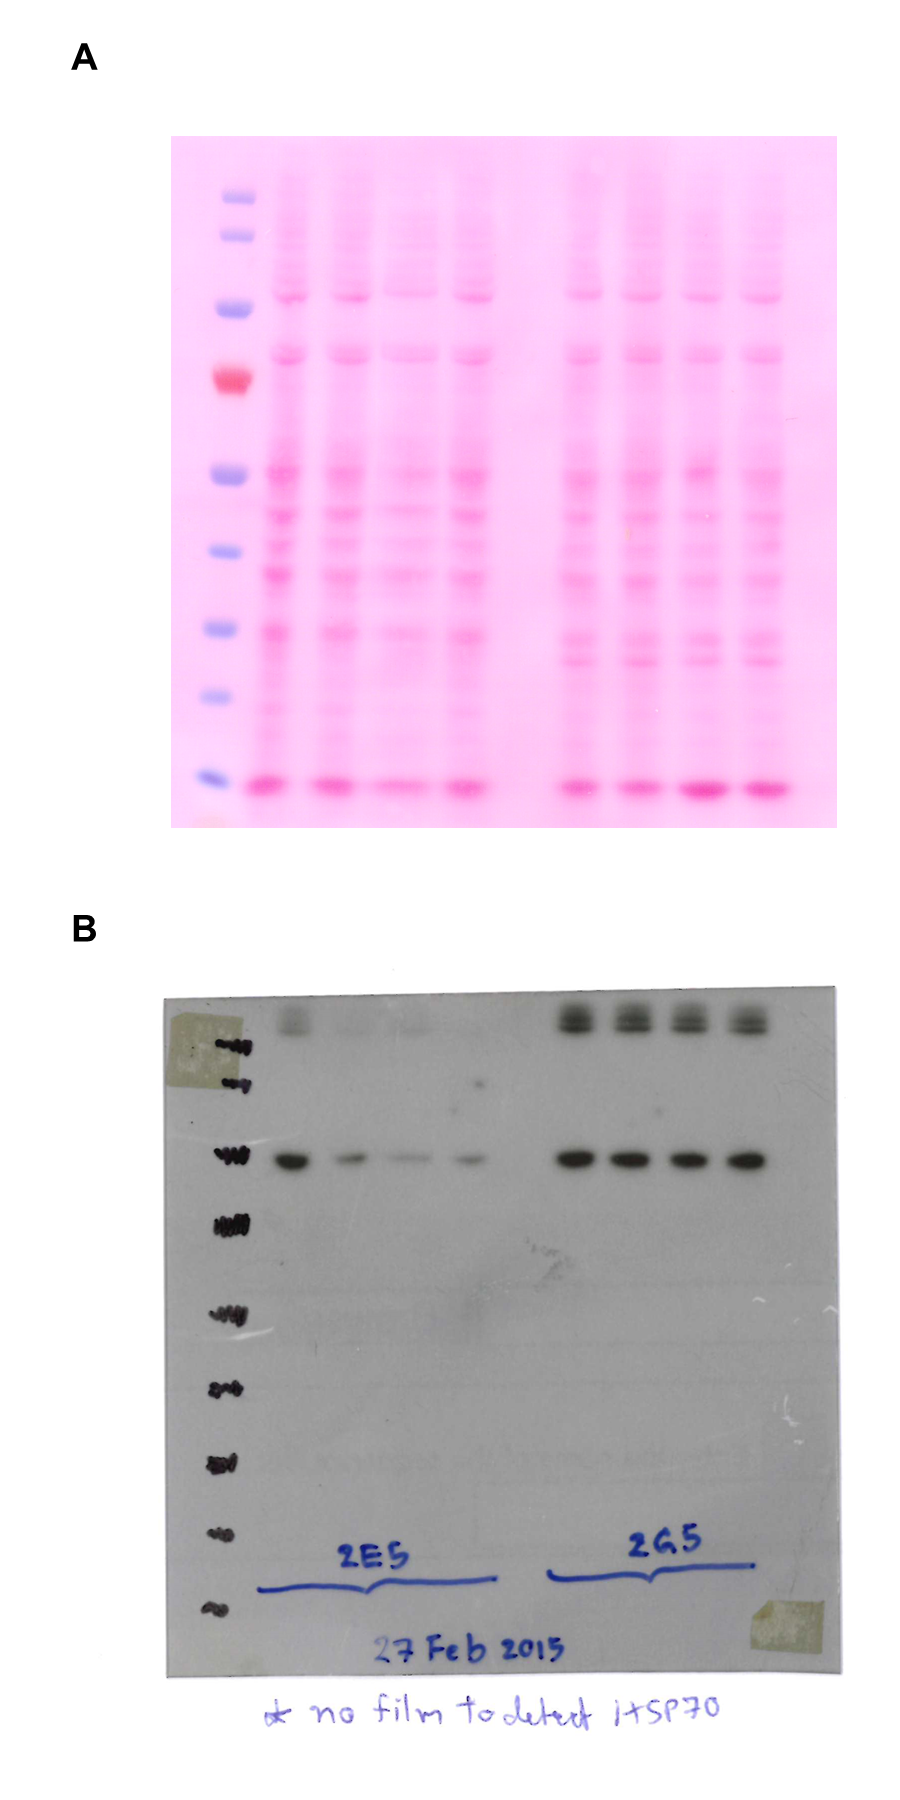
Uncropped images from PfDHS-GFP Western immunoblot experiments.
(A) Uncropped image of Ponceau-S stained membrane (cropped image in Fig. 2A, top panel). (B) Uncropped image of anti-GFP detection (cropped image in Fig. 2A, bottom panel).
Puromycilation nascent protein synthesis and hypusination assays.
Parts (A–B): Validation of the puromycilation assay. Parasites were pre-treated with growth-inhibitory drugs for 1 h prior to puromycin exposure (five µM for 10 min). Proteins were extracted from harvested parasites and separated by electrophoresis. (A) Total protein stained with Ponceau-S. The migrations of PageRuler Plus Prestained Protein ladder (Thermo Scientific) standards are indicated on the left. (B) Puromycilated nascent peptides were detected with anti-puromycin antibody.The migrations of PageRuler Plus Prestained Protein ladder (Thermo Scientific) standards are indicated on the left. Increasing doses of drugs are indicated by the wedges above the lanes: cycloheximide (CHX, doses 1, 10, 100 µM); dihydroartemisinin (DHA, doses 0.01, 0.10, 1 µM) and N1-guanyl-1,7-diaminoheptane (GC7, doses 50, 100, 1,000 µM). Control lanes of samples from parasites not treated with growth-inhibitory compound are marked “control.” The specificity of the anti-puromycin antibody was tested by a control parasite culture in which parasites were not exposed to puromycin, marked “−puromycin.” (C) Uncropped image of PVDF membrane stained with REVERT (cropped image in Fig. 3A). (D) Uncropped image of hypusinated proteins detected with anti-hypusine antibody (cropped image in Fig. 3B).
Morphology of PfDHS_glmS and PfDHS_M9 parasites treated with glucosamine for 72 h.
Ring-stage synchronized transgenic parasites PfDHS_glmS and PfDHS_M9 were treated with 0, 2.5 or 5.0 mM glucosamine (GlcN) for 72 h prior to hypusination and puromycilation assay. Thin film specimens were stained with Giemsa and images captured from 100× oil immersion microscopy. The scale bar (blue line) in the top-left image (PfDHS_glmS; 0 mM GlcN) represents five µm.
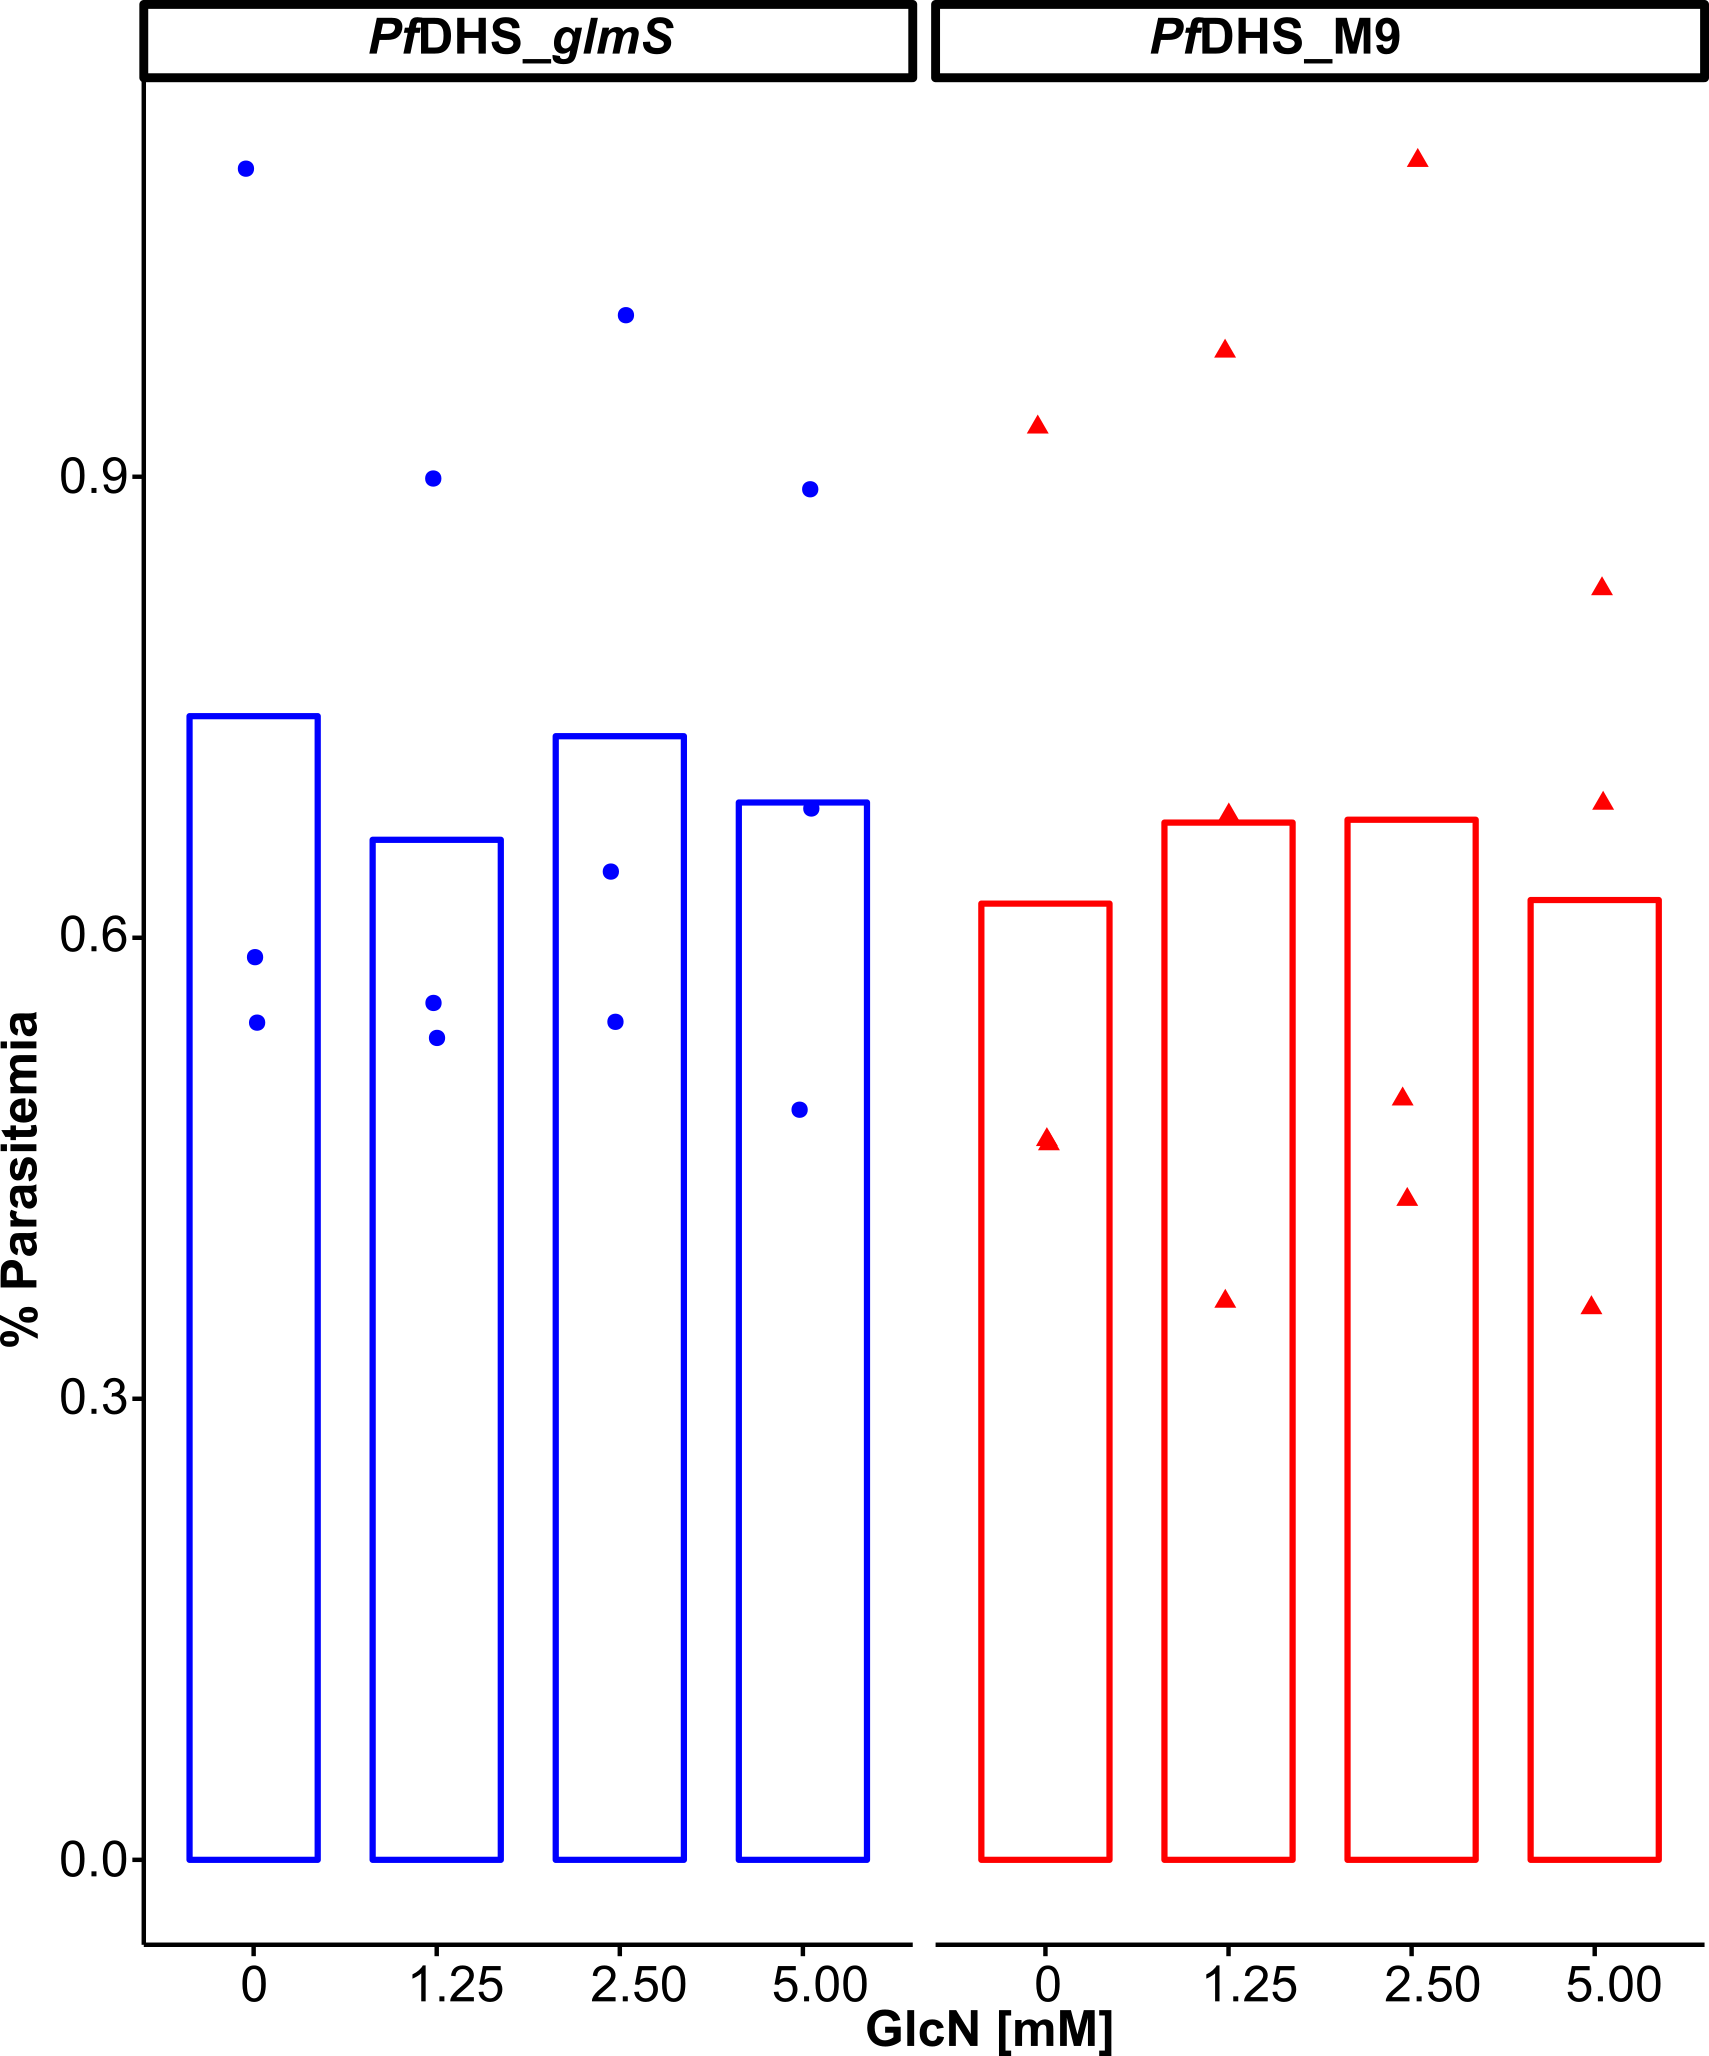
Proliferation of PfDHS_glmS and PfDHS_M9 parasites in the first 72 h of culture.
Ring-stage synchronized transgenic parasites PfDHS_glmS and PfDHS_M9 were cultured separately and diluted to 0.1% parasitemia. The cultures were treated with 0, 1.25, 2.50, or 5.00 mM glucosamine (GlcN) for 72 h. Parasite counts at 72 h were determined from thin film specimens stained with Giemsa. Counts were determined from at least 10,000 red blood cells per specimen. The data shown are from three independent experiments; mean values are shown as bars.
Confocal microscopy images of PfDHFR-TS_glmS, 3D7 and PfFC_glmS parasites.
Representative confocal microscopic images of PfDHFR-TS_glmS (A), parental 3D7 (B) and PfFC_glmS (C) parasites at ring, trophozoite and schizont stages. Parasite nuclei were stained with Hoechst 33342. Mitochondria were stained with Mitotracker. Composite images from merging Hoechst, GFP, and Mitotracker fluorescence signals with the Bright-field (BF) image are shown in the panels on the far-right. Scale bars = 5 µm.
Western immunoblot of PfDHFR-TS_glmS, 3D7 and PfFC_glmS parasites.
Protein extracts were obtained from 3D7, PfFC_glmS, and PfDHFR-TS_glmS parasites. The amount of extract loaded in each lane equivalent to the numbers of parasites is indicated above each lane (1, 5, 10, and 25 million). Proteins were separated in 4–12% NuPAGE gel and transferred to PVDF membrane. (A) Total protein stained with REVERT. (B) GFP-tagged proteins detected with anti-GFP antibody. Lanes marked “M” indicate PageRuler Plus Prestained Protein ladder (Thermo Scientific). The migrations Protein ladder standards are indicated on the left. The migrations of bands expected for PfFC-GFP (68 kDa) and PfDHFRTS-GFP (98 kDa) are indicated by arrows on the right.
Effect of glucosamine on growth of control parasites in extended growth assays.
Synchronized cultures of parental 3D7 (A, C) and PfFC_glmS (B, D) control parasites were established with treatment of 0, 2.5, and 5.0 mM glucosamine (GlcN). The cultures were diluted to approximately 0.1% total parasitemia every two growth cycles. Infected red blood cells were enumerated from Giemsa-stained thin smears. The percentages of ring (A, B) and trophozoite (C, D) parasite-infected red blood cells were taken as growth values for modeling. The data from three independent experiments for each condition are shown. The lines on the graphs are the linear mixed effect models of growths at the indicated treatment doses of GlcN. P-values from likelihood ratio test: 0.92 (3D7, rings); 0.81 (3D7 trophs); 0.33 (PfFC_glmS rings); 0.89 (PfFC_glmS trophs).
Data and fitted curves from dose-response assays.
Data are shown from dose-response assays of growth-inhibitory compounds tested against transgenic parasites PfDHS_glmS (A, C, and E) and PfDHS_M9 (B, D, and F). The data for assays with 2.5 mM glucosamine (GlcN) co-treatment are shown as blue triangles and data without GlcN co-treatment are shown as red circles. The curves are the fitted models from the log-logistic dose-response equation with top and bottom shared between with/without GlcN co-treatment. Growth inhibitory compounds tested: cycloheximide (A, B); N1-guanyl-1,7-diaminoheptane (C, D) and pyrimethamine (E, F).
PfDHS homology model details.
(A) Alignment of human DHS (PDB: 1RLZ) with PfDHS generated by the SWISS-MODEL server. Secondary structure elements are indicated on the protein residues (oblong, alpha helix; arrow, beta-sheet). (B) Graph of local quality estimate for the homology model structure of PfDHS. Q-MEAN score (y-axis) is plotted against PfDHS residue number. Subunits of a putative tetramer are plotted on the same axes (red, subunit A; blue, subunit B; yellow, subunit C; green, subunit D).
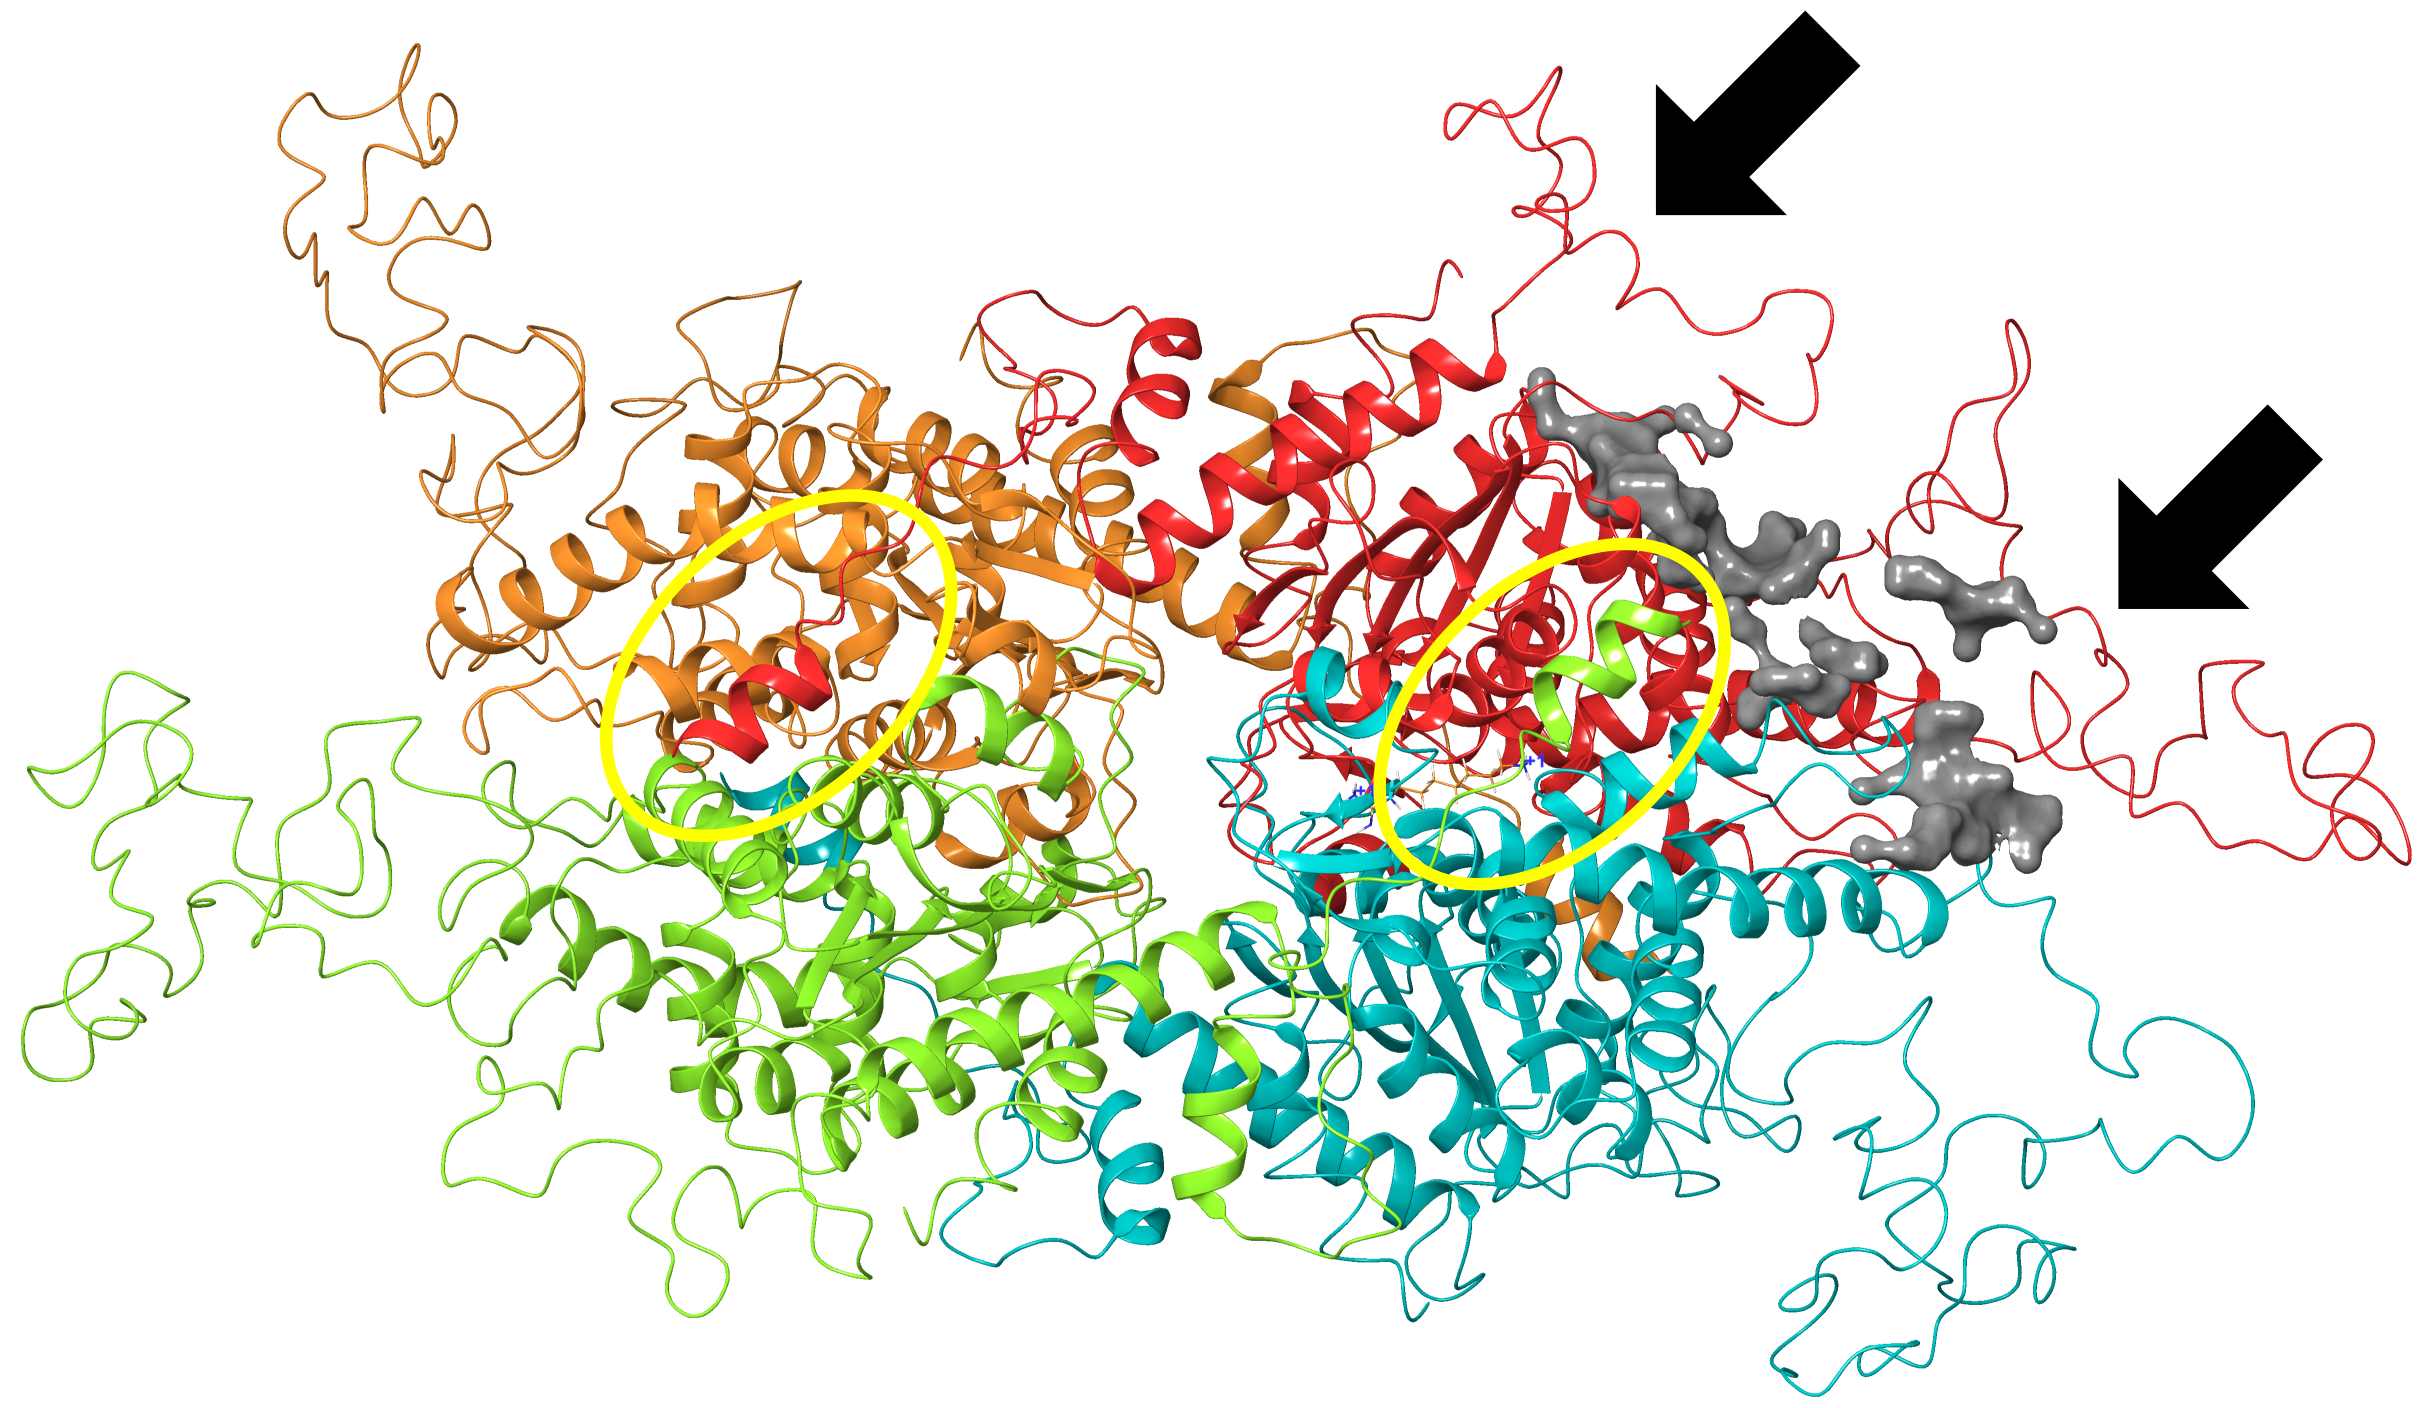
Second ligand binding site in PfDHS.
The second top-scoring ligand binding site in PfDHS identified by SiteMap is shown in gray. This site is located in-between PfDHS inserts Asp96–Lys131 and Glu235–Lys323 (indicated by arrows) and putative ball-and-chain motifs outlined in yellow.
Plasmodium falciparum proteins with polyproline motifs.
Annotated P. falciparum 3D7 proteins in PlasmoDB 38 (Aurrecoechea et al., 2009) were searched for PPP and PPG motifs using the Protein Motif Pattern tool in PlasmoDB. Data of piggyBac transposon insertions in the protein coding region of corresponding genes were reported in (Zhang et al., 2018). Data of orthologous genes targeted for knockout in P. berghei and the associated growth phenotypes were reported in (Bushell et al., 2017).