
Bird diversity-environment relationships in urban parks and cemeteries of the Neotropics during breeding and non-breeding seasons
- Published
- Accepted
- Received
- Academic Editor
- José Maria Silva
- Subject Areas
- Biodiversity, Biogeography, Conservation Biology, Zoology
- Keywords
- Habitat heterogeneity, Latin America, Macroecology, Seasonality, Species-area relationships, Taxonomic diversity, Urbanization
- Copyright
- © 2022 Leveau et al.
- Licence
- This is an open access article distributed under the terms of the Creative Commons Attribution License, which permits unrestricted use, distribution, reproduction and adaptation in any medium and for any purpose provided that it is properly attributed. For attribution, the original author(s), title, publication source (PeerJ) and either DOI or URL of the article must be cited.
- Cite this article
- 2022. Bird diversity-environment relationships in urban parks and cemeteries of the Neotropics during breeding and non-breeding seasons. PeerJ 10:e14496 https://doi.org/10.7717/peerj.14496
Abstract
Background
Urbanization will increase in the next decades, causing the loss of green areas and bird diversity within cities. There is a lack of studies at a continental scale analyzing the relationship between urban green areas, such as parks and cemeteries, and bird species richness in the Neotropical region. Bird diversity-environment relationships in urban parks and cemeteries may be influenced by latitudinal gradients or species-area relationships. However, the seasonal variation of species diversity- environment has not been analyzed at a continental scale in the Neotropics.
Methods
Bird surveys were conducted in 36 cemeteries and 37 parks within 18 Neotropical cities during non-breeding and breeding seasons. Bird diversity was assessed through Hill numbers, focusing on species richness, the effective number of species derived from Shannon index and the Simpson index. Environmental variables included latitude, altitude, and local scale variables such as area size, habitat diversity and pedestrian traffic.
Results
Species richness and Shannon diversity were higher during the breeding season, whereas Simpson diversity did not vary between seasons. During both seasons, species richness increased with area size, was negatively related to altitude, and was the highest at 20° latitude. Species richness was also positively related to habitat diversity, pedestrian traffic, and was highest in suburban areas during the non-breeding season. Shannon and Simpson diversity showed significant relationships with habitat diversity and area size during the breeding season. Bird diversity was similar between parks and cemeteries.
Discussion
Our results showed that urban parks and cemeteries have similar roles in conserving urban bird diversity in Neotropical cities. However, species diversity-environment relations at the continental scale varied between seasons, highlighting the importance of conducting annual studies.
Introduction
The global urban population is expected to be 60% by 2030 (United Nations, 2018), probably inducing the loss of green areas within cities (Dallimer et al., 2011). Green areas are urban habitats dominated by vegetation, generally constituting biodiversity hotspots within cities (Kong et al., 2010; Dale, 2017; Morelli et al., 2017; Zuñiga-Palacios et al., 2020). Therefore, analyzing bird-habitat relationships in urban green areas is important for guiding biodiversity conservation strategies in cities (Nielsen et al., 2014). Birds are the most studied taxa in urban green areas (Nielsen et al., 2014). They are easy to survey and identify and generally respond to environmental changes (Lepczyk et al., 2017).
Bird diversity has been regularly analyzed through several metrics, such as species richness, Shannon diversity, and Simpson diversity (Magurran, 2005; Roswell, Dushoff & Winfree, 2021). The most critical factors driving bird diversity in green areas are area size and habitat diversity (Lussenhop, 1977; Latta et al., 2013; Nielsen et al., 2014; Garizábal-Carmona & Mancera-Rodríguez, 2021). Green area size is generally positively related to species richness (Tilghman, 1987; Jokimäki, 1999; Fernández-Juricic, 2000; Donnelly & Marzluff, 2004; Chamberlain et al., 2007; Leveau et al., 2019). Large green areas may provide more habitats for species, enhancing species richness (Connor & McCoy, 1979; Kisel et al., 2011). In addition, large green areas may reduce the local extinction rates of species (MacArthur & Wilson, 1963; Murgui, 2007; Dri, Fontana & de Sales Dambros, 2021).
Anthropogenic factors such as pedestrian traffic in green areas and the surrounding urban landscape also can influence bird diversity. Increasing pedestrian rates have been negatively associated with bird diversity in urban areas (Fernández-Juricic, 2001; Chang & Lee, 2016; Xie et al., 2016). Moreover, the level of urbanization surrounding green spaces, such as the percentage of high buildings, has been negatively associated with bird diversity (MacGregor-Fors & Ortega-Álvarez, 2011; Leveau & Leveau, 2016; Morelli et al., 2021).
Urban parks are the most studied green area types regarding their effects on bird diversity (Chiesura, 2004; Alvey, 2006; Nielsen et al., 2014; Estevo, Nagy-Reis & Silva, 2017). On the other hand, cemeteries have also been identified as a potential reservoir of high biotic diversity (Barrett & Barrett, 2001; Löki et al., 2019). However, the role of cemeteries in conserving bird diversity in urban areas has been mainly in European contexts (Tryjanowski et al., 2017; Morelli et al., 2018). Meanwhile, the Neotropical region has been scarcely analyzed (Villaseñor & Escobar, 2019). In addition, most of the studies in parks and cemeteries have been performed during the breeding season (Leveau et al., 2019). Thus, an assessment of the environmental-bird diversity relationships along an annual cycle is essential (Marra et al., 2015). Due to birds during the non-breeding season having a broader habitat use, the relationships between habitat features and bird species richness might be weaker during the non-breeding season than in the breeding season (Murgui, 2007; Leveau & Leveau, 2016). Moreover, bird diversity in urban parks and cemeteries may increase during the breeding due to suitable resources for nesting in green areas compared to other urban habitats (Leveau & Leveau, 2016). Continental studies exploring the seasonal variations of bird diversity-environment relations are lacking in the Neotropics.
Global patterns of bird diversity have shown an increase in tropical regions (Fischer, 1960; Tramer, 1974; Gaston, 2000) and a general decrease in bird diversity with increasing altitude (Able & Noon, 1976; Hunter & Yonzon, 1993; Rahbek, 1995). Bird species richness in the Neotropics has been negatively related to latitude and altitude (Rabinovich & Rapoport, 1975; Rahbek, 1997; Werenkraut & Ruggiero, 2011) due to higher habitat heterogeneity and primary productivity at low altitudes and near the equator. Therefore, we expect that bird diversity in urban green areas will follow a similar trend increasing in the tropics and at low altitudes.
In this study, we conducted a continental comparative analysis of bird communities in urban parks and cemeteries of the Neotropics to analyze bird diversity–environment relations during an annual cycle. Most studies examining the continental variation of bird diversity in the Neotropics focused on species richness due to the available information on species presence/absence in distributional maps (Rabinovich & Rapoport, 1975; Rahbek, 1997; Bellocq & Gómez-Insausti, 2005). However, an analysis of different diversity components that consider the relative abundance of species, such as Shannon and Simpson diversities, may help to refine hypotheses and models of biodiversity responses to the environment (Roswell, Dushoff & Winfree, 2021). We assessed bird diversity through Hill numbers, transforming diversity indices values into the equivalent number of species (Jost, 2006). Therefore, we considered variations in species richness and the effective number of species derived from Shannon (Hill-Shannon) and the Simpson indices (Hill-Simpson) (Jost, 2006). Bird diversity is expected to increase during the breeding season, and the relationships between diversity and environmental variables should change between seasons. We expected an increase in bird diversity in the tropics and at low altitudes (Fig. 1). In addition, we expected that bird diversity would increase with area size and habitat diversity (Fig. 1).
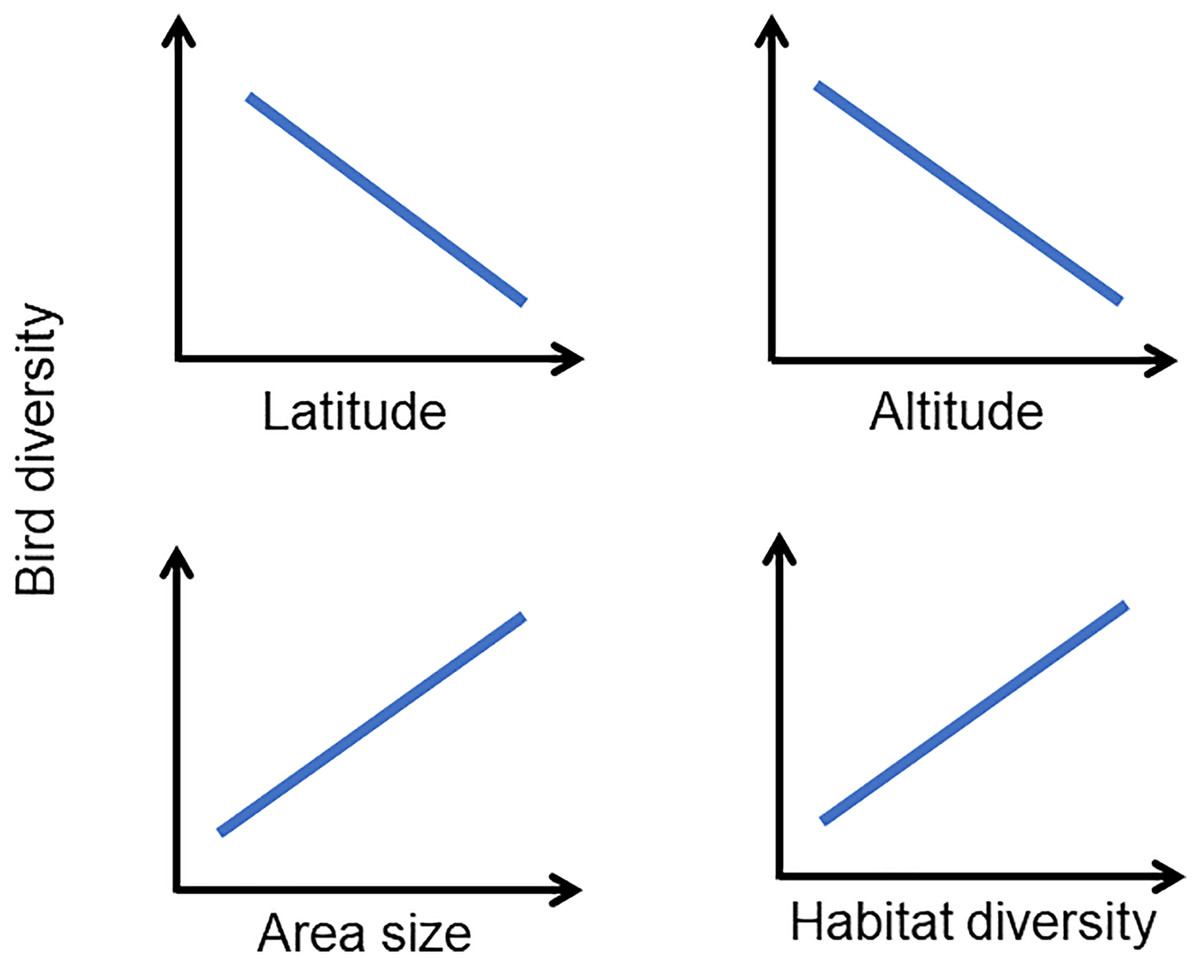
Figure 1: Conceptual schematic diagram showing the main hypotheses explaining bird diversity in urban green areas of the Neotropics.
Bird diversity is expected to increase with decreasing latitude and altitude, and increase with more area size and habitat diversity.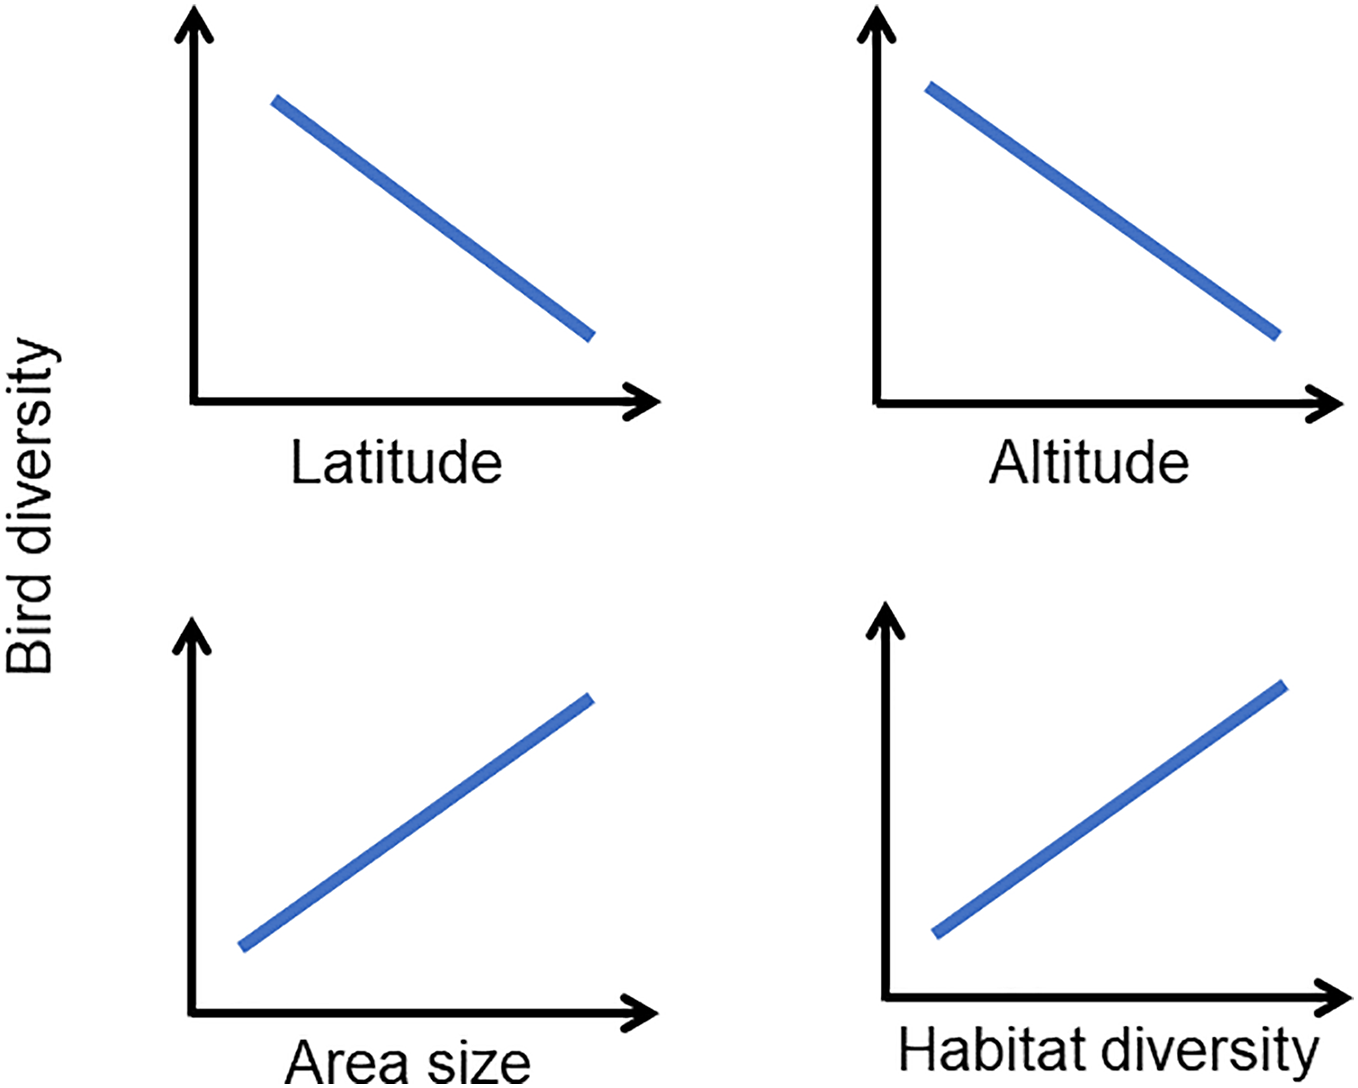
Materials and Methods
A total of 36 cemeteries and 37 parks belonging to 18 Neotropical cities were surveyed (Fig. 2; Tables S1 and S2). The cities were in eight countries with a broad range of biogeographical conditions, with latitudes between 6° N to 34° S and altitudes between 10 to 3,625 masl. However, a large portion of the tropics near the equator could not be sampled, which could affect the results obtained (see Discussion). In each city, cemeteries were selected according to availability. Then, parks with a similar size and location within the city were also chosen. Park size was estimated using Google Earth Pro (https://www.google.com/earth/versions/). Each park and cemetery was a sampling unit referred to as sites.
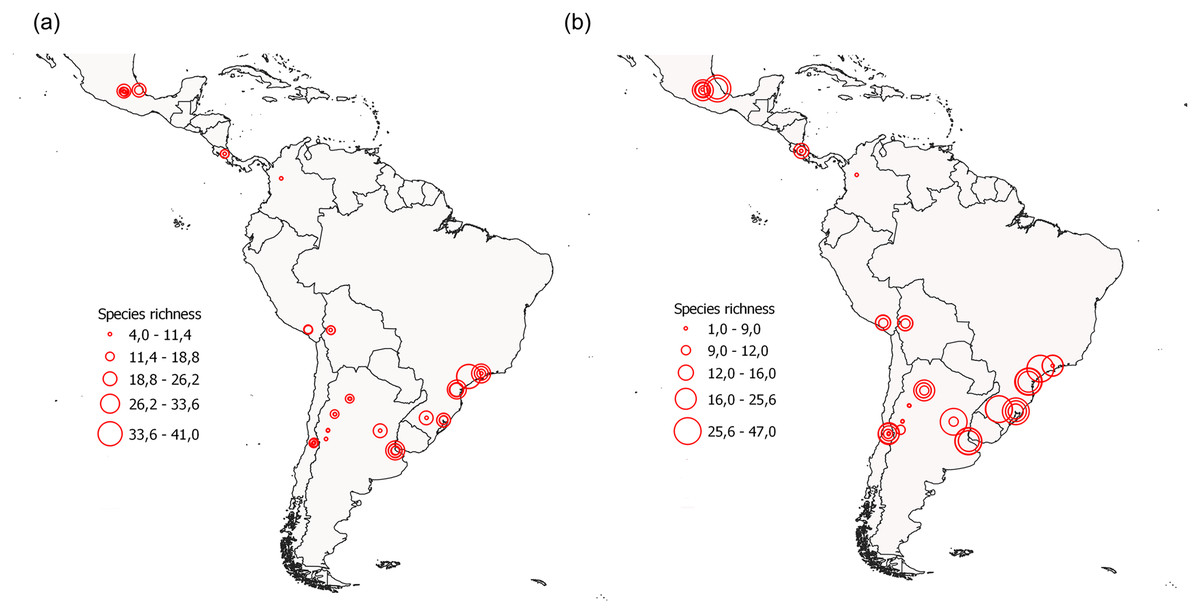
Figure 2: Location of the surveyed urban green areas, depicting their observed species richness values (red circles) during (A) the non-breeding season and (B) the breeding season.
Each circle corresponds to each green area surveyed. Note that some circles may be overlapped due to similar species richness.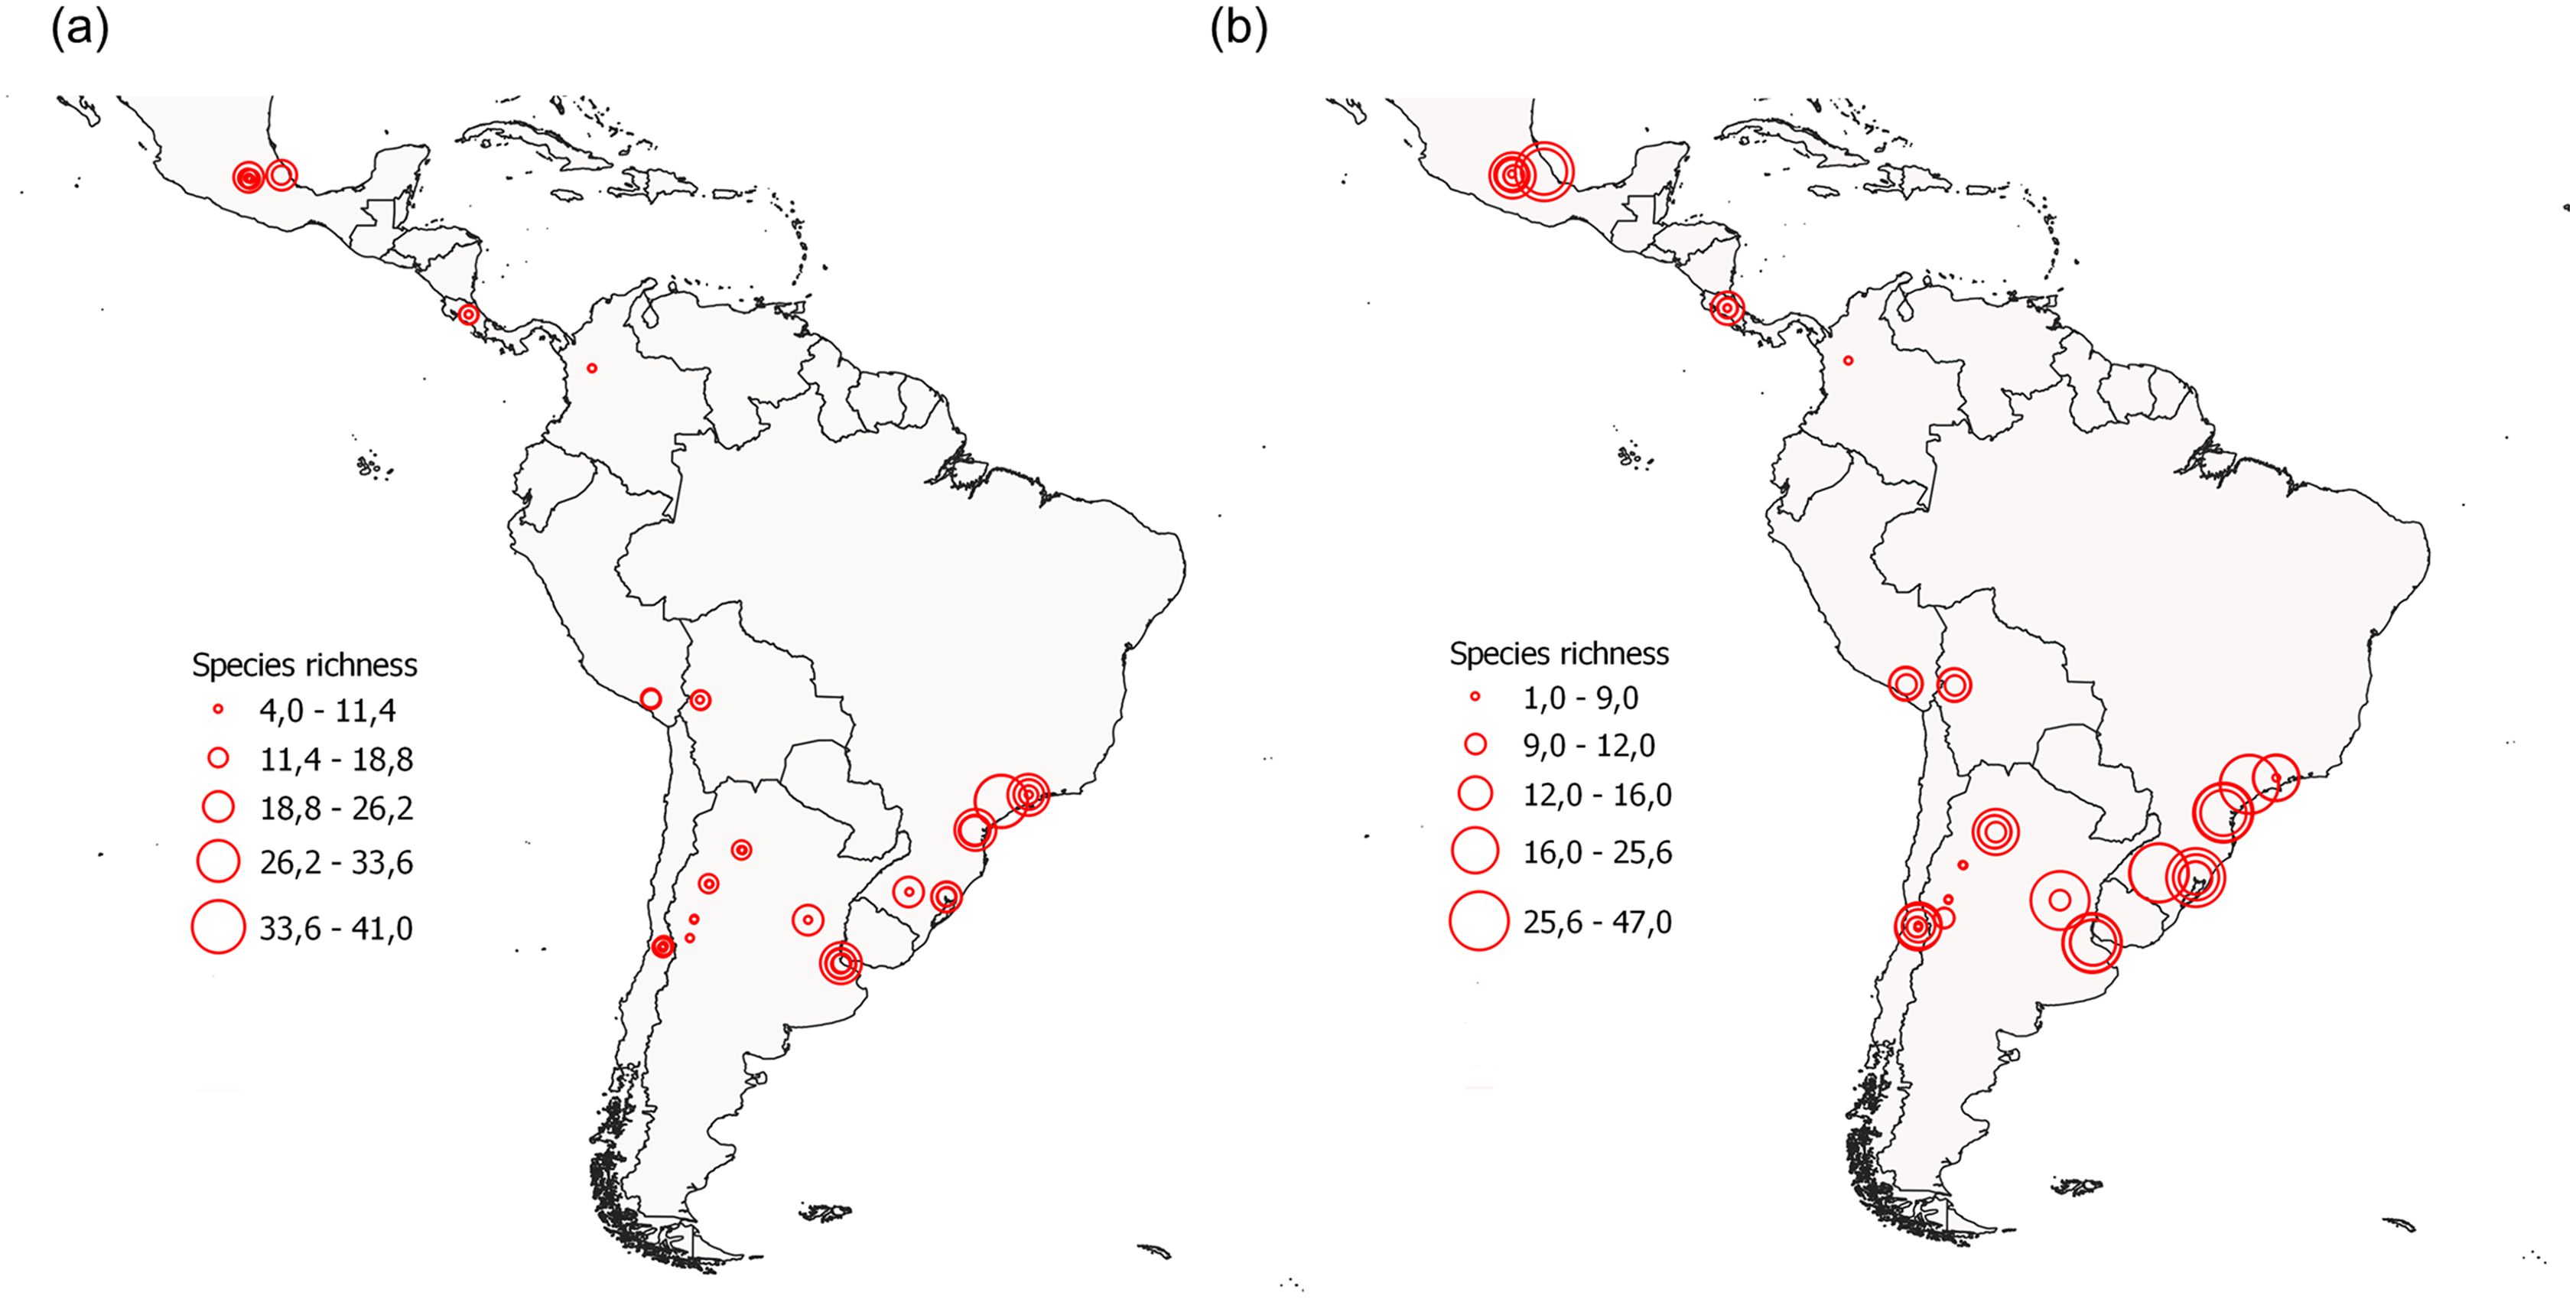
Bird surveys
The bird surveys were carried out in point counts with a radius of 100 m for 10 min, spaced at least by 200 m to ensure independence among points (Bibby, Jones & Marsden, 1998). All birds detected within the site were considered for green areas lower than 1 ha, excluding those seen outside the green space. The surveys were performed during the first 4 h after sunrise on weekdays with no rain or strong wind (Bibby, Jones & Marsden, 1998). Each point was visited twice by the same observer during the breeding season (spring) and twice during the non-breeding season (fall). In the Southern Hemisphere, the breeding season corresponded to surveys during the first 2 weeks of October and the last week of November or the first week of December. The non-breeding season corresponded to surveys during April, May or June. In the Northern Hemisphere, October–December corresponded to the non-breeding season, whereas April–June was the breeding season. The number of point counts per site ranged between one and 11, according to the space available to locate points spaced at least by 200 m. The location of points was determined by a stratified design, locating points in each microhabitat (wooded areas, lawned areas, etc.). Parks and cemeteries with less than 3 ha had one point, whereas larger sites had an increasing number of point counts proportional to their size.
Environmental variables
We analyzed eight environmental variables, at local, landscape and large spatial-scale (Table 1). Local-scale variables were within each green area, characterized by habitat diversity, habitat type, pedestrian traffic, park and cemetery area size. Habitat diversity was calculated using the Shannon index with the percent cover of built, tree, bush, grass, non-managed herbaceous vegetation, bare soil, and water. The built cover was included in habitat diversity because these areas may provide resources for birds, such as nesting places. When the percentage cover of habitat components exceeded 100% due to strata overlapping (e.g., lawn overlapped by tree canopy), values were rescaled to 100%. These variables were estimated visually in the field at each point count. The variable values were averaged for each park and cemetery in the sites with more than one point count. Habitat types were cemeteries and parks, and a discriminant analysis revealed that cemeteries had more built cover and less pedestrian traffic than parks (Fig. S1). Pedestrian traffic was calculated as the number of pedestrians passing through each point count during bird surveys (pedestrians/10 min). A mean value of pedestrian traffic was obtained for each season.
| Spatial scale | Variable | Mean | Range |
|---|---|---|---|
| Local | Habitat diversity (H′) | 1.29 | 0.30–1.78 |
| Habitat type (park, cemetery) | – | – | |
| Pedestrian traffic (pedestrians/10 min) | 15.18 | 0.5–175.5 | |
| Area (ha) | 11.48 | 0.33–97.60 | |
| Landscape | Urbanization level (urban, suburban, periurban) | – | – |
| Population | 3,493,619.61 | 41,179–22,597,699 | |
| Large-scale | Altitude (masl) | 1,085.01 | 10–3,625 |
| Latitude | 24.14 | 6.20–34.65 |
Note:
masl, meter above sea level.
Landscape variables were the surroundings of each green area within each city and characterized by the urbanization level and population size of each city. The urbanization level where each site was located was classified as urban, suburban, and periurban according to the impervious cover surrounding each area and its location in the city (see Morelli et al., 2018). The urbanization level was characterized with Google Earth Pro images by measuring impervious cover in four plots of 9 ha located in the cardinal points. Then, the four values of the impervious surface were averaged for each site. The urban level was characterized by >50% impervious (asphalted areas, buildings) cover. Suburban was characterized by <50% impervious cover within the city, whereas periurban areas were sites on the city fringe. The population size of each city was obtained from Wikipedia according to the last census information.
Large-scale variables were related to regional climate and vegetation variables and characterized by proxies such as latitude and altitude. Latitude was calculated as the mean latitude value of the point counts in each site using GPS. Altitude values for each city were obtained from Wikipedia.
Bird diversity
Bird diversity was assessed through Hill numbers, calculated with data on bird species abundance during each season. Hill numbers were estimated using the function hill_taxa of the hillR package (Li, 2018). Species richness was the total number of species in each site. Hill-Shannon diversity was the effective number of species derived from the Shannon diversity index, which gives more weight to species abundances and can be interpreted as the number of common species (Chao, Chiu & Jost, 2014). Hill-Simpson diversity was the effective number of species derived from the Simpson diversity index, which places more weight on species abundance than the Hill-Shannon index and can be interpreted as the number of dominant species (Chao, Chiu & Jost, 2014).
Statistical analysis
Differences in bird diversity between seasons in each site were analyzed through paired t-test with the function t.test of R (R Development Core Team, 2017). The relationship between the eight predictor variables (Table 1) and bird diversity was analyzed through a generalized additive mixed model (GAMM) with the function gamm4 of the gamm4 package (Wood, Scheipl & Wood, 2017). GAMMs are non-parametric regressions that model non-linear relationships between the response variable and predictors (Zuur et al., 2009). In the case of species richness, a Poisson error structure with the site as a random factor was used due to the presence of overdispersion. A Gaussian error structure was used to analyze the Hill-Shannon and Hill-Simpson diversities. Due to sites being nested within cities, the city was deemed a random factor. Heteroscedasticity and normality of residuals were checked.
Models were obtained by backward eliminating non-significant variables (P > 0.05) from the full model including the eight variables (Table 1) using the anova function. Final models were compared with null models using a Likelihood Ratio test (LRT test) (P < 0.05). Due to Pearson correlation coefficients between predictors being lower than 0.70, multicollinearity was considered low.
Results
We registered a total of 17,978 individuals belonging to 281 species (Table S3). The most abundant bird species were the Rock Dove (Columba livia), the Eared Dove (Zenaida auriculata), and the Monk Parakeet (Myiopsitta monachus) (Table S3). Bird species richness per site varied between 4 and 41 species (mean = 14.52, standard deviation = 7.48) during the non-breeding season and between 1 and 47 (mean = 16.71, standard deviation = 9.75) during the breeding season (Fig. 2). Mean bird species richness and the Hill-Shannon diversity per site were higher during the breeding season compared to the non-breeding season (richness: paired t-test = 3.66, df = 72, P < 0.001; Shannon: paired t-test = 2.01, df = 72, P = 0.048, Figs. 2, 3A and 3B). The Hill-Simpson diversity was similar between seasons (paired t-test = 1.47, df = 72, P = 0.147; Fig. 3C).
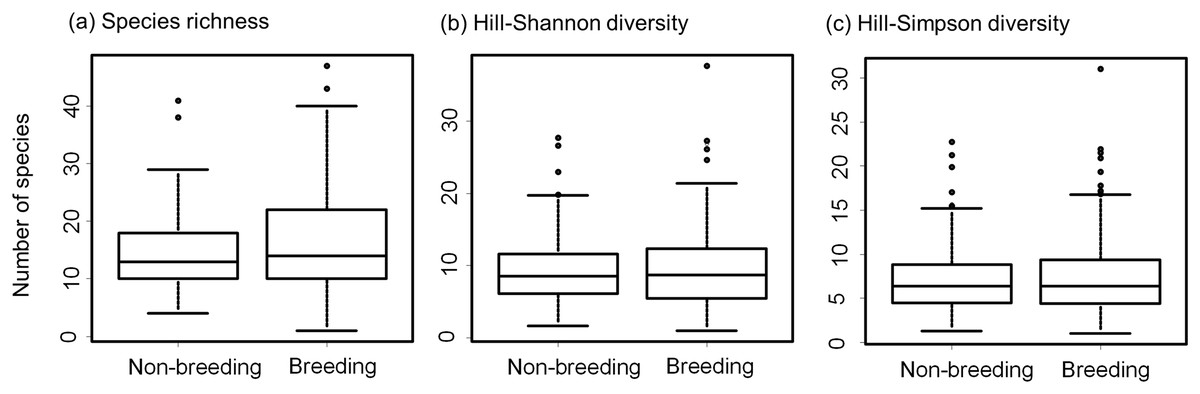
Figure 3: Bow-plots showing the seasonal variation of bird diversity in urban green areas of the Neotropics.
Box-plots show the species richness per site (A), the effective number of species derived from the Shannon index per site (B), and the effective number of species derived from the Simpson index per site (C), during non-breeding and breeding seasons in urban parks and cemeteries of the Neotropics.
During both seasons, species richness was significantly related to area size, latitude, and altitude (non-breeding: LRT = 31.69, df = 12, P = 0.002, r2 = 0.49; breeding season: LRT = 30.91, df = 6, P < 0.001, r2 = 0.47; Tables 2a and 2b). Species richness was the highest at 20° latitude (Figs. 2, 4A and 4B), whereas it had a negative relationship with altitude (Figs. 4A and 4B). The relationship between species richness and area size changed between seasons, being positive during the non-breeding season and showing an asymptote from 50 ha during the breeding season (Figs. 4A and 4B).
| Season | Predictor | Estimate | SE | edf | t/Chi.sq/F | P |
|---|---|---|---|---|---|---|
| (a) NB Species richness | Intercept | 2.443 | 0.135 | 18.144 | <0.001 | |
| Habitat-Suburban | 0.339 | 0.165 | 2.049 | 0.041 | ||
| Habitat-Urban | 0.153 | 0.137 | 1.120 | 0.263 | ||
| Pedestrian | 1.000 | 4.210 | 0.040 | |||
| Area (ha) | 1.000 | 9.638 | 0.002 | |||
| Latitude | 2.652 | 13.938 | 0.003 | |||
| Habitat diversity (H′) | 1.000 | 5.448 | 0.019 | |||
| Altitude (m) | 1.000 | 6.108 | 0.014 | |||
| (b) B Species richness | Intercept | 2.703 | 0.084 | 32.080 | <0.001 | |
| Area (ha) | 2.115 | 38.360 | <0.001 | |||
| Latitude | 3.064 | 19.220 | <0.001 | |||
| Altitude (m) | 1.354 | 4.890 | 0.032 | |||
| (c) NB Hill-Shannon | Intercept | 9.717 | 0.935 | 10.390 | <0.001 | |
| Area (ha) | 1.000 | 4.222 | 0.044 | |||
| Latitude | 4.603 | 3.348 | 0.007 | |||
| Habitat diversity (H′) | 1.000 | 7.020 | 0.010 | |||
| d) B Hill-Shannon | Intercept | 11.036 | 1.514 | 7.290 | <0.001 | |
| Area (ha) | 1.945 | 9.948 | <0.001 | |||
| Habitat diversity (H′) | 1.234 | 7.312 | 0.009 | |||
| (e) NB Hill-Simpson | Intercept | 7.519 | 1.098 | 6.849 | <0.001 | |
| (f) log(B Hill-Simpson) | Intercept | 8.449 | 1.230 | 6.868 | <0.001 | |
| Area | 1.642 | 7.885 | 0.001 | |||
| Habitat diversity (H′) | 1.000 | 5.002 | 0.029 |
Note:
Final models showing the relationship between species richness (SR), Hill-Shannon (SH) diversity, Hill-Simpson (SI) diversity and environmental variables of urban parks and cemeteries in the Neotropics during the non-breeding (NB) and breeding (B) seasons SE: standard error; edf: estimated degrees of freedom.
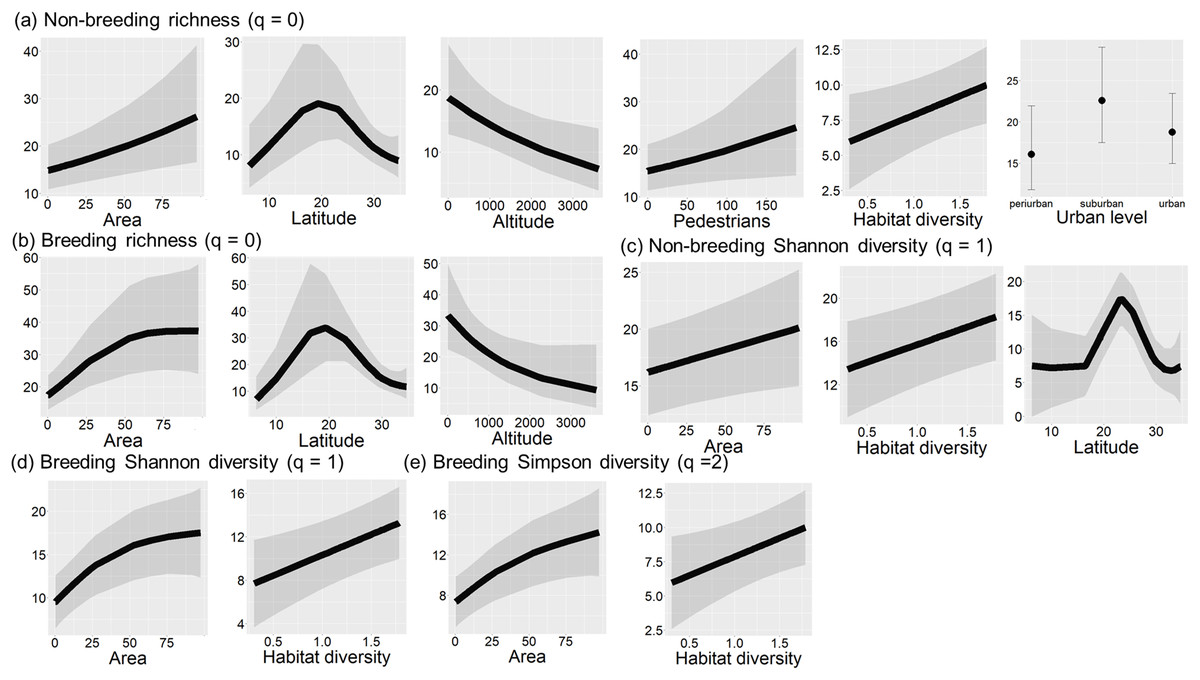
Figure 4: Final models of bird diversity-environment relationships in urban green areas of the Neotropics.
Significant relationships (P < 0.05) between species richness and environmental variables during the non-breeding season (A) and breeding season (B), between Hill-Shannon diversity and environmental variables during non-breeding (C) and breeding season (D), and between Hill-Simpson diversity and environmental variables during the breeding season (E). Black lines are fitted models, and grey bands are 95% confidence intervals.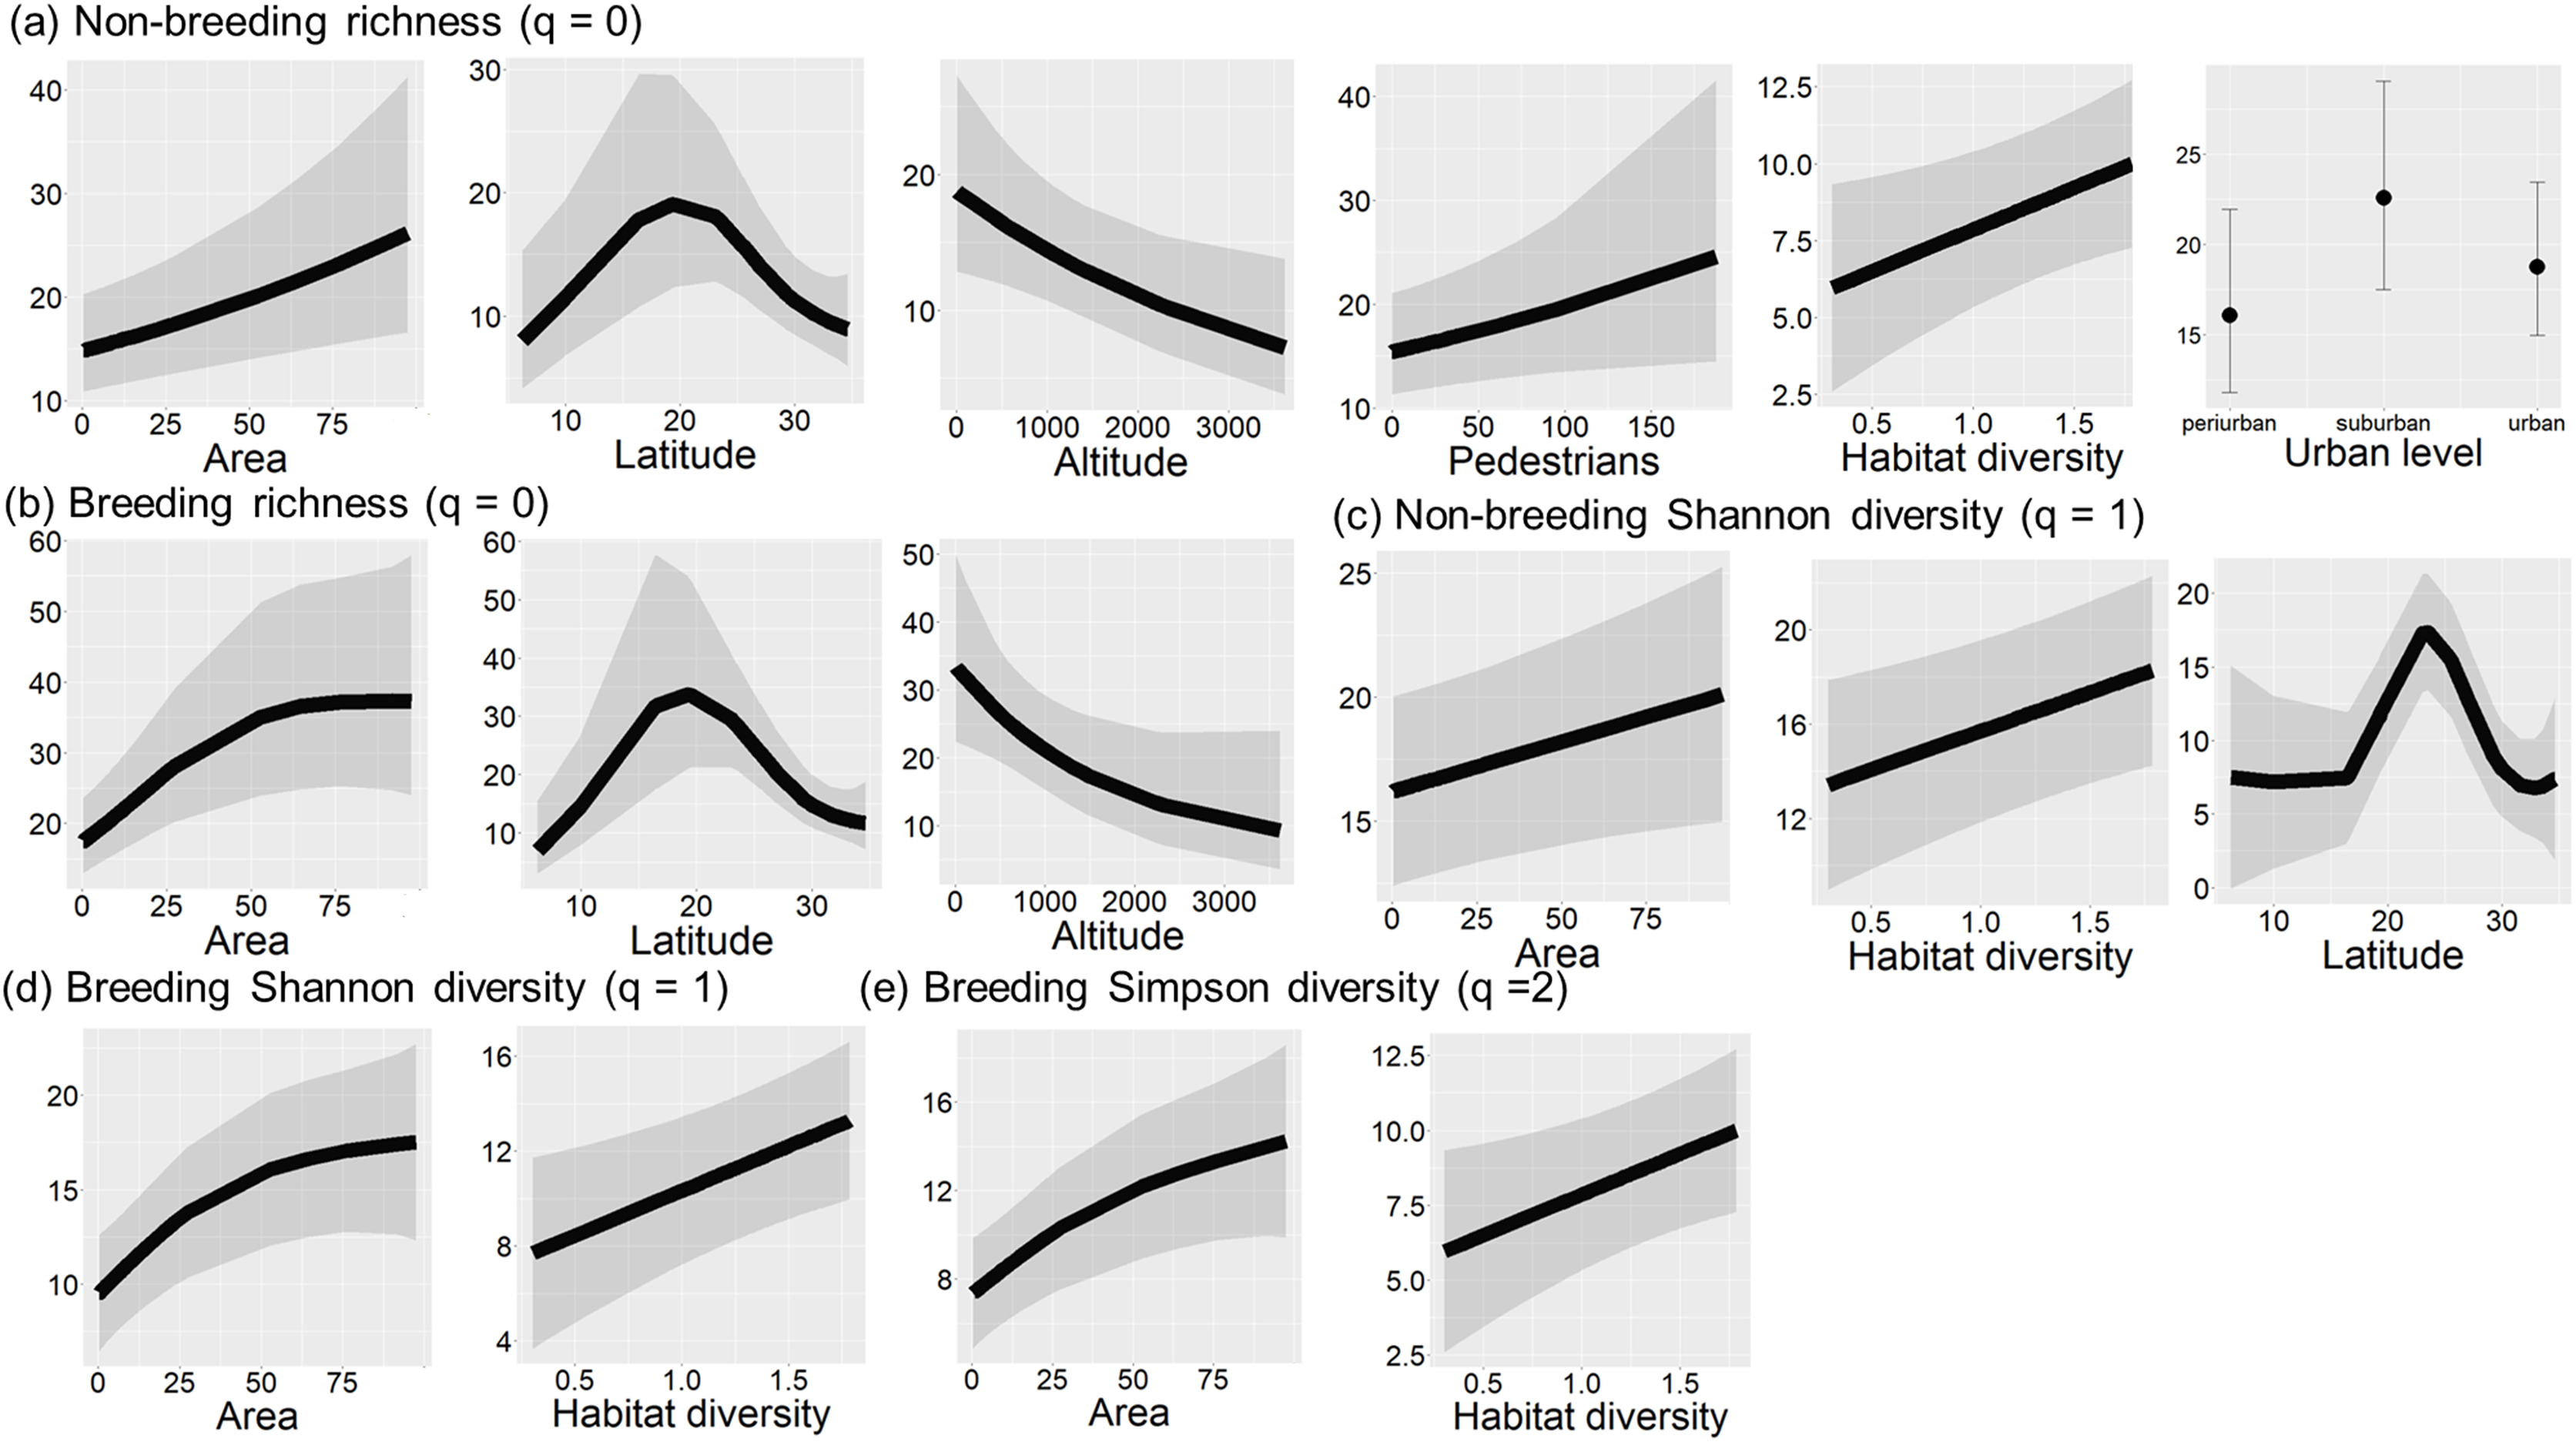
Urbanization level, pedestrian traffic, and habitat diversity only showed significant relationships during the non-breeding season. Bird species richness was higher in suburban landscapes and showed a positive relationship with pedestrian traffic (Fig. 4A). Moreover, bird richness positively correlated with habitat diversity (Fig. 4A).
The Hill-Shannon diversity during the non-breeding season was significantly related to latitude, area size and habitat diversity (LRT = 13.33, df = 6, P = 0.038, r2 = 0.48; Table 2c). The Hill-Shannon diversity increased with increasing area size and habitat diversity and had the highest values between 20° and 30° latitude (Fig. 4C). During the breeding season, the Hill-Shannon showed a positive relationship with area size and habitat diversity (LRT = 24.85, df = 4, P < 0.001, r2 = 0.06; Table 2d and Fig. 4D).
The Hill-Simpson diversity during the non-breeding season was not significantly related to any predictor (LRT = 6.50, df = 4, P = 0.165; Table 2e). During the breeding season, the Hill-Simpson diversity increased with increasing area size and habitat diversity (LRT = 21.27, df = 4, P < 0.001, r2 = 0.03; Table 2f and Fig. 4F).
The remaining explanatory variables, such as habitat type and the population did not have a significant relationship with any bird diversity index.
Discussion
Our results showed that species richness and the Hill-Shannon diversity were higher during the breeding season than in the non-breeding season in urban green areas of the Neotropics. In addition, species richness decreased with increasing altitude and increased at intermediate latitudinal values (between 20° and 30° latitude). Species richness was positively related to green area size during both seasons. However, the relationship between bird diversity and environmental variables was weaker during the non-breeding season and when considering Hill-Shannon diversity and Hill-Simpson diversity.
The increase in species richness during the breeding season could be related to three main factors. Firstly, species richness may increase due to the arrival of migrant species to temperate and subtropical cities in the Neotropics (Joseph, 1997; Jahn et al., 2020), such as the Fork-tailed Flycatcher (Tyrannus savana) and the Grey-breasted Martin (Progne chalybea) (Table S3). Secondly, bird species may be more present in green areas during breeding because these habitats provide suitable nesting places. Outside the breeding season, birds have a broader habitat use because they mainly focus on finding food (Murgui, 2007). Therefore, species may use other urban habitats, such as wooded streets or residential areas. Thirdly, bird species during the breeding season may be more conspicuous and, therefore, detectable because of their territorial behavior including vocalizations and displays.
The relationship between bird diversity and environmental variables was weaker during the non-breeding season. For example, the Hill-Simpson diversity showed no significant associations with the environmental variables. This pattern could be related to birds’ broader habitat use during the non-breeding season (Murgui, 2007).
Although the species richness and the Hill-Shannon diversity increased during the breeding season, the Hill-Simpson diversity did not change significantly. Hill-Simpson diversity gives more weight to dominant species than the Hill-Shannon diversity, and species richness considers dominant, common, and rare species (Roswell, Dushoff & Winfree, 2021). Therefore, the patterns found suggest that the most significant seasonal change of species diversity in the green areas of the Neotropics is related to the change of rare species, which could respond to the availability of rare resources.
In general, the three components of bird diversity were positively associated with green area size during both seasons. This result agrees with a recent meta-analysis (Leveau et al., 2019), which found that green area size has a consistent global positive relationship with species richness in urban areas. Moreover, studies conducted at large scales in parks and cemeteries in Europe also found a positive relationship between species richness and area size (Tryjanowski et al., 2017; Morelli et al., 2018). The shape of the species-area relationship was asymptotic during the breeding season, suggesting that areas of 50 Ha are sufficient to conserve bird species. However, during the non-breeding season, the relationship was linear, indicating that the continuous increase in area size promoted the presence of more species. Therefore, our results highlight the importance of annual studies for a better understanding of the species-area relations in urban areas.
Habitat diversity was the second most important predictor of bird diversity in the green areas, related to different bird diversity components in both seasons. A similar proportion of habitat features, such as different vegetation strata, may provide food resources and shelter more bird species (MacArthur & MacArthur, 1961; Tews et al., 2004; Leveau, 2013).
Bird diversity was similar between habitat types. This result agrees with those found by Morelli and colleagues in Europe (Tryjanowski et al., 2017; Morelli et al., 2018). Therefore, our continental analyses support the idea that cemeteries work similarly to urban parks, maintaining a similar avian diversity.
The results showed that several bird diversity components increased between 20° and 30° latitude. This pattern disagrees with other authors in the Neotropics (Rahbek, 1997; Herzog, Kessler & Bach, 2005; Bellocq & Gómez-Insausti, 2005), who described an increasing bird species richness approaching the Equator. Our results may be related to a lack of sampling in the equatorial area. Alternatively, our tropical sites were dominated by Brazilian cities located between 20° and 30° latitude and surrounded by the Atlantic Forest, a biodiversity hotspot (Chapa-Vargas et al., 2019). Therefore, higher bird diversity in the regional pool surrounding cities could influence the species richness in urban green areas. However, the composition of plant species in green spaces, a variable that was not measured in our study, also could influence the bird diversity. Bird diversity has shown a positive relationship with native vegetation (White et al., 2005; De Castro Pena et al., 2017). Several studies have shown that native trees in urban areas are more common in tropical cities than in temperate cities of the Neotropics (Leveau & Leveau, 2006; Barbosa de Toledo, Donatelli & Batista, 2012; De Castro Pena et al., 2016). Therefore, more native vegetation species may favor bird diversity in urban green areas of the tropics.
As predicted, bird diversity declined with increasing altitude. In general, studies conducted in urban areas have also found a negative relationship between species richness and altitude (Bhatt & Joshi, 2011; Morelli et al., 2018), probably due to the decrease of temperature and habitat resources at high altitudes (Kim et al., 2018). However, other studies have found no or positive relationship between species richness and altitude in urban areas (Sorace & Gustin, 2008; Daniels & Kirkpatrick, 2006; Villegas & Garitano-Zavala, 2010). Differences among studies may be related to variations in the scale of analysis, site’s altitude range and the biogeographic context of studies (Rahbek, 2005; Werenkraut & Ruggiero, 2011). On the other hand, the relationship between bird diversity and altitude disappeared when we considered common or dominant species. Therefore, our results suggest that diversity-altitude patterns were mainly driven by variations of rare species, which tracked the availability of rare resources or had physiologic limitations due to low temperatures. For example, the Violaceus Euphonia (Euphonia violacea) was only recorded in a park of Curitiba, located in the tropical lowlands of eastern Brazil.
Our results showed that pedestrian traffic was positively related to species richness during the non-breeding season. This pattern contrasts with other studies that have found a negative relationship between bird diversity and pedestrian traffic (Chang & Lee, 2016; Leveau & Leveau, 2016) or no relation between both variables (Fernández-Juricic, 2004; Beninde, Veith & Hochkirch, 2015; Liordos et al., 2021). The positive relationship between pedestrians and bird species richness could be related to food provided by humans to birds.
Bird species richness increased in sites surrounded by suburban landscapes. The heterogeneity of suburban landscapes, composed of buildings and green areas (Leveau, 2019), can favor the presence of a greater number of species in parks and cemeteries. This result partially agrees with other studies conducted at local scales (MacGregor-Fors & Ortega-Álvarez, 2011; Leveau & Leveau, 2016; Villaseñor & Escobar, 2019), where species richness increased in green areas surrounded by low urban cover. However, the large-scale analysis of urban parks and cemeteries conducted in Europe (Clergeau, Jokimäki & Savard, 2001; Morelli et al., 2018) revealed no differences in the species richness of these urban green areas and the urbanization level surrounding them.
Although the researchers of this study had experience working with bird communities in urban areas, some bias can exist regarding bird detectability and habitat characterization. Therefore, the results obtained must be taken with caution.
Conclusions
Our analysis of environmental drivers of species diversity in urban green areas of the Neotropics revealed that the use of different components of bird diversity had other relations with the environmental predictors. However, area size and habitat diversity consistently showed a positive relationship with the different components of bird diversity. Cemeteries and parks had similar support for bird diversity to urban parks. Therefore, conserving large green areas and creating heterogeneous environments with different vegetation layers are fundamental for bird conservation in Neotropical cities. On the other hand, our results highlight the importance of considering the entire annual cycle for a better understanding of the species diversity-environment relations in urban areas.
Supplemental Information
Environmental information of the cities included in the analysis and with the amount of parks and cemeteries surveyed in each city.
In brackets are the number of points surveyed.
List of species and their abundances in Neotropical urban parks and cemeteries.
Environmental differences between parks and cemeteries.
Boxplots showing the two variables that best discriminated between parks and cemeteries in urban areas of the Neotropics, based of Discriminant function analysis (Correctness rate = 0.8). (a) Percent cover of Built, and (b) Pedestrian/10 min.