
Impact of fertilization with reducing in nitrogen and phosphorous application on growth, yield and biomass accumulation of rice (Oryza sativa L.) under a dual cropping system
- Published
- Accepted
- Received
- Academic Editor
- Mirza Hasanuzzaman
- Subject Areas
- Agricultural Science, Plant Science, Soil Science, Environmental Impacts
- Keywords
- Rice, Reducing NPK fertilization, Dry matter, Leaf Area Index, Cultivar, Yield
- Copyright
- © 2021 Wu et al.
- Licence
- This is an open access article distributed under the terms of the Creative Commons Attribution License, which permits unrestricted use, distribution, reproduction and adaptation in any medium and for any purpose provided that it is properly attributed. For attribution, the original author(s), title, publication source (PeerJ) and either DOI or URL of the article must be cited.
- Cite this article
- 2021. Impact of fertilization with reducing in nitrogen and phosphorous application on growth, yield and biomass accumulation of rice (Oryza sativa L.) under a dual cropping system. PeerJ 9:e11668 https://doi.org/10.7717/peerj.11668
Abstract
The current farming system in China is heavily reliant on synthetic fertilizers, which adversely affect soil quality and crop production. Therefore, the aim of this study was to assess the effect of different nitrogen (N) and phosphorous (P) fertilizer application rate on the growth, yield, and yield components of rice cultivars in the Binyang, Beiliu and Liucheng sites of southern China in the early (March to July) and late season (August to December). The study consisted of three fertilization regimes—CK (N0P0); N180P90 (180 kg N + 90 kg P2O5 ha−1) and N90P45 (90 kg N ha−1 + 45 kg P2O5)—conducted at each of three different experimental sites with four cultivars (Baixang 139, Y Liangyou 1, Guiyu 9, and Teyou 582). Results showed that the leaf area index (LAI) was 38.8% found higher in Guiyu 9 compared with Baxiang at reduced fertilization (N90P45). N90P45 resulted higher dry matter production at the heading (9411.2 kg ha−1) and maturity (15319.5 kg ha−1) stages in Teyou 582 at Beiliu. Fertilization (N180P90) had higher effective panicle number (4,158,800 panicle ha−1) and grains panicle−1 (113.84 grains) compared with other treatments. Teyou 582 treated with N90P45 and Y Liangyou 1 treated with N180P90 improved seed setting rate average by 82.91% and 72.17% compared with other treatments at Beiliu in both seasons, respectively. N0P0 and N90P45 increased the thousand-grain weight (TGW) of Y Liangyou 1 at Binyang (27.07 g) and Liucheng (27.84 g) during the early and late seasons, respectively. In Beiliu, the N90P45 treatment (6611.7 kg ha−1) of Teyou 582 increased grain yield compared with other treatments. Overall, our results suggested that reducing N and P at the ratio of 90:45 kg ha−1 in Teyou 582 and Y Liangyou 1 could increase rice grain yield and yield components.
Introduction
The steady rise of fertilizer use in global agriculture over the past century has made a major contribution to the development of modern farming. It has improved overall global agricultural productivity, crop yields, and soil fertility. As a result of increased fertilizer use, agriculture production, crop yield and soil fertility were increased globally (Wehmeyer, de Guia & Connor, 2020). Since its introduction during the Green Revolution in the 1960s, synthetic fertilizer has been an essential factor of Asian agriculture (Lu & Tian, 2017). China used 26.7% of global fertilizers in 2014, resulting in China the world’s largest consumer of fertilizer (Heffer, Gruère & Roberts, 2014). A study reported that farmers in China reached an extremely high average NPK fertilizer application rate of 559.8 kg ha−1 (Wehmeyer, de Guia & Connor, 2020). In particular, the use of N fertilizer in rice cultivation usually overtakes 250 kg ha−1 (Ali et al., 2020), which is approximately higher than the global average.
The increase in the world population has led to increases in the demand for food. However, meeting this increased demand by enhancing crop production in current conventional farming systems is a major challenge. Nitrogen (N) has a significant effect on plant growth and production under various environmental conditions (Ullah et al., 2021; Leghari et al., 2016). The application of N through chemical fertilizer is the primary source of N in crop production (Tao et al., 2015; Ali et al., 2019), yet the excessive use of chemical fertilizer adversely affects soil health, the environment, and crop production (Ali et al., 2020). Furthermore, the overuse of N fertilization enhances plant growth (Iqbal et al., 2020) and decreases grain quality (Iqbal et al., 2021) and grain yield (Zörb et al., 2010). The constant increase in N fertilizer application in paddy rice production in China has led to low N use efficiency. According to the Chinese Ministry of Agriculture in 2015, the utilization rates of N, phosphorus (P), and potassium (K) fertilizers in three major cereal crops (i.e., rice, wheat, and maize) are only 33%, 24%, and 42%, respectively (Bai et al., 2016). The excessive application of N fertilizer and the low N use efficiency in paddy fields leads to a large loss of N fertilizer. The annual planting area of rice in China is 30 million hectares (Gao et al., 2014). According to Beckinghausen et al. (2020), at least 1.8 million tons of N fertilizer (pure N) are wasted every year. This is a major global challenge to feed the growing global population by increasing crop yield and quality while minimizing environmental costs. P fertilization plays a critically important role in improving rice yield. However, its utilization efficiency during agricultural consumption is low in China, which results in a serious wastage of phosphate rock resources (Li et al., 2014). Excessive fertilizer application not only leads to waste but also increases the planting costs of producers. Currently, approximately 67% of the world’s cultivated land can be found lacking in P (Dhillon et al., 2017). P deficiency in China is particularly severe, with approximately two-thirds of the cultivated land lacking P (Zhou et al., 2017a). Given that soil P deficiency is one of the main factors limiting crop yields, there is a need for more work to maximize P utilization efficiency.
Rice is the staple food of more than half of the world’s population and almost 60% of China (Zhao et al., 2020). Rice yield is mainly associated with N and P application rate (Iqbal et al., 2019), but N and P management is often modified depending on rice type, cultivar, geographic zone, and other crop practices (Angus et al., 1994; Hirzel et al., 2020). Additionally, rice yield can be induced through variety selection and improvements in cultivation technology (Cai, Liang & Wan, 2010). The selection of hybrid cultivars has a higher return compared with conventional rice (Lin et al., 2020). Furthermore, rice yield is associated with the photosynthetic products of leaves and the photosynthetic attributes rates (Acevedo-Siaca et al., 2020). Thus, increasing plant biomass is a direct way to improve rice yield, as rice cultivars with higher biomass, higher leaf area index, and high biological yield are considered more desirable.
Identifying N and P-efficient cultivars requiring minimal fertilizer application is important for improving the yield and quality of rice as well as for environmental protection (Zhou et al., 2017b). The objective of this study was to assess differences in the growth, biomass accumulation, and grain yield of cultivars under high and low N and P fertilization rates at different experimental sites.
Materials and Methods
Experimental sites and weather
The field experiments were conducted at three locations: (1) Binyang, Nanning, China (23°0635″N, 108°5912″E); (2) Beiliu, Yulin, China (22°4419″N, 110°1032″E); and (3) Liucheng, Liuzhou, China (24°44197″N, 109°0418″E) during the early (March to July) and late season (August to December) in 2019. The basic soil physicochemical properties of the experimental fields before the experiments are shown in Table 1.
| Site | pH | OC (g kg−1) | TN (g kg−1) | AN (mg kg−1) | AP (mg kg−1) | AK (mg kg−1) |
|---|---|---|---|---|---|---|
| Binyang | 5.28 | 33.47 | 2.07 | 147 | 124.13 | 194 |
| Beiliu | 4.89 | 22.76 | 1.31 | 161 | 380.12 | 115 |
| Liucheng | 8.08 | 42.35 | 2.74 | 206.5 | 104.5 | 81 |
Note:
OC, organic carbon; TN, total nitrogen; AN, available nitrogen; AP, available phosphorous; AK, available potassium.
The soils of Binyang and Beiliu are relatively acidic, and the soil of Liucheng is relatively alkaline (Table 1). The content of organic carbon and available N is higher in Liucheng soil than in Binyang and Beiliu soils. The content of available P is higher in Beiliu soil compared with the soils of Binyang and Liucheng. Our previous study at the same experimental sites was conducted with the same cultivars, which show no significant effect among experimental sites for rice yield. However, their results were significant among the treatments across the experimental sites (Xie et al., 2021).
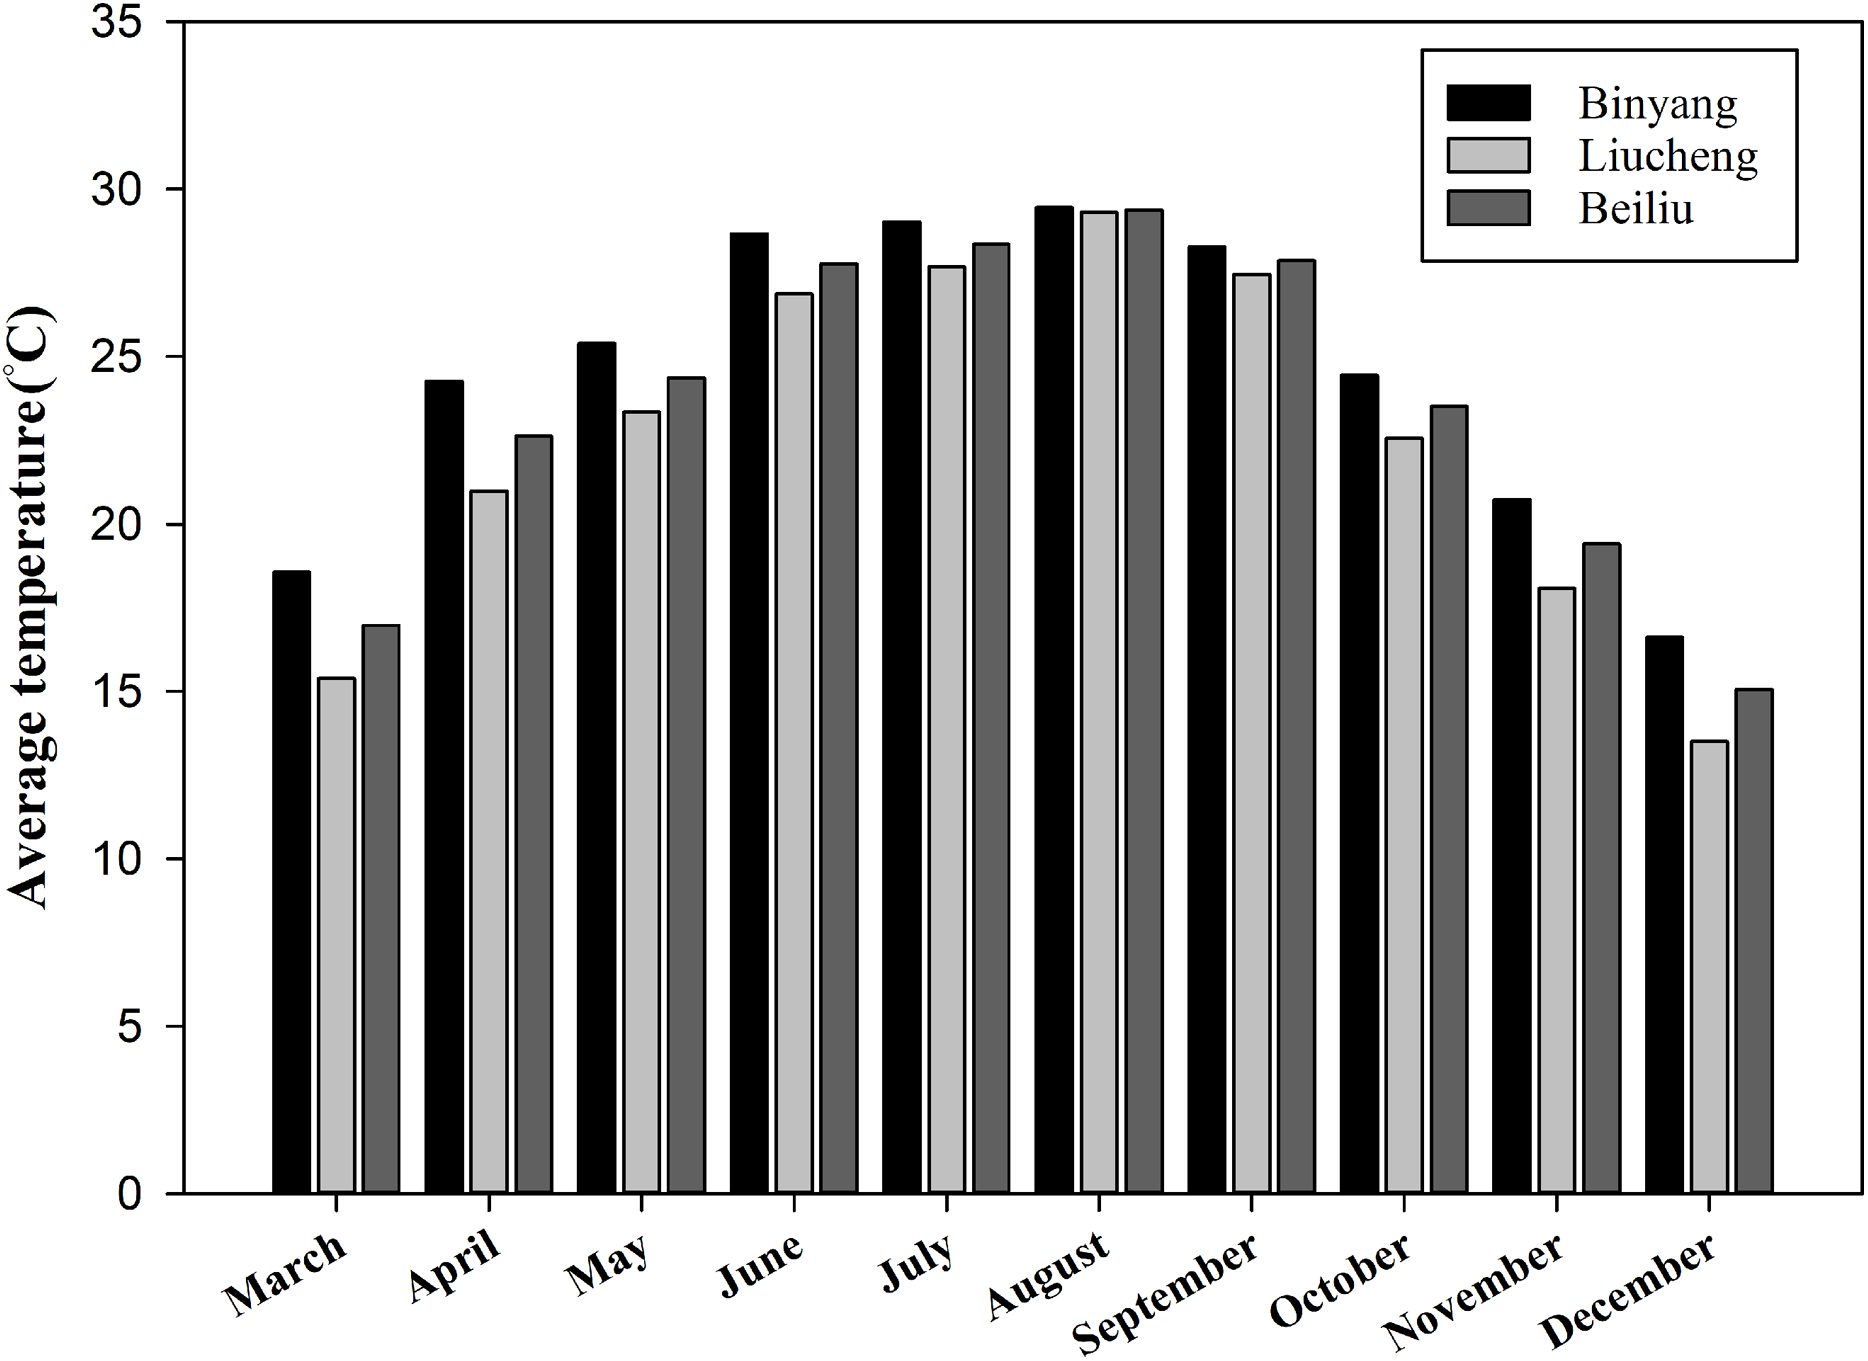
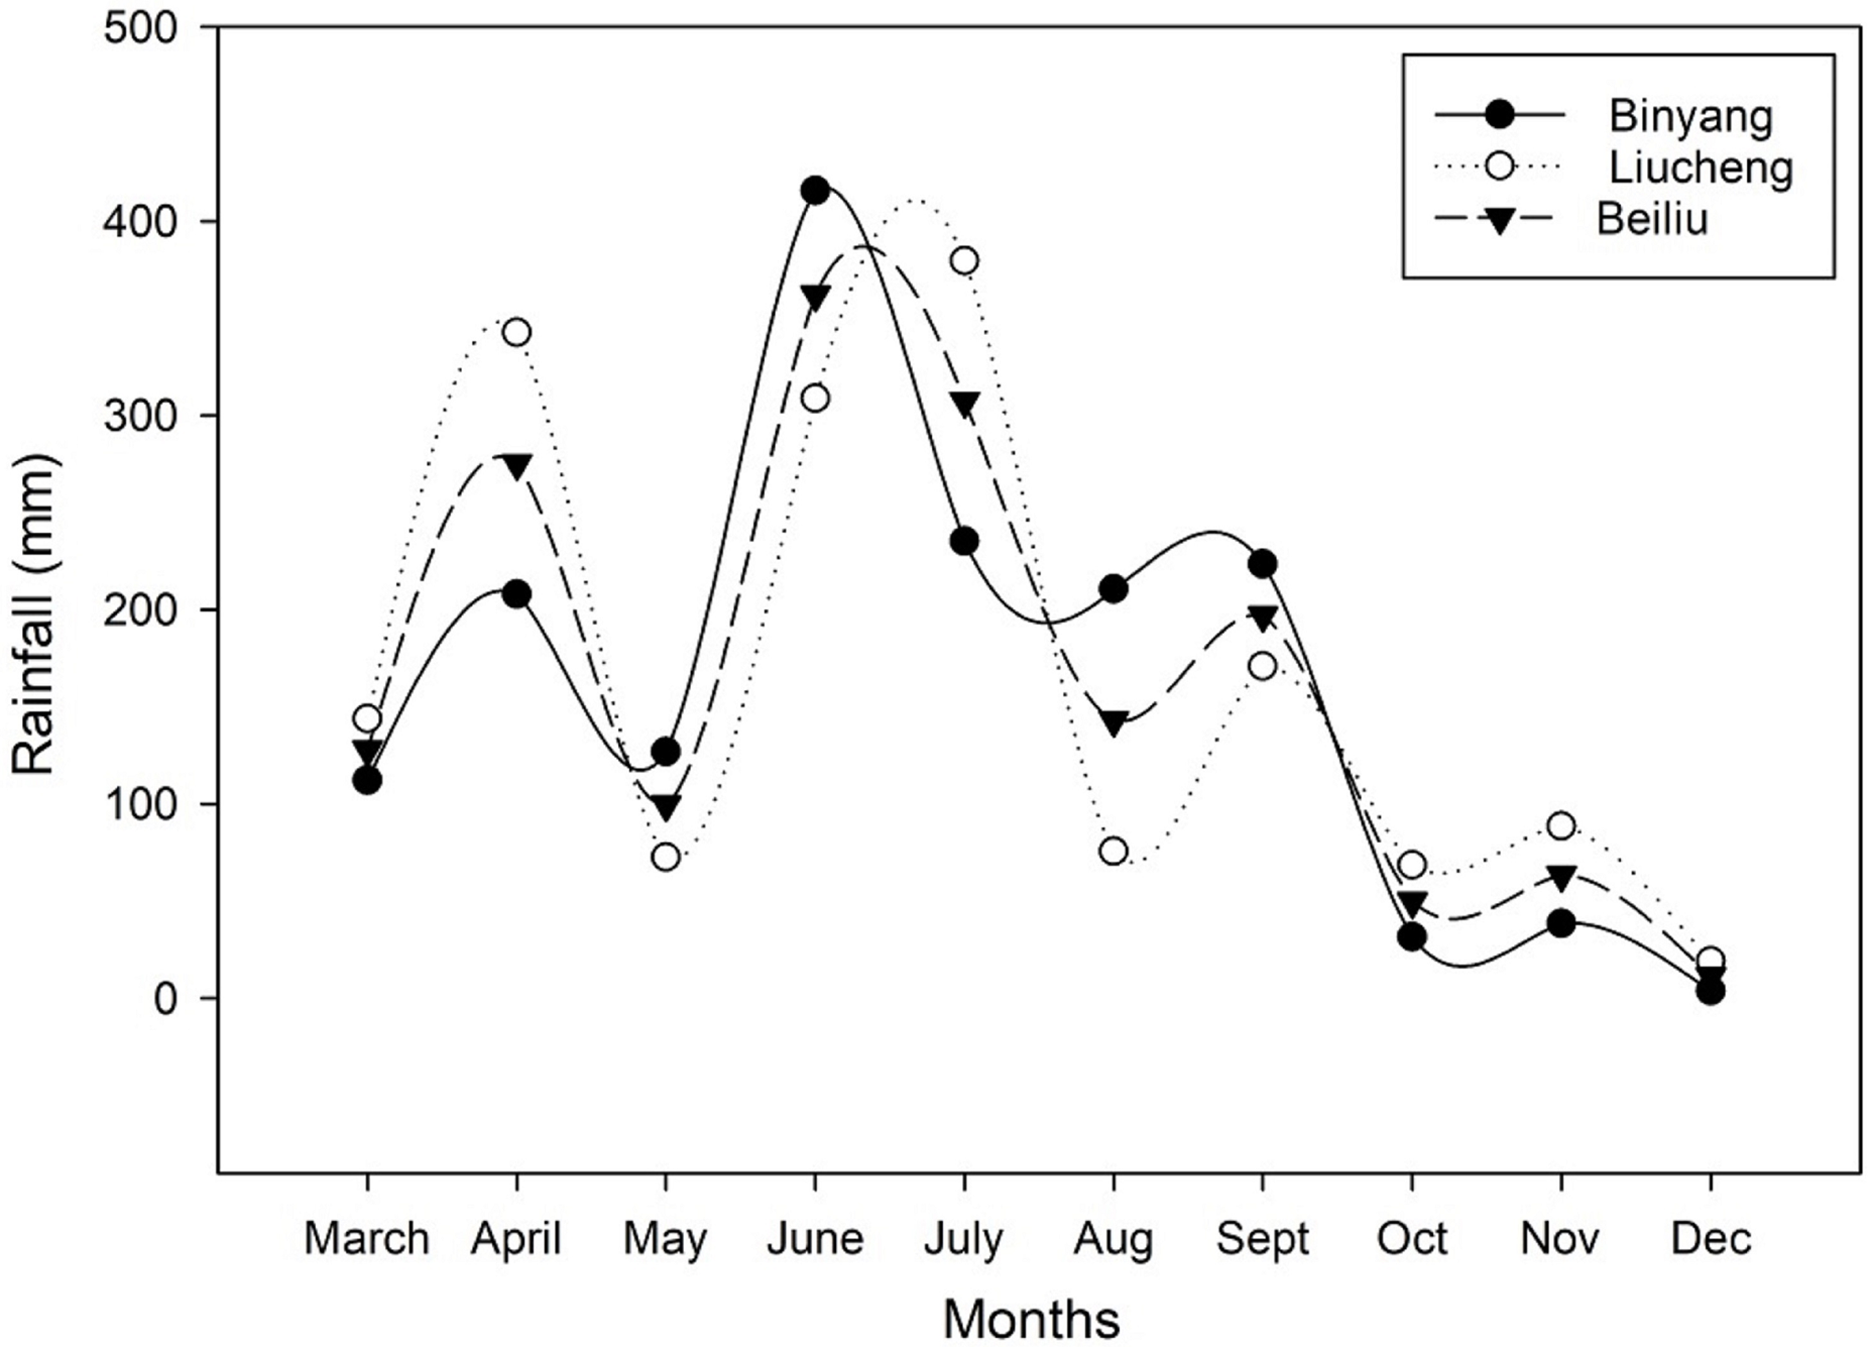
Figure 1 shows the temperature of the experimental sites collected from local metrological stations. The maximum temperature in August an average 28 °C, and the minimum temperature in December an average 10 °C. Figure 2 shows that the average rainfall of the three sites was concentrated in the early season (March to July) and late season (August to December).
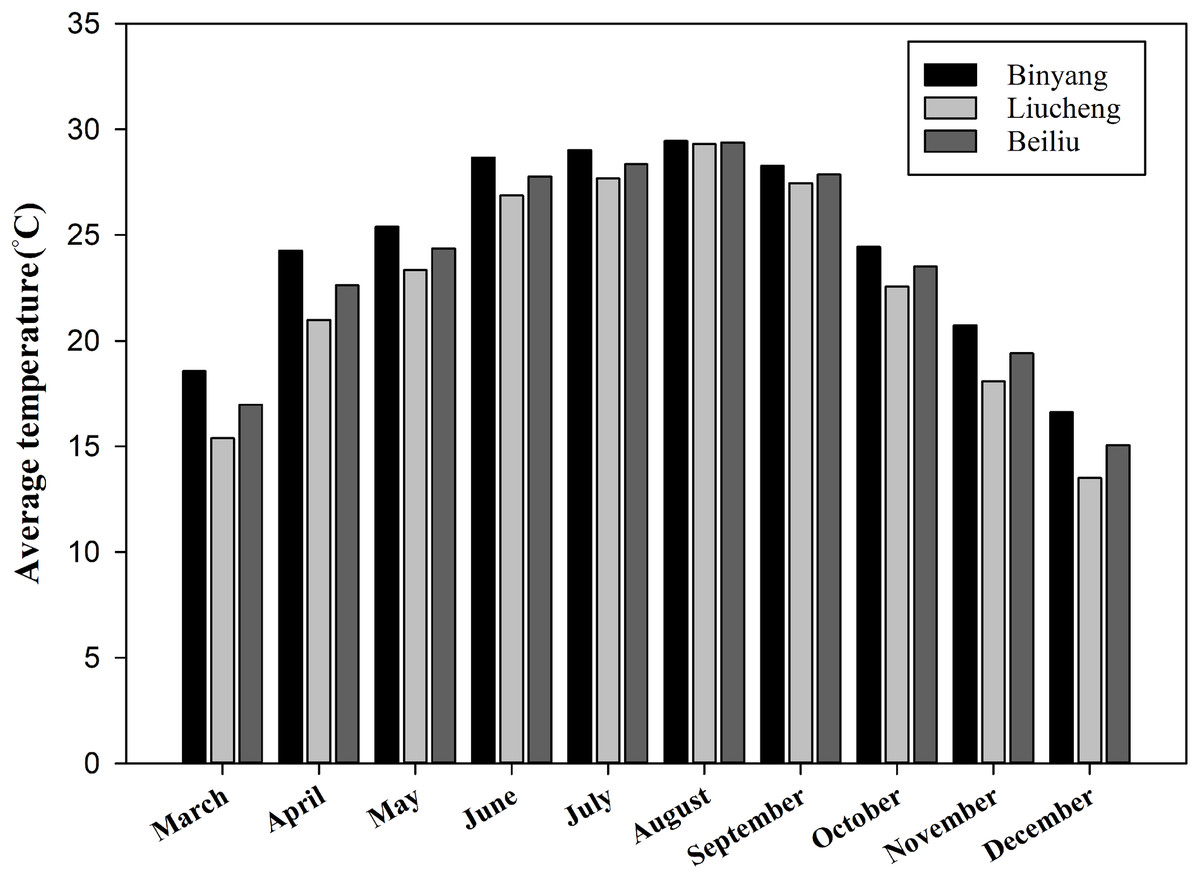
Figure 1: Average temperature of Binyang, Liucheng and Beiliu throughout the growing season.
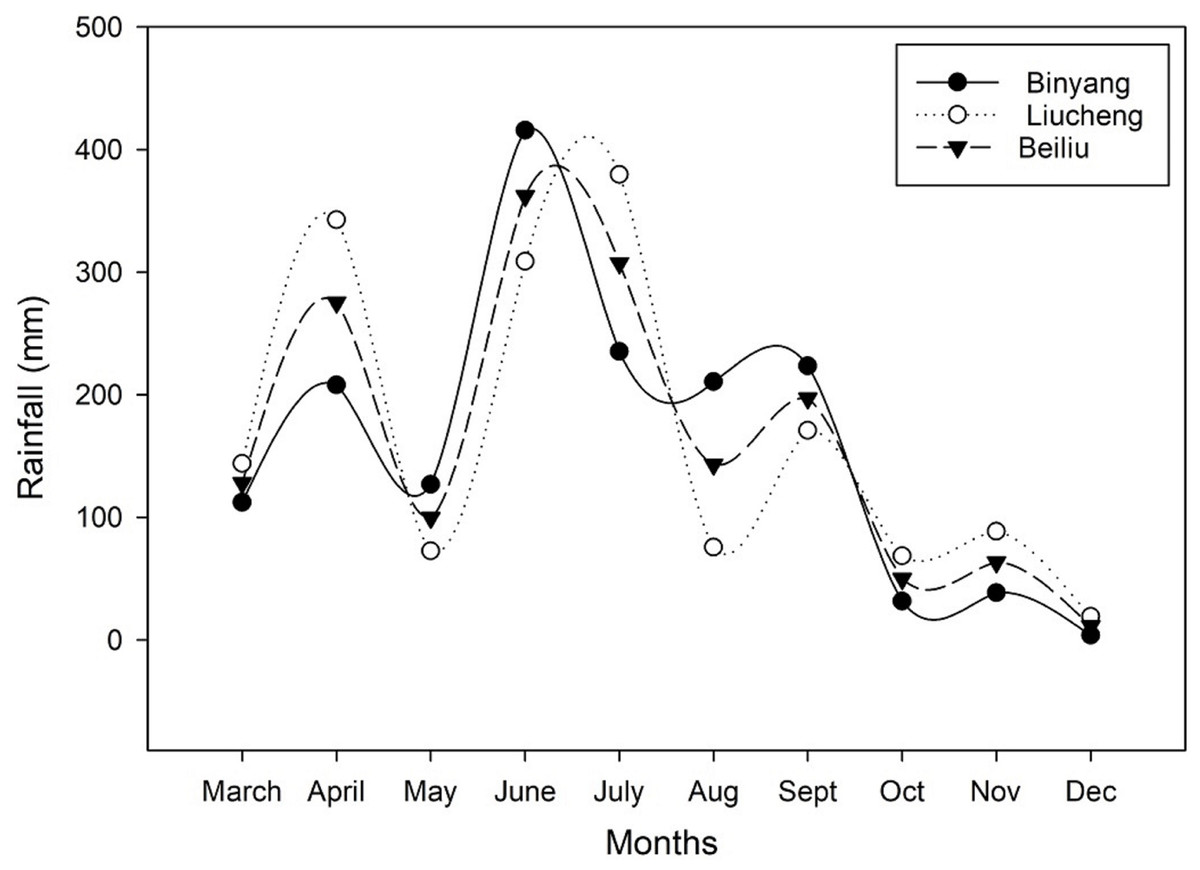
Figure 2: Average rain fall of Binyang, Liucheng and Beiliu throughout the growing season.
Experimental design and field management
The experiments were performed in a split-plot factorial design consisting of 12 treatments. Plots (3.6 m × 5.6 m) had an area of 20.16 m2. Three seedlings were planted per hill, the hill to hill distance was 14 cm, and the row-to-row distance was 30 cm. Each plot contained 12 rows, 40 hills, and 1,440 seedlings. The cultivars were randomly arranged and were not separated. Four different cultivars selected from a previous experiment (Li et al., 2019) were tested, including two hybrid rice cultivars (Teyou 582 and Y Liangyou 1) and two conventional rice cultivars (Baixiang 139 and Guiyu 9). Three fertilization levels were set for each cultivar: (1) F1: 180 kg N ha−1 + 90 kg P2O5 ha−1 + 180 kg K2O ha−1 (N180P90), (2) F2: 90 kg N ha−1 + 45 kg P2O5 ha−1 + 180 kg K2O ha−1 (N90P45), and (3) F3: 0 kg N ha−1 + 0 kg P2O5 ha−1 + 180 kg K2O ha−1 (N0P0).
The 25-day-old seedlings were manually transplanted to the experimental fields. The sources of N, P, and K were urea, superphosphate, and potassium chloride, respectively. Urea and potassium chloride were applied in splits (50% as a basal fertilizer, 30% at the tillering stage, and 20% at the panicle initiation stage), whereas all superphosphate was used as basal fertilizer. Uniform flood water approximately 4 cm deep was continued from transplanting until physiological maturity in each plot. Throughout the growing season, standard agricultural practices including irrigation, herbicide application, and insecticide application were performed in the same manner for all plots.
Sampling and measurements
Soil sampling and analysis
Prior to experiments, soil samples were randomly collected from up to 20 cm depth, air-dried, and passed through a 2-mm sieve. Soil pH was assessed after shaking the soil with distilled water at a 1:2.5 (w/v) solid-to-water ratio for 1 h using a digital pH meter (Thunderbolt PHS-3C, Shangai, China) (Cambardella et al., 2001). Total organic carbon was measured following the procedure of (Rich & Black, 1994). Total nitrogen (TN) was analyzed using the micro-Kjeldahl procedure (Jackson, 1956). Next, 200-mg soil samples were digested using the salicylic acid–sulfuric acid–hydrogen peroxide method (Ohyma et al., 1991), and available nitrogen (AN) was extracted from the soil samples using the hot water extraction method (Curtin et al., 2006). Available phosphorous (AP) was determined by Olsen’s method with 0.5 M NaHCO3 solution adjusted to pH 8.5 (Olsen, 1964). Available K was determined by placing the soil samples in 100-mL polyethylene bottles and adding 50 mL of the ammonium acetate/acetic acid solution (AK). AP was determined by the method as previously described by Leaf (1958).
Leaf area index
During the heading and maturity stages of rice, five representative rice samples were taken from each treatment plot, prepared for preservation, and brought to the laboratory to determine the rice leaf area using the length-width coefficient method (Xie et al., 2021).
Dry matter accumulation
To measure dry matter accumulation (DM), samples were randomly collected at the heading and maturity stages. The above-ground plants were washed with water and divided into three parts—stem, leaf, and panicle—and were dried in an oven at 70 °C for 48 h. Finally, the samples were weighed with a digital lab scale.
Growth, yield, and yield components
Five rice tillers were selected randomly to determine the number of filled grains per panicle, the number of grains blighted, seed setting rate, and thousand-grain weight (TGW). All of the plants in the plot were harvested, threshed, dried, and weighed. The moisture content of 100-g grains was measured and converted into standard yield based on 15% water content.
Statistical analysis
The data were analyzed using Statistix 8.0 software (Miller Landing Rd Tallahassee, FL 32312). After checking the data for normality, data were analyzed using two-way ANOVAs. The least significant difference (LSD) tests at (P < 0.05) were performed to assess significant differences among treatments (Steel, Torrie & Dickey, 1996).
Results
Significant and non signifant data
The significant level of rice traits as influenced by experimental sites (E), treatments (T), varieties (V), E × T, E × V and E × T × V is shown in Table 2. All interactions were found non-significant, except E × T × V for grain yield. Among the treatments, rice grain yield, grains panicle−1 and Seed setting rate were found non-significant during the early season, whereas during late season seed setting rate and thousand-grain weight were recorded non-significant. In the case of different varieties (V) all data were found significant during the early season and during late season, leaf area, dry matter and grain yield were found non-significant (Table 2).
| Rice traits | Experimental sites (E) | Treatments(T) | Varieties (V) | ExT | ExV | TxV |
|---|---|---|---|---|---|---|
| Early Season | ||||||
| Leaf area | ** | * | * | * | * | ns |
| Dry matter | ** | * | * | ns | * | ns |
| Grain yield | ** | ns | ** | ** | ** | ns |
| Effective panicle numbers | ** | ** | ** | ns | ** | ns |
| Grains panicle−1 | ** | ns | ** | ns | * | ns |
| Seed setting rate | ns | ns | * | ns | ** | ns |
| Thousand-grain weight | ** | ns | ** | ns | ns | ns |
| Late season | ns | |||||
| Leaf area | ** | ** | ns | ns | ns | ns |
| Dry matter | ** | ** | ns | ns | * | ns |
| Grain yield | ** | ** | ns | ** | ** | ns |
| Effective panicle numbers | ** | * | ** | ns | ns | ns |
| Grains panicle−1 | ** | ** | * | ns | ** | ns |
| Seed setting rate | ** | ns | * | ns | ns | ns |
| Thousand-grain weight | ns | ns | ** | ns | ** | ns |
Note:
ns stands for non-significant, while *, **, and *** stand for significance at the 5, 1, and 0.1% levels of probability.
Effects of N and P levels on leaf area index
The leaf area index (LAI) of rice was significantly affected by fertilizer rate, experimental sites, and cultivar during both seasons (Table 3). LAI was 21.5% and 52.1% higher in Binyang and Beiliu, respectively, across both seasons compared with Liucheng. The LAI was highest for Guiyu 9 during the early season, which was 38.8% higher compared with Baixiang 139; during the late season, the LAI was highest for Teyou 582, which was 17.8% higher compared with Guiyu 9. Y Liangyou 1 under N180P90 resulted in higher LAI (3.85 m−2) across seasons compared with the rest of the treatments. However, the lowest value of LAI (0.85 m−2) was observed for Y Liangyou 1 at Binyang under N0P0 treatment.
| Season | Site | Treatment | Baixiang139 | Guiyu 9 | Y Liangyou 1 | Teyou 582 | Average |
|---|---|---|---|---|---|---|---|
| Early | N180P90 | 3.00 ± 0.99abc | 3.85 ± 0.18a | 2.75 ± 0.72abc | 2.66 ± 0.63bc | 3.07 | |
| Binyang | N90P45 | 2.71 ± 0.81bc | 3.38 ± 0.12ab | 2.42 ± 0.14bc | 2.95 ± 0.94abc | 2.87 | |
| N0P0 | 2.32 ± 0.64bc | 2.83 ± 0.43abc | 2.12 ± 0.42c | 2.25 ± 0.22c | 2.38 | ||
| Average | 2.68 | 3.35 | 2.43 | 2.62 | 2.77 | ||
| N180P90 | 2.37 ± 0.58abc | 3.61 ± 0.62a | 2.40 ± 0.62abc | 2.52 ± 0.78abc | 2.73 | ||
| Beiliu | N90P45 | 1.84 ± 0.51bc | 3.25 ± 0.49ab | 2.17 ± 1.20abc | 1.87 ± 0.16bc | 2.28 | |
| N0P0 | 1.26 ± 0.35c | 2.46 ± 0.95abc | 1.97 ± 0.29abc | 1.58 ± 0.28c | 1.82 | ||
| Average | 1.82 | 3.11 | 2.18 | 1.99 | 2.28 | ||
| N180P90 | 2.39 ± 0.34ab | 3.38 ± 0.53ab | 3.85 ± 1.53a | 3.14 ± 1.25ab | 3.19 | ||
| Liucheng | N90P45 | 2.12 ± 0.90ab | 2.65 ± 0.79ab | 2.70 ± 0.86ab | 2.18 ± 0.29ab | 2.41 | |
| N0P0 | 1.56 ± 0.29b | 1.75 ± 0.20ab | 1.20 ± 0.33b | 1.78 ± 0.58ab | 1.57 | ||
| Average | 2.02 | 2.59 | 2.58 | 2.37 | 2.39 | ||
| Late | N180P90 | 2.63 ± 0.30ab | 1.12 ± 0.49cd | 2.24 ± 1.04abc | 2.97 ± 0.49a | 2.24 | |
| Binyang | N90P45 | 1.89 ± 1.80abcd | 1.42 ± 0.81bcd | 1.36 ± 0.09bcd | 1.61 ± 1.01bcd | 1.57 | |
| N0P0 | 1.41 ± 0.42bcd | 0.97 ± 0.16cd | 0.85 ± 0.13d | 1.36 ± 0.28bcd | 1.15 | ||
| Average | 1.98 | 1.17 | 1.48 | 1.98 | 1.65 | ||
| N180P90 | 3.12 ± 0.25ab | 2.96 ± 0.67ab | 3.30 ± 1.03a | 3.07 ± 0.74ab | 3.11 | ||
| Beiliu | N90P45 | 2.47 ± 0.27abc | 2.56 ± 1.08abc | 2.39 ± 0.53abc | 3.16 ± 1.05ab | 2.65 | |
| N0P0 | 2.03 ± 0.21abc | 1.75 ± 0.49bc | 1.36 ± 0.43c | 1.90 ± 0.46abc | 1.76 | ||
| Average | 2.54 | 2.42 | 2.35 | 2.71 | 2.51 | ||
| N180P90 | 2.64 ± 0.44ab | 3.16 ± 0.35a | 2.78 ± 0.49ab | 2.40 ± 0.82abc | 2.75 | ||
| Liucheng | N90P45 | 1.93 ± 0.20bcd | 1.96 ± 0.96bcd | 1.98 ± 0.08bcd | 2.42 ± 0.63abc | 2.07 | |
| N0P0 | 1.39 ± 0.23d | 1.49 ± 0.26d | 1.61 ± 0.33cd | 1.59 ± 0.21cd | 1.52 | ||
| Average | 1.99 | 2.2 | 2.12 | 2.14 | 2.11 |
Note:
Values in columns with different letters showed significant differences (P < 0.05). ± Value represents the SE value among the replications.
Effects of N and P levels on DM
In the early season, N and P fertilizers, site, and cultivar significantly affected DM during both seasons and regimes (Tables 4 and 5). The highest DM was observed at Liucheng and Beiliu, respectively, which had 23.5% and 11.7% higher DM compared withBeiliu. Y Liangyou 1 resulted in 20.8% and 21.2% higher DM compared with Baixiang 139 at the heading and maturity stages, respectively.
| Site | Treatment | Baixiang139 | Guiyu 9 | Y Liangyou 1 | Teyou 582 | Average |
|---|---|---|---|---|---|---|
| Heading | ||||||
| N180P90 | 6,697.1 ± 403.93abc | 6,888.6 ± 386.41abc | 8,055.0 ± 986.89ab | 8,541.9 ± 855.01a | 7,545.7 | |
| Binyang | N90P45 | 6,360.5 ± 900.03abc | 7,584.9 ± 1,127.33ab | 8,051.0 ± 1,260.84ab | 7,777.7 ± 512.36ab | 7,443.5 |
| N0P0 | 4,948.1 ± 1,725.84c | 6,117.8 ± 368.12bc | 5,949.5 ± 574.96bc | 7,280.3 ± 538.57ab | 6,073.9 | |
| Average | 6,001.9 | 6,863.8 | 7,351.8 | 7,866.6 | 7,021 | |
| N180P90 | 8,069.3 ± 1,280.14ab | 10,228.5 ± 1,520.39a | 8,925.3 ± 970.03a | 8,710.4 ± 147.70ab | 8,983.4 | |
| Beiliu | N90P45 | 8,660.4 ± 1,502.70ab | 9,158.9 ± 759.78a | 7,923.9 ± 1,201.95ab | 9,411.2 ± 1,088.72a | 8,788.6 |
| N0P0 | 4,942.7 ± 217.27b | 7,701.6 ± 1,371.37ab | 7,140.3 ± 783.79ab | 7,222.8 ± 184.64ab | 6,751.9 | |
| Average | 7,224.1 | 9,029.7 | 7,996.5 | 8,448.1 | 8,174.6 | |
| N180P90 | 6,367.8 ± 745.71ab | 7,467.0 ± 1,093.67ab | 8,109.8 ± 1,340.07a | 6,471.5 ± 2,637.84ab | 7,104 | |
| Liucheng | N90P45 | 6,194.9 ± 1,013.22ab | 6,937.2 ± 603.47ab | 8,369.0 ± 513.12a | 6,946.4 ± 71.40ab | 7,111.9 |
| N0P0 | 4,424.4 ± 864.94b | 6,289.4 ± 975.70ab | 5,945.0 ± 795.21ab | 5,883.0 ± 748.81ab | 5,635.5 | |
| Average | 5,662.4 | 6,897.9 | 7,474.6 | 6,433.6 | 6,617.1 | |
| Maturity | ||||||
| N180P90 | 9,752.1 ± 760.60bc | 10,694.0 ± 712.45abc | 14,656.8 ± 1,973.58a | 12,380.1 ± 1,746.95ab | 11,870.8 | |
| Binyang | N90P45 | 9,707.7 ± 1,305.80bc | 11,627.9 ± 77.92abc | 13,238.9 ± 301.60ab | 13,948.5 ± 3,501.99a | 12,130.8 |
| N0P0 | 8,323.4 ± 1,305.58c | 9,735.8 ± 371.20bc | 11,190.9 ± 1,874.89abc | 10,950.9 ± 538.05abc | 10,050.3 | |
| Average | 9,261.1 | 10,685.9 | 13,028.9 | 12,426.5 | 11,350.6 | |
| N180P90 | 14,076.9 ± 2,167.13ab | 12,074.9 ± 1,237.51ab | 14,144.1 ± 2,887.99ab | 13,709.1 ± 1,391.80ab | 13,501.3 | |
| Beiliu | N90P45 | 13,116.5 ± 3,666.66ab | 11,549.3 ± 2,110.37ab | 15,319.5 ± 1,724.47a | 13,655.0 ± 1,257.55ab | 13,410.1 |
| N0P0 | 9,356.4 ± 1,084.59b | 10,661.9 ± 2,503.85ab | 12,306.8 ± 1,875.56b | 12,212.4 ± 2,576.85ab | 11,134.4 | |
| Average | 12,183.3 | 11,428.7 | 13,923.5 | 13,192.2 | 12,681.9 | |
| N180P90 | 11,717.1 ± 339.72abcd | 12,961.8 ± 1,772.77abc | 14,030.4 ± 1,539.90ab | 14,958.0 ± 1,137.26a | 13,416.8 | |
| Liucheng | N90P45 | 10,587.0 ± 1,710.58abcd | 12,929.3 ± 1,700.94abc | 12,189.2 ± 1,372.23abcd | 12,437.0 ± 923.96abcd | 12,035.6 |
| N0P0 | 8,496.6 ± 2,145.74cd | 9,628.7 ± 2,049.71bcd | 8,253.8 ± 1,621.48d | 10,361.0 ± 2,802.33bcd | 9,185 | |
| Average | 10,266.9 | 11,839.9 | 11,491.1 | 12,585.3 | 11,545.8 |
Note:
Values in columns with different letters showed significant differences (P < 0.05).
| Site | Treatment | Baixiang139 | Guiyu 9 | Y Liangyou 1 | Teyou 582 | Average |
|---|---|---|---|---|---|---|
| Heading | ||||||
| N180P90 | 9,686.6 ± 741.43ab | 10,083.6 ± 955.38a | 8,549.0 ± 1,741.78abcd | 8,936.7 ± 1,678.65abc | 9,314 | |
| Binyang | N90P45 | 8,323.7 ± 1,235.71abcd | 7,611.9 ± 92.63abcde | 6,798.6 ± 1,063.82bcde | 9,067.8 ± 1,465.35abc | 7,950.5 |
| N0P0 | 5,498.1 ± 1,852.39de | 6,083.0 ± 1,192.46cde | 4,362.2 ± 468.44e | 6,779.3 ± 2,028.19bcde | 5,680.7 | |
| Average | 7,836.1 | 7,926.2 | 6,569.9 | 8,261.3 | 7,648.4 | |
| N180P90 | 8,043.2 ± 2,367.80a | 7,131.8 ± 418.48ab | 7,910.0 ± 1,069.79a | 7,913.7 ± 720.96a | 7,749.7 | |
| Beiliu | N90P45 | 7,280.7 ± 762.72ab | 7,215 ± 831.09ab | 7,186.4 ± 83.32ab | 7,427.9 ± 936.24ab | 7,277.5 |
| N0P0 | 5,069.4 ± 291.30b | 5,706.5 ± 637.24ab | 6,271.5 ± 369.49ab | 5,836.8 ± 1,025.77ab | 5,721.1 | |
| Average | 6,797.8 | 6,684.4 | 7,122.6 | 7,059.5 | 6,916.1 | |
| N180P90 | 9,364.8 ± 962.94ab | 10,149.6 ± 296.78a | 9,913.4 ± 567.71ab | 9,693.2 ± 626.09ab | 9,780.3 | |
| Liucheng | N90P45 | 7,658.4 ± 1,957.01ab | 9,905.1 ± 1,565.78ab | 9,691.8 ± 385.80ab | 9,447.6 ± 873.91ab | 9,175.7 |
| N0P0 | 7,574.7 ± 726.67ab | 7,327.8 ± 555.09b | 8,510.7 ± 485.66ab | 7,537.1 ± 1,164.75ab | 7,737.6 | |
| Average | 8,199.3 | 9,127.5 | 9,372 | 8,892.6 | 8,897.9 | |
| Maturity | ||||||
| N180P90 | 11,818.8 ± 2,372.51ab | 9,754.1 ± 750.08abcd | 11,454.3 ± 1,363.42ab | 12,077.1 ± 3,098.66a | 11,276.1 | |
| Binyang | N90P45 | 8,922.5 ± 1,348.79abcde | 9,304.5 ± 358.40abcde | 8,993.4 ± 585.10abcde | 10,953.5 ± 2,187.7abc | 9,543.5 |
| N0P0 | 6,789.5 ± 1,366.36de | 7,367.7 ± 856.38cde | 5,617.5 ± 274.53e | 8,122.4 ± 1,714.71bcde | 6,974.3 | |
| Average | 9,176.9 | 8,808.8 | 8,688.4 | 10,384.3 | 9,264.6 | |
| N180P90 | 12,020.7 ± 557.22ab | 11,372.7 ± 1,048.47abc | 13,421.7 ± 1,356.26a | 10,044.3 ± 839.54abcd | 11,714.9 | |
| Beiliu | N90P45 | 10,467.9 ± 1,468.12abcd | 9,393.2 ± 2,763.04bcd | 10,796.1 ± 287.97abcd | 12,324.6 ± 1,343.67ab | 10,745.4 |
| N0P0 | 8,660.9 ± 531.44bcd | 7,445.4 ± 1,992.97d | 7,758.9 ± 2,549.71cd | 7,197.45 ± 1,338.98d | 7,765.7 | |
| Average | 10,383.2 | 9,403.8 | 10,658.9 | 9,855.5 | 10,075.3 | |
| N180P90 | 11,552.4 ± 1,724.73abc | 11,865.2 ± 1,080.48abc | 13,414.1 ± 2,210.51a | 12,579.8 ± 1,813.34ab | 12,352.9 | |
| Liucheng | N90P45 | 9,900.2 ± 609.73abc | 9,977.3 ± 1,427.54abc | 12,352.2 ± 862.57abc | 11,979.9 ± 1,079.22abc | 11,052.4 |
| N0P0 | 9,110.1 ± 1,233.77bc | 8,817.8 ± 700.49c | 11,366.9 ± 782.50abc | 10,807.1 ± 1,033.32abc | 10,025.5 | |
| Average | 10,187.6 | 10,220.1 | 12,377.7 | 11,788.9 | 11,143.6 |
Note:
Values in columns with different letters showed significant differences (P < 0.05).
The highest values of DM at the heading (9,411.2 kg ha−1) stages were recorded for Teyou 582 treated with N90P45 at Beiliu. However, the lowest DM at the heading (4,424.4 kg ha−1) and maturity (8,253.8 kg ha−1) stages were recorded for Baixiang 139 and Y Liangyou 1 under N0P0 at Liucheng during the early season.
During the heading stage of late rice, the DM of Liucheng among different treatments was 28.7% higher than that of Beiliu, and the DM of Liucheng among different treatments during the maturity period was 20.3% higher than that of Binyang (Table 5). Teyou 582 had 6% and 12.6% higher DM in the late-season compared with Baixiang 139 and Guiyu 9 at the heading and maturity stages, respectively. N180P90 led to higher DM (10,083.6 kg ha−1 and 13,421.7 kg ha−1) in Guiyu 9 and Y Liangyou 1 at Binyang and Beiliu, respectively, compared with the other cultivars and experimental sites. However, the lowest DM (4,362.2 kg ha−1 and 5,617.5 kg ha−1) during the late season was observed for Y Liangyou 1 at Binyang under N0P0 treatment.
Yield and yield components
Effective panicle numbers
Lower rates of N and P fertilization significantly improved crop growth, grain yield, and yield components during both seasons (Tables 6 and 7). During the early rice period, the effective panicle number of Beiliu between different treatments was 28.6% higher than that of Liucheng. Compared with Teyou 582, the effective panicle number of Baixiang 139 increased by 40.3%. Furthermore, Baixiang 139 treated with N180P90 led to a higher panicle number (4,158,800 panicle ha−1) compared with the other treatments in Beiliu. Teyou 582 had the lowest number of panicles (1.6508 million panicle ha−1) under N90P45 treatment at Liucheng.
| Site | Cultivars | Treatments | Effective | Grain | Seed setting | TGW | Grain yield |
|---|---|---|---|---|---|---|---|
| panicles | panicle−1 | rate (%) | (g) | (kg ha−1) | |||
| Binyang | Baixiang 139 | N180P90 | 300.99 ± 14.52a | 125.47 ± 4.88cd | 73.9 ± 0.01ab | 18.36 ± 0.22d | 5,153.6 ± 135.15e |
| N90P45 | 312.08 ± 10.98a | 115.25 ± 7.86d | 81.11 ± 0.08a | 18.70 ± 0.68d | 5,015.1 ± 56.03e | ||
| N0P0 | 256.63 ± 47.52ab | 125.64 ± 3.07bcd | 78.88 ± 0.04ab | 18.14 ± 0.06d | 4,900.7 ± 83.57e | ||
| Guiyu 9 | N180P90 | 270.89 ± 17.14a | 132.97 ± 14.54bcd | 56.73 ± 0.05c | 22.54 ± 0.94c | 5,130.5 ± 169.89e | |
| N90P45 | 267.72 ± 2.74ab | 150.48 ± 2.97abcd | 55.47 ± 0.05c | 22.96 ± 0.67c | 5,020.4 ± 206.09e | ||
| N0P0 | 256.63 ± 4.75ab | 121.74 ± 6.81d | 65.60 ± 0.01bc | 22.02 ± 0.97c | 4,318.1 ± 126.76f | ||
| Y Liangyou 1 | N180P90 | 281.98 ± 26.17a | 133.13 ± 13.95bcd | 80.93 ± 0.06a | 27.00 ± 0.93a | 6,333.2 ± 100.02bc | |
| N90P45 | 251.88 ± 45.34ab | 154.08 ± 46.56abcd | 81.58 ± 0.11a | 26.48 ± 0.76a | 7,231.1 ± 163.02a | ||
| N0P0 | 242.38 ± 20.72ab | 129.11 ± 12.16bcd | 78.52 ± 0.09ab | 27.07 ± 0.21a | 6,635.3 ± 300.98b | ||
| Teyou 582 | N180P90 | 250.3 ± 21.43ab | 172.22 ± 11.78abc | 72.30 ± 0.09ab | 24.74 ± 1.07b | 6,258.0 ± 287.70c | |
| N90P45 | 251.88 ± 28.91ab | 187.86 ± 30.59a | 77.47 ± 0.02ab | 24.73 ± 0.85b | 5,794.1 ± 56.80d | ||
| N0P0 | 199.6 ± 12.57b | 174.66 ± 9.22ab | 77.91 ± 0.06ab | 25.85 ± 0.27ab | 5,641.8 ± 215.56d | ||
| Beiliu | Baixiang 139 | N180P90 | 415.88 ± 30.61a | 120.52 ± 15.15c | 81.08 ± 0.03a | 17.62 ± 0.48d | 5,125.4 ± 960.29bcd |
| N90P45 | 361.91 ± 43.64ab | 133.77 ± 19.06c | 80.18 ± 0.03a | 17.82 ± 0.18d | 5,723.4 ± 307.21abc | ||
| N0P0 | 287.3 ± 11.00bc | 120.36 ± 13.32c | 80.02 ± 0.07a | 17.57 ± 0.22d | 5,179.5 ± 254.63bcd | ||
| Guiyu 9 | N180P90 | 304.76 ± 33.33bc | 113.84 ± 10.48c | 53.61 ± 0.03bc | 22.34 ± 1.95c | 4,763.7 ± 212.57cd | |
| N90P45 | 282.54 ± 2.75c | 119.83 ± 10.88c | 45.55 ± 0.13c | 21.47 ± 1.46c | 4,605.9 ± 216.53d | ||
| N0P0 | 277.78 ± 58.77c | 115.3 ± 21.09c | 49.54 ± 0.17c | 21.75 ± 0.31c | 4,799.0 ± 167.32bcd | ||
| Y Liangyou 1 | N180P90 | 273.02 ± 11.98c | 138.01 ± 24.85c | 74.34 ± 0.08a | 25.83 ± 0.75ab | 5,843.3 ± 138.81ab | |
| N90P45 | 261.91 ± 19.05c | 159.62 ± 22.51abc | 82.29 ± 0.01a | 26.06 ± 0.73ab | 6,546.8 ± 64.57a | ||
| N0P0 | 233.33 ± 16.50cd | 143.82 ± 15.93bc | 70.86 ± 0.04ab | 26.95 ± 0.46a | 6,361.8 ± 432.49a | ||
| Teyou 582 | N180P90 | 253.97 ± 29.10c | 194.53 ± 25.84a | 74.39 ± 0.11a | 22.30 ± 0.63c | 6,377.3 ± 286.02a | |
| N90P45 | 231.75 ± 21.99cd | 186.71 ± 30.66ab | 82.91 ± 0.10a | 23.87 ± 1.47bc | 6,611.7 ± 196.59a | ||
| N0P0 | 174.60 ± 58.19d | 200.89 ± 4.37a | 80.81 ± 0.09a | 25.15 ± 0.65ab | 6,545.9 ± 285.52a | ||
| Liucheng | Baixiang 139 | N180P90 | 293.65 ± 11.00a | 139.05 ± 1.85bc | 74.86 ± 0.08abc | 17.39 ± 0.44e | 4,305.6 ± 120.33bcd |
| N90P45 | 269.84 ± 11.98ab | 142.15 ± 19.57bc | 75.93 ± 0.04abc | 17.12 ± 0.33e | 4,474.2 ± 676.31abc | ||
| N0P0 | 209.52 ± 31.23cde | 140.94 ± 11.65bc | 82.4 ± 0.05a | 17.05 ± 0.79e | 3,482.3 ± 214.63d | ||
| Guiyu 9 | N180P90 | 241.27 ± 11.98abc | 154.18 ± 31.29bc | 66.09 ± 0.03bc | 21.12 ± 0.83d | 4,137.0 ± 310.68cd | |
| N90P45 | 212.70 ± 13.75bcde | 187.91 ± 17.81ab | 69.25 ± 0.03abc | 20.89 ± 0.53d | 4,166.7 ± 467.74cd | ||
| N0P0 | 201.59 ± 13.75cde | 148.17 ± 18.52bc | 66.11 ± 0.09bc | 20.76 ± 0.42d | 3,740.1 ± 274.88cd | ||
| Y Liangyou 1 | N180P90 | 228.57 ± 16.50bcd | 163.91 ± 15.73bc | 63.53 ± 0.08c | 25.29 ± 0.37a | 5,198.4 ± 61.91ab | |
| N90P45 | 212.7 ± 11.98bcde | 160.49 ± 9.62bc | 66.37 ± 0.11bc | 25.58 ± 0.66a | 5,238.2 ± 337.98ab | ||
| N0P0 | 173.02 ± 2.75de | 132.53 ± 23.66c | 73.57 ± 0.04abc | 24.49 ± 0.86ab | 4,414.8 ± 474.65abcd | ||
| Teyou 582 | N180P90 | 225.40 ± 45.01bcd | 215.94 ± 43.82a | 80.16 ± 0.03ab | 22.93 ± 0.25c | 5,287.8 ± 574.25a | |
| N90P45 | 165.08 ± 14.55e | 228.4 ± 28.65a | 82.41 ± 0.04a | 22.98 ± 0.23c | 4,613.1 ± 658.10abc | ||
| N0P0 | 177.78 ± 32.41de | 177.28 ± 18.54abc | 81.55 ± 0.04a | 23.48 ± 0.25bc | 4,652.9 ± 725.56abc |
Note:
Values in columns with different letters showed significant differences (P < 0.05).
| Site | Cultivars | Treatments | Effective | Total grains | Seed setting | TGW(g) | Actual output |
|---|---|---|---|---|---|---|---|
| panicles | per panicle | rate (%) | (kg ha−1) | ||||
| Binyang | Baixiang 139 | N180P90 | 358.02 ± 42.60a | 127.46 ± 13.76de | 42.51 ± 0.07bc | 18.29 ± 0.62c | 2,980.5 ± 611.19abcd |
| N90P45 | 266.14 ± 41.43b | 135.35 ± 8.44cde | 56.56 ± 0.03ab | 19.39 ± 0.72c | 3,588.3 ± 196.74a | ||
| N0P0 | 237.62 ± 49.62bc | 108.11 ± 2.68ef | 58.89 ± 0.03a | 18.22 ± 0.27c | 1,941.9 ± 235.31e | ||
| Guiyu 9 | N180P90 | 185.35 ± 20.72bcd | 179.85 ± 12.97a | 45.48 ± 0.07abc | 22.84 ± 0.78b | 2,423.3 ± 314.67cde | |
| N90P45 | 199.60 ± 12.57bcd | 163.09 ± 18.72abc | 40.32 ± 0.04c | 22.54 ± 1.41b | 2,659.7 ± 373.08cde | ||
| N0P0 | 148.91 ± 23.44d | 169.73 ± 9.45ab | 45.48 ± 0.08abc | 22.08 ± 0.76b | 2,254.4 ± 329.29de | ||
| Y Liangyou 1 | N180P90 | 237.62 ± 28.91bc | 144.4 ± 6.94bcd | 48.50 ± 0.08abc | 26.01 ± 2.01a | 3,453.3 ± 345.73ab | |
| N90P45 | 217.03 ± 15.28bcd | 121.18 ± 0.95def | 51.57 ± 0.01abc | 25.64 ± 0.34a | 3,318.2 ± 140.99ab | ||
| N0P0 | 169.51 ± 2.74cd | 94.79 ± 2.28f | 55.83 ± 0.07ab | 25.2 ± 0.53a | 2,338.8 ± 168.62cde | ||
| Teyou 582 | N180P90 | 201.19 ± 48.08bcd | 169.47 ± 5.71ab | 53.86 ± 0.08abc | 25.36 ± 0.29a | 3,174.6 ± 373.46abc | |
| N90P45 | 202.77 ± 38.12bcd | 160.91 ± 8.82abc | 56.55 ± 0.02ab | 25.43 ± 0.48a | 3,065.0 ± 292.12abcd | ||
| N0P0 | 177.43 ± 38.41cd | 135.42 ± 16.04cde | 51.64 ± 0.04abc | 25.17 ± 0.45a | 2,794.7 ± 402.43abcd | ||
| Beiliu | Baixiang 139 | N180P90 | 292.06 ± 32.41a | 142.67 ± 17.66bc | 65.95 ± 0.02abc | 18.81 ± 0.21e | 5,537.1 ± 138.45bc |
| N90P45 | 292.06 ± 50.92a | 127.88 ± 15.63c | 70.95 ± 0.03ab | 18.23 ± 0.13e | 4,725 ± 175.89d | ||
| N0P0 | 261.91 ± 21.82ab | 121.83 ± 8.16c | 71.30 ± 0.04a | 17.50 ± 0.07e | 4,005.2 ± 57.62ef | ||
| Guiyu 9 | N180P90 | 192.06 ± 11.00bcd | 188.24 ± 13.79ab | 57.39 ± 0.06d | 23.42 ± 0.79cd | 4,974.2 ± 166.89cd | |
| N90P45 | 188.89 ± 49.56bcd | 154.21 ± 19.85abc | 60.58 ± 0.07abc | 22.52 ± 1.47d | 4,365.2 ± 476.59de | ||
| N0P0 | 141.27 ± 27.08d | 162.36 ± 24.28abc | 58.05 ± 0.04d | 22.73 ± 0.84d | 3,590 ± 136.54f | ||
| Y Liangyou 1 | N180P90 | 228.57 ± 34.34abc | 150.19 ± 27.02bc | 72.17 ± 0.21a | 26.99 ± 0.57a | 6,284.7 ± 126.86a | |
| N90P45 | 204.76 ± 12.60bcd | 145.69 ± 7.03bc | 71.31 ± 0.06a | 26.01 ± 0.96ab | 6,063.2 ± 628.91ab | ||
| N0P0 | 155.56 ± 43.21cd | 136.51 ± 12.52c | 68.53 ± 0.04abc | 26.78 ± 0.51a | 4,623.5 ± 413.43de | ||
| Teyou 582 | N180P90 | 176.19 ± 4.76cd | 164.21 ± 8.90abc | 59.45 ± 0.07bc | 26.42 ± 0.31ab | 5,795.6 ± 265.96ab | |
| N90P45 | 179.37 ± 2.75cd | 199.60 ± 31.25a | 66.41 ± 0.04abc | 26.40 ± 0.18ab | 5,435.6 ± 680.58bc | ||
| N0P0 | 144.45 ± 7.27d | 153.27 ± 23.63abc | 66.08 ± 0.07abc | 24.85 ± 0.87bc | 4,466.6 ± 130.83de | ||
| Liucheng | Baixiang 139 | N180P90 | 311.11 ± 58.77a | 147.50 ± 7.62c | 51.90 ± 0.01abc | 18.91 ± 0.42f | 5,353.1 ± 1,126.45abcd |
| N90P45 | 290.48 ± 17.17ab | 141.00 ± 11.00c | 51.38 ± 0.04abc | 18.65 ± 0.26f | 5,144.6 ± 387.28abcd | ||
| N0P0 | 258.73 ± 31.71abc | 137.41 ± 9.72c | 55.07 ± 0.04abc | 19.36 ± 0.81ef | 4,808.7 ± 366.91cd | ||
| Guiyu 9 | N180P90 | 226.99 ± 23.49bc | 177.65 ± 61.01bc | 44.80 ± 0.07c | 21.33 ± 1.60def | 5,436.6 ± 723.10abcd | |
| N90P45 | 217.46 ± 35.10bc | 141.81 ± 13.45c | 49.10 ± 0.09bc | 22.22 ± 2.37cde | 5,081.4 ± 852.28bcd | ||
| N0P0 | 190.48 ± 16.50c | 147.47 ± 15.62c | 50.84 ± 0.07abc | 22.00 ± 1.03cde | 4,350.9 ± 198.15d | ||
| Y Liangyou 1 | N180P90 | 255.56 ± 26.23abc | 151.68 ± 7.80c | 58.76 ± 0.01ab | 26.41 ± 1.63ab | 7,047.3 ± 410.20a | |
| N90P45 | 239.68 ± 30.60abc | 155.58 ± 8.97c | 51.79 ± 0.02abc | 27.84 ± 0.39a | 6,762.3 ± 694.85ab | ||
| N0P0 | 246.03 ± 11.00abc | 140.36 ± 18.53c | 59.94 ± 0.01ab | 26.8 ± 0.46ab | 5,973.8 ± 335.22abcd | ||
| Teyou 582 | N180P90 | 188.89 ± 39.65c | 243.15 ± 11.39a | 53.96 ± 0.07abc | 23.86 ± 0.29bcd | 6,596.6 ± 941.22abc | |
| N90P45 | 179.37 ± 27.08cd | 223.49 ± 14.31ab | 54.33 ± 0.06abc | 24.55 ± 0.24bc | 6,824.4 ± 192.24ab | ||
| N0P0 | 188.89 ± 19.25c | 188.14 ± 8.51abc | 62.56 ± 0.02a | 23.89 ± 1.11bcd | 5,370.5 ± 543.71abcd |
Note:
Values in columns with different letters showed significant differences (P < 0.05). ± Values represent SE among the replications.
In the Liucheng test site, the effective panicle number of Baixiang 139 increased by 56.7% compared with Guiyu 9 (Tables 6 and 7). Furthermore, Baixiang 139 treated with N180P90 in Binyang had significantly more panicles (3.5802 million panicle ha−1) compared with other treatments. However, the panicle number of Teyou 582 at Beiliu was low (1.4445 million ear ha−1) under N0P0 treatment.
Grains panicle−1
The number of grains panicle−1 among different treatments was 28.6% and 16.7% higher in Liucheng compared with Binyang during the early and late seasons, respectively. Teyou 582 had a 49.5% higher number of grains per panicle compared with Baixiang 139 during the early season (Tables 6 and 7). In addition, Teyou 582 had considerably more (228.4 grains) total grains panicle−1 treated with N90P45 compared with treatments at Liucheng during the early season. Guiyu 9 treated with N180P90 had significantly more grains panicle−1 at Beiliu (113.84 grains) and Liucheng (243.15 grains) during the early and late seasons, respectively. The number of grains panicle−1 of Guiyu 9 was 37.7% higher compared with Baixiang 139 during the late season. However, Y Liangyou 1 at Binyang had a low number of grains panicle−1 (94 grains panicle−1) under the N0P0 treatment during the late season.
Seed setting rate
The seed setting rate was 3.1% higher in Liucheng than in Beiliu during the early season across fertilizer treatments (Tables 6 and 7). During the late season, the seed setting rate at Beiliu was 29.8% higher compared with Binyang, followed by Liucheng. Teyou 582 had a 34.5% higher seed setting rate than Guiyu 9 during the early season, and Y Liangyou 1 had a 19.1% higher seed setting rate than Teyou 582 during the late season. Teyou 582 treated with N90P45 and Y Liangyou 1 treated with N180P90 had seed setting rates that were 82.91% and 72.17% higher compared with other treatments at Beiliu in the early and late seasons, respectively. The lowest seed setting rate was recorded in Guiyu 9 (at Beiliu) and Teyou 582 (at Binyang) under N90P45 treatment during the early and late seasons, respectively.
Thousand-grain weight
TGW of Binyang between different treatments during the early season was 7.5% higher than that of Liucheng, and TGW of Beiliu between different treatments during the late season was 1.8% higher than that of Liucheng.Y Liangyou 1 had 44% higher TGW compared with Baixiang during both seasons (Tables 6 and 7). N0P0 and N90P45 increased the TGW of Y Liangyou 1 at Binyang (27.07 g) and Liucheng (27.84 g) during the early and late seasons, respectively. Lower TGW values (17.05 and 17.5 gm) were observed in Baixiang 139 at Liucheng and Beiliu during the early and late seasons, respectively, under N0P0.
Grain yield
The yield of Beiliu among different treatments during the early season was 27.5% higher compared with Liucheng (Tables 6 and 7). Compared with Guiyu 9, the yield of Y Liangyou 1 was increased by 32.3%. In Beiliu, the N90P45 treatment (6,611.7 kg ha−1) of Teyou 582 increased production compared with the other treatments. In Liucheng, the grain yield of Baixiang 139 was lower (3,482.3 kg ha−1) under N0P0 treatment.
Relationships between DM accumulation, LAI, effective panicle number, total number of grains per panicle, and grain yield of rice
Rice yield is strongly related to yield components and growth attributes (Iqbal et al., 2020). In this study, the correlation analysis showed that DM (0.65**), LAI (0.6**), and effective panicle number (0.56*) were strongly positively correlated with grain yield (Table 8). Total grains panicle−1, seed setting rate, and TGW were moderately positively correlated with grain yield. Furthermore, effective panicle number was also strongly positively correlated with DM (0.83**) and LAI (0.6**). DM was significantly correlated with LAI (0.78**) and total grains panicle−1 (0.52*).
Discussion
Nitrogen (N) and phosphorous (P) fertilizers are key to the “green revolution,” which has converted approximately half of the world’s land to agriculture (Melillo, 2012; Iqbal et al., 2021). Previously it is well reported that using synthetic fertilizers in conventional farming improved crop growth and yield. Increasing the rate of N and P fertilizer application has been reported the main strategy for increasing grain yield (Leghari et al., 2016; Ali et al., 2019; Iqbal et al., 2021). However, the overuse of N and P can lead to the eutrophication of water bodies, high nitrate content in water bodies, and deterioration of rice quality (Carpenter et al., 1998; Ullah et al., 2020). Furthermore, the consequences of N and P losses from paddy fields, such as through runoff and leaching, can span multiple organizational levels and scales in time and space and thus threaten critical ecosystem services (Fowler et al., 2013; Guignard et al., 2017; Ullah et al., 2020). Although previous work indicates that increasing P and N fertilization can increase crop growth, yield, and yield attributes, and few studies have examined the extent to which the levels of P and N fertilizers could be reduced at different sites and with different cultivars in southern China. Thus our studies provided the response of different cultivars to the reduction of fertilizer use in South China at three different experimental sites.
Leaf area index (LAI) and dry matter (DM) are directly associated with the grain yield of rice (Iqbal et al., 2019; Ali et al., 2020). Our results showed that the LAI was increased under moderate amounts of fertilization (N90P45) of a hybrid cultivar (Guiyu 9) compared with conventional rice cultivars. Likewise, moderate fertilization (N90P45) led to higher DM of a hybrid variety (Teyou 582) at Beiliu. These increases can be explained by the characteristics of hybrid cultivars, which can use less N and P while maintaining LAI and DM in paddy fields. These cultivars require less N and P for their growth and development (Li et al., 2019). Our results are consistent with those of Ali et al. (2020), showing that proper N application can increase the number of tillers and LAI of rice and promote its growth but that the excessive application of N fertilizer increases the number of ineffective tillers and reduces the utilization of N (Xie et al., 2021). However, several studies have reported that reducing N and P fertilizer application reduces rice growth traits (Jiang et al., 2021; Murthy et al., 2015) and alters rice flowering days (Ye et al., 2019). Similar to our findings, another study reported that reducing N application rate increases rice grain yield and N use efficiency (Wei et al., 2021), although their study used dense planting techniques. In addition Zhang et al. (2014) documented that regulating fertilization rate such as reducing and postponing N doses could sustain plant growth and yield. In general, our results suggest that rice LAI can be enhanced with the use of hybrid cultivars treated with moderate amounts of fertilizer.
Furthermore, our results indicated that effective panicle number and grains per panicle were highest under N180P90 fertilization of Baixiang 139 and Guiyu 9, respectively. Seed setting rate, TGW, and grain yield were highest under moderate fertilization (N90P45) in Beiliu with the cultivar Teyou 582; furthermore, Y Liangyou 1 led to a higher grain yield compared with Guiyu 9 in Liucheng. Overall, the hybrid cultivar Teyou 582 increased the grain yield and yield attributes under reduced fertilization rates (N90P45); however, there were no significant differences in grain yield and yield attributes between moderate and high applications of N and P fertilizer. This result might stem from the properties of Teyou 582, a hybrid cultivar that can grow better and produce higher yields with less fertilizer. These results are consistent with those of (Ma et al., 2019) showing that optimal applications of N and P enhanced grain yield and quality by improving N uptake. Furthermore, similar to our finding reported that using low fertilizer rates improves rice yield with other agronomic techniques such as selection of verities (Ju et al., 2015), dense planting (Wei et al., 2021), coupling with organic manure (Iqbal et al., 2019) or combined with biochar amendment (Ali et al., 2020) whereas other studies (Wang et al., 2011) have found that moderate application rates of N lead to increases in nitrate content in the 0–60 cm soil layer, N uptake amount, grain yield, and apparent recovery fraction of applied fertilizer N in wheat (Cheng et al., 2020; Tadesse et al., 2020) also showed that moderate amounts of N and P can enhance grain yield compared with higher amounts of N and P in wheat and rice.
Conclusion
Based on our results, we concluded that rice grain yield can be increased under lower fertilization rate using hybrid cultivars. Our results suggested that low fertilization rates of 90 kg N ha−1 and 45 kg P ha−1 can increase grain yield and yield attributes in hybrid cultivars. However, hybrid and conventional cultivars of rice lead to similar yields under higher fertilization rates. Thus, the use of rice hybrid cultivars under a reduced fertilization rate might allow higher grain yields with a lower environmental cost. In order to confirm the potential of these cultivars, further studies are needed to determine the quality, initial photosynthetic rates, root attributes, and chlorophyll fluorescence of these cultivars under reduced fertilization rates.