
Bioinformatics analysis for the identification of differentially expressed genes and related signaling pathways in H. pylori-CagA transfected gastric cancer cells
- Published
- Accepted
- Received
- Academic Editor
- Alexander Bolshoy
- Subject Areas
- Biochemistry, Bioinformatics, Cell Biology, Microbiology, Molecular Biology
- Keywords
- Helicobacter pylori, CagA, Gastric cancer, Transcriptomics, Bioinformatics analysis
- Copyright
- © 2021 Chen et al.
- Licence
- This is an open access article distributed under the terms of the Creative Commons Attribution License, which permits unrestricted use, distribution, reproduction and adaptation in any medium and for any purpose provided that it is properly attributed. For attribution, the original author(s), title, publication source (PeerJ) and either DOI or URL of the article must be cited.
- Cite this article
- 2021. Bioinformatics analysis for the identification of differentially expressed genes and related signaling pathways in H. pylori-CagA transfected gastric cancer cells. PeerJ 9:e11203 https://doi.org/10.7717/peerj.11203
Abstract
Aim
Helicobacter pylori cytotoxin-associated protein A (CagA) is an important virulence factor known to induce gastric cancer development. However, the cause and the underlying molecular events of CagA induction remain unclear. Here, we applied integrated bioinformatics to identify the key genes involved in the process of CagA-induced gastric epithelial cell inflammation and can ceration to comprehend the potential molecular mechanisms involved.
Materials and Methods
AGS cells were transected with pcDNA3.1 and pcDNA3.1::CagA for 24 h. The transfected cells were subjected to transcriptome sequencing to obtain the expressed genes. Differentially expressed genes (DEG) with adjusted P value < 0.05, — logFC —> 2 were screened, and the R package was applied for gene ontology (GO) enrichment and the Kyoto Encyclopedia of Genes and Genomes (KEGG) pathway analysis. The differential gene protein–protein interaction (PPI) network was constructed using the STRING Cytoscape application, which conducted visual analysis to create the key function networks and identify the key genes. Next, the Kaplan–Meier plotter survival analysis tool was employed to analyze the survival of the key genes derived from the PPI network. Further analysis of the key gene expressions in gastric cancer and normal tissues were performed based on The Cancer Genome Atlas (TCGA) database and RT-qPCR verification.
Results
After transfection of AGS cells, the cell morphology changes in a hummingbird shape and causes the level of CagA phosphorylation to increase. Transcriptomics identified 6882 DEG, of which 4052 were upregulated and 2830 were downregulated, among which q-value < 0.05, FC > 2, and FC under the condition of ≤2. Accordingly, 1062 DEG were screened, of which 594 were upregulated and 468 were downregulated. The DEG participated in a total of 151 biological processes, 56 cell components, and 40 molecular functions. The KEGG pathway analysis revealed that the DEG were involved in 21 pathways. The PPI network analysis revealed three highly interconnected clusters. In addition, 30 DEG with the highest degree were analyzed in the TCGA database. As a result, 12 DEG were found to be highly expressed in gastric cancer, while seven DEG were related to the poor prognosis of gastric cancer. RT-qPCR verification results showed that Helicobacter pylori CagA caused up-regulation of BPTF, caspase3, CDH1, CTNNB1, and POLR2A expression.
Conclusion
The current comprehensive analysis provides new insights for exploring the effect of CagA in human gastric cancer, which could help us understand the molecular mechanism underlying the occurrence and development of gastric cancer caused by Helicobacter pylori.
Introduction
Gastric cancer is the fifth-most common malignant tumor and the third-most common cause of death worldwide (Park et al., 2018). The development of gastric cancer involves multiple aspects, including the host factors, environmental factors, and Helicobacter pylori infection. Among these, H. Pylori infection is known to cause chronic inflammation of the gastric mucosa, which in turn causes atrophic gastritis, gastric cancer, and various other gastrointestinal diseases. Reportedly, H. Pylori is a very common infective agent of the stomach across the world, and this infection has been closely related to the development of gastric cancer and its malignant precursors (Valenzuela et al., 2015). Presently, the mechanism of H. Pylori- induced damage to the gastric mucosa is not well understood. The assumed possible mechanisms include the damages caused by H. pylori colonization and toxin production, the host’s immune response, and the abnormal gastric acid secretion. Accumulating body of work supports that specific virulence factors in H. Pylori have a strong correlation with gastric cancer (Chmiela et al., 2017), including CagA and vacuolar cytotoxin A (VacA). CagA is a 128-145-kilodalton (kDa) protein that is composed of a structured N-terminal region and an intrinsically disordered/unstructured C-terminal tail. Variations in the molecular weight of CagA are due to the structural polymorphisms in its C-terminal region, which exist in distinct strains of H. pylori. Once injected into the host gastric epithelial cells, CagA is localized to the inner leaflet of the plasma membrane. CagA is encoded by the H. pylori cag pathogenic island and injected into gastric epithelial cells via T4SS, where it undergoes tyrosine phosphorylation at the Glu-Pro-Ile-Tyr-Ala (EPIYA) motif in its C-terminal region and then acts as a carcinogenic scaffold protein which physically interacts with different host-signaling proteins. From the sequence flanking the EPIYA motif, four distinct EPIYA segments have been identified in the CagA protein: EPIYA-A, EPIYA-B, EPIYA-C, and EPIYA-D.The EPIYA-C segment is present in variable numbers of copies among distinct Western CagA variants, typically represented in tandem between one to three times. The EPIYA-repeat region of CagA found in East Asian countries also possesses EPIYA-A and EPIYA-B segments but,instead of the tandem EPIYA-C segment, contains a distinct EPIYA-containing segment termed EPIYA-D (47 amino acids), and the CagA protein is referred to as East Asian CagA or ABD-type CagA.Due to the variation of the sequence flanking the tyrosine (Y) residue, the distinct EPIYA segments are tyrosine-phosphorylatedselectively by different kinases.EPIYA-A and EPIYA-C or EPIYA-B and EPIYA-D are preferably phosphorylated in combination in Western CagA and East Asian CagA, respectively.Therefore, there may be a stepwise event in which EPIYA-C or EPIYA-D is phosphorylated by SFKs at the start of an infection followed by phosphorylation of EPIYA-A or EPIYA-B by c-Abl at a subsequent time .Deregulation of SHP2, the pro-oncogenic PTPase involved in the regulation of cell growth, motility, and morphology.East Asian CagA exhibits a stronger ability to bind/deregulate SHP2 and a greater capability to induce SHP2-dependent morphological changes in gastric epithelial cells than Western CagA. Collectively, the findings reveal that the East Asian CagA-specific EPIpYA-D motif is qualitatively very different from the Western CagA-specific EPIpYA-C motif in terms of the biological activity required for deregulation of the SHP2 oncopro-tein, which may causatively account for the higher incidence of gastric cancers in East Asian countries than in Western countries (Takahashi-Kanemitsu, Knight & Hatakeyama, 2020). CagA affects the proliferation and apoptosis of cells through various regulation and signaling pathways, ultimately promoting gastric mucosal carcinogenesis (Takahashi-Kanemitsu, Knight & Hatakeyama, 2020).
Past studies have demonstrated that the non-physiological scaffolding of CagA in cells promote the malignant transformation of normal cells by conferring onto them cancer markers with multiple phenotypes. In chronic inflammation, CagA’s in vivo carcinogenic activity is further enhanced. Because H. pylori infection triggers a pro-inflammatory response in the host cell, the resultant feed-forward stimulation loop enhances the carcinogenic effects of CagA and cause inflammation in the gastric mucosa, where CagA is injected. Considering the need for clarification on these aspects, we attempted to explore the molecular mechanisms of CagA-induced gastric epithelial cells to seek effective molecular targets in order to provide a basis for early clinical diagnosis, prevention, and treatment of gastric cancer (Cover, 2016). Then, we applied integrated bioinformatics to identify the key genes involved in the process of CagA-induced gastric epithelial cell inflammation and canceration to comprehend the potential molecular mechanisms involved.
Materials and Methods
pcDNA3.1::CagA plasmid vector transfection of AGS cells
The CagA plasmid pcDNA3.1(+)/cagA and the empty vector pcDNA3.1(+)/EGFP were purchased from Nobel Biotech (Shanghai, China). AGS cells were obtained from the ATCC. AGS cells were incubated in RPMI-1640 medium (Gibco, Grand Island, NY, USA) supplemented with 10% heat-inactivated fetal bovine serum (Gibco), 100 U/ml of penicillin, and 100 g/ml of streptomycin at 37 °C in a humidified incubator (NSE, Brunswick, NJ, USA) containing 5% CO2. AGS cells were seeded in 6-well plates respectively at a density of 5 × 10⁶ cells/well, grown to whose confluence reached at 60–70%, then the cells were transfected with 3 µg plasmid and 5 µl Lipofectamine 2000 (Invitrogen, USA) in 125 µl Opti-MEM™ medium (Gibco, USA) followed by the addition of 1,875 µl Opti-MEM™ medium according to the manufacturer. After 24 h the transfection efficiency was evaluated by observation under a fluorescence microscope, and the relevant cell samples were collected. The CagA expression was verified by western blotting.
Differential gene collection and screening
The vectors pcDNA3.1::CagA and pcDNA3.1 were transfected into AGS cells respectively. After 24 h, cell samples were collected and sent to NOVOgene (Beijing, China) transcriptome for sequencing to obtain the differentially expressed genes between the two. By adjusting P < 0.05, — logFC —>2, the genes with significant differences are listed.
Analysis of gene ontology (GO) enrichment and the Kyoto Encyclopedia of Genes and Genomes (KEGG) pathway of differentially expressed genes (DEG)
The GO enrichment analysis is a commonly used method for large-scale functional analysis. The gene functions can be classified as biological processes (BP), molecular functions (MF), and cellular components (CC). KEGG is a widely used database that stores the information on a large number of related genomes, biological pathways, diseases, chemicals, and drugs. We applied the R package with data package, visualization, and integrated discovery to perform GO enrichment analysis and KEGG pathway analysis on the DEG in this study, with P < 0.05 considered as statistically significant, and passed the “ggplot2” of R package to visually generate histograms and lists (Tang et al., 2020).
PPI network construction and key cluster identification
The PPI networks of DEG were constructed using the STRING database (Gu et al., 2019) (http://string-db.org), which is a software application that is commonly used to identify interactions, assess potential PPI relationships, and identify previously determined differences. Briefly, the DEG were mapped into the STRING database. The PPI networks were then visualized by the Cytoscape software (Gu et al., 2019) (https://cytoscape.org/). The software predicts the network, with each node as a gene. The network visualization helps identify the interactions and pathway relationships among the proteins encoded by DEG in gastric cancer. The corresponding protein in the central node could be a core protein or a key candidate gene with important physiological regulatory functions. According to the Cytoscape visualization network of molecular interactions, the Molecular Complex Detection (MCODE) plug-in is used to identify densely interconnected clusters, based on the following selection criteria: degree ≥ 2, node score ≥ 0.2, K-core ≥ 2, max depth = 100 (Li, 2019).
Selection of key genes and their expression analysis in Hp infection status
The top 30 central genes with the most connections in the PPI network are defined as key genes. The differential expression of Hp infection and uninfected tissues was analyzed with reference to the TCGA database (P < 0.05 is considered to indicate statistical significance).
Survival analysis of the key genes
The Kaplan–Meier plotter database (Ma, Zhou & Zheng, 2020) (http://www.kmplot.com) is an online tool that can be used to evaluate 54,675 genes under the conditions of 10,461 cancer samples. We used this database to perform a survival analysis (P < 0.05 was considered to indicate statistical significance). Functional enrichment analysis of the genes that were highly expressed in gastric cancer was performed.
Identification of RT-qPCR
The cagA gene knockout mutant strain Hp/cagA cm was constructed by Sangon Biotech( Shanghai, China). AGS cells were seeded in 6-well plates respectively at a density of 5 × 10 6 cells/well, grown to whose confluence reached at 60–70%, then the cells were infected with Hp/ ΔcagA::Cm and Wild type Hp/cagA + with a multiplicity of infection (MOI) of 30, respectively. 24 h later, these cells were harvested to investigate BPTF, CASP3, CDH1, CTNNB1 and POLR2A mRNA levels by RT-qPCR.
Western blot
The total protein was extracted according to the instructions of the lysate kit. After quantification by the BCA protein quantification kit, SDS-PAGE electrophoresis for 2 h, membrane transfer for 2 h, 1XTBST (0.05% Tween20) solution containing skimmed milk powder was blocked at room temperature for 2 h, and CagA primary antibody was added (1: 1,000), p-CagA (1: 1,000), GAPDH (1: 5,000) Incubate overnight at 4 °C, wash the membrane with 1 ×TBST (0.05% Tween20) solution 3 times, 10 min/time, add two Incubate at room temperature for 2 h with anti (1 :10,000), wash the membrane with 1 ×TBST as above, add a chemiluminescence reagent for color development, and expose and image with a chemiluminescence imager.
Results
Transfection of pcDNA3.1::CagA plasmid into AGS cells and verification by western blotting
After 24 h of transfection of pcDNA3.1::CagA, The efficiency of fluorescent transfection is estimated to be >70% (Fig. 1A). The morphology of the cells was observed under the microscope. It was found that compared with the control group(Control) and the empty vector group(pcDNA3.1), the morphology of the cells in the cagA transfection group(cagA) changed significantly. The shape of the cell changed from obtuse to long fusiform, spindle-shaped, irregular, and the polarity of the cell disappeared, showing a ‘hummingbirdchange’ (Fig. 1B). Western blot verification showed that CagA and p-CagA protein was successfully expressed in pcDNA3.1::cagA transfected group (Fig. 1C).
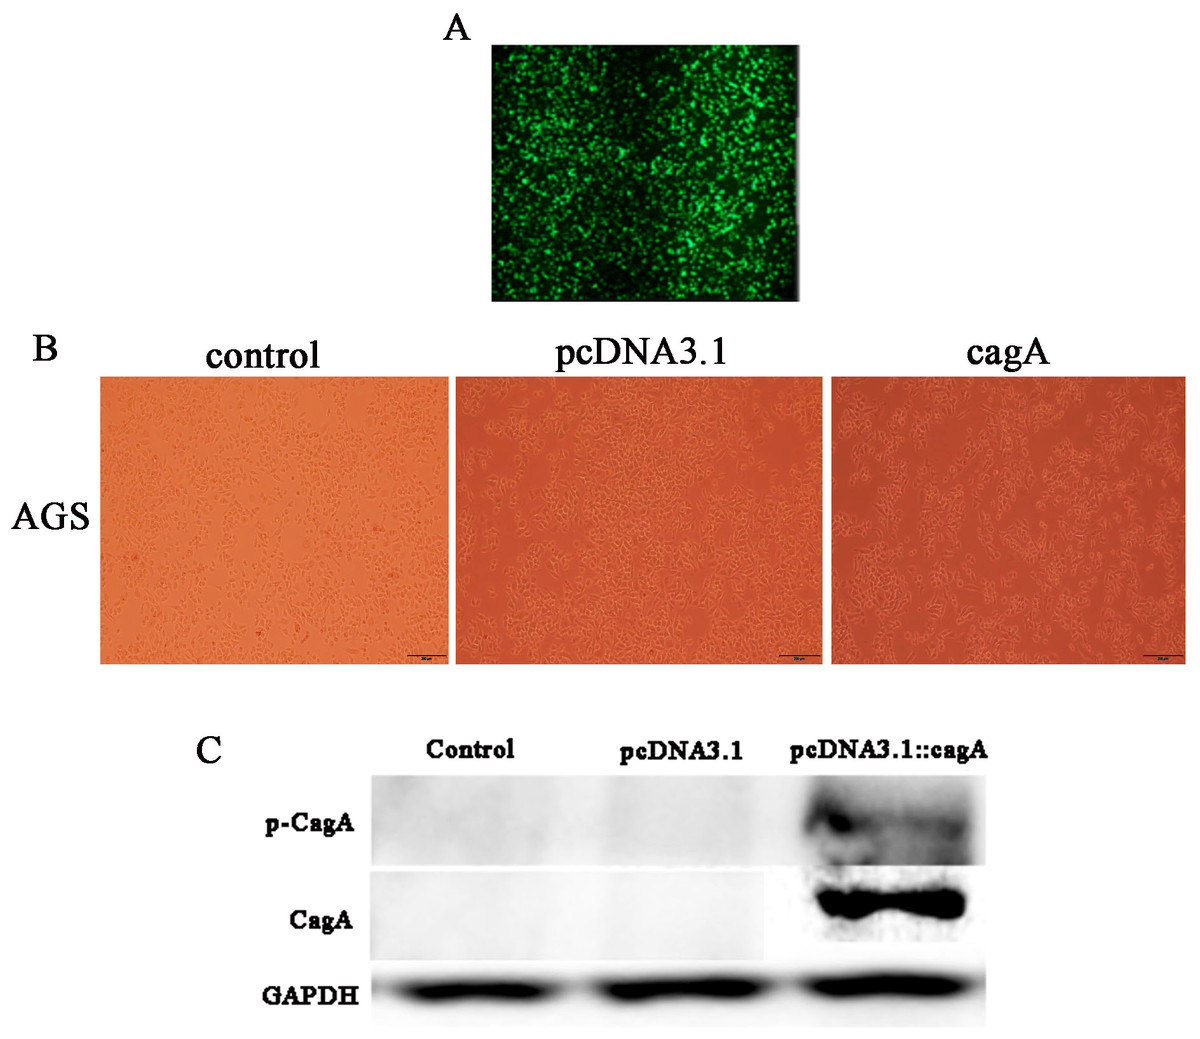
Figure 1: Detection of pcDNA3.1::cagA plasmid transfection efficiency and CagA expression in AGS cells.
pcDNA3.1:: cagA plasmid was transfected into AGS cells for 24 h, the transfection efficiency observed under a microscope and measure the protein levels of CagA and phosphorylated CagA by Western blotting. (A) Fluorescence showed that the transfection efficiency reached > 70%; (B) cagA plasmid transfected group shows hummingbird-like changes in cell morphology. (C) The protein levels of CagA and p-CagA were showed inpcDNA3.1::cagA transfected group. The control group represents the untreated group; pcDNA3.1 group represents the AGS cells transfeced with empty vecter pcDNA3.1; pcDNA3.1::cagA group represents the AGS cells transfected with pcDNA3.1:: cagA.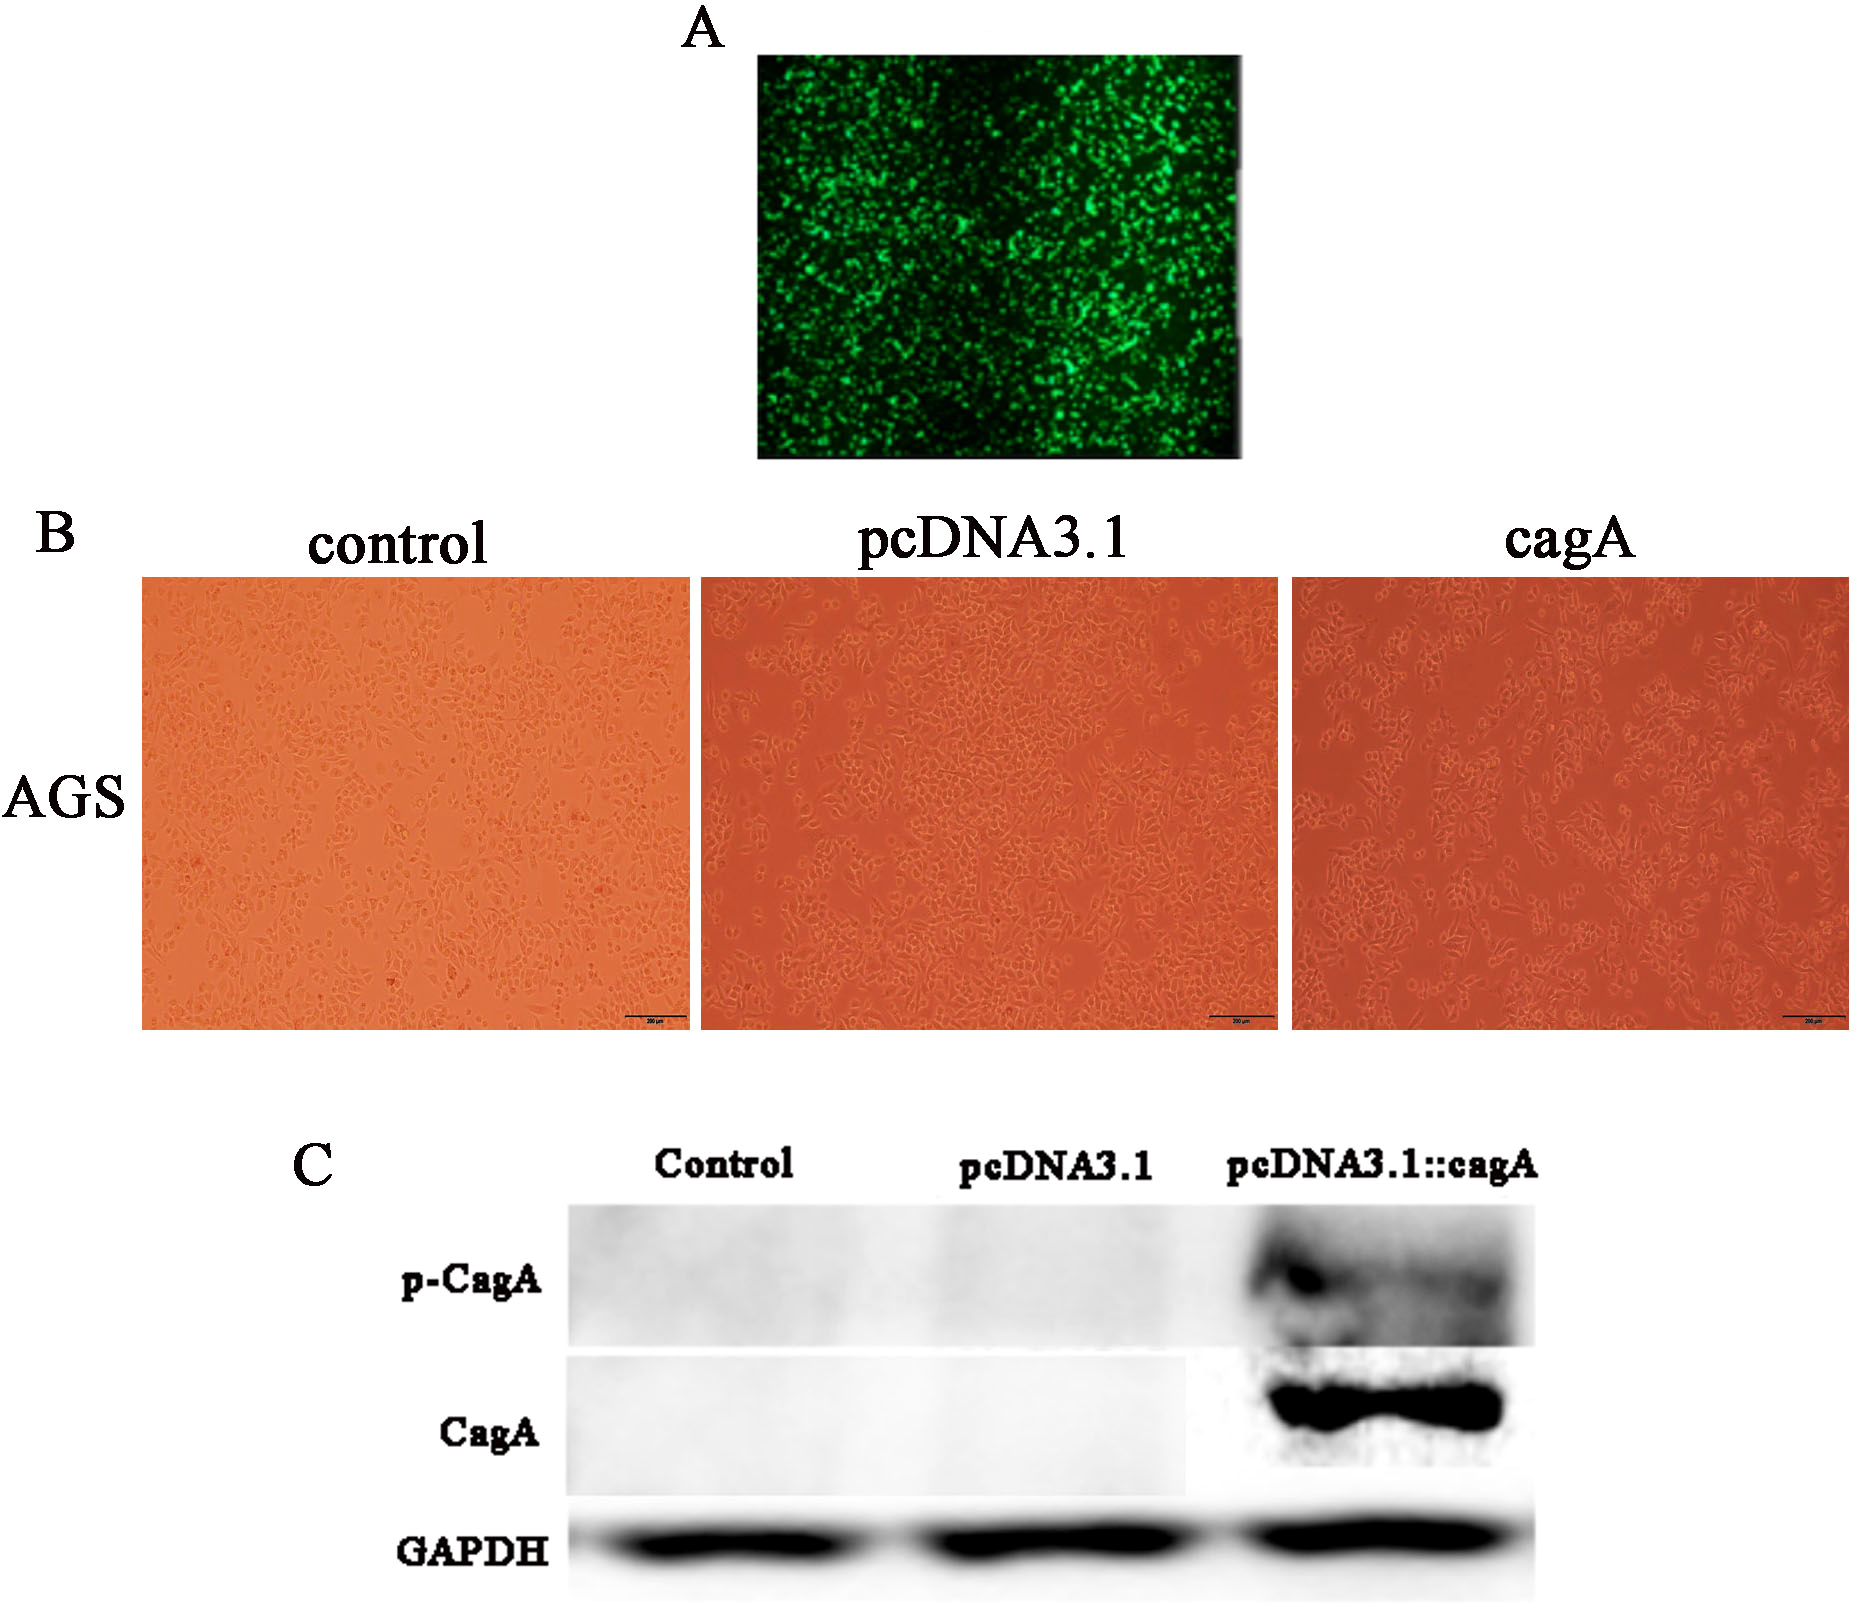
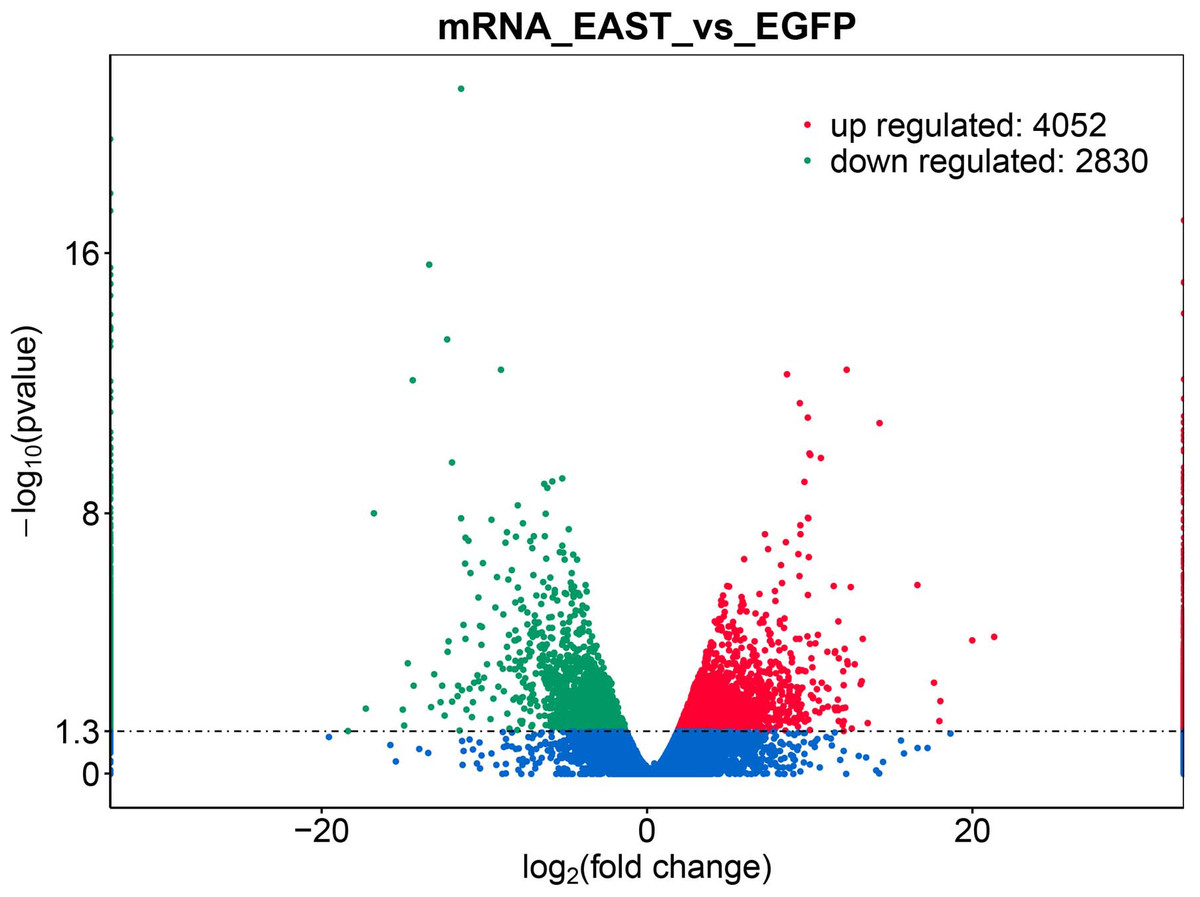
Figure 2: Differential expression of data between two sample sets.
The red points represent upregulated genes screened on the basis of |fold change |>2.0 and a corrected P value of <0.05. The green points represent downregulation of the gene expression screened on the basis of |fold change |>2.0 and a corrected P-value of <0.05. The blue points represent genes with no significant difference. FC indicates the fold change.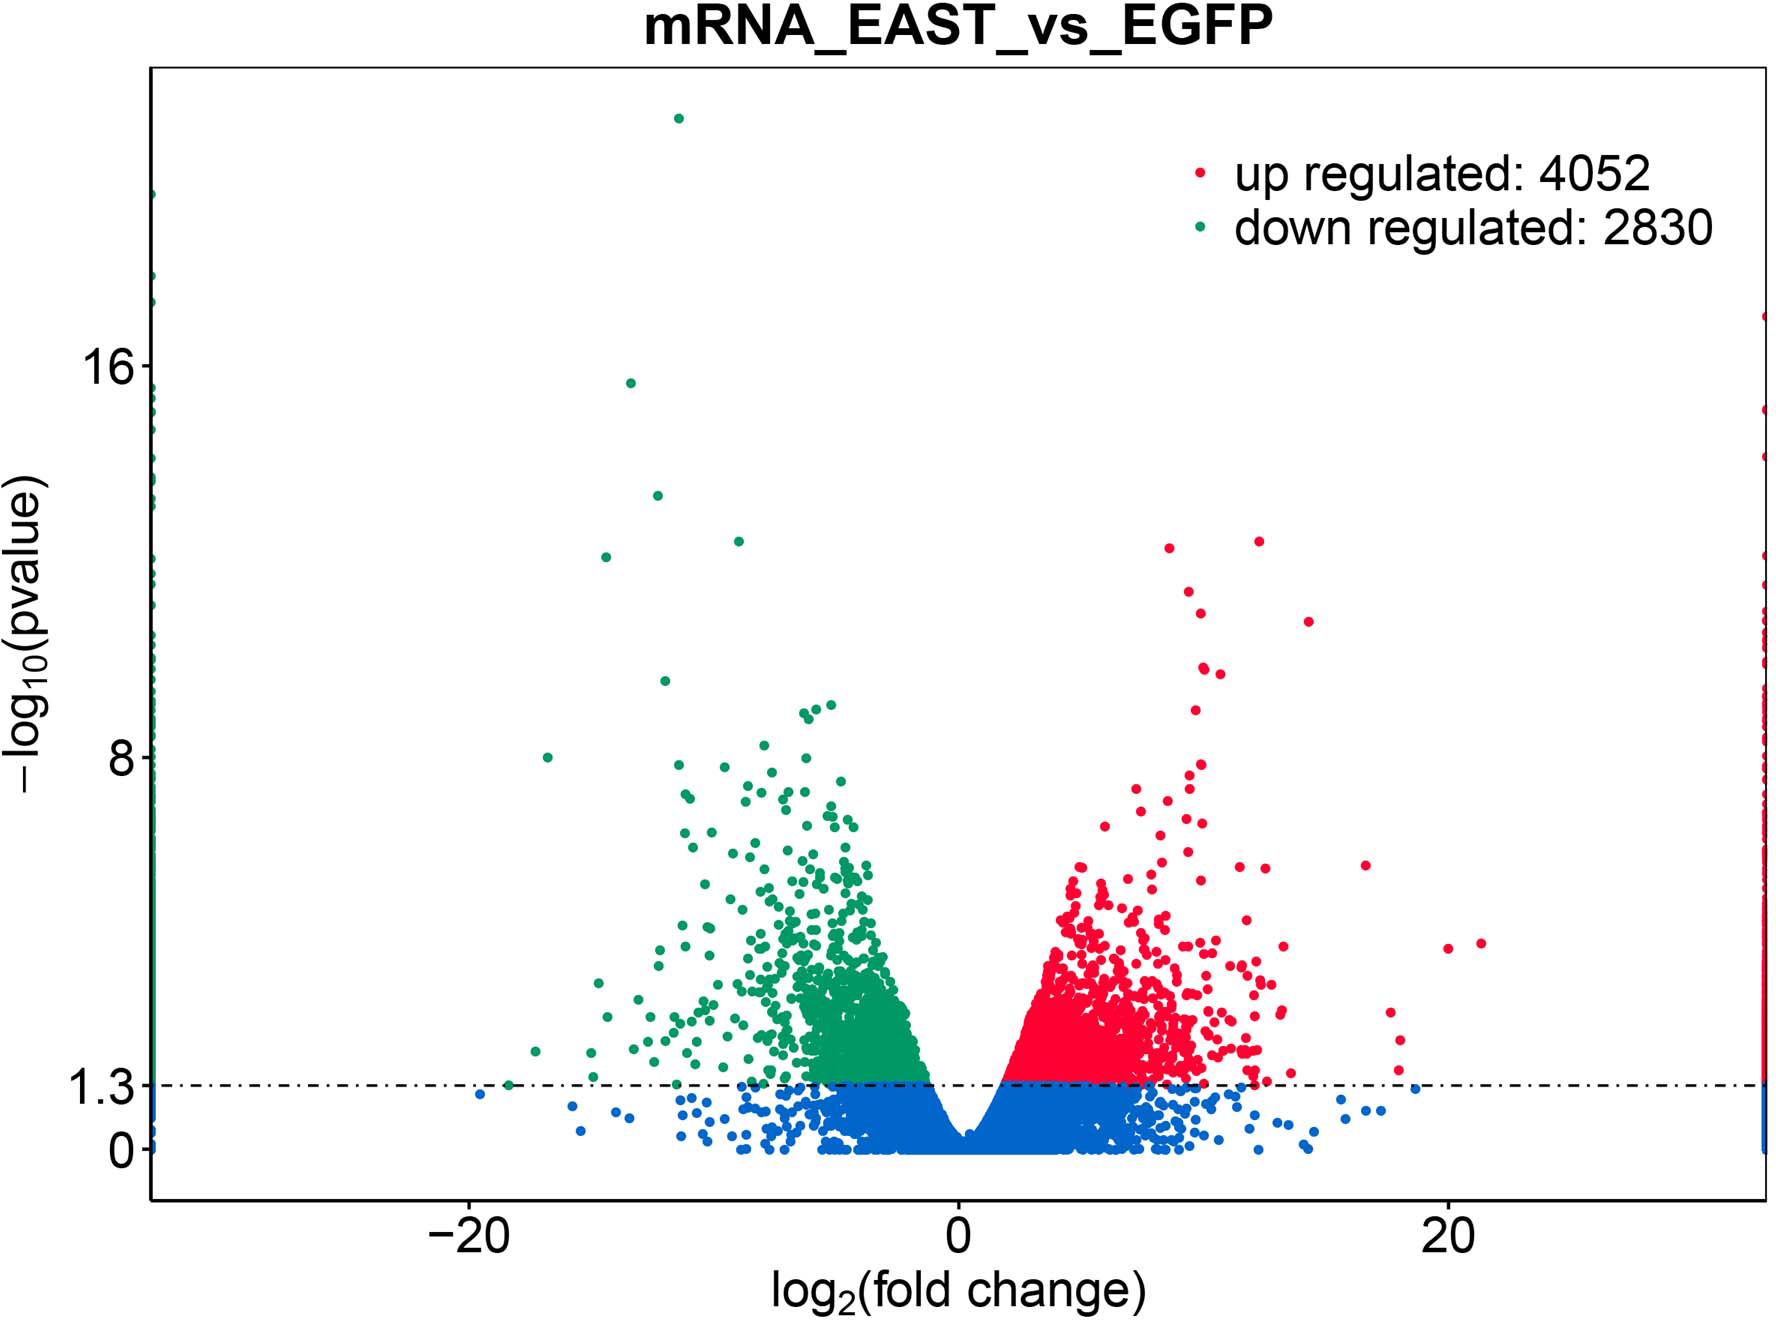
| DEGs | Gene names |
|---|---|
| Upregulated: | ATM AHNAK2 MYCBP2 UBE4A KIAA1109 MIEF1 LSM12 FRYL SYVN1 GSN RERE STK36 ACTN1 SMG1 KMT2A PIK3CB HAS3 ACOT7 CHTF8 KIF21B ANO1 ADCY3 PPIP5K1 HUWE1 ZNF184 ADGRG1 ABR MUC1 FRYL PTPRF KMT2D BICRA DHCR24 TNRC18 BCORL1 YLPM1 SYNE1 DST YLPM1 COL1A1 XIAP NCOR2 BRD4 TRIM32 CTDP1 HSPA8 EIF3L PRR12 KDM6B LMNA NUP214 LAMA5 CKMT1A ARHGEF11 ATXN2L HSPG2 NCOA6 BAZ2A PIGB BPTF AKT1S1 PCBP2 MCM3AP NR2F2 ATN1 MYO10 AFF1 FNDC3A ILF3 VPS13D FGD4 MYSM1 NOL8 LAS1L ANP32E FOXM1 DGKZ CDC73 CALU SUPT20H GLT8D1 SLCO2A1 NEDD4L OXA1L CTNNA1 PCBP2 GART ALG11 RREB1 DDX5 PTCH1 TYW3 ZNF703 TJP2 HMBOX1 C6orf106 NPIPB12 CLASP1 ERGIC3 PEAK1 LRP1 ARNTL CTNNB1 DDX11 SCMH1 ZNF615 DENND3 RAPH1 KMT2D TRIM16 SMC4 SUPT5H SLC39A4 YWHAZ ZFP36L1 LRRC8D MED13L POLR2A SRCAP SMC1A TRMT1 PEX5 PARVA BIRC2 LCOR TNK2 BCL9L CTNND1 RARG AAK1 TENT2 CACHD1 ZC3HAV1 UBE2V1 UBR4 CEP85 SPEN PDXDC1 DNM2 AKAP13 DLGAP4 PTPN23 MLXIP STAT1 CAP1 CAMSAP2 ADNP SRCAP KANSL1L TMEM150A ARHGEF10L TBC1D15 SH3D19 PRRC2C SRRM2 MLXIP NPIPB5 P2RX4 TEF PPP6C ZNF615 ENTPD2 PROX1 VKORC1L1 EP400 SH3YL1 DPF2 SEPT2 MUC1 RABEP2 ZNFX1 SLC9A7 PGRMC2 CPEB3 TCTN3 RAD23B KDM6B CELSR2 WIZ NRDC CEACAM1 YAP1 RALBP1 SEC31A UBAP2L STAT6 CLTC FOXP1 FBXW11 CNOT6 KMT2C ARHGEF11 SMARCA4 TBC1D7 ZSWIM8 ABTB1 POM121 VPS37B CLASP2 SRGAP1 SLC35A3 RNPS1 SLC30A6 SEPT9 CCNE2 USP20 TGFBRAP1 RPL21 STX16 BCAS3 RBM26 CREBBP HDAC1 BTBD3 URGCP FOXP1 CSDE1 ZNF28 PKIG RPS7 IFT140 SRCAP GSN SECISBP2 LTBP3 TJP2 GPR35 PRSS23 PLA2G2A DENND4B CREBBP ASXL2 CABIN1 ESYT2 ATP2A2 MYCBP2 PRAG1 KANSL1 SORBS2 ARID1A MEF2D RPL34 RALGPS1 CEP85 CBFA2T2 TACC2 ZNF10 IGF1R HDAC8 ACIN1 ZFAND6 ZFHX3 HNRNPH3 ZMIZ1 RHOC ZNF638 SYNPO TPK1 HNRNPA3 SSBP3 ATG2A PPP4C PLEC IGSF9 IP6K1 NFATC3 PIGN SAMD12 VOPP1 AC091057.6 ASPSCR1 HNRNPA3 HECTD4 ATXN2L DOCK9 PLXNB2 CEP44 NPIPB3 FGFR2 AP3B1 MYO10 ZNF720 HARS EPB41L2 SEPT7 RNF145 MPND PLCXD1 MEST MX2 ZNF567 CACNG8 KMT2D KAT6B PPM1B FASN RERE RHBDF2 RNF128 SFT2D2 DISC1 TANC2 APBB2 MED12 ARID1A PIK3CB ZFPM1 GRIN2D ZFHX2 FGGY LEPR NPIPB4 C6orf132 TRIOBP ANKRD11 OXSR1 FAM210A SMIM8 FAM98B STK24 AFDN AHDC1 AL354822.1 AFAP1 FUS TBC1D15 HNRNPA2B1 SEPT9 NKD1 YIPF1 TSPAN14 ADAR ESRP1 NPIPB5 ATXN10 BRD3OS KMT2B DYNC2H1 TRIM7 USP48 DMTN BCL11B COBL ZC3H12C FAM47E XBP1 PCBP2 R3HCC1L MRTFA ARHGEF9 ERI1 RNF4 CASP3 EML4 PTPN21 RNF213 ATRX SYNE2 SCAF1 BROX DSP NPIPB5 SMARCAD1 USP48 ASCC1 ZNF107 DCAF13 PDCD4 PIK3C2B HCFC1 USP49 ANO1 ARHGAP12 MEN1 TAF1C PDX1 SAMD4B MYBBP1A NEK11 TAB2 MAVS NEURL4 KDM6A ELMSAN1 PILRB ZNF532 TRIM66 VPS35L TXNDC11 ZFHX3 PHLDB2 MYO10 NLRP1 MATN2 ANP32B TRIM27 RNF111 HNRNPH2 EP400 PARP9 CNOT9 HOXC6 ZNF761 LARP7 NR4A1 GAA ZNF841 SMC1A RNPS1 MBNL2 PHTF1 YLPM1 PTPN12 IPO8 VTA1 CHD4 EPS8 PTK2 FBXW7 MICAL3 MAST4 PITRM1 DCLRE1C PTOV1 ARMCX4 TIMP1 HELZ2 KIAA0895 CDH1 LTN1 ZC3H4 ZNF865 HNRNPM TNKS AAK1 CMIP ZNF326 CTBP2 CFAP44 SH3D19 PKP4 TRRAP HELZ2 TRIM4 LITAF SLC22A18 MUC1 UBE2D2 PPARG RUVBL1 SLC22A23 ATRX TMEM214 UCKL1 TTC21A KIAA1211 NPIPB3 PCM1 SMARCA4 PLXNB2 KDM4B HNRNPUL1 POM121C MEST BCL11A SMAD5 ACVR1B RANGAP1 SEC16A CEACAM1 RAB7B ADCY3 GRK6 MORC2 RBM17 NAV2 ANKFY1 SON FBXL8 CDRT4 RRM2 PLCB1 PCDHGB5 CRTAP CREBBP URM1 CANT1 DCAKD HIPK2 PLEC ZNF18 SMARCA4 AHNAK MEF2D ALG11 C1QTNF3 HNRNPU SEZ6L2 BCAM LIMA1 USP6NL ELF1 AFDN ARID4B PABPC4 PTPRF CCNK WDHD1 UBE2K SH3D19 BCLAF3 USP16 PRDM2 HADH ADAM20 GEMIN2 GRAMD1A POU5F2 ZNF516 PLEKHA7 TMEM80 HTATSF1 PHKB MIDN CREB3L2 SP110 KCNC3 PCDHGA12 TSFM BCL9 COL27A1 BRD1 KDM6A TCTN1 KMT2A SETD1A RAB12 AP3D1 MICAL1 MROH1 RBM33 CPT2 MEIS2 ITGB1 TGFB1 COPZ1 KRBA2 ST3GAL3 MPLKIP TMCC3 ZBTB43 NCOR2 RAVER1 ZBED3 EPHX1 FAS KDM4C USP48 KIAA1217 NFAT5 PCMTD2 NPIPB3 SOCS4 PPP6C UVSSA HMGA2 MYCBP2 TAP2 RUNX1 TRIO ABCB8 LTBP3 MMS19 TAF5L USP21 KIAA1549 DIDO1 GRAMD1A PLEKHB2 FTO CLK2 MAML1 ITSN1 RNF4 TRIM3 SUCLA2 RPL18 HNRNPD PML CHD1 DTX2 RUNX1 PALLD TVP23C |
| Downregulated: | DHCR24 GRSF1 MRNIP RALBP1 HACD3 RNF6 LSM7 MATR3 PDIA6 TAF5L RPL15 HBP1 IFNGR1 NEDD1 SCAND1 TCEA1 SLA2 PSMC2 CNTD1 SNX22 FAM161B ISG15 CAPN12 NACA BEST1 ACSBG1 RPS27 FAM166A CEP85 SAP18 MORF4L1 KMO ARFGAP1 MMACHC NOL8 EML5 TYK2 ATP5ME CPM GSTM3 EXOC3 MXD3 SLC9A6 PLEKHB2 PHTF1 CCDC73 TUBB6 TMEM87A LTO1 RPL34 TAGLN SRRT PET100 ATP6V1C2 MCF2L2 RPL5 AC025283.2 AC243967.1 LSMEM2 STX6 SSR1 MPC2 SLC4A11 SCAND1 CIDEB FARP1 LCOR TGFB1 RAB11A GLIPR1 RSPH10B RPL27 SARM1 IMPA1 ATXN7L3 USP33 PFDN5 CASP4 MPLKIP HNRNPDL ZNF283 NR1I3 USP33 STRADB ATM GAN ASAH1 ATP5MF SERF2 ATP2B1 TBCB RBM6 LRPAP1 IFNLR1 DTNBP1 PFKFB2 LGR5 FAM220A WDR83OS AC015802.6 NECAP1 CCSAP BCAP31 RPL36 C19orf53 BCAT2 AHNAK2 SLC18A2 UGDH HIST1H2BC UBAP1 HNRNPAB CDK4 SKP1 GLOD4 UBXN1 NDUFS5 NDUFB2 TMEM222 SLC9A6 ZNF75A TRIM59 RPL35A CCDC12 GPS1 CSNK2A1 PCF11 RILP FAR2 METTL6 PLLP RBPJ ZFAND6 TSPAN31 CPSF6 ETFRF1 RBM42 CASKIN1 DENND1C PRKAR1B CLDN6 DNAH11 FAM222B LBHD1 LARS DYNC1I2 RAN KPNB1 TJP2 MYL6 CDC42 KLC4 ANKS1B UGP2 ATP5MC2 NKX6-2 ATP8B4 TOMM5 SGK3 VPS35L ZNF143 PFDN6 NDUFA1 TBC1D31 ELOC RALB COX7A2 HM13 GSTP1 IGFBP7 PMFBP1 MAP2K4 SMCO4 SPC24 NR1I3 SAP18 SHLD2 FAM92A AL391650.1 RPL23 FUZ BNIP2 C11orf98 PARD3 CBFB AC138811.2 FLG DENND2A PARD3 NKAPD1 EMILIN3 MMADHC SPTY2D1OS IDI2 SLBP COQ8B CABP7 SEMA4D RPL38 FSD2 B3GAT2 NAP1L4 NDUFB1 KIAA0895 SNAPC5 IL17D UBA3 IFT20 NDUFS6 HARS2 EVPL RAD51AP1 MPC2 DOK7 TMBIM6 FASTK TATDN1 TNKS1BP1 ATP5MF RPL27 ZACN OR2I1P SERPINA1 MRPL13 PMEL UBP1 SMIM12 COCH CP SLC30A5 RNF4 GUK1 DCDC2B TRIM37 SLC39A6 UBP1 ASNSD1 TRMT112 POC1B-GALNT4 TMCO1 SLC35B1 PSMC3 GCA TMEM200B EDF1 C19orf53 ARPC5L NOTCH2NLA TMA7 PHTF2 FAM177A1 MTLN NAP1L1 AHCTF1 NDUFS5 HMGN2 RPL37A CBWD6 GTF2A2 TAF1D GPM6B FBXL17 HARS PRMT7 GMFG RPL35A CENPW PEX5 INTS9 PPP4C RPL11 ATG4C TFEB RPL21 PRR13 CBLN3 GPR22 NACA RPL36A TAP2 HSFX4 CFAP36 COX14 HIST1H3J UQCRB CEP57 RPL37 YAP1 ODC1 FANCL TMEM223 RPL31 HMOX2 SRP14 HOMER3 CFAP73 TUBB1 RUVBL1 TPM1 TOMM7 AC001226.2 KAT6A IFNGR1 PPP1R18 AC092718.8 CCDC175 DHCR24 ZNF320 PRAG1 RAD52 PARD3 PFDN5 DOC2A PDCD5 HARS SEPT2 HIST1H4L MRNIP PFN1 BTF3L4 CIRBP RPL30 SYNC GPI TCEAL4 PTGDR2 NPC2 ERLIN2 RSPH9 RNF38 ENTPD1 MEMO1 ESRP1 ANKRD6 UBA52 RPL21 SMARCE1 AFDN SLC35A2 CD72 CD63 PHB KRT8 PI4KA GMFB NAA38 RPL38 DRAP1 ESRP1 OCIAD1 RAB12 PPP1R27 ENY2 SYK DNAAF1 PKM PRELID1 TRMT112 SLC19A2 UBA52 PTPN2 NRF1 PAGE4 TMEM33 PPP1R13B AMZ2 MRPL33 RPS23 TCP11L1 XRCC3 ZNF74 UBXN1 PRDX5 C8orf59 CFAP57 CAST WNT5B CSNK2B SPAG9 DAZAP2 SH3YL1 RPS2 ARMCX3 PON2 RPL36A DMTN RPL13 SCARB2 S100A2 HSFX3 RAP1GAP KDELR1 C7orf25 COA6 ACADM HARBI1 C5orf30 EFCAB2 PTGES3 PHKG1 PDCD10 GPAT4 HACD4 PAFAH1B1 MYL6 CD55 LONP1 RPL13A BCAP31 SLC5A2 C2orf16 UQCRC2 IFNGR2 SRPX2 SLC10A1 CBFA2T2 EFNB2 STUB1 HADHA DHCR24 EFCAB10 IMMT AMN1 NDRG1 RPL8 ZFAND6 PTMA TULP2 SERPINB6 M6PR RPL28 AGR2 HDAC4 SPNS2 MID1IP1 CAST EXOSC8 CTDNEP1 CGGBP1 SLC29A1 USP45 ASCC2 SLC7A7 ATP6V1G2 C7orf25 FAM81A SH3GLB1 OSBPL2 CPOX ALKBH6 SOD2 STRBP NAT9 GCSAM LSS ZNF3 TMEM218 SERINC4 ORMDL1 1-Mar MECP2 DBI MMEL1 LRP6 TAF1C DALRD3 RPS6KA3 RPL35 |
Notes:
- DEGs
-
differentially expressed genes
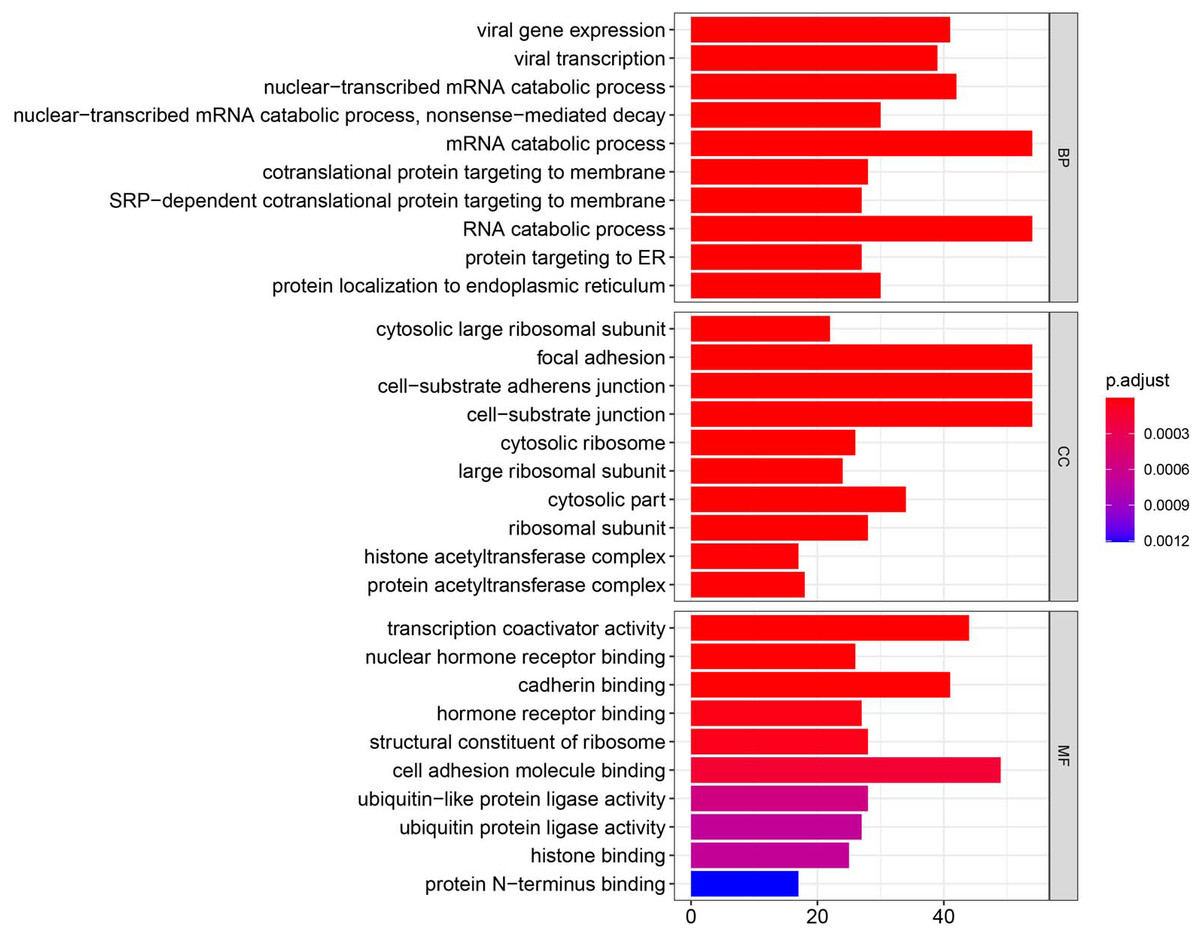
Figure 3: GO enrichment analysis of DEGs.
GO analysis categorized DEG into three functional groups: molecular function, biological processes, and cell composition.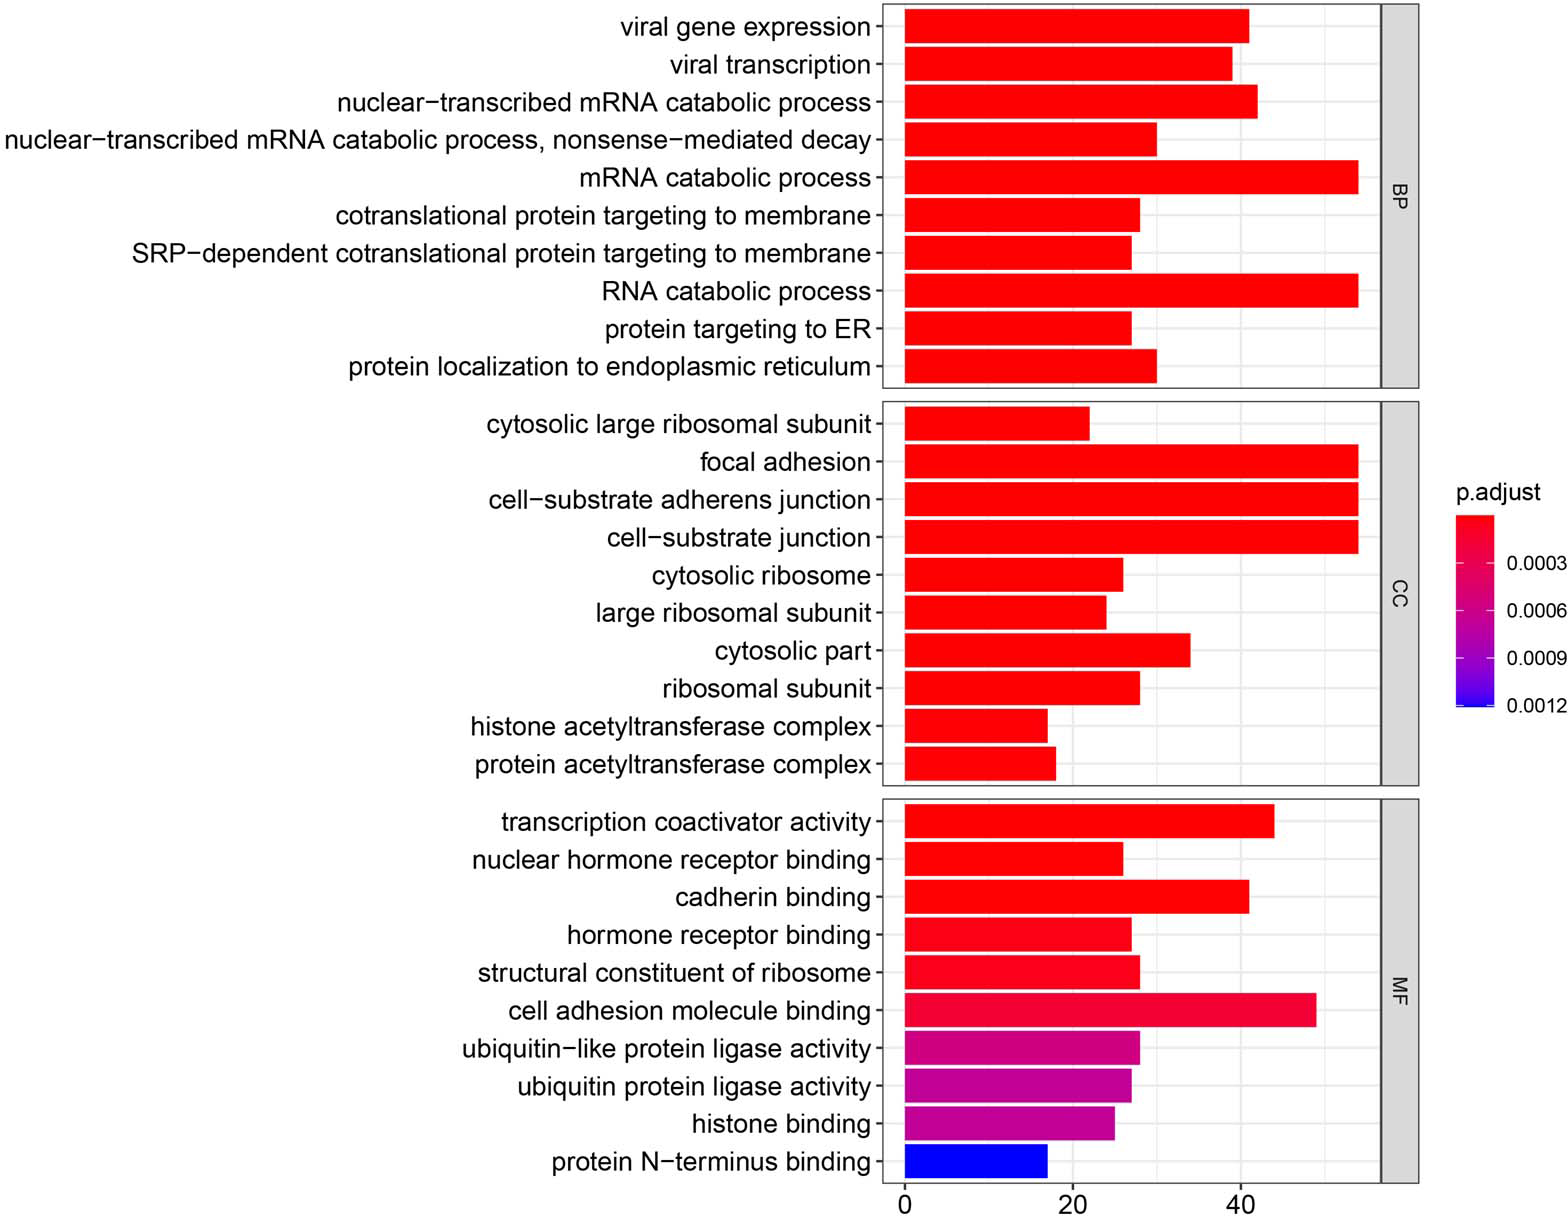
Screening DEG
The application of transcriptomics identified 6,882 common genes, of which 4052 were upregulated and 2830 were downregulated (Fig. 2). At adjusted P < 0.05, —logFC —>2, 1062, DEG with statistical significance were further screened to identify 594 upregulated and 468 downregulated genes (Table 1).
| Term | Description | Count | P-value |
|---|---|---|---|
| GO:0019080 | viral gene expression | 41 | 2.00E–13 |
| GO:0019083 | viral transcription | 39 | 2.30E–13 |
| GO:0000956 | nuclear-transcribed mRNA catabolic process | 42 | 2.37E–13 |
| GO:0000184 | nuclear-transcribed mRNA catabolic process, nonsense-mediated decay | 30 | 1.00E–11 |
| GO:0006402 | mRNA catabolic process | 54 | 1.00E–11 |
| GO:0006613 | cotranslational protein targeting to membrane | 28 | 2.82E–11 |
| GO:0006614 | SRP-dependent cotranslational protein targeting to membrane | 27 | 6.77E–11 |
| GO:0006401 | RNA catabolic process | 54 | 2.36E–10 |
| GO:0045047 | protein targeting to ER | 27 | 1.09E–09 |
| GO:0070972 | protein localization to endoplasmic reticulum | 30 | 1.37E–09 |
| GO:0072599 | establishment of protein localization to endoplasmic reticulum | 27 | 2.08E–09 |
| GO:0016569 | covalent chromatin modification | 57 | 5.86E–09 |
| GO:0016570 | histone modification | 55 | 9.37E–09 |
| GO:0006612 | protein targeting to membrane | 33 | 4.53E–08 |
| GO:0006605 | protein targeting | 51 | 1.11E–07 |
| GO:0006338 | chromatin remodeling | 28 | 3.94E–06 |
| GO:0090150 | establishment of protein localization to membrane | 40 | 4.60E–06 |
| GO:0019058 | viral life cycle | 39 | 9.44E–06 |
| GO:1904837 | beta-catenin-TCF complex assembly | 11 | 9.72E–06 |
| GO:0006413 | translational initiation | 28 | 1.16E–05 |
| GO:0030522 | intracellular receptor signaling pathway | 33 | 0.000112261 |
| GO:0043401 | steroid hormone mediated signaling pathway | 25 | 0.000193979 |
| GO:0071383 | cellular response to steroid hormone stimulus | 30 | 0.000231361 |
| GO:0018205 | peptidyl-lysine modification | 40 | 0.000377348 |
| GO:0031647 | regulation of protein stability | 32 | 0.000377348 |
| GO:0030099 | myeloid cell differentiation | 40 | 0.001113214 |
| GO:0034332 | adherens junction organization | 20 | 0.001117253 |
| GO:0050792 | regulation of viral process | 25 | 0.001423449 |
| GO:0009755 | hormone-mediated signaling pathway | 27 | 0.001423449 |
| GO:0043484 | regulation of RNA splicing | 19 | 0.001726434 |
| GO:0043900 | regulation of multi-organism process | 38 | 0.002773222 |
| GO:0034330 | cell junction organization | 30 | 0.003325059 |
| GO:0043903 | regulation of symbiosis, encompassing mutualism through parasitism | 25 | 0.003664061 |
| GO:0016573 | histone acetylation | 20 | 0.003664061 |
| GO:0030518 | intracellular steroid hormone receptor signaling pathway | 18 | 0.003887898 |
| GO:0019079 | viral genome replication | 17 | 0.004734418 |
| GO:0048525 | negative regulation of viral process | 15 | 0.004893681 |
| GO:0018393 | internal peptidyl-lysine acetylation | 20 | 0.005107113 |
| GO:0043967 | histone H4 acetylation | 12 | 0.005107113 |
| GO:0002181 | cytoplasmic translation | 15 | 0.005107113 |
| GO:0033143 | regulation of intracellular steroid hormone receptor signaling pathway | 13 | 0.005220493 |
| GO:0016331 | morphogenesis of embryonic epithelium | 19 | 0.00555893 |
| GO:0016578 | histone deubiquitination | 7 | 0.005647965 |
| GO:0051052 | regulation of DNA metabolic process | 38 | 0.006801205 |
| GO:0006475 | internal protein amino acid acetylation | 20 | 0.006801205 |
| GO:1905331 | negative regulation of morphogenesis of an epithelium | 6 | 0.007269559 |
| GO:0042692 | muscle cell differentiation | 35 | 0.007269559 |
| GO:0048545 | response to steroid hormone | 35 | 0.007269559 |
| GO:0030521 | androgen receptor signaling pathway | 11 | 0.007885335 |
| GO:0018394 | peptidyl-lysine acetylation | 20 | 0.007885335 |
| GO:0072175 | epithelial tube formation | 17 | 0.009185473 |
| GO:0034329 | cell junction assembly | 25 | 0.009304069 |
| GO:1903901 | negative regulation of viral life cycle | 13 | 0.010119749 |
| GO:0030111 | regulation of Wnt signaling pathway | 33 | 0.010318481 |
| GO:0035148 | tube formation | 18 | 0.011328993 |
| GO:0006473 | protein acetylation | 22 | 0.012697644 |
| GO:0044782 | cilium organization | 34 | 0.01287833 |
| GO:0006354 | DNA-templated transcription, elongation | 15 | 0.013214194 |
| GO:0030177 | positive regulation of Wnt signaling pathway | 20 | 0.014794079 |
| GO:0006984 | ER-nucleus signaling pathway | 9 | 0.014859166 |
| GO:0045637 | regulation of myeloid cell differentiation | 25 | 0.014859166 |
| GO:0008380 | RNA splicing | 39 | 0.014859166 |
| GO:0034968 | histone lysine methylation | 15 | 0.014859166 |
| GO:0001843 | neural tube closure | 13 | 0.014920111 |
| GO:0034333 | adherens junction assembly | 13 | 0.014920111 |
| GO:0051147 | regulation of muscle cell differentiation | 20 | 0.01537082 |
| GO:0060606 | tube closure | 13 | 0.016202371 |
| GO:0051348 | negative regulation of transferase activity | 27 | 0.01736378 |
| GO:0060765 | regulation of androgen receptor signaling pathway | 7 | 0.017685114 |
| GO:0001841 | neural tube formation | 14 | 0.018715149 |
| GO:0032204 | regulation of telomere maintenance | 12 | 0.018715149 |
| GO:0043901 | negative regulation of muxlti-organism process | 19 | 0.018715149 |
| GO:0051054 | positive regulation of DNA metabolic process | 23 | 0.018715149 |
| GO:0060271 | cilium assembly | 32 | 0.019274508 |
| GO:0060070 | canonical Wnt signaling pathway | 30 | 0.019418493 |
| GO:0021915 | neural tube development | 18 | 0.02189728 |
| GO:0010171 | body morphogenesis | 9 | 0.022689191 |
| GO:0032784 | regulation of DNA-templated transcription, elongation | 9 | 0.022689191 |
| GO:1903311 | regulation of mRNA metabolic process | 29 | 0.02307114 |
| GO:0044319 | wound healing, spreading of cells | 7 | 0.02307114 |
| GO:0090505 | epiboly involved in wound healing | 7 | 0.02307114 |
| GO:2000781 | positive regulation of double-strand break repair | 7 | 0.02307114 |
| GO:0060766 | negative regulation of androgen receptor signaling pathway | 5 | 0.02307114 |
| GO:0000723 | telomere maintenance | 18 | 0.02307114 |
| GO:0000209 | protein polyubiquitination | 28 | 0.023399292 |
| GO:1903900 | regulation of viral life cycle | 17 | 0.023399292 |
| GO:0007044 | cell-substrate junction assembly | 13 | 0.023399292 |
| GO:0014020 | primary neural tube formation | 13 | 0.023399292 |
| GO:0090504 | epiboly | 7 | 0.026209669 |
| GO:0001838 | embryonic epithelial tube formation | 15 | 0.026209669 |
| GO:0006479 | protein methylation | 19 | 0.026209669 |
| GO:0008213 | protein alkylation | 19 | 0.026209669 |
| GO:0036124 | histone H3-K9 trimethylation | 5 | 0.028504092 |
| GO:0016571 | histone methylation | 16 | 0.028504092 |
| GO:0034976 | response to endoplasmic reticulum stress | 26 | 0.028504092 |
| GO:0036498 | IRE1-mediated unfolded protein response | 10 | 0.028504092 |
| GO:0046782 | regulation of viral transcription | 10 | 0.028504092 |
| GO:0001837 | epithelial to mesenchymal transition | 16 | 0.02997652 |
| GO:0072665 | protein localization to vacuole | 10 | 0.031694802 |
| GO:0071824 | protein-DNA complex subunit organization | 26 | 0.031924183 |
| GO:2000779 | regulation of double-strand break repair | 11 | 0.032301863 |
| GO:0016049 | cell growth | 38 | 0.033335915 |
| GO:0018023 | peptidyl-lysine trimethylation | 8 | 0.033675333 |
| GO:0060330 | regulation of response to interferon-gamma | 6 | 0.033675333 |
| GO:0060334 | regulation of interferon-gamma-mediated signaling pathway | 6 | 0.033675333 |
| GO:0018022 | peptidyl-lysine methylation | 15 | 0.0339268 |
| GO:0002011 | morphogenesis of an epithelial sheet | 9 | 0.034329329 |
| GO:1903391 | regulation of adherens junction organization | 10 | 0.037116501 |
| GO:0051098 | regulation of binding | 31 | 0.037419782 |
| GO:0034504 | protein localization to nucleus | 24 | 0.037419782 |
| GO:0033144 | negative regulation of intracellular steroid hormone receptor signaling pathway | 7 | 0.037419782 |
| GO:0043543 | protein acylation | 23 | 0.039774544 |
| GO:0055007 | cardiac muscle cell differentiation | 15 | 0.040008254 |
| GO:1903706 | regulation of hemopoiesis | 37 | 0.040008254 |
| GO:0006913 | nucleocytoplasmic transport | 29 | 0.040008254 |
| GO:0006352 | DNA-templated transcription, initiation | 23 | 0.040379329 |
| GO:0002067 | glandular epithelial cell differentiation | 8 | 0.040379329 |
| GO:0007041 | lysosomal transport | 13 | 0.040379329 |
| GO:0032200 | telomere organization | 18 | 0.040379329 |
| GO:0051895 | negative regulation of focal adhesion assembly | 5 | 0.040379329 |
| GO:0097242 | amyloid-beta clearance | 7 | 0.040379329 |
| GO:0031503 | protein-containing complex localization | 25 | 0.040379329 |
| GO:0007045 | cell-substrate adherens junction assembly | 11 | 0.040379329 |
| GO:0048041 | focal adhesion assembly | 11 | 0.040379329 |
| GO:0060560 | developmental growth involved in morphogenesis | 22 | 0.040379329 |
| GO:0051169 | nuclear transport | 29 | 0.040822401 |
| GO:0010172 | embryonic body morphogenesis | 4 | 0.040822401 |
| GO:0048096 | chromatin-mediated maintenance of transcription | 4 | 0.040822401 |
| GO:0070933 | histone H4 deacetylation | 4 | 0.040822401 |
| GO:1900112 | regulation of histone H3-K9 trimethylation | 4 | 0.040822401 |
| GO:0043921 | modulation by host of viral transcription | 6 | 0.04145549 |
| GO:0052472 | modulation by host of symbiont transcription | 6 | 0.04145549 |
| GO:0001959 | regulation of cytokine-mediated signaling pathway | 18 | 0.041669901 |
| GO:0071156 | regulation of cell cycle arrest | 13 | 0.042842707 |
| GO:2000058 | regulation of ubiquitin-dependent protein catabolic process | 16 | 0.042842707 |
| GO:0042176 | regulation of protein catabolic process | 31 | 0.042914363 |
| GO:0006623 | protein targeting to vacuole | 7 | 0.042921458 |
| GO:0051261 | protein depolymerization 13 0.044702762 | ||
| GO:0051099 | positive regulation of binding | 18 | 0.044702762 |
| GO:0051972 | regulation of telomerase activity | 8 | 0.044702762 |
| GO:0072666 | establishment of protein localization to vacuole | 8 | 0.044702762 |
| GO:2000059 | negative regulation of ubiquitin-dependent protein catabolic process | 8 | 0.044702762 |
| GO:1902115 | regulation of organelle assembly | 19 | 0.044826787 |
| GO:0050684 | regulation of mRNA processing | 15 | 0.046220077 |
| GO:0052312 | modulation of transcription in other organism involved in symbiotic interaction | 6 | 0.046220077 |
| GO:0051893 | regulation of focal adhesion assembly | 9 | 0.047313553 |
| GO:0090109 | regulation of cell-substrate junction assembly | 9 | 0.047313553 |
| GO:0015931 | nucleobase-containing compound transport | 22 | 0.047313553 |
| GO:0051236 | establishment of RNA localization | 19 | 0.048534128 |
| GO:0008347 | glial cell migration | 8 | 0.048610574 |
| GO:0097193 | intrinsic apoptotic signaling pathway | 25 | 0.048695169 |
| GO:0022625 | cytosolic large ribosomal subunit | 22 | 7.58E–12 |
| GO:0005925 | focal adhesion | 54 | 1.22E–10 |
| GO:0005924 | cell-substrate adherens junction | 54 | 1.22E–10 |
| GO:0030055 | cell-substrate junction | 54 | 1.35E–10 |
| GO:0022626 | cytosolic ribosome | 26 | 2.99E–10 |
| GO:0015934 | large ribosomal subunit | 24 | 5.69E–08 |
| GO:0044445 | cytosolic part | 34 | 3.89E–07 |
| GO:0044391 | ribosomal subunit | 28 | 1.77E–06 |
| GO:0000123 | histone acetyltransferase complex | 17 | 9.25E–06 |
| GO:0031248 | protein acetyltransferase complex | 18 | 9.25E–06 |
| GO:1902493 | acetyltransferase complex | 18 | 9.25E–06 |
| GO:0035097 | histone methyltransferase complex | 16 | 5.31E–05 |
| GO:0016363 | nuclear matrix | 18 | 6.56E–05 |
| GO:0034399 | nuclear periphery | 19 | 0.0002262 |
| GO:0070603 | SWI/SNF superfamily-type complex | 14 | 0.0002262 |
| GO:0042788 | polysomal ribosome | 9 | 0.000278795 |
| GO:0098984 | neuron to neuron synapse | 34 | 0.000596952 |
| GO:0014069 | postsynaptic density | 32 | 0.000714655 |
| GO:0032279 | asymmetric synapse | 32 | 0.000864164 |
| GO:0030496 | midbody | 21 | 0.000875088 |
| GO:0005840 | ribosome | 28 | 0.000907132 |
| GO:0000790 | nuclear chromatin | 35 | 0.000907132 |
| GO:0099572 | postsynaptic specialization | 33 | 0.000926357 |
| GO:1904949 | ATPase complex | 15 | 0.000926357 |
| GO:0034708 | methyltransferase complex | 16 | 0.000926357 |
| GO:0005667 | transcription factor complex | 34 | 0.000926357 |
| GO:0016607 | nuclear speck | 36 | 0.000940948 |
| GO:0005938 | cell cortex | 30 | 0.001070189 |
| GO:0101002 | ficolin-1-rich granule | 21 | 0.001630215 |
| GO:0044798 | nuclear transcription factor complex | 22 | 0.001853344 |
| GO:0000812 | Swr1 complex | 5 | 0.002106877 |
| GO:0000118 | histone deacetylase complex | 10 | 0.004130179 |
| GO:0042470 | melanosome | 14 | 0.004493787 |
| GO:0048770 | pigment granule | 14 | 0.004493787 |
| GO:0005844 | polysome | 11 | 0.005579034 |
| GO:0090575 | RNA polymerase II transcription factor complex | 18 | 0.005891446 |
| GO:1904813 | ficolin-1-rich granule lumen | 15 | 0.006649382 |
| GO:1902562 | H4 histone acetyltransferase complex | 8 | 0.00862081 |
| GO:0031252 | cell leading edge | 33 | 0.00862081 |
| GO:0005643 | nuclear pore | 12 | 0.00862081 |
| GO:0005635 | nuclear envelope | 36 | 0.012865041 |
| GO:0099092 | postsynaptic density, intracellular component | 5 | 0.013474404 |
| GO:0030027 | lamellipodium | 19 | 0.014296793 |
| GO:0070461 | SAGA-type complex | 6 | 0.017456175 |
| GO:0044455 | mitochondrial membrane part | 21 | 0.018871465 |
| GO:0099091 | postsynaptic specialization, intracellular component | 5 | 0.026165033 |
| GO:0044666 | MLL3/4 complex | 4 | 0.026793714 |
| GO:0005913 | cell-cell adherens junction | 13 | 0.026869727 |
| GO:0000792 | heterochromatin | 10 | 0.028802567 |
| GO:0099738 | cell cortex region | 7 | 0.028802567 |
| GO:0031965 | nuclear membrane | 24 | 0.041189729 |
| GO:0000124 | SAGA complex | 4 | 0.042262875 |
| GO:0071565 | nBAF complex | 4 | 0.042262875 |
| GO:0044309 | neuron spine | 16 | 0.045301703 |
| GO:0017053 | transcriptional repressor complex | 10 | 0.045301703 |
| GO:0097346 | INO80-type complex | 5 | 0.04846594 |
| GO:0016605 | PML body | 11 | 0.048596868 |
| GO:0003713 | transcription coactivator activity | 44 | 1.54E–07 |
| GO:0035257 | nuclear hormone receptor binding | 26 | 5.03E–06 |
| GO:0045296 | cadherin binding | 41 | 5.22E–06 |
| GO:0051427 | hormone receptor binding | 27 | 4.05E–05 |
| GO:0003735 | structural constituent of ribosome | 28 | 5.75E–05 |
| GO:0050839 | cell adhesion molecule binding | 49 | 0.000164258 |
| GO:0061659 | ubiquitin-like protein ligase activity | 28 | 0.000564585 |
| GO:0061630 | ubiquitin protein ligase activity | 27 | 0.000675924 |
| GO:0042393 | histone binding | 25 | 0.000675924 |
| GO:0047485 | protein N-terminus binding | 17 | 0.001209051 |
| GO:0019787 | ubiquitin-like protein transferase activity | 39 | 0.001859565 |
| GO:0035258 | steroid hormone receptor binding | 15 | 0.001859565 |
| GO:0004842 | ubiquitin-protein transferase activity | 36 | 0.004671669 |
| GO:0003730 | mRNA 3’-UTR binding | 14 | 0.005656635 |
| GO:0030374 | nuclear receptor transcription coactivator activity | 11 | 0.016358235 |
| GO:0031267 | small GTPase binding | 38 | 0.016779445 |
| GO:0017016 | Ras GTPase binding | 37 | 0.016779445 |
| GO:0044389 | ubiquitin-like protein ligase binding | 29 | 0.016779445 |
| GO:0001085 | RNA polymerase II transcription factor binding | 18 | 0.017774698 |
| GO:0003714 | transcription corepressor activity | 24 | 0.017774698 |
| GO:0033613 | activating transcription factor binding | 12 | 0.024777396 |
| GO:0031625 | ubiquitin protein ligase binding | 27 | 0.024777396 |
| GO:0042800 | histone methyltransferase activity (H3-K4 specific) | 5 | 0.024777396 |
| GO:0003779 | actin binding | 36 | 0.026046781 |
| GO:0005088 | Ras guanyl-nucleotide exchange factor activity | 16 | 0.026427777 |
| GO:0004402 | histone acetyltransferase activity | 10 | 0.026427777 |
| GO:0046965 | retinoid X receptor binding | 5 | 0.027715133 |
| GO:0055106 | ubiquitin-protein transferase regulator activity | 5 | 0.027715133 |
| GO:0050681 | androgen receptor binding | 8 | 0.028197009 |
| GO:0061733 | peptide-lysine-N-acetyltransferase activity | 10 | 0.029296991 |
| GO:0042974 | retinoic acid receptor binding | 6 | 0.031275892 |
| GO:0005089 | Rho guanyl-nucleotide exchange factor activity | 11 | 0.032203632 |
| GO:0016887 | ATPase activity | 32 | 0.037839109 |
| GO:0070577 | lysine-acetylated histone binding | 5 | 0.038501268 |
| GO:0140033 | acetylation-dependent protein binding | 5 | 0.038501268 |
| GO:0070491 | repressing transcription factor binding | 10 | 0.043198409 |
| GO:0016922 | nuclear receptor binding | 5 | 0.044382275 |
| GO:0001098 | basal transcription machinery binding | 10 | 0.044382275 |
| GO:0001099 | basal RNA polymerase II transcription machinery binding | 10 | 0.044382275 |
| GO:0016407 | acetyltransferase activity | 13 | 0.04501654 |
GO term enrichment analysis of DEG
Using the R package with data package, visualization, and integrated discovery, GO enrichment analysis was performed on 1062 DEG with different meanings. Our results revealed that 151 DEG participated in BP, 56 in CC, and 40 in MF. With respect to BP, the DEG were significantly enriched in the mRNA catabolic process, covalent chromatin modification, and histone modification. With respect to CC, they were mainly enriched in focal adhesion, cell-substrate adherens junction, and cell-substrate junction. With respect to MF, they were mainly enriched in cadherin binding, cell adhesion molecule binding, and ubiquitin-protein transferase activity (Fig. 3, Table 2).
KEGG pathway analysis of DEG
Using the R package with data package, visualization, and integrated discovery, KEGG enrichment analysis was performed on 1062 DEG with different meanings. Our results revealed that a total of 21 pathways were enriched, mainly ribosome, ubiquitin-mediated proteolysis, and cancer pathways (Fig. 4, Table 3).
Construction of PPI network and identification of key genes
STRING and Cytoscape analyses identified a total of 845 DEG participating in the PPI network, with 5,571 edges (Fig. 5A), 471 upregulation, and 374 downregulation. Through the MCODE plug-in, the first three densely interconnected clusters of the PPI network were analyzed. Cluster 1 consisted of 67 nodes and 1,098 edges. The enrichment results indicated that the genes included in Cluster 1 of the PPI were mainly enriched in the terms extracellular exosome” and “poly(A) RNA binding”. Cluster 2 was composed of 20 nodes and 13 edges. The enrichment results indicated that the genes included in Cluster 2 were mainly enriched in the terms “nuclear-transcribed mRNA catabolic process” and “acetylation”. Cluster 3 was composed of 15 nodes and 92 edges. The enrichment results indicated that the genes included in Cluster 3 were mainly enriched in the terms “transcription and chromatin regulator”, and one node was a DEG (Figs. 5B–5D; Tables 4–6). The first 30 genes in the connectivity evaluation in the PPI network were Hub genes (degree ≥53) (Table 7).
Key gene expression analysis in Hp infection status
The DEG identified in the PPI network (≥53) was analyzed in the TCGA database to assess the correlation with Helicobacter pylori infection. A total of 14 DEGs were highly expressed in positive Helicobacter pylori infection (P < 0.05) and were up-regulated by CagA, namely ATM, BPTF, CDH1, CTNNB1, HSPA8, HDAC1, POLR2A, ISG15, RPL8, RNP1, RPL30, RPS27, RUVBL1 and CASP3. RT-qPCR verification results showed that Helicobacter pylori CagA caused up-regulation of BPTF, CASP3, CDH1, CTNNB1 and POLR2A expression (P < 0.05) (Figs. 6A–6S).
Survival analysis of key genes
The Kaplan–Meier plotter bioinformatics analysis platform was used to investigate the prognostic value of genes in 14 potential centers, including data from 875 gastric cancer patients for overall survival analysis. Our results show that under high expression (P < 0.05), a total of 7 genes are associated with poor prognosis of gastric cancer (P < 0.05), namely ATM, BPTF, CDH1, POLR2A, RNP1, BPL30 and RPS27 (Figs. 7A–7G).
Discussion
The development of gastric cancer is an extremely complicated biological process, involving the abnormal expression of various tumor-related genes, activation of various tumor-related pathways, and inactivation of tumor suppressor genes. The causative gene is silent and inactive. In fact, evidence prove that the tumor is induced by genetic and epigenetic changes (Belinsky, 2004; Herman & Baylin, 2003; Jones & Baylin, 2002). Helicobacter pylori is closely related to gastric cancer, and Helicobacter pylori CagA is involved in multiple cellular processes related to carcinogenesis (Hatakeyama, 2017). In combination with public biological databases (such as GO and KEGG), the development of a high-throughput detection technology would facilitate systematic exploration of a list of DEG throughout the genome (Ma, Zhou & Zheng, 2020) and comb through the related BP. The application of informatics provides a good means to comprehend the mechanisms of occurrence and development of gastric cancer at the molecular level.
| Pathway | P-value | Genes |
|---|---|---|
| Ribosome | 2.39E−10 | RPL18, RPL36A, RPL13, RPL15, RPL35, RPL36, RPL37, RPL38, RPS2, RPL30, RPS27, MRPL13, RPL31, RPL34, RPL8, RPL5, RPL11, MRPL33, RPS23, RPL35A, RPL27, RPL28, RPS7, RPL23, RPL13A, RPL21, RPL37A, UBA52 |
| Adherens junction | 1.39E−04 | PARD3, PTPRF, CREBBP, CSNK2B, CTNND1, ACTN1, CDH1, CTNNA1, CTNNB1, CDC42, IGF1R, CSNK2A1, AFDN |
| Ubiquitin mediated proteolysis | 9.53E−04 | SYVN1, XIAP, UBE4A, PML, SKP1, BIRC2, STUB1, FANCL, TRIM37, FBXW7, UBE2D2, HUWE1, UBE2K, UBA3, TRIM32, NEDD4L, FBXW11 |
| Bacterial invasion of epithelial cells | 0.001284745 | CDC42, PTK2, SEPT2, PIK3CB, ARPC5L, CDH1, CLTC, CTNNA1, ITGB1, CTNNB1, DNM2, SEPT9 |
| Viral carcinogenesis | 0.002245962 | HIST1H4L, YWHAZ, HIST1H2BC, PIK3CB, CREBBP, UBR4, ACTN1, CDK4, PKM, CCNE2, CDC42, HDAC4, CASP3, HDAC1, GSN, GTF2A2, CREB3L2, RBPJ, HDAC8, CHD4, SYK |
| Pathways in cancer | 0.005009934 | ADCY3, FGFR2, WNT5B, XIAP, PPARG, PML, CDH1, ITGB1, TGFB1, CTNNB1, CCNE2, IGF1R, CDC42, PTK2, CASP3, RALB, FAS, RUNX1, PLCB1, CTBP2, RALBP1, PIK3CB, CREBBP, CDK4, CTNNA1, STAT1, BIRC2, ARHGEF11, HDAC1, LAMA5, PTCH1, GSTP1 |
| Huntington’s disease | 0.005587064 | DNAH11, UQCRC2, COX7A2, CREBBP, PPARG, CLTC, NDUFA1, NDUFB1, NDUFB2, POLR2A, SOD2, NDUFS6, NDUFS5, NRF1, CASP3, HDAC1, CREB3L2, PLCB1, UQCRB |
| Non-alcoholic fatty liver disease | 0.006537343 | UQCRC2, COX7A2, PIK3CB, LEPR, NDUFA1, NDUFB1, TGFB1, NDUFB2, CDC42, NDUFS6, CASP3, NDUFS5, XBP1, MLXIP, FAS, UQCRB |
| Herpes simplex infection | 0.007640717 | MAVS, CREBBP, PML, CSNK2B, HCFC1, SKP1, ARNTL, STAT1, TAB2, POLR2A, TYK2, CASP3, TAF5L, CSNK2A1, TAP2, FAS, IFNGR2, IFNGR1 |
| Fatty acid metabolism | 0.008015791 | CPT2, ACADM, HACD3, HACD4, FASN, HADH, HADHA, ACSBG1 |
| Hepatitis B | 0.010764364 | MAVS, YWHAZ, PIK3CB, CREBBP, MAP2K4, HSPG2, CDK4, STAT1, TGFB1, STAT6, CCNE2, CASP3, CREB3L2, FAS, NFATC3 |
| Measles | 0.012473037 | MAVS, PIK3CB, CSNK2B, CDK4, STAT1, TAB2, TYK2, CCNE2, CSNK2A1, FAS, IFNGR2, IFNGR1, HSPA8, ADAR |
| Transcriptional misregulation in cancer | 0.015781479 | ASPSCR1, FUS, HIST1H3J, KDM6A, KMT2A, PPARG, PML, AFF1, DDX5, HMGA2, ATM, MEN1, IGF1R, PTK2, HDAC1, RUNX1 |
| Toxoplasmosis | 0.017710762 | TYK2, CASP3, XIAP, LAMA5, STAT1, BIRC2, TAB2, IFNGR2, ITGB1, TGFB1, HSPA8, IFNGR1 |
| Salmonella infection | 0.018985119 | CDC42, PFN1, RILP, RAB7B, ARPC5L, DYNC2H1, KLC4, IFNGR2, DYNC1I2, IFNGR1 |
| Notch signaling pathway | 0.027873731 | CTBP2, HDAC1, MAML1, DTX2, CREBBP, RBPJ, NCOR2 |
| Fatty acid elongation | 0.031084 | ACOT7, HACD3, HACD4, HADH, HADHA |
| Amoebiasis | 0.03307295 | PTK2, CASP3, RAB7B, SERPINB6, LAMA5, PIK3CB, COL27A1, ACTN1, COL1A1, PLCB1, TGFB1 |
| Wnt signaling pathway | 0.036142405 | NKD1, WNT5B, CTBP2, CSNK2A1, CREBBP, LRP6, CSNK2B, RUVBL1, SKP1, PLCB1, NFATC3, FBXW11, CTNNB1 |
| Pathogenic Escherichia coli infection | 0.036263427 | CDC42, ARPC5L, TUBB6, CDH1, TUBB1, ITGB1, CTNNB1 |
| Lysine degradation | 0.039383478 | KMT2D, KMT2A, KMT2C, SETD1A, KMT2B, HADH, HADHA |
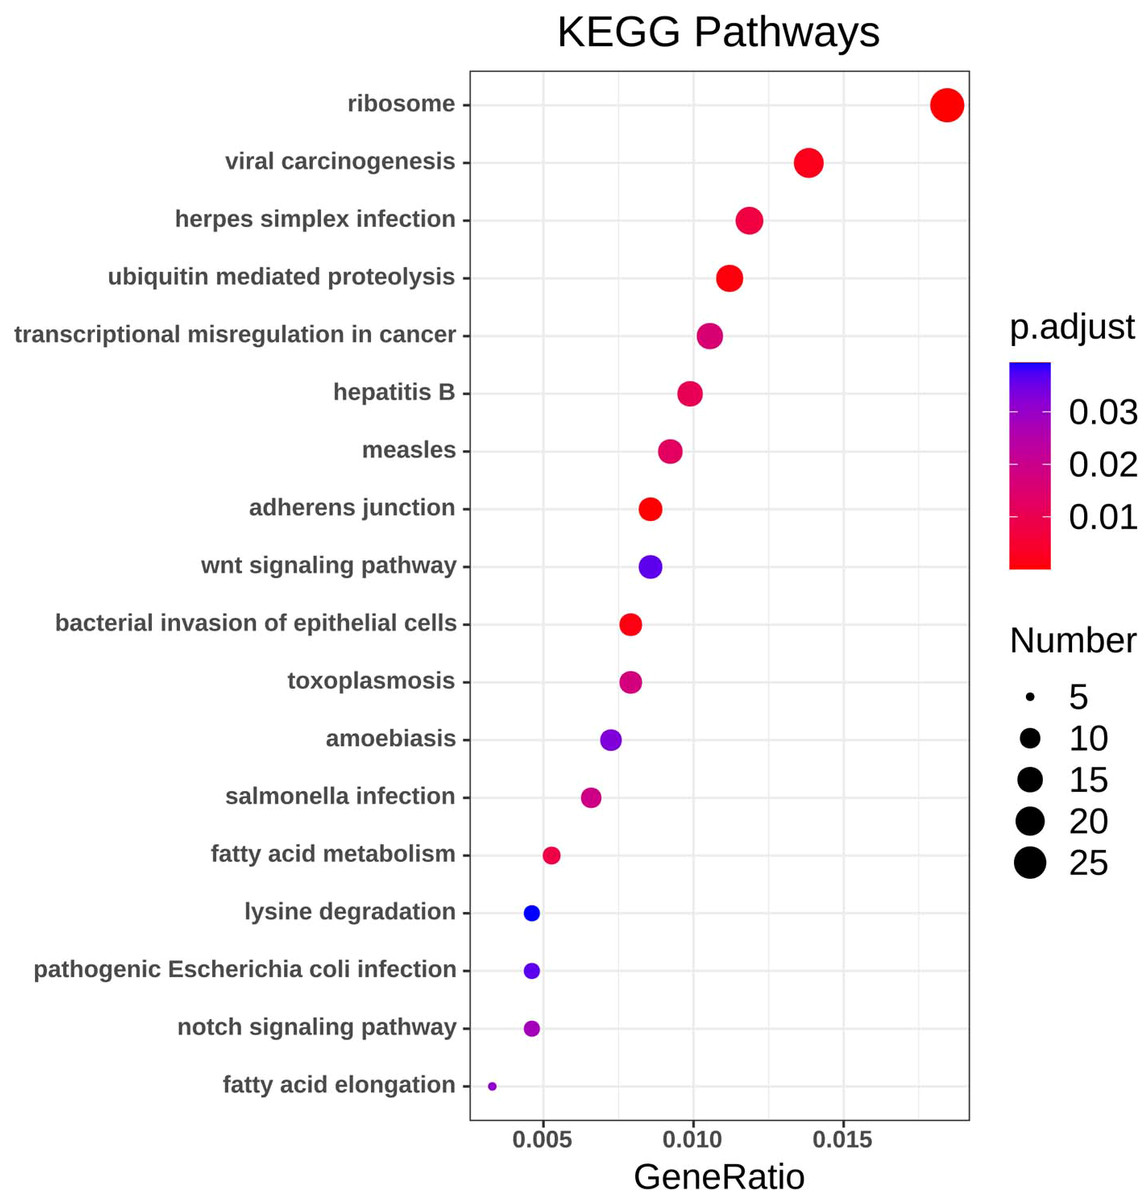
Figure 4: KEGG pathway analysis of DEGs.
Color indicates P value, numbers indicate the size.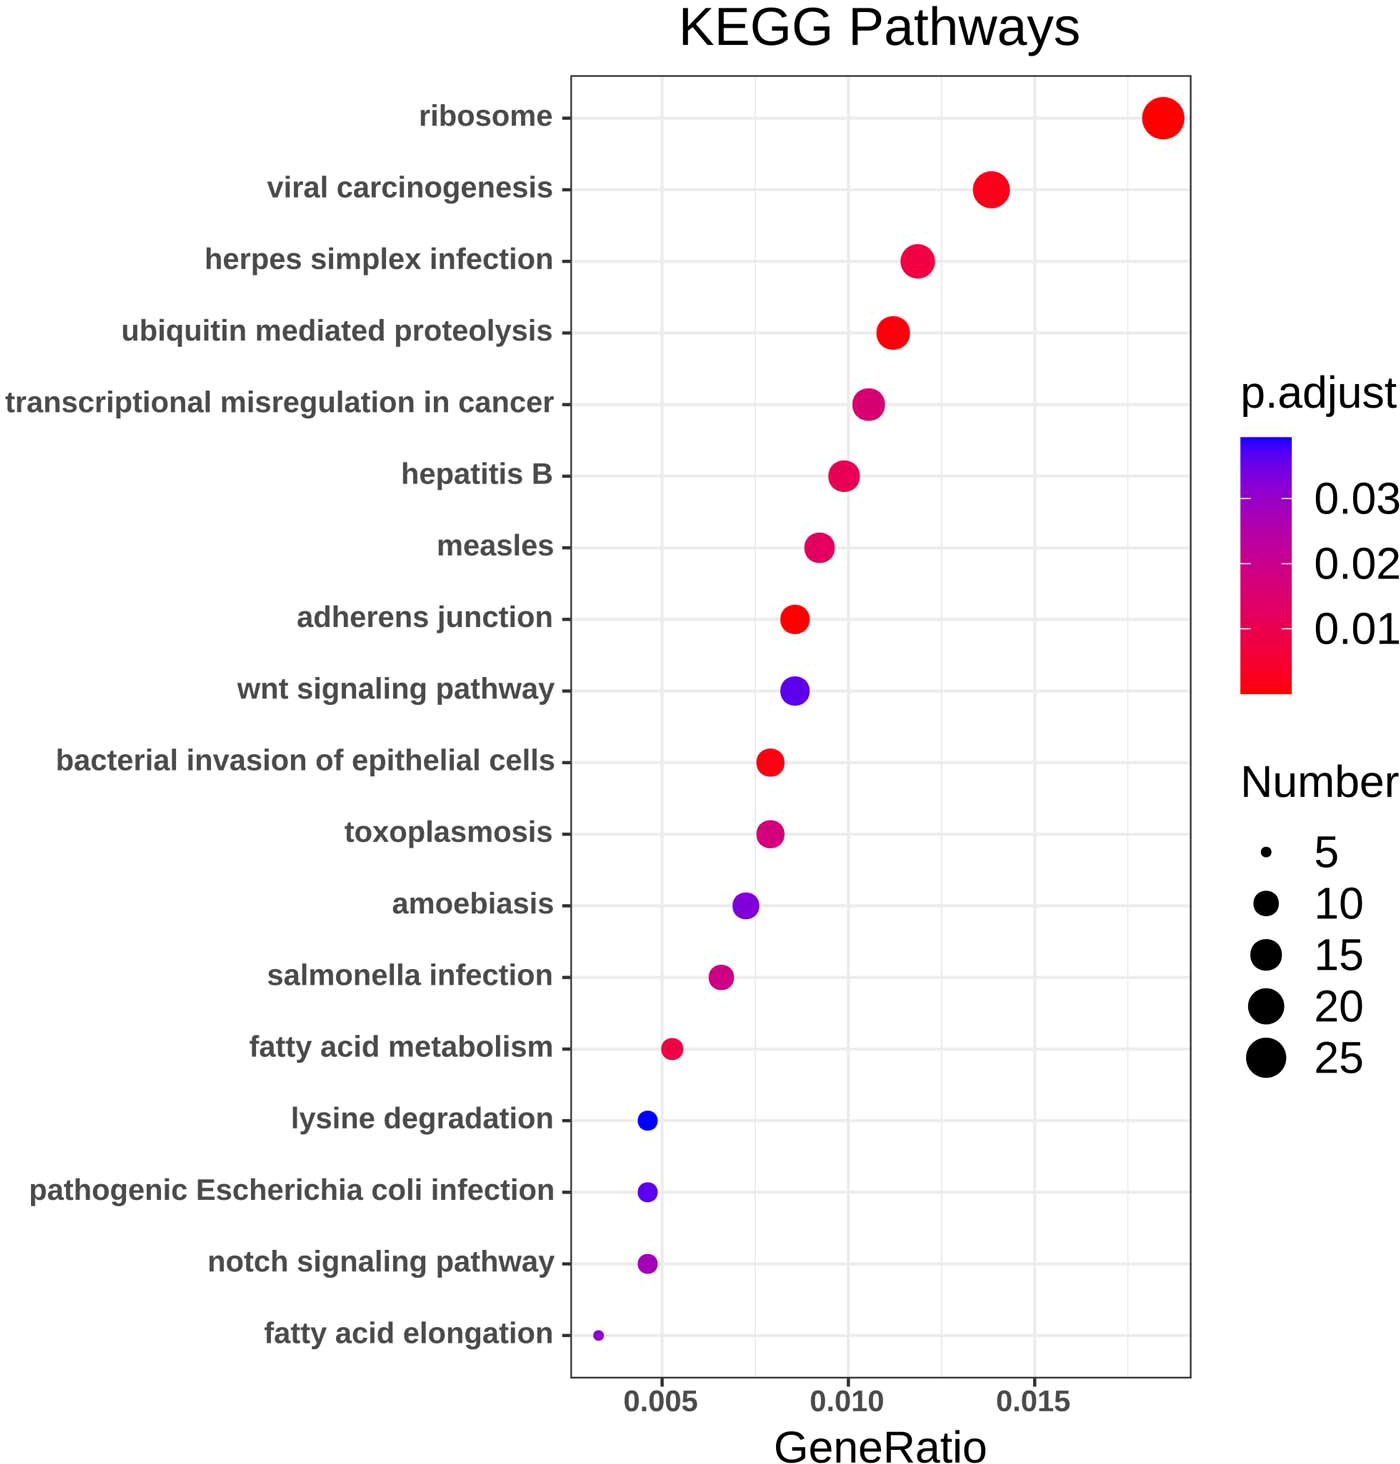
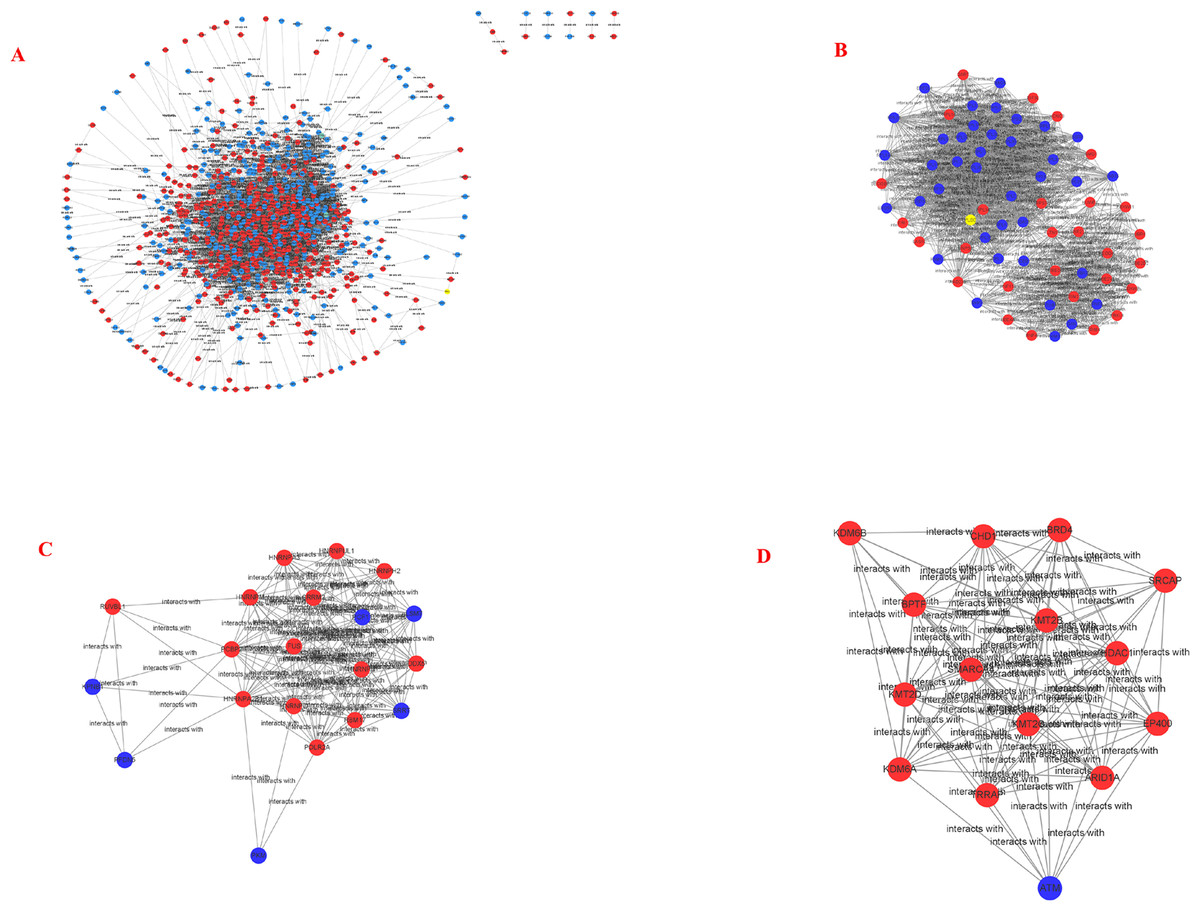
Figure 5: PPI network and cluster identification.
(A) The interaction among 845 DEG was detected through STRING with high confidence. (B) Cluster 1 included 67 nodes and 1098 edges. (C) Cluster 2 included 20 nodes and 13 edges. (D) Cluster 3 included 15 nodes and 92 edges. The red nodes represent significantly upregulated genes, while blue nodes represent significantly downregulated genes.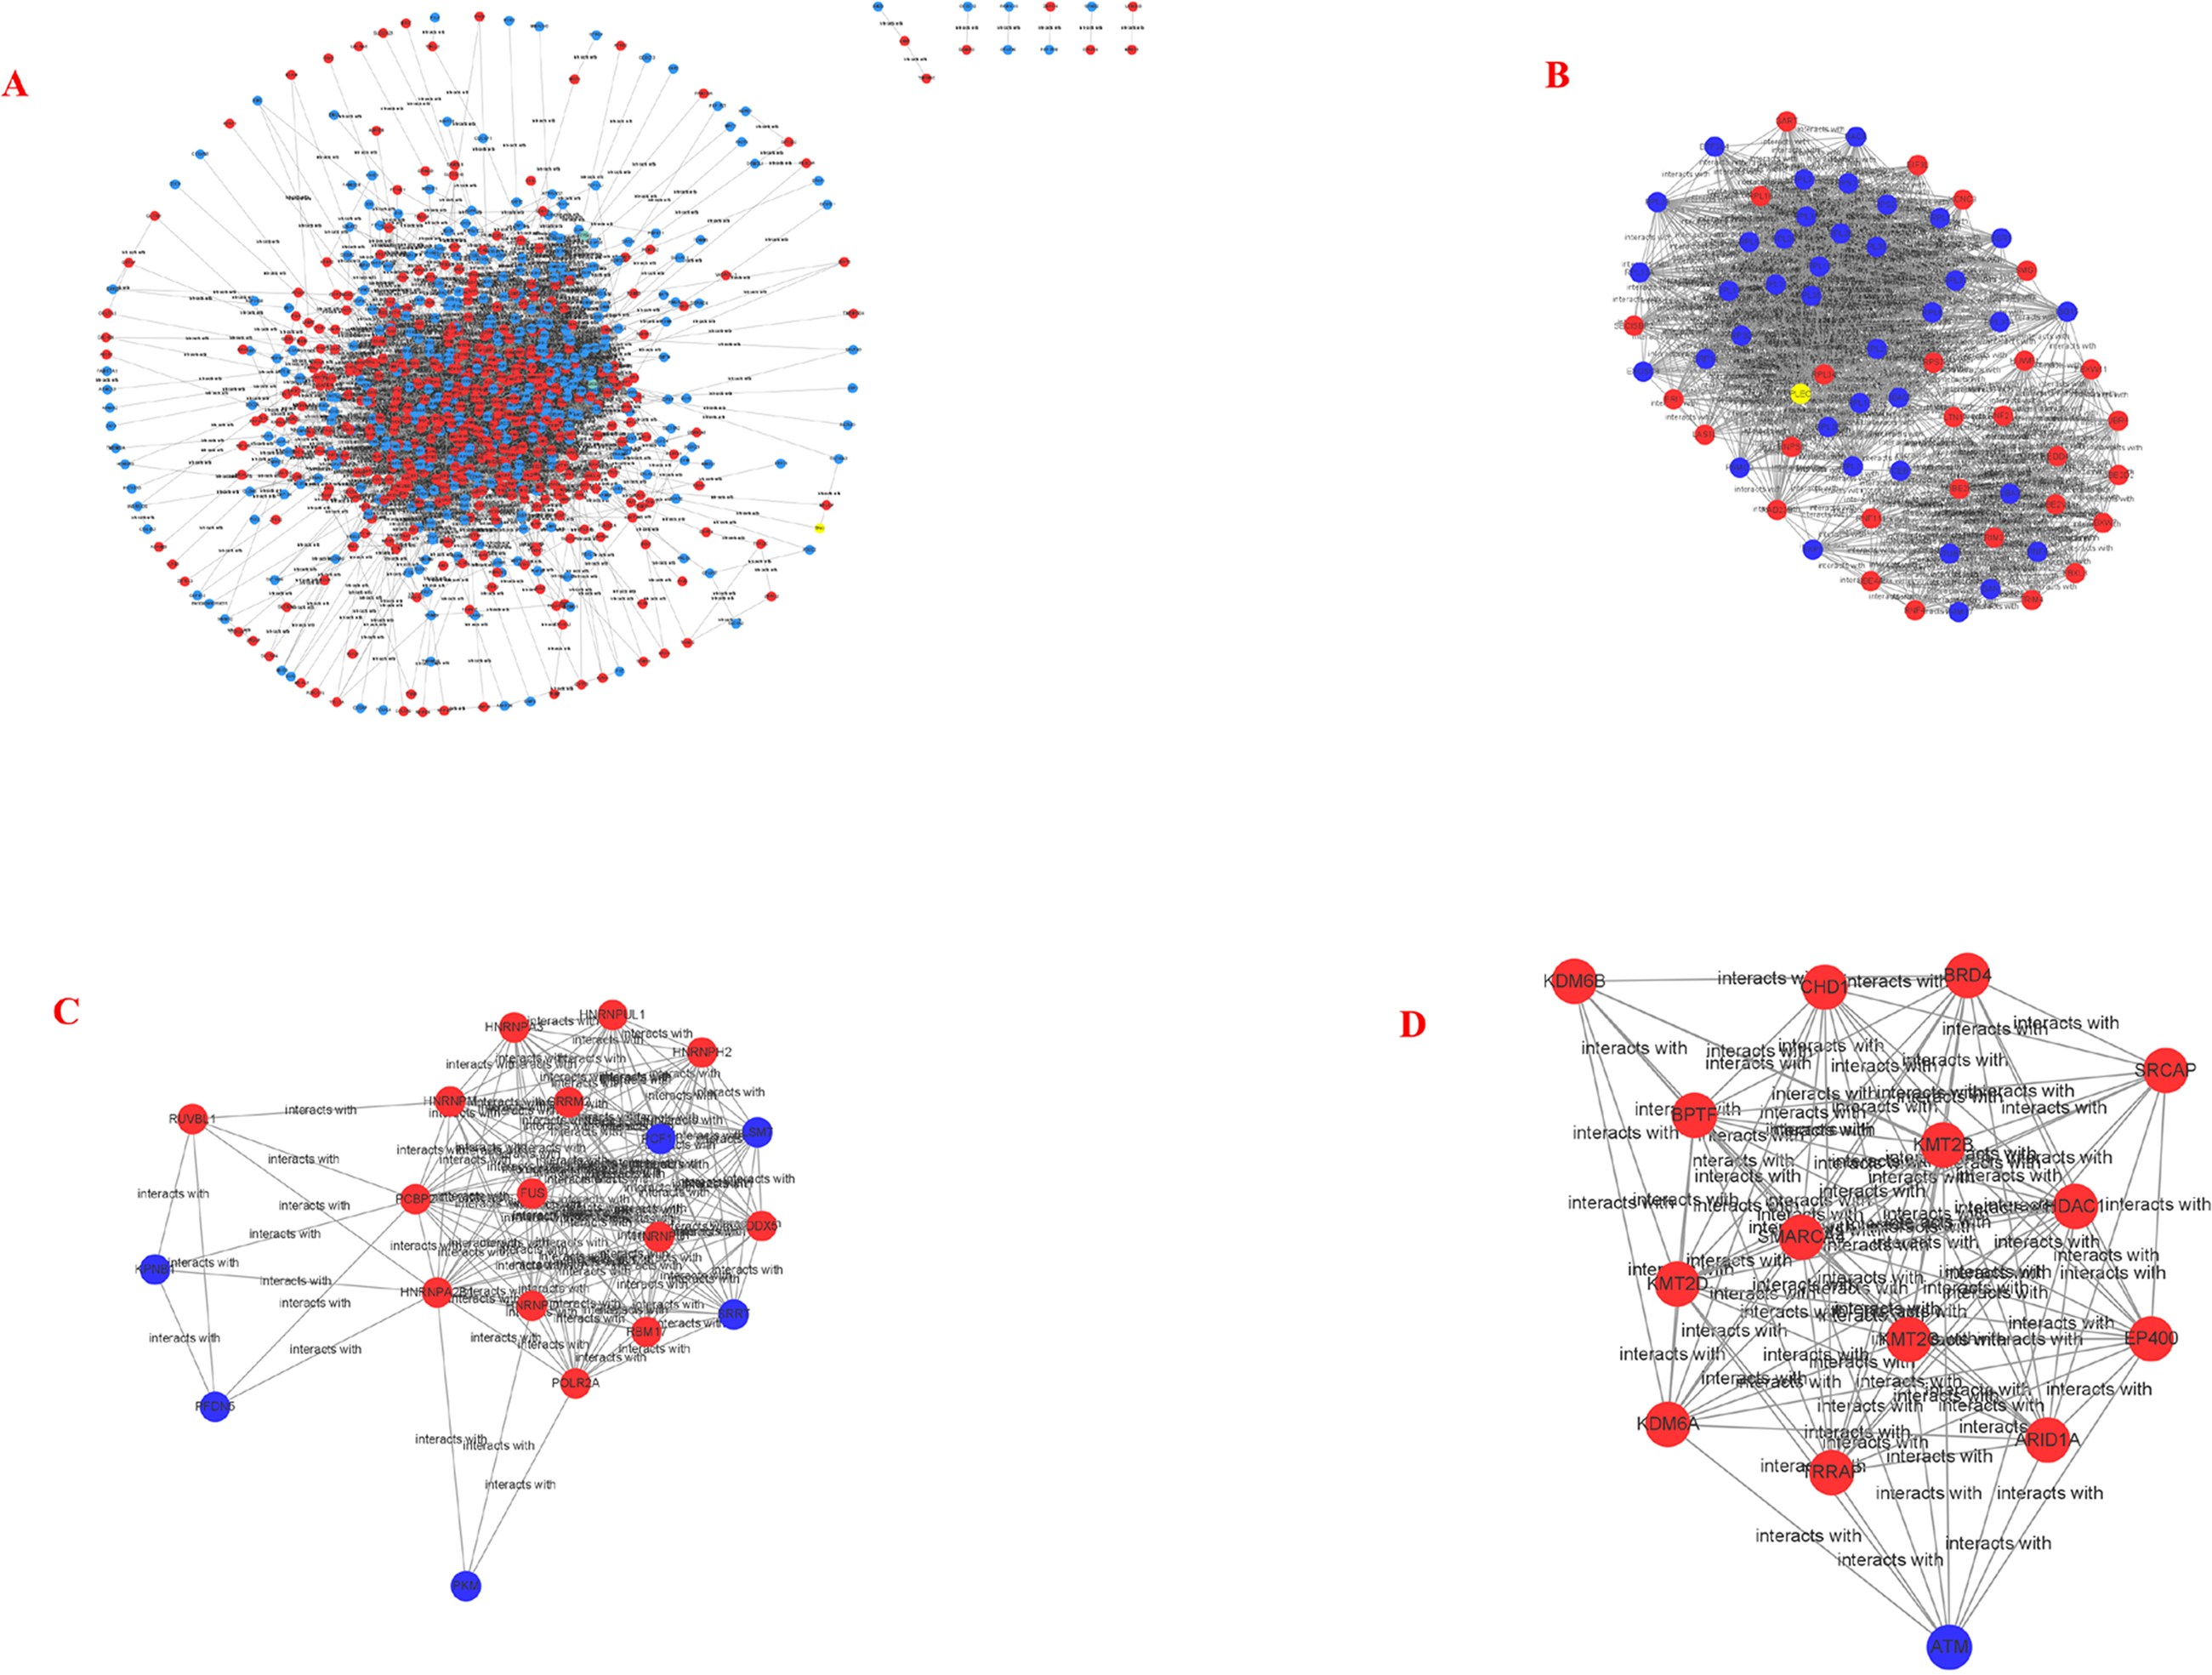
In this study, we compared 1062 genes with significant differences between the pcDNA3.1::CagA and pcDNA3.1 group via bioinformatics. Of these genes, 594 were upregulated and 468 were downregulated. Functional enrichment revealed that these genes participated in multiple signaling pathways, including the Notch signaling pathway and Wnt signaling pathway. The notch signaling pathway is a signal transduction system that repeatedly regulates cell proliferation and apoptosis. We found that the Notch signaling pathway was closely related to cell differentiation, proliferation, apoptosis, adhesion, and the transformation of epidermal cells into the mesenchyme; this pathway is essential for the normal development of most tissues (Leong & Karsan, 2006; Luo, Renault & Rando, 2005; Maillard, Fang & Pear, 2005; Zanotti & Canalis, 2016). Past studies have demonstrated that this pathway plays an important role in regulating the cell cycle as well (Bhattacharya et al., 2017; Herranz & Milán, 2008; Seidel & Kimble, 2015). In a large number of hematopoietic and solid tumors, the Notch pathway undergoes genetically alteration. The activation or inhibition of the pathway depends on the background and the activation status of other potential oncogenic pathways. There are several different patterns of abnormal regulatory pathways and their targets in cancer (Ranganathan, Weaver & Capobianco, 2011; Vasquez-Del Carpio et al., 2011; Weaver et al., 2014). These pattern include the activation and inactivation mutations, receptor/ligand overexpression, epigenetic regulation, and the effects of post-translational modifications (Wang et al., 2007). Wnt is a secreted glycoprotein that can regulate diverse biological functions (MacDonald, Tamai & He, 2009). Wnt signaling is one of the main regulators of embryonic development, tissue renewal, and regeneration in multicellular organisms (Sidrat et al., 2020; Tepekoy, Akkoyunlu & Demir, 2015). This signaling pathway controls several aspects of the development process, including cell proliferation, apoptosis, cell migration, and cell polarity during the development and maintenance of adult stem cells. Cell proliferation and apoptosis are often associated with tumor formation and development (Bordonaro, 2020; Foulquier et al., 2018; Yang et al., 2016). Inappropriate activation of the Wnt pathway is also a major factor influencing the human carcinogenesis (Martin-Orozco et al., 2019) involving 13 enriched genes.
| Gene name | MCODE_Score | Expression |
|---|---|---|
| PSMC2 | 22 | down |
| RPL13 | 25.68403361 | down |
| KCNC3 | 23 | up |
| RPL21 | 25.68403361 | down |
| RAD23B | 27 | up |
| RPL35 | 25.68403361 | down |
| SRP14 | 26.93349754 | down |
| RPS23 | 25.68403361 | down |
| PLEC | 26.45564516 | up |
| RPL37A | 25.68403361 | down |
| RPL38 | 25.68403361 | down |
| ISG15 | 26.93349754 | down |
| RPL15 | 25.68403361 | down |
| ERI1 | 23 | up |
| UBA52 | 25.68403361 | down |
| RPL11 | 25.68403361 | down |
| RPL28 | 25.68403361 | down |
| UBE2D2 | 23 | up |
| RPL34 | 25.68403361 | up |
| NEDD4L | 23 | up |
| RPL36 | 25.68403361 | down |
| RNF213 | 23 | up |
| RNF111 | 23 | up |
| RPS2 | 25.68403361 | down |
| RPL36A | 25.68403361 | down |
| SMG1 | 27 | up |
| TRIM37 | 23 | down |
| RPL35A | 25.68403361 | down |
| RPS27 | 25.68403361 | down |
| RPL27 | 25.68403361 | down |
| LAS1L | 25 | up |
| RNPS1 | 27 | up |
| RPL8 | 25.68403361 | down |
| RPL23 | 25.68403361 | down |
| RPS7 | 25.68403361 | up |
| UBA3 | 23 | down |
| RPL30 | 25.68403361 | down |
| RPL13A | 25.68403361 | down |
| RPL18 | 25.68403361 | up |
| RPL5 | 25.68403361 | down |
| RPL31 | 25.68403361 | down |
| RNF6 | 23 | down |
| HUWE1 | 23 | up |
| GART | 21.92028986 | up |
| EIF3L | 27 | up |
| UBE2K | 23 | up |
| EXOSC8 | 25 | down |
| BTF3L4 | 25 | down |
| SECISBP2 | 26 | up |
| TRIM32 | 23 | up |
| NACA | 27 | down |
| RNF4 | 23 | up |
| UBE2V1 | 23 | up |
| TCEB1 | 23 | down |
| TRIM4 | 23 | up |
| LTN1 | 23 | up |
| GAN | 23 | down |
| UBR4 | 23 | up |
| UBE4A | 23 | up |
| STUB1 | 23 | down |
| FBXL8 | 23 | up |
| RPL37 | 25.94117647 | down |
| FBXW11 | 23 | up |
| MRPL13 | 26 | down |
| SSR1 | 27 | down |
| SKP1 | 23 | down |
| FBXW7 | 23 | up |
| Gene name | MCODE_Score | Expression |
|---|---|---|
| SRCAP ARID1A ATM TRRAP KMT2B EP400 SMARCA4 HDAC1 KMT2D BPTF KDM6A CHD1 KDM6B BRD4 KMT2C |
11.1 11.1 10.3956044 11.25146199 12.35 11.28947368 10.11111111 10.46769231 11.28947368 10.12681159 11.01578947 10.31578947 9.991666667 10.69264069 10.69264069 |
up up down up up up up up up up up up up up up |
| Gene name | MCODE_Score | Expression |
|---|---|---|
| KPNB1 HNRNPUL1 DDX5 SRRT RBM17 PFDN5 RUVBL1 HNRNPA3 PCBP2 FUS HNRNPD HNRNPM HNRNPH2 HNRNPA2B1 PCF11 HNRNPU POLR2A PKM LSM7 SRRM2 |
18.90952381 17 17 17 17 16.9005848 15.89542484 17 17 17 17 17 17 17 17 17 17 17 17 17 |
down up up down up down up up up up up up up up down up up down down up |
| Gene symbol | Gene description | Degree | Express |
|---|---|---|---|
| UBA52 | ubiquitin A-52 residue | 131 | down |
| HDAC1 | histone deacetylase 1 | 94 | up |
| CTNNB1 | catenin beta 1 | 89 | up |
| POLR2A | RNA polymerase II subunit A | 85 | up |
| HSPA8 | heat shock protein family A (Hsp70) member 8 | 79 | up |
| CREBBP | CREB binding protein | 71 | up |
| CDH1 | cadherin 1 | 69 | up |
| CDC42 | cell division cycle 42 | 69 | down |
| SMARCA4 | SWI/SNF related, matrix associated, actin dependent regulator of chromatin, subfamily a, member 4 | 67 | up |
| ATM | ATM serine/threonine kinase | 67 | down |
| RPS2 | ribosomal protein S2 [Homo sapiens | 66 | down |
| RUVBL1 | RuvB like AAA ATPase 1 | 66 | up |
| RPL11 | ribosomal protein L11 | 63 | down |
| RPL5 | ribosomal protein L5 | 62 | down |
| RPL8 | ribosomal protein L8 | 62 | down |
| RPL27 | ribosomal protein L27 | 62 | down |
| ISG15 | ISG15 ubiquitin like modifier | 61 | down |
| RPL31 | ribosomal protein L31 | 59 | down |
| RPL15 | ribosomal protein L15 | 59 | down |
| RPL23 | ribosomal protein L23 | 58 | down |
| RPS27 | ribosomal protein S27 | 58 | down |
| RNPS1 | RNA binding protein with serine rich doma in 1 | 58 | up |
| RPL13A | ribosomal protein L13a | 56 | down |
| RPL30 | ribosomal protein L30 | 55 | down |
| RPL35A | ribosomal protein L30 | 55 | down |
| BPTF | bromodomain PHD finger transcription | 55 | up |
| RPS7 | ribosomal protein S7 | 54 | up |
| RPL34 | ribosomal protein L34 | 54 | up |
| RPL13 | ribosomal protein L13 | 54 | down |
| CASP3 | caspase 3 | 53 | up |
The PPI network analysis provided the interaction network with 845 genes, and the first 3 clusters with a high correlation were analyzed through the MCODE plug-in. Cluster 1 genes mainly participated in the extracellular exosome pathway, cluster 2 genes mainly participated in nuclear-transcribed mRNA catabolic processes, and cluster 3 genes were mainly involved in transcription. Some of the past studies have demonstrated that extracellular exosomes are involved in the development of tumors. The results of GO enrichment in these clusters indicate their partial relationship to tumors, suggesting that the signal molecules regulated by the Oriental strain CagA may participate in the possible molecular mechanism of tumor development.
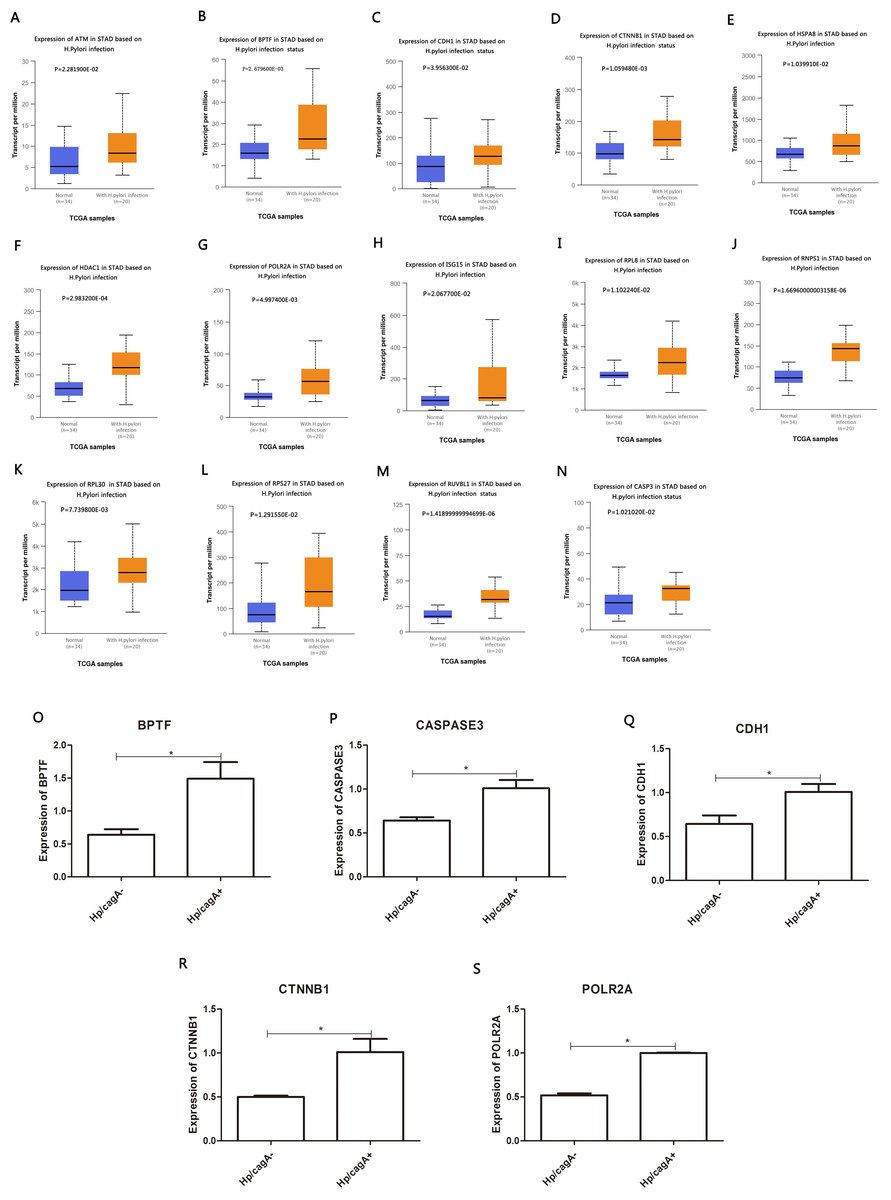
Figure 6: Analyze the expression and expression verification of key genes in Hp infection status according to the TCGA database.
(A–N) Red color indicate expression in Hp infection status, blue color indicate expression in uninfected status. (O–S) The mRNA levels of BPTF, CASPASE3, CDH1, CTNNB1 and POLR2A by RT-qPCR. ∗P < 0.05. The Hp/cagA+ infected group compared with the Hp/ cagA−::Cm infected group*Compared between Hp/cagA+ and Hp △cagA group, P < 0.05.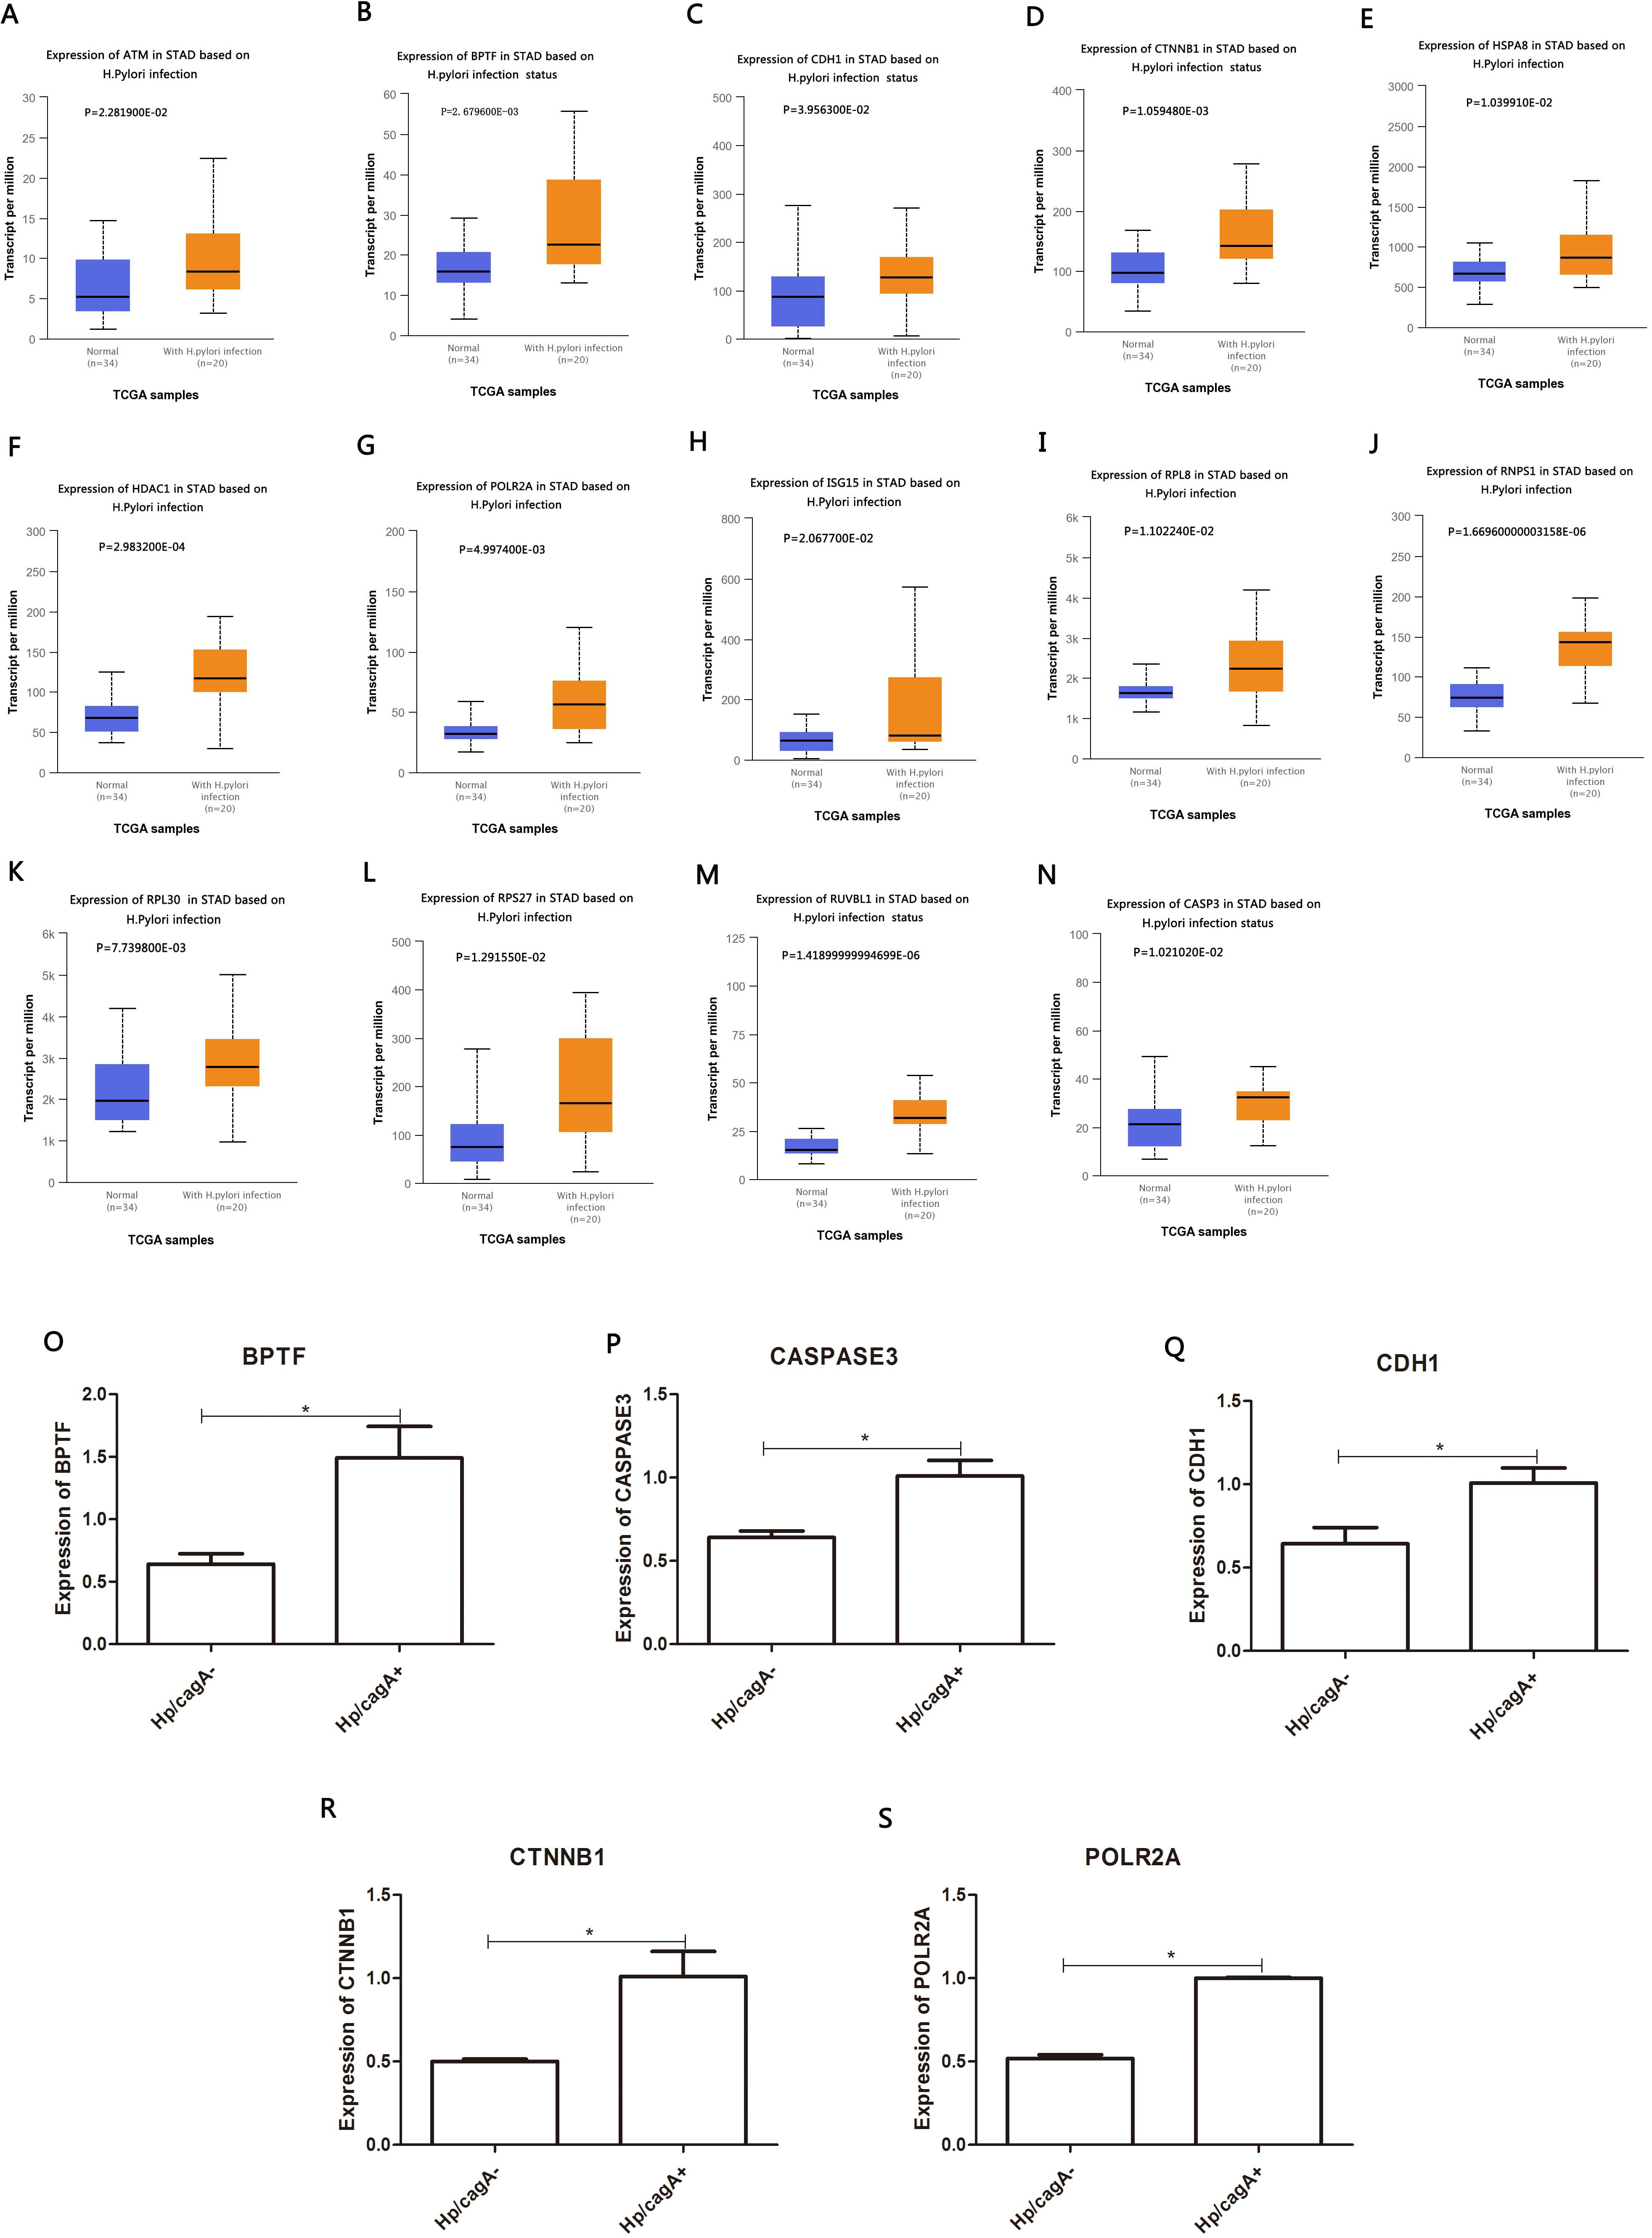
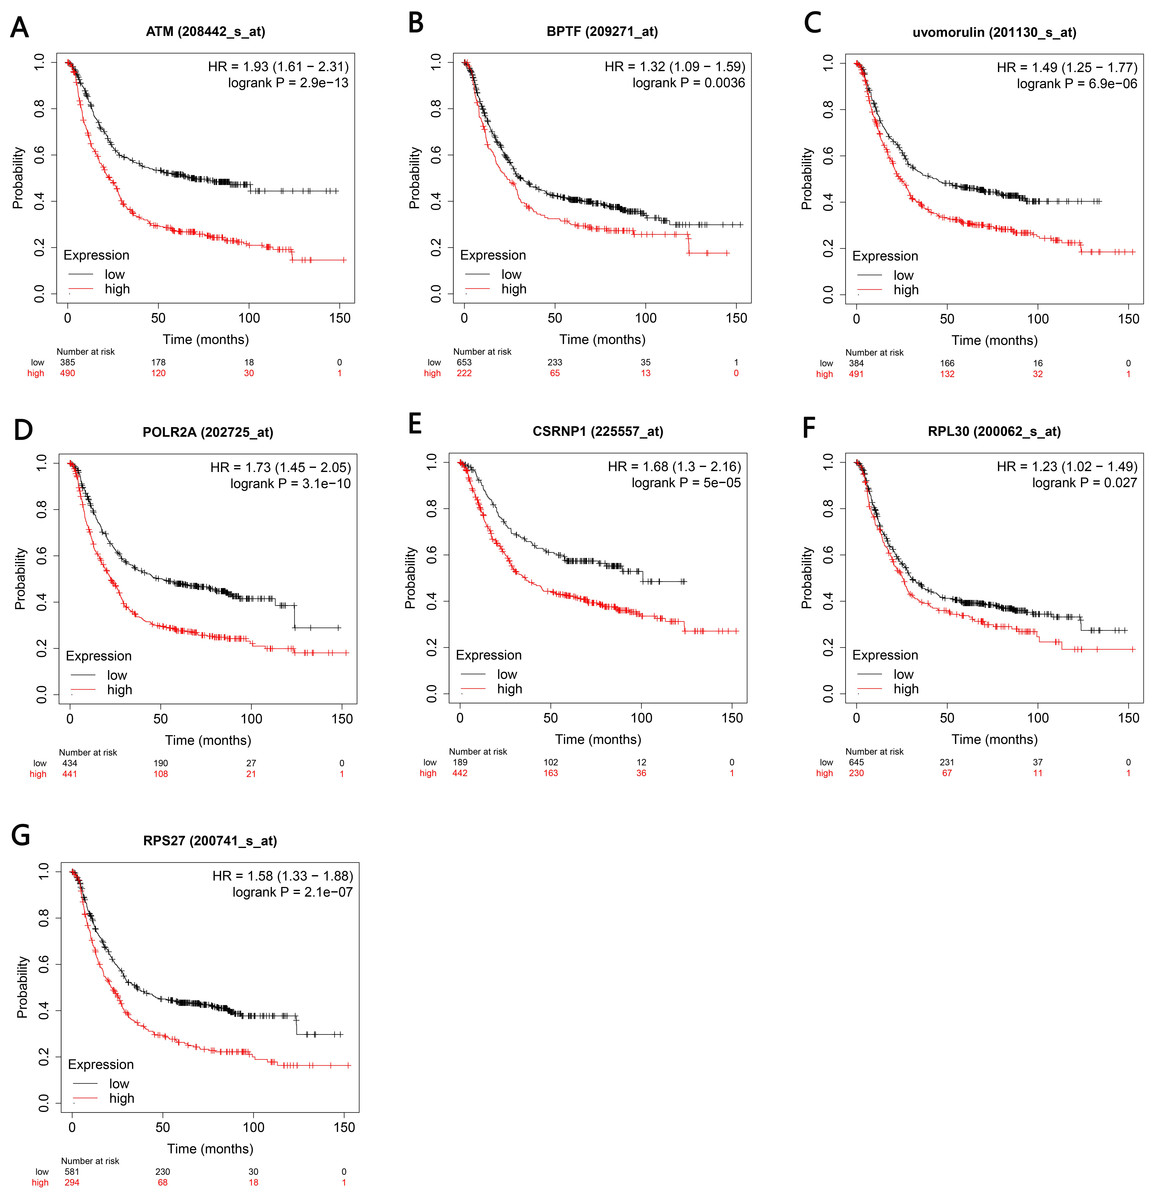
Figure 7: Kaplan–Meier analyses indicated the overall survival of central genesexpressed in patients with gastric cancer.
(A–G) P < 0.05 was considered to be statistically significant. HR, hazard ratio.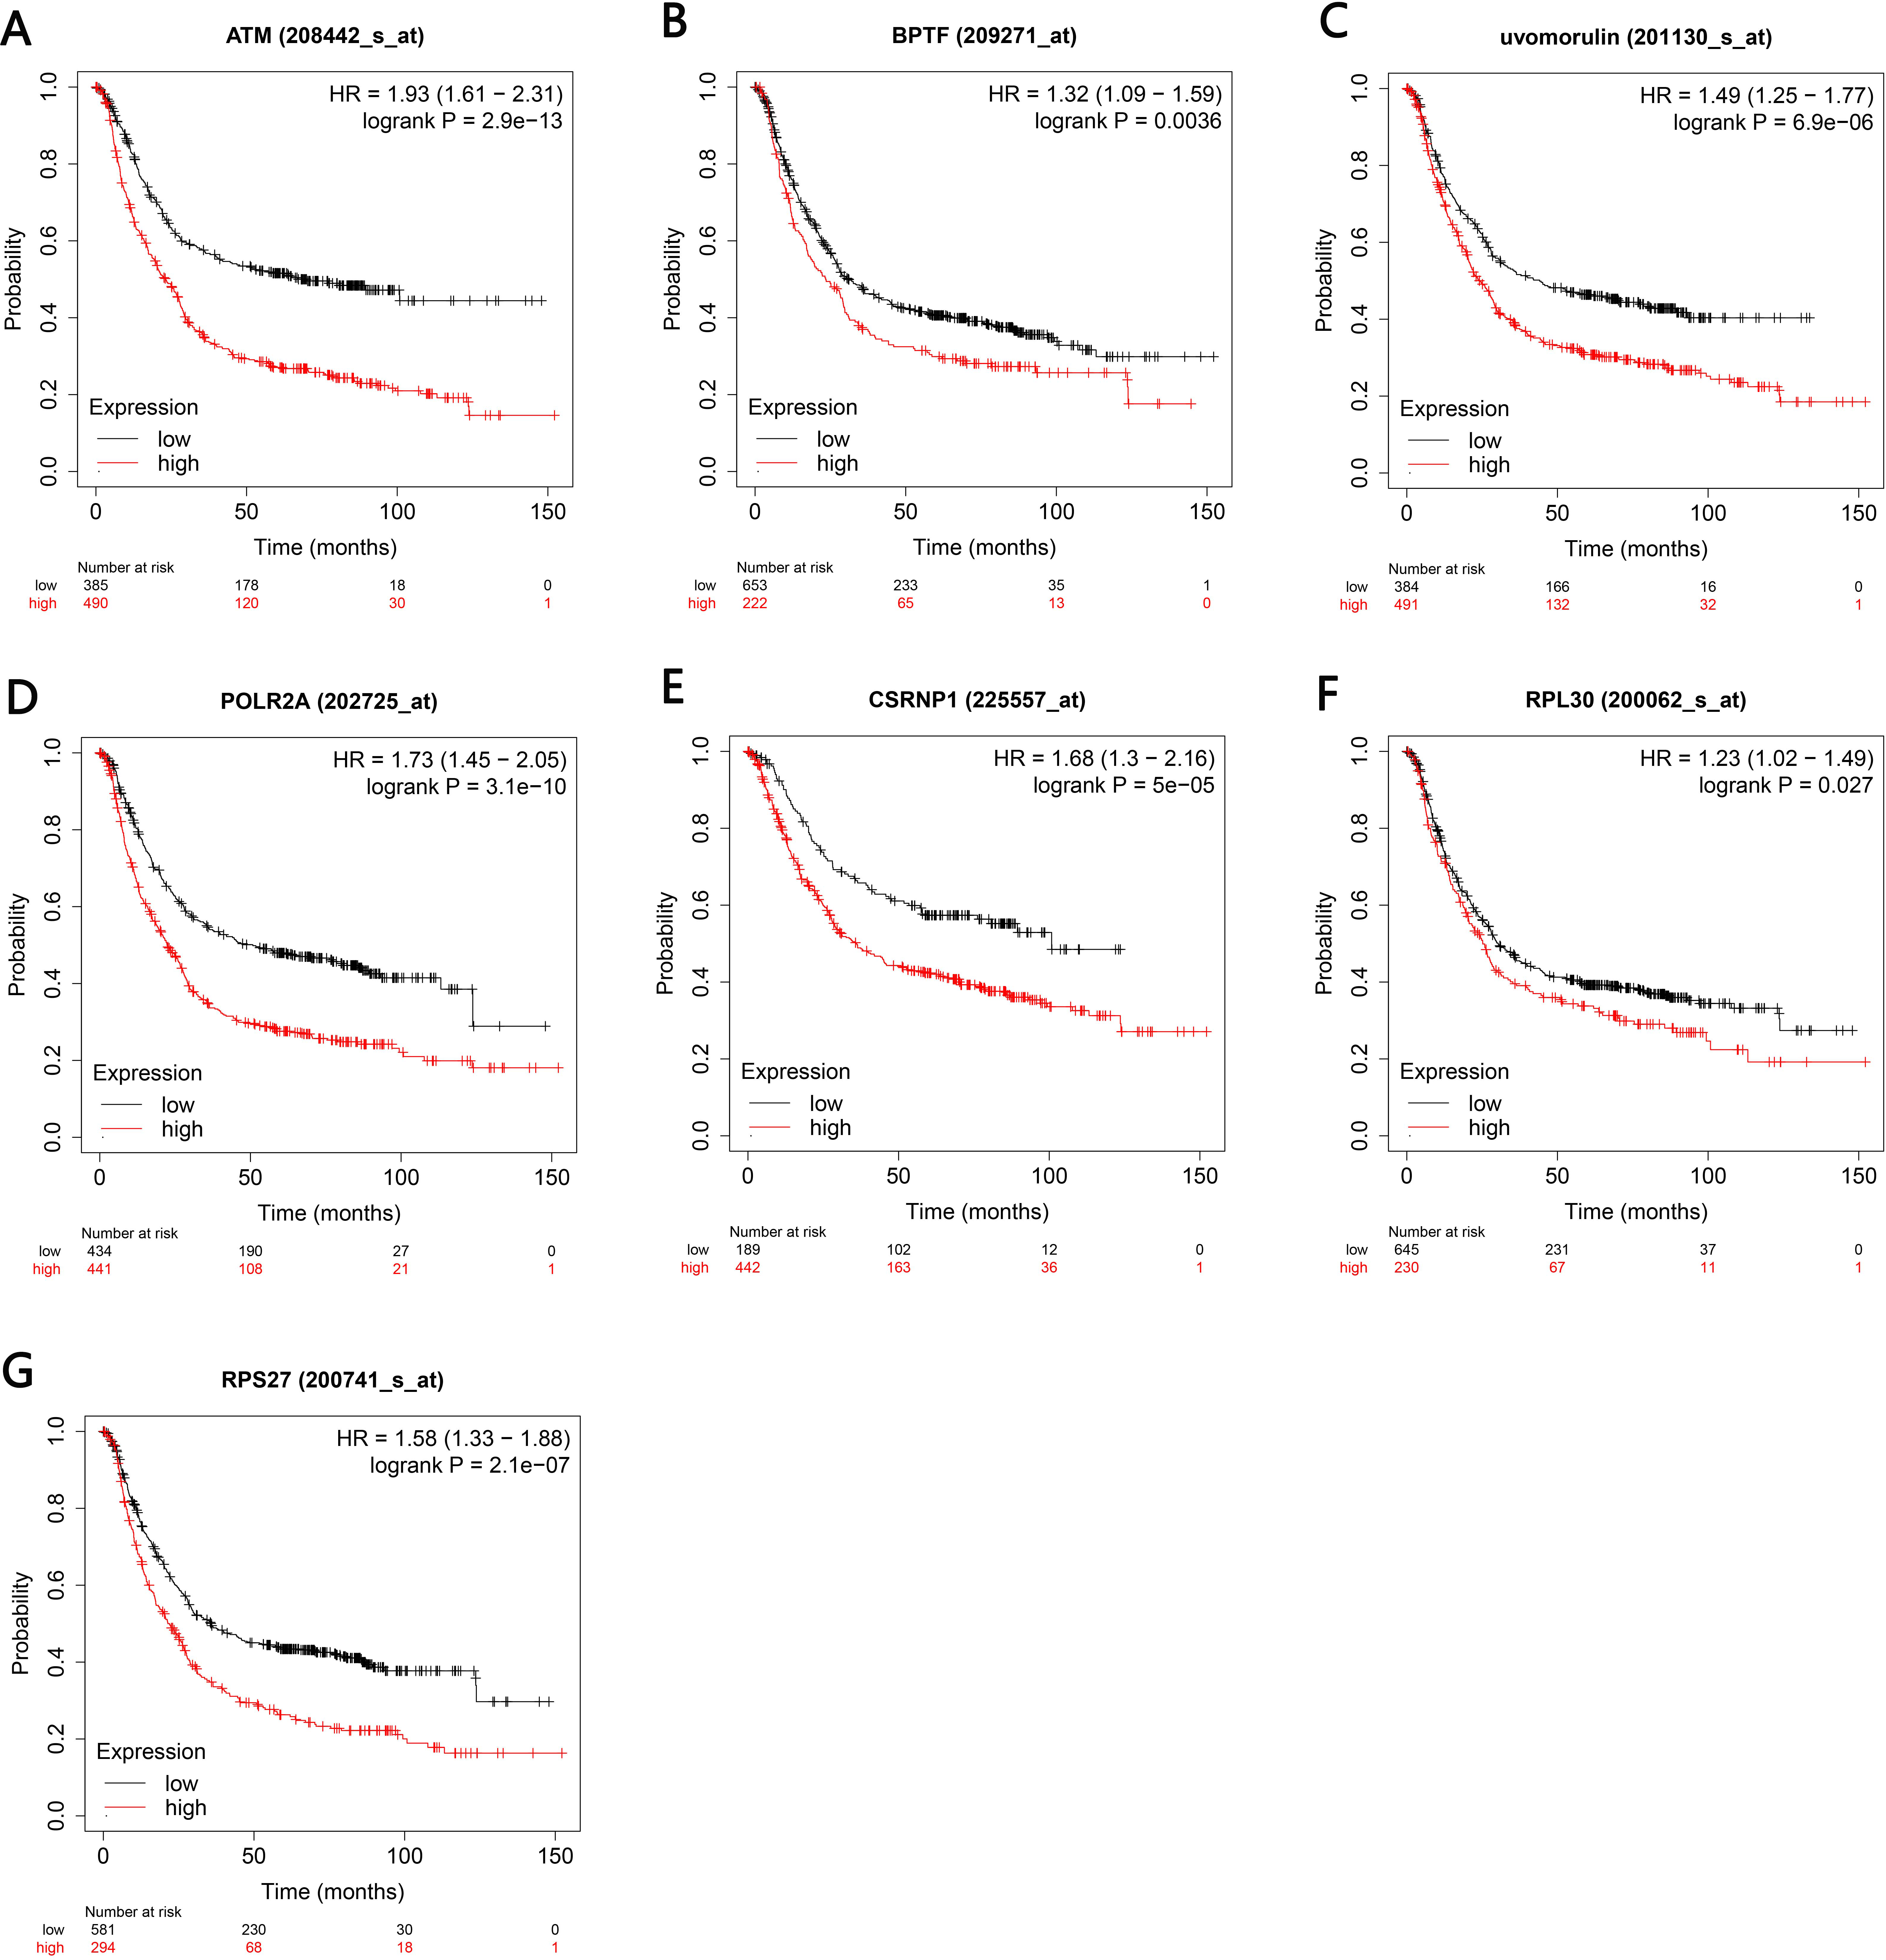
The 30 key genes with the highest screening in the PPI network were analyzed through data, and 14 genes were highly expressed in Helicobacter pylori-positive gastric cancer patients (according to the TCGA database analysis, including ATM, BPTF, CDH1, CTNNB1, HSPA8, HDAC1, POLR2A), ISG15, RPL8, RNP1, RPL30, RPS27, RUVBL1 and CASP3). Finally, use the Kaplan–Meier plotter tool to predict the relationship between them and the poor prognosis of the patient. We have noticed that the high survival rate of these 7 genes is very low, which is related to the poor prognosis of gastric cancer, including genes ATM, BPTF, CDH1, POLR2A, RNP1, BPL30 and RPS27. The enrichment analysis of these 7 genes showed that they are related to the binding of P53, the binding of transcription factors and transcriptional regulation. After verification by RT-qPCR, the results showed that CagA of Helicobacter pylori only caused the up-regulation of 5 genes, including BPTF, CASP3, CDH1, CTNNB1 and POLR2A. Compared with survival analysis, BPTF, CDH1 and POLR2A have high gene expression and low survival rate. Past studies have reported that CDH1 gene mutations are associated with diffuse gastric cancer. This gene encodes E-cadherin, a transmembrane cadherin, and cell adhesion molecules that depend on this gene are involved in the formation of cell junctions and the maintenance of epithelial integrity (Cho et al., 2017; Figueiredo et al., 2019; Li, 2019; Van der Post et al., 2015). CDH1 is involved in mediating cell adhesion, migration, epithelial cell proliferation and cell cycle (Han et al., 2019; Pal et al., 2020). CDH1 germline mutations are associated with the encoded tumor suppressor protein E-cadherin, which is the genetic cause of hereditary diffuse gastric cancer (Van der Post et al., 2015). Among the other seven genes, BPTF is the core subunit of the nucleosome remodeling factor (NURF) complex and plays an important role in chromatin remodeling. This gene can directly activate oncogenic signals or coordinate activation with other key protein factors, thereby affecting tumor progression (Zhao et al., 2019). Human POLR2A encodes the highly conserved RPB1 protein, which is the largest of the 12 subunits of the essential RNA polymerase II (pol II) enzyme. This protein complex is responsible for the transcription of pol II encoded by all proteins. Further studies have shown that the sustained release of pol II bound to the promoter, the truncated RPB1 encoding and the shortened C-terminal domain will affect transcriptional regulation and cell cycle (Haijes et al., 2019). Based on the above analysis, BPTF, CDH1, POLR2A may be important target genes and signal molecules regulated by CagA of Helicobacter pylori and have a poor clinical prognosis. Notch and Wnt may be important signaling pathways regulated by Helicobacter pylori CagA, and play an important role in CagA regulating tumor signal molecules. Through bioinformatics analysis of the target genes and signaling pathways regulated by Helicobacter pylori CagA, and exploring the mechanism of CagA, we found that the target genes are related to the occurrence of multiple tumors in the signaling pathway. In past studies, Helicobacter pylori has a greater relationship with gastric cancer. This provides a theoretical basis for future exploration of the possible molecular mechanism of Helicobacter pylori CagA causing gastric cancer. At present, the interaction between these molecules lacks support, and experimental evidence is needed to clarify the underlying mechanism. The rise and development of the field of bioinformatics has accelerated the development of biology. Bioinformatics tools provide opportunities to deal with big data that cannot be managed manually (Wroblewski & Peek Jr, 2016)
Conclusion
DEG of the H. pylori CagA plasmid group and the empty vector (negative control) group were obtained via high-throughput sequencing, followed by bioinformatics analysis using the R software, Cytoscape, and related databases. For this purpose, first, 1062 DEG with statistical significance were identified, of which 594 were upregulated and 468 were downregulated. GO enrichment and KEGG pathway analysis revealed that DEG was mainly enriched in the Wnt pathway, Notch pathway, Adhesive connection, and other pathways in cancer. To provide a theoretical basis for studying the biological processes of gastric cancer, we successfully constructed DEG PPI network, screened out 30 key genes with a relatively high degree, and further studied the network to understand the interaction among DEG. Comprehensive analysis of TCGA database, RT-qPCR and Kaplan–Meier plotter showed that Helicobacter pylori CagA can cause the up-regulation of genes BPTF, CDH1, POLR2A, and their high expression is attributable to poor clinical results. Through data analysis, these genes may be induced and regulated by Helicobacter pylori CagA. These findings enable us to understand the downstream target gene molecules and signal pathways regulated by Helicobacter pylori CagA, and provide a theoretical basis for studying the mechanism of Helicobacter pylori CagA. The target genes and signal pathways obtained in this study are related to the occurrence and development of tumors. These findings enable us to further explore and understand the basic molecular mechanism of Helicobacter pylori CagA regulating the tumorigenesis and development of target genes and signaling pathways.