The European and Japanese outbreaks of H5N8 derive from a single source population that has most likely been dispersed along the long distance bird migratory flyways
- Published
- Accepted
- Subject Areas
- Agricultural Science, Bioinformatics, Computational Biology, Genetics, Virology
- Keywords
- High pathogenicity avian influenza, HPAI, H5N8, migratory birds, Siberia, Korea, Bayesian, coalescence
- Copyright
- © 2015 Dalby et al.
- Licence
- This is an open access article distributed under the terms of the Creative Commons Attribution License, which permits unrestricted use, distribution, reproduction and adaptation in any medium and for any purpose provided that it is properly attributed. For attribution, the original author(s), title, publication source (PeerJ PrePrints) and either DOI or URL of the article must be cited.
- Cite this article
- 2015. The European and Japanese outbreaks of H5N8 derive from a single source population that has most likely been dispersed along the long distance bird migratory flyways. PeerJ PrePrints 3:e822v1 https://doi.org/10.7287/peerj.preprints.822v1
Abstract
The origin of recent parallel outbreaks of the high pathogenicity H5N8 avian flu virus in Europe and in Japan can be traced to a single source population, which has most likely been spread by migratory birds. By using Bayesian coalescence methods to analyze the DNA sequences of the virus to find the times for divergence and combining bird migration data we can show the most likely locations and migratory pathways involved in the origin of the current outbreak. This population was most likely located in the Siberian summer breeding grounds of long-range migratory birds. These breeding grounds provide a connection between different migratory flyways and explain the current outbreaks in remote locations. By combining genetic methods and epidemiological data we can rapidly identify the sources and the dispersion pathways for novel avian influenza outbreaks.
Author Comment
This paper describes using phylogenetic, epidemiological and bird migratory data to propose a mechanism for the dispersal of H5N8 avian influenza, that caused simultaneous outbreaks in Europe and Japan in December 2014. This is a submission to PeerJ for review.
Supplemental Information
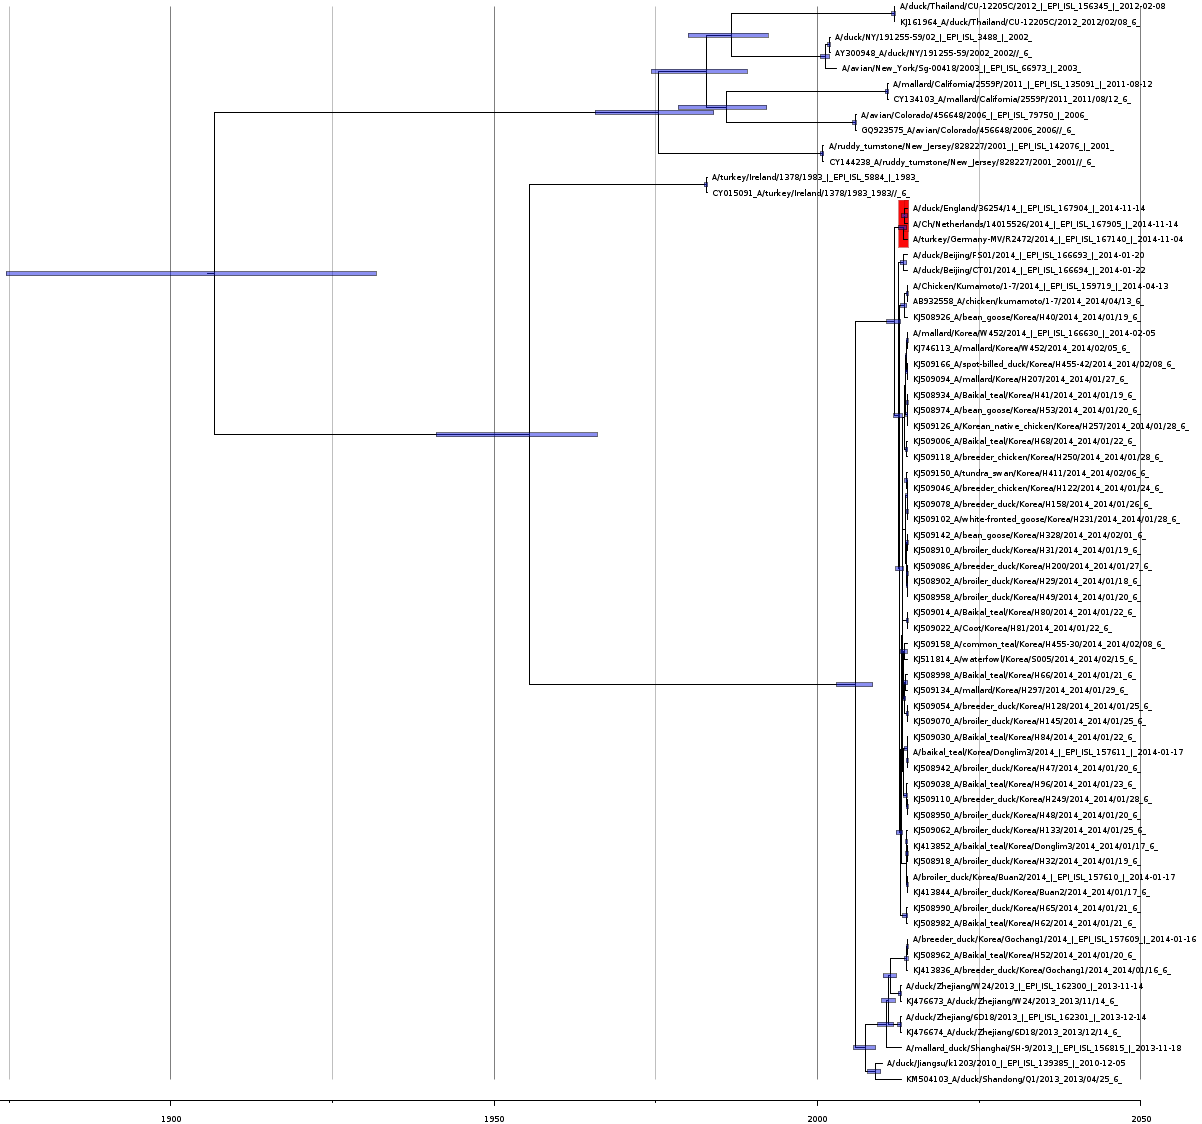
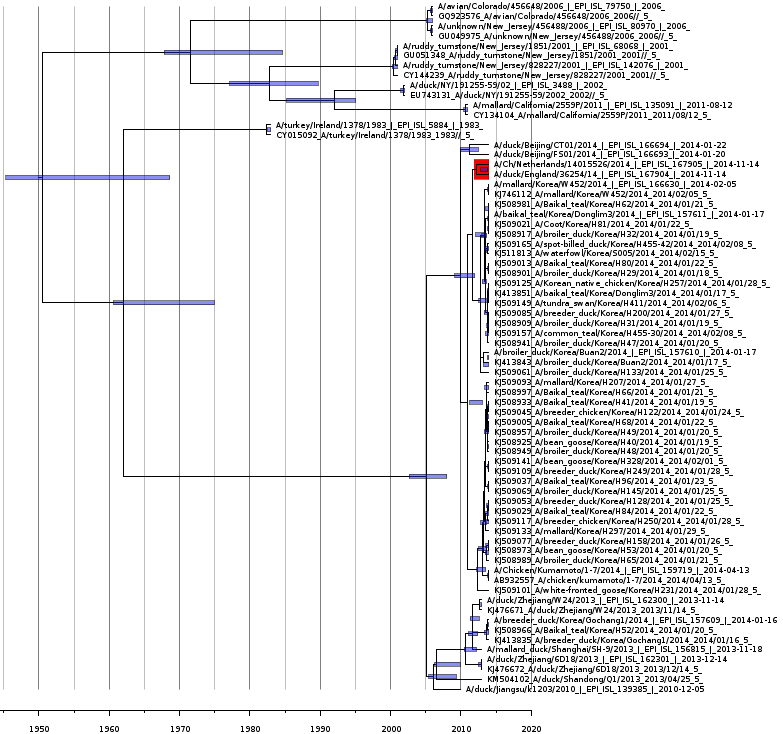
Bayesian coalescence tree for hemagglutinin
Bayesian coalescence gene tree for all of the H5N8 hemagglutinin segment sequences. The blue bars on the nodes represent the 95% highest posterior densities of the branch heights (this is the time for divergence in months). The European and Japanese clade is highlighted in red. The x-axis represents the date in years.
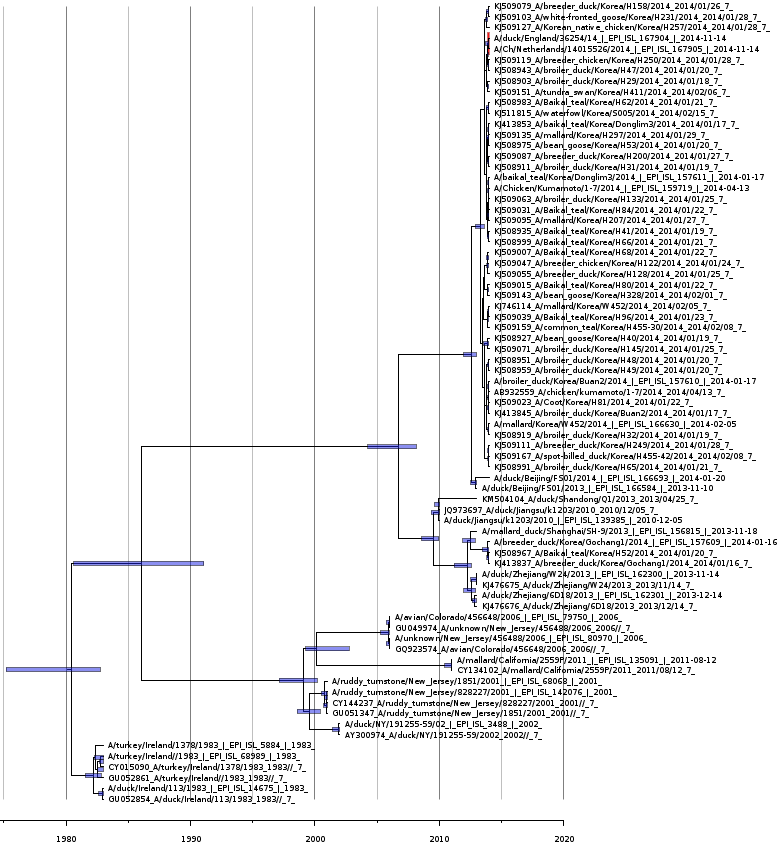
Bayesian coalescence tree of neuraminidase
Bayesian coalescence gene tree for all of the H5N8 neuraminidase segment sequences. The blue bars on the nodes represent the 95% highest posterior densities of the branch heights (this is the time for divergence in months). The European and Japanese clade is highlighted in red. The x-axis represents the date in years.
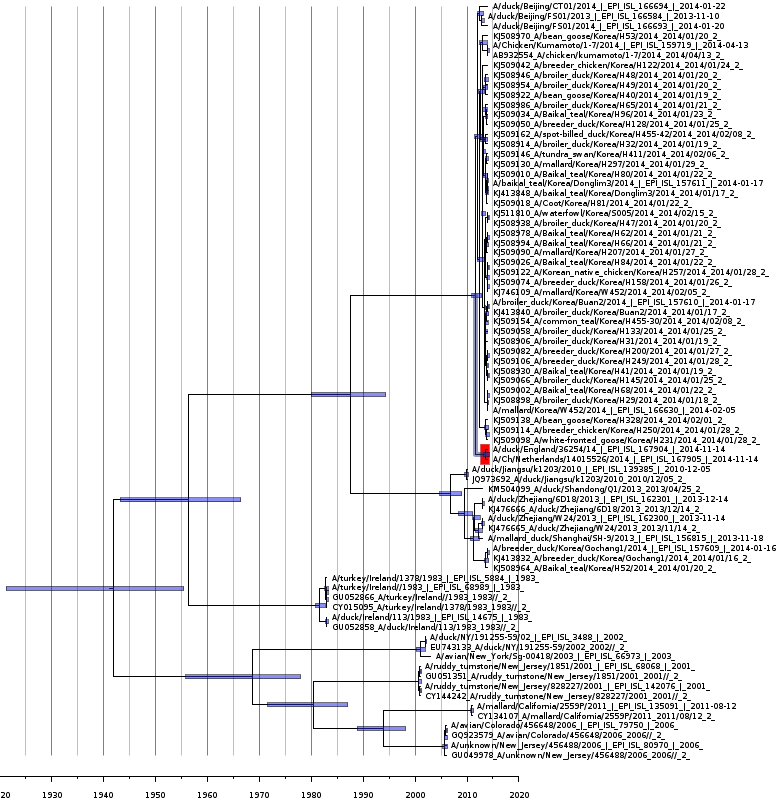
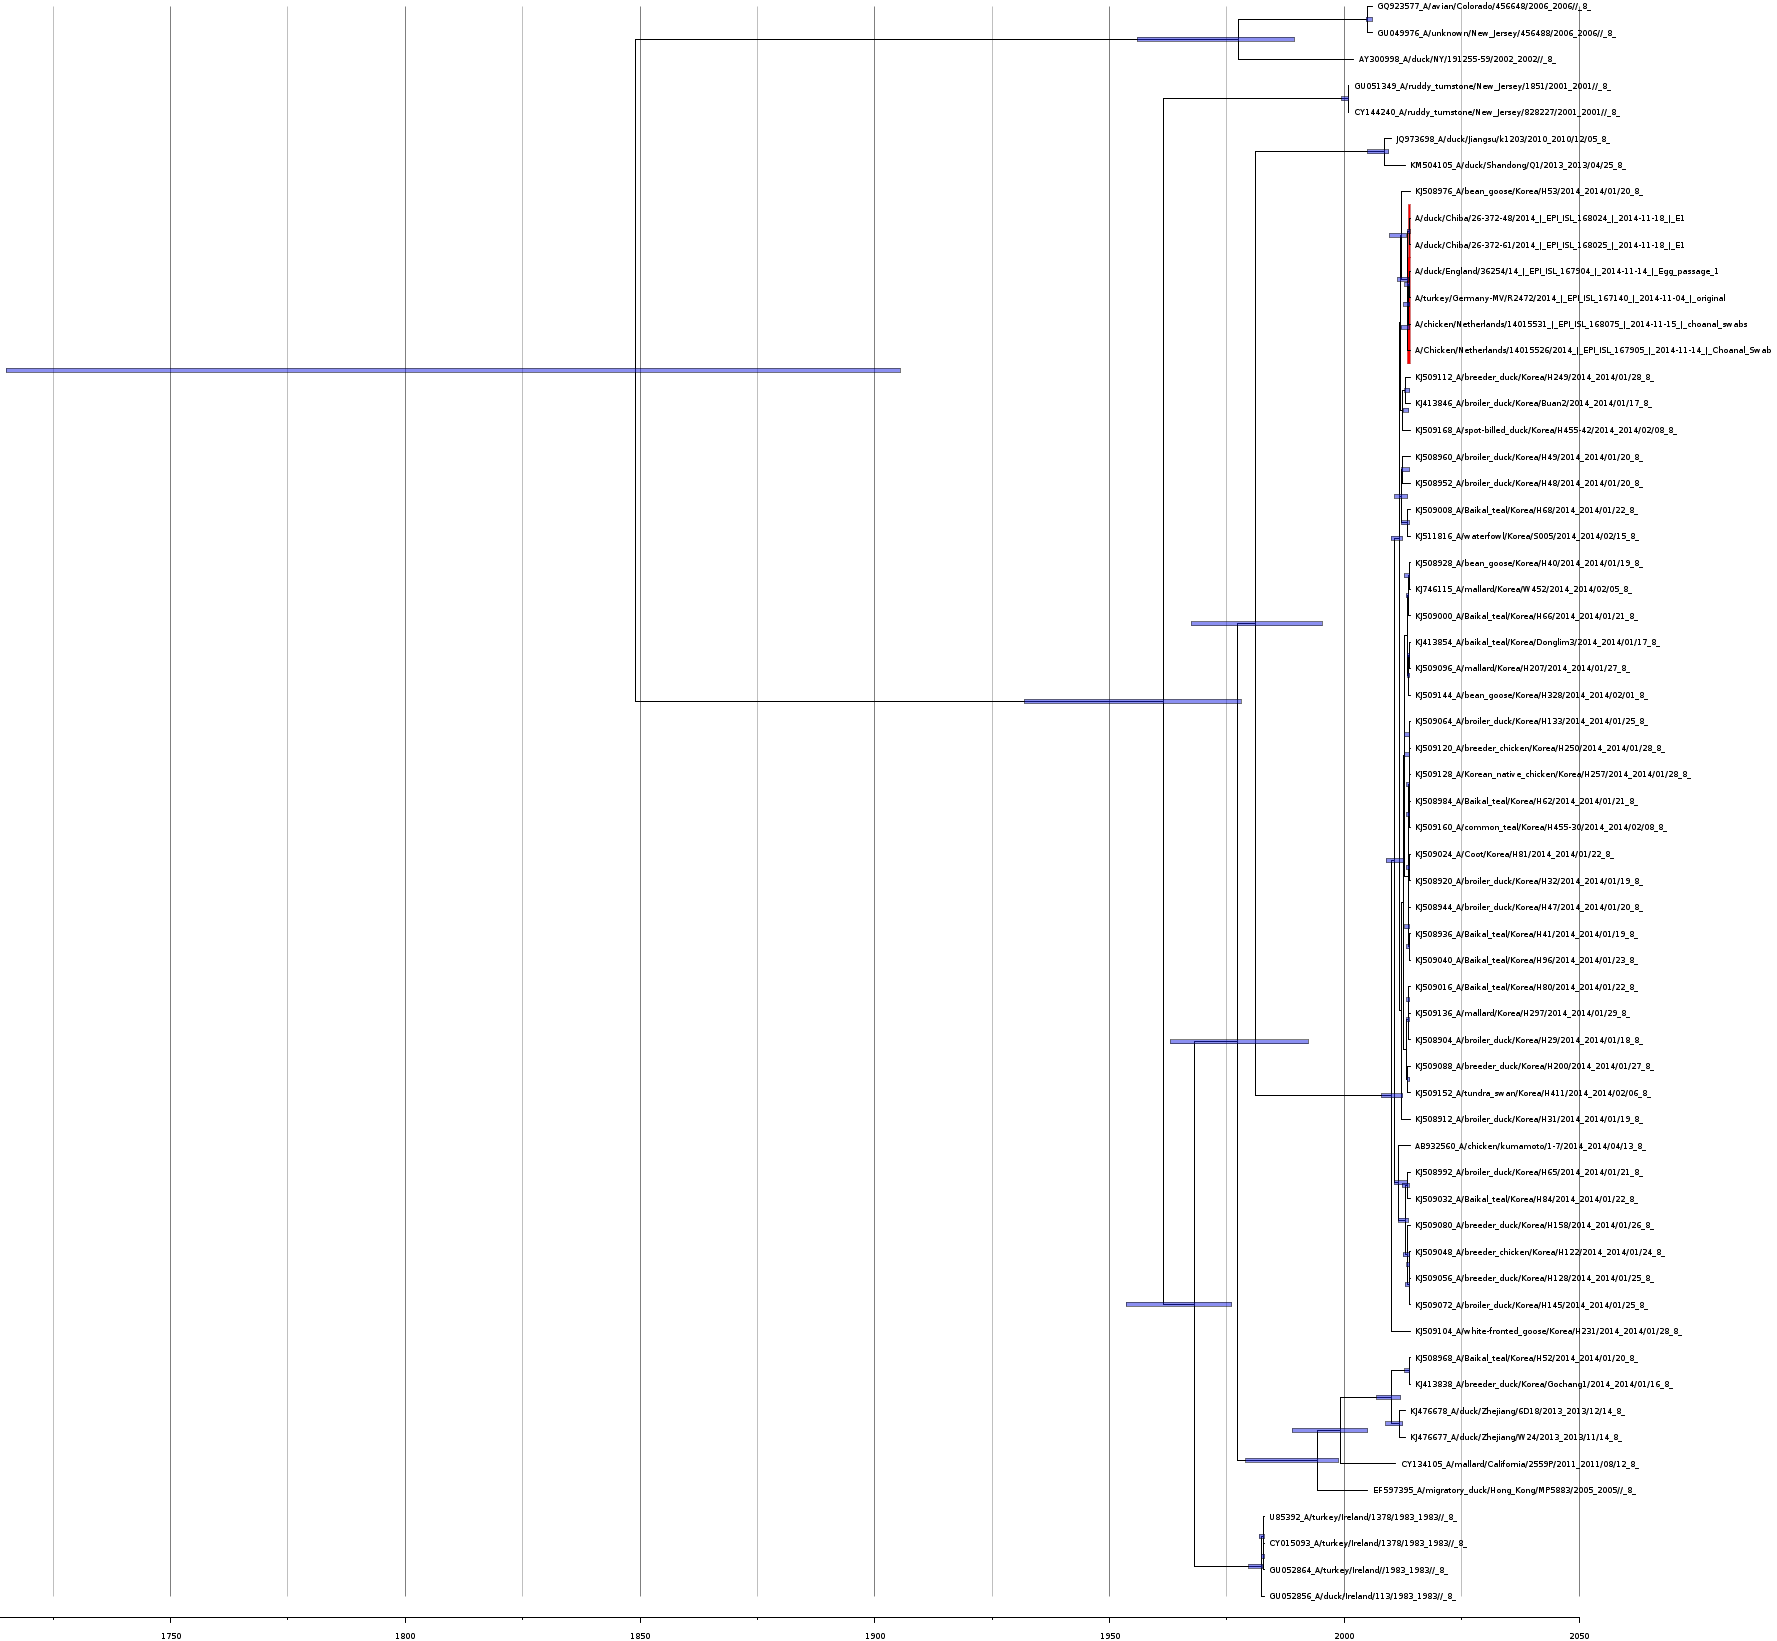
Bayesian coalescent tree of the matrix protein segment
Bayesian coalescence gene tree for all of the H5N8 matrix protein segment sequences. The blue bars on the nodes represent the 95% highest posterior densities of the branch heights (this is the time for divergence in months). The European and Japanese clade is highlighted in red. The x-axis represents the date in years.
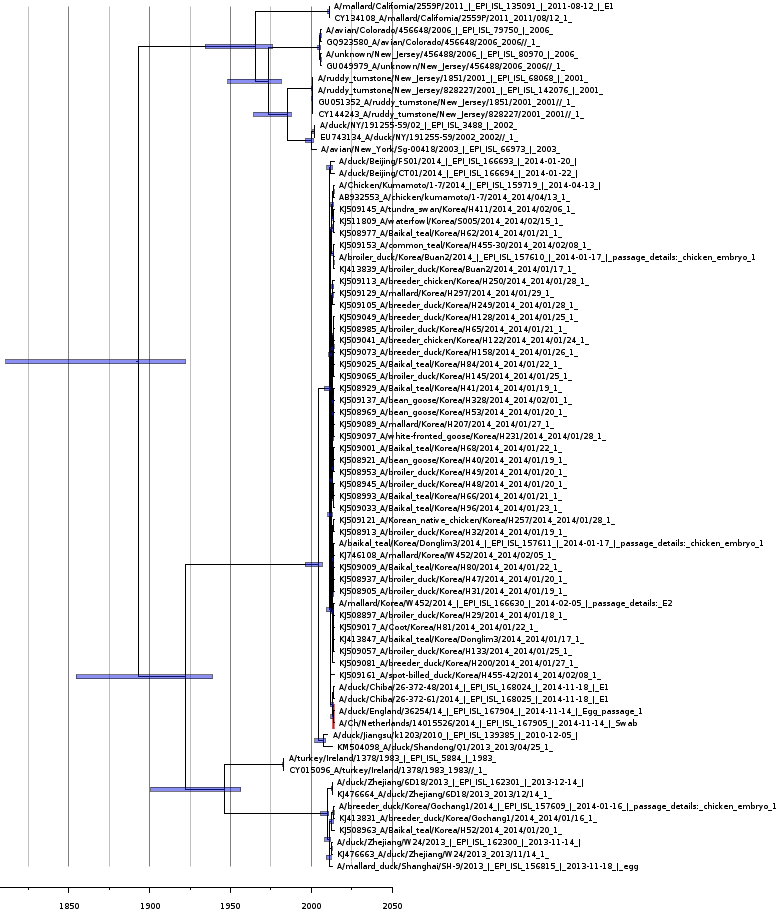
Bayesian coalescent tree of polymerase protein segment PB1
Bayesian coalescence gene tree for all of the H5N8 polymerase subunit (PB1) segment sequences. The blue bars on the nodes represent the 95% highest posterior densities of the branch heights (this is the time for divergence in months). The European and Japanese clade is highlighted in red. The x-axis represents the date in years.
Bayesian coalescent tree for the polymerase protein segment PB2
Bayesian coalescence gene tree for all of the H5N8 polymerase subunit (PB2) segment sequences. The blue bars on the nodes represent the 95% highest posterior densities of the branch heights (this is the time for divergence in months). The European and Japanese clade is highlighted in red. The x-axis represents the date in years.
Bayesian coalescent tree for the polymerase PA protein segment
Bayesian coalescence gene tree for all of the H5N8 polymerase subunit (PA) segment sequences. The blue bars on the nodes represent the 95% highest posterior densities of the branch heights (this is the time for divergence in months). The European and Japanese clade is highlighted in red. The x-axis represents the date in years.
Bayesian coalescent tree for the nucleoprotein segment
Bayesian coalescence gene tree for all of the H5N8 nucleoprotein subunit (NP) segment sequences. The blue bars on the nodes represent the 95% highest posterior densities of the branch heights (this is the time for divergence in months). The European and Japanese clade is highlighted in red. The x-axis represents the date in years
Bayesian coalescent tree for the non-structural protein segment
Bayesian coalescence gene tree for all of the H5N8 non-structural protein subunit (NS) segment sequences. The blue bars on the nodes represent the 95% highest posterior densities of the branch heights (this is the time for divergence in months). The European and Japanese clade is highlighted in red. The x-axis represents the date in years.