Transcriptome analyses of Anguillicola crassus from native and novel hosts
- Published
- Accepted
- Subject Areas
- Evolutionary Studies, Genomics, Parasitology
- Keywords
- Anguillicola crassus, SNPs, population differentiation, gene expression, transcriptome, discriminant analysis of principal components (DAPC), Anguilla, Eel, invasive parasite, Anguillicoloides crassus
- Copyright
- © 2014 Heitlinger et al.
- Licence
- This is an open access article distributed under the terms of the Creative Commons Attribution License, which permits unrestricted use, distribution, reproduction and adaptation in any medium and for any purpose provided that it is properly attributed. For attribution, the original author(s), title, publication source (PeerJ PrePrints) and either DOI or URL of the article must be cited.
- Cite this article
- 2014. Transcriptome analyses of Anguillicola crassus from native and novel hosts. PeerJ PrePrints 2:e589v1 https://doi.org/10.7287/peerj.preprints.589v1
Abstract
Anguillicola crassus is a swim bladder nematode of eels. The parasite is native to the Asian eel Anguilla japonica, but was introduced to Europe and the European eel Anguilla anguilla in the early 1980s. A Taiwanese source has been proposed for this introduction. In the new host in the recipient area, the parasite appears to be more pathogenic. As a reason for these differences, genetically fixed differences in infectivity and development between Taiwanese and European A.crassus have been described and disentangled from plasticity induced by different host environments.To explore whether transcriptional regulation is involved in these lifecycle differences, we have analysed a “common garden”, cross infection experiment, using deep-sequencing transcriptomics. Surprisingly, in the face of clear phenotypic differences in life history traits, we identified no significant differences in gene expression between parasite populations or between experimental host species. From 120,000 SNPs identified in the transcriptome data we found that European A. crassus were not a genetic subset of the Taiwanese nematodes sampled. The loci that have the major contribution to the European-Taiwanese population differentiation show an enrichment of synonymous and non-coding polymorphism. This argues against positive selection in population differentiation. However, genes involved in protein processing in the endoplasmatic reticulum membrane and genes bearing secretion signal sequences were enriched in the set of genes most differentiated between European and Taiwanese A. crassus. These genes could be a source for the phenotypically visible genetically fixed differences between European and Taiwanese A. crassus.
Author Comment
This is a revised submission to PeerJ for review.
Supplemental Information
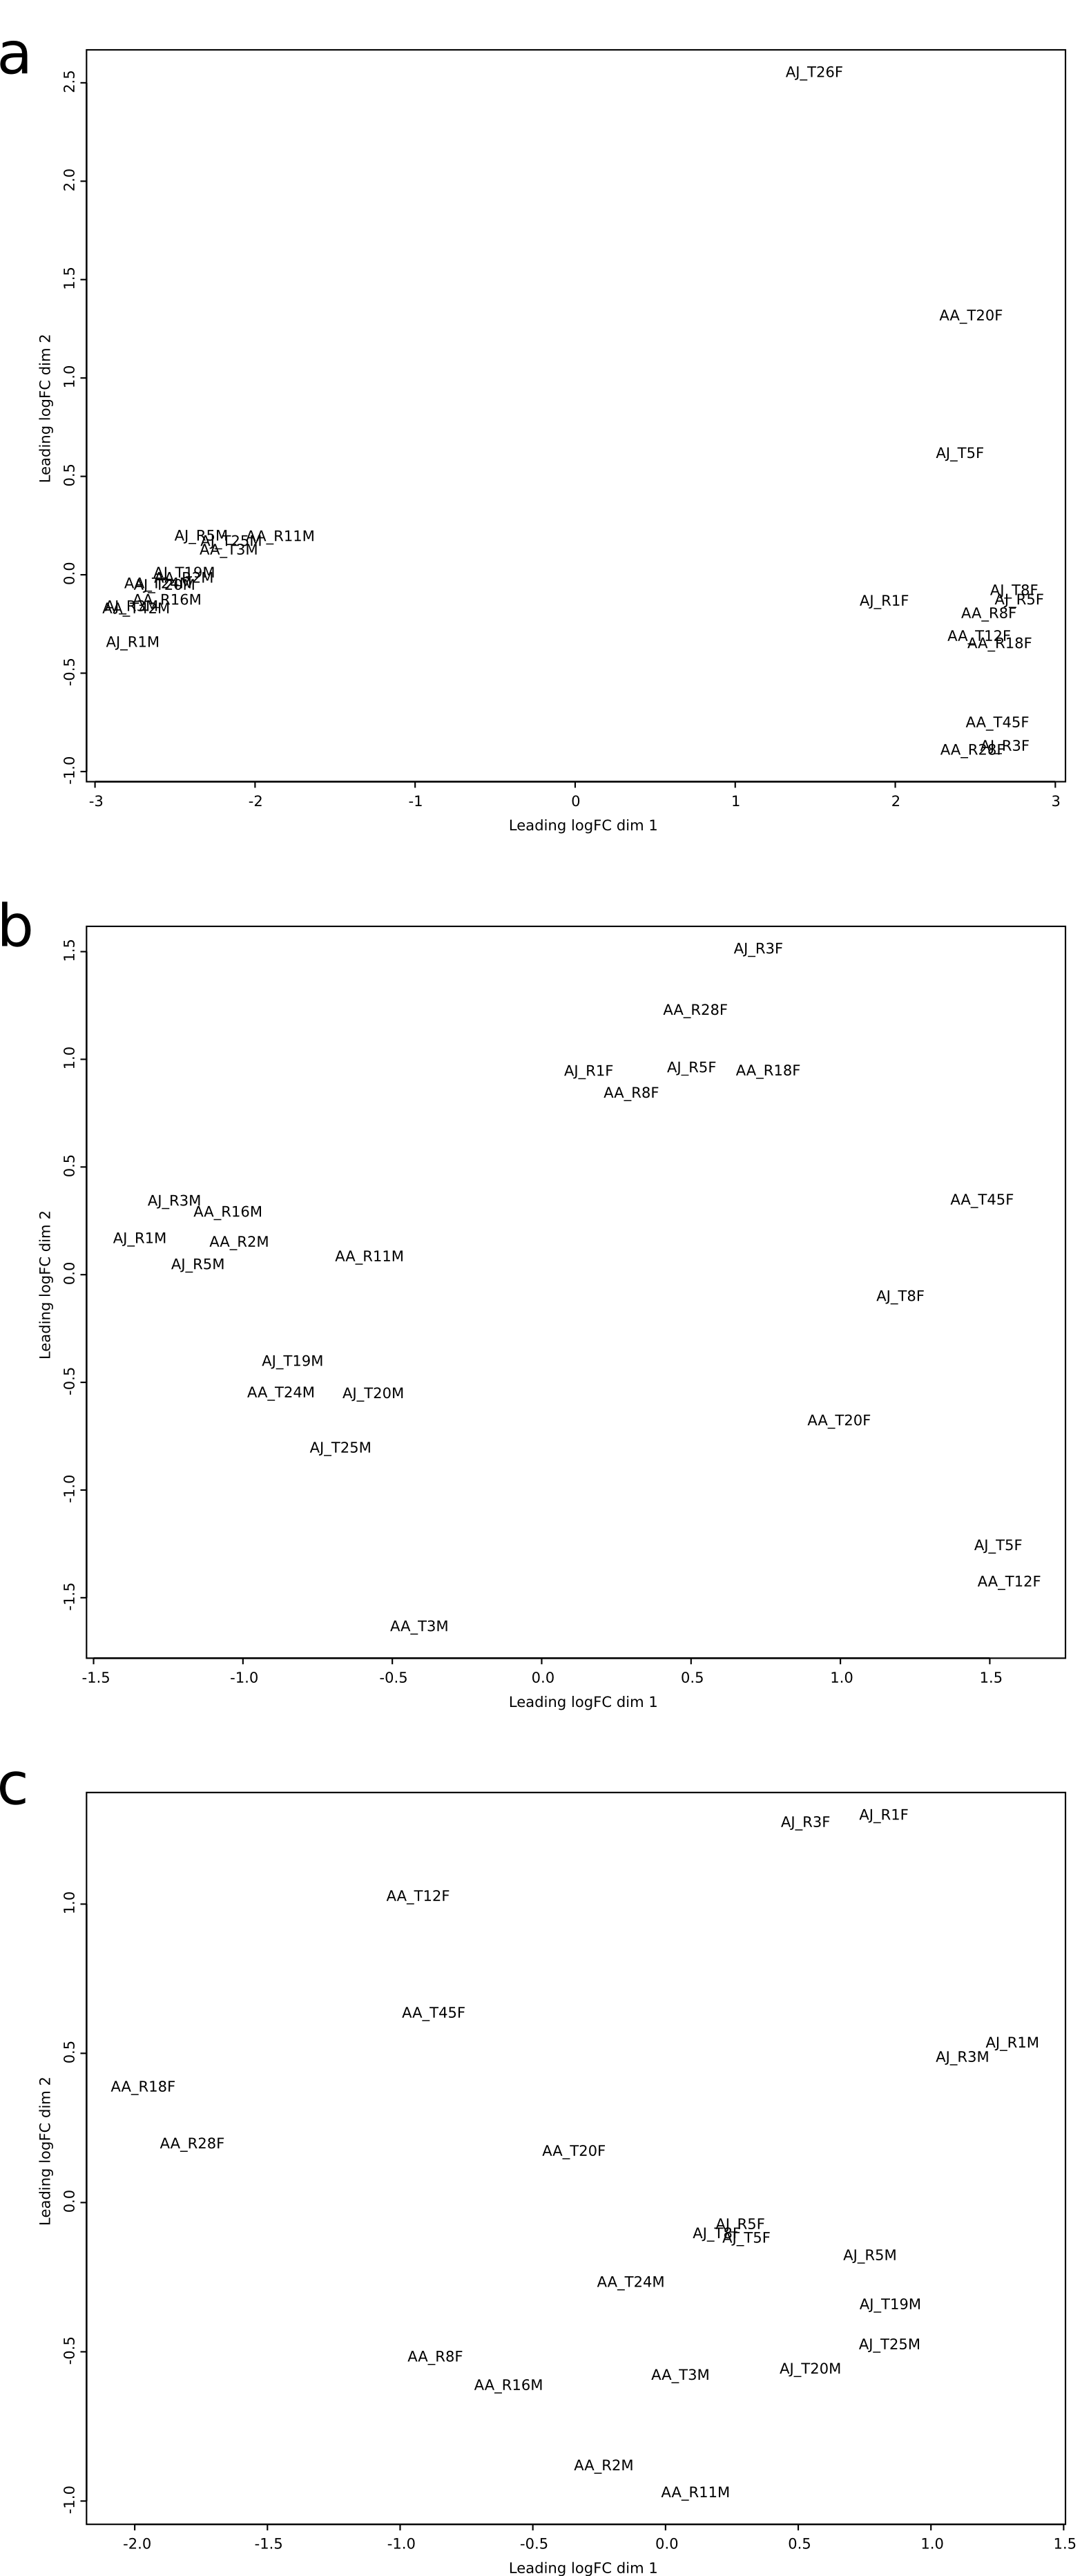
Multidimensional scaling of gene expression
Multidimensional scaling of overall gene expression (A) identifies distinct clusters of male and female nematodes. Using the same technique on the subset of genes identified in generalized linear models for genes putativelydiffering for both nematode population (B) and experimental host species (C) does not generate robust clustering.
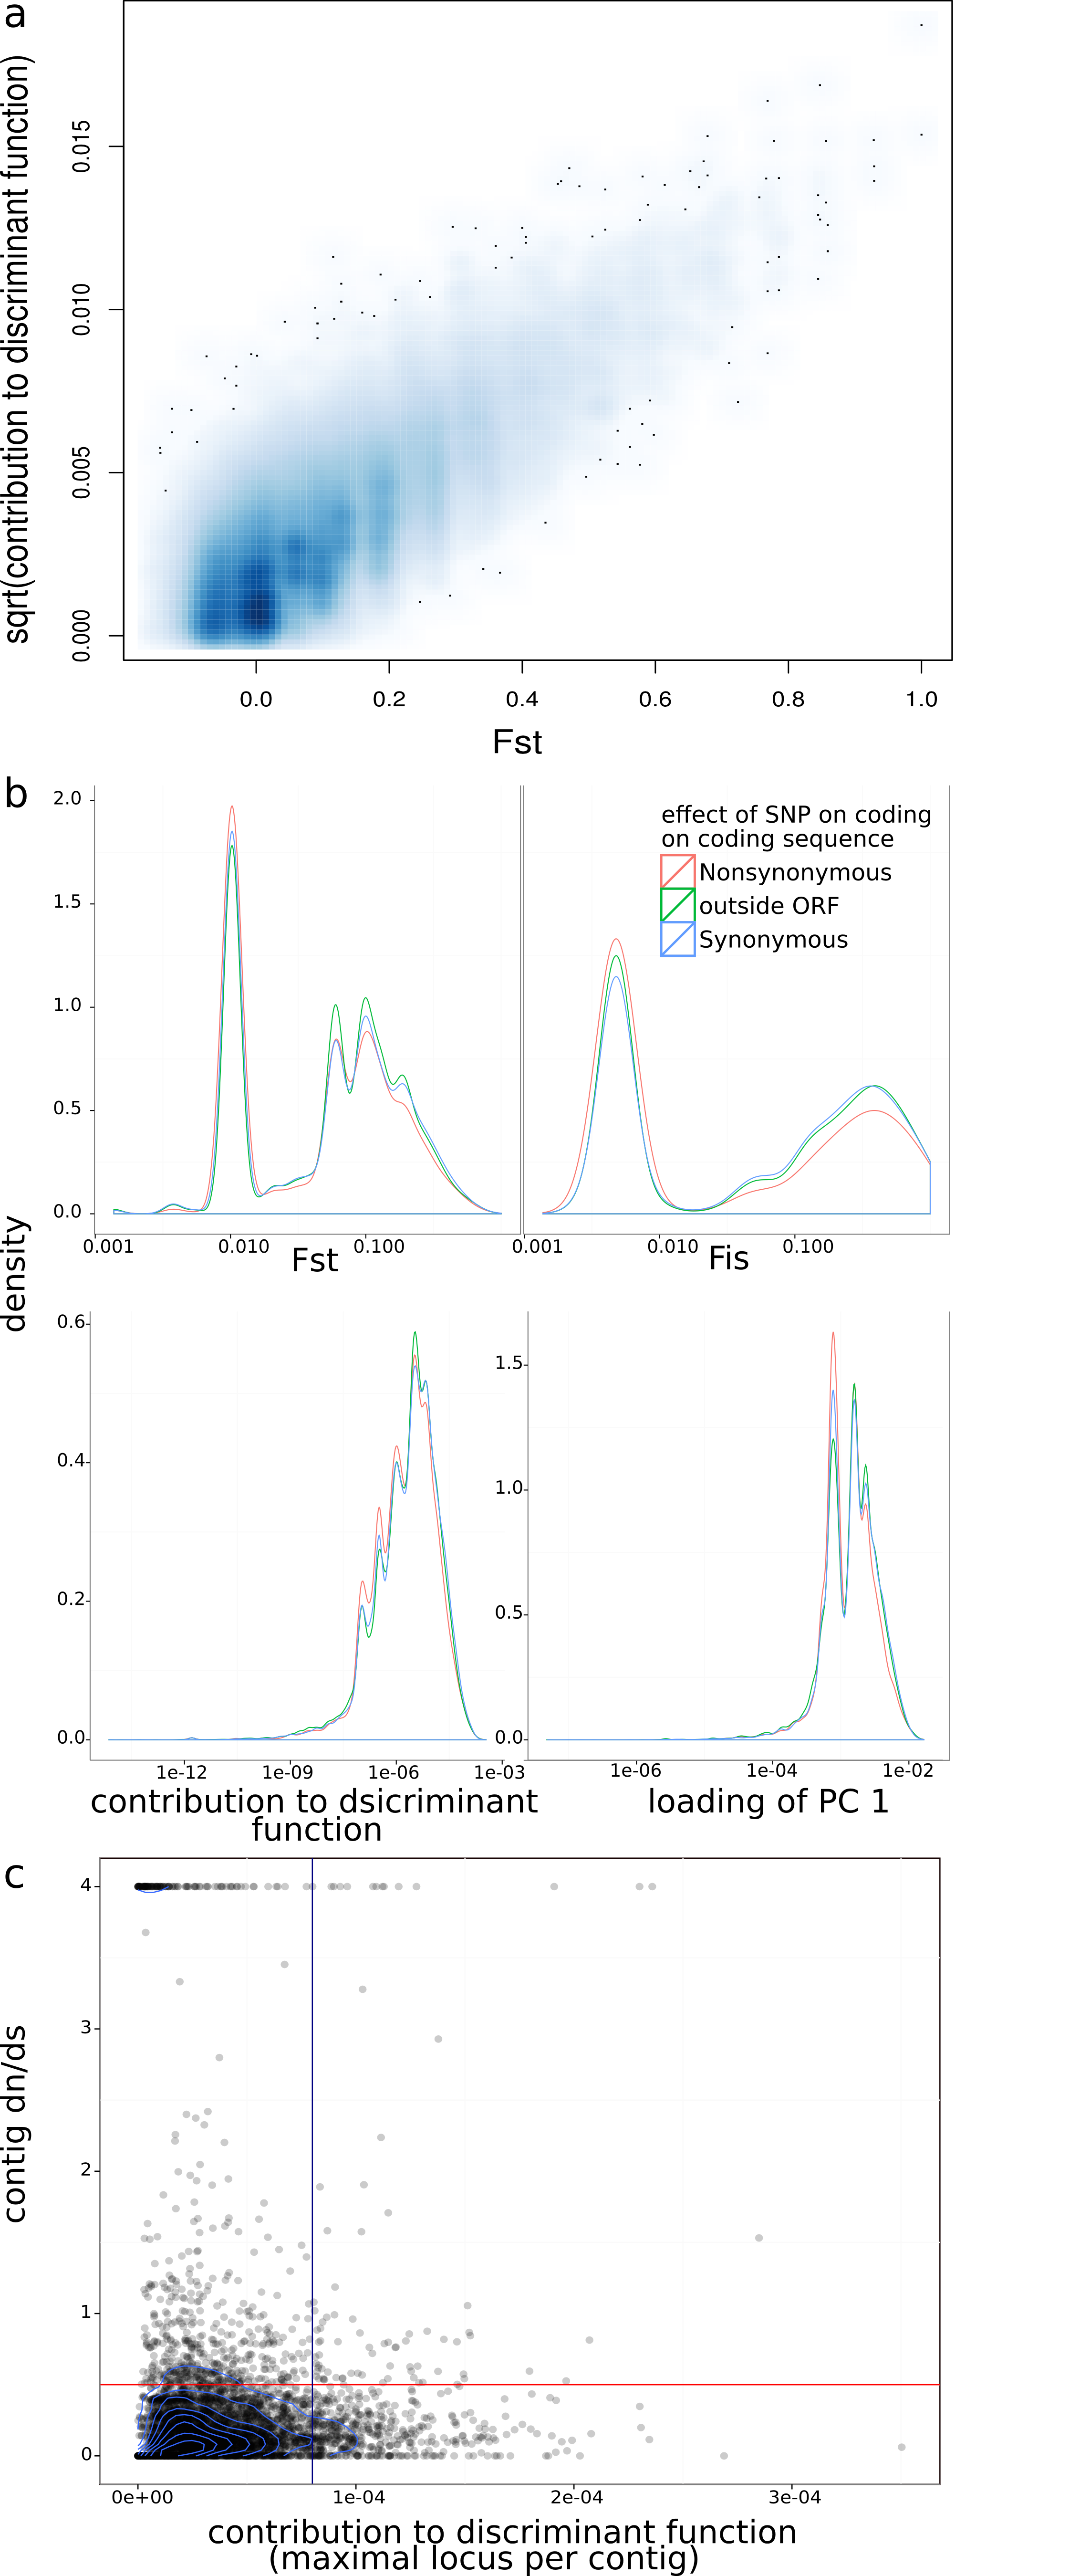
Relationships of genotypic differentiation measures
Panel A depicts the high correlation of the contribution to the discriminant
function between populations and fixation index Fst. Panel
B shows the density distributions of different measures of
differentiation separately for SNPs with different effect on the
protein sequence. Highly differentiating SNPs are enriched for
synonymous and non-coding polymorphism over of non-synonymous
differences. In Panel C dn/ds is plotted against the maximal per gene differentiation (over loci), the green and blue line s give thresholds for “high differentiation” (maximal contribution to discriminant function > 0.8x10⁻⁵) and “positive selection” (dn/ds > 0.5), respectively.