Lack of quantitative training among early-career ecologists: a survey of the problem and potential solutions
- Published
- Accepted
- Subject Areas
- Conservation Biology, Ecology, Environmental Sciences, Science and Medical Education, Statistics
- Keywords
- education, statistics, mathematics, ecology student, teaching, education, statistics, mathematics, teaching, university curriculum, student
- Copyright
- © 2013 Barraquand et al.
- Licence
- This is an open access article distributed under the terms of the Creative Commons Attribution License, which permits unrestricted use, distribution, and reproduction in any medium, provided the original author and source are credited.
- Cite this article
- 2013. Lack of quantitative training among early-career ecologists: a survey of the problem and potential solutions. PeerJ PrePrints 1:e53v2 https://doi.org/10.7287/peerj.preprints.53v2
Abstract
Proficiency in mathematics and statistics is essential to modern ecological science, yet few studies have assessed the level of quantitative training received by ecologists. To do so, we conducted an online survey. The 937 respondents were mostly early-career scientists who studied biology as undergraduates. We found a clear self-perceived lack of quantitative training: 75% were not satisfied with their understanding of mathematical models; 75% felt that the level of mathematics was “too low” in their ecology classes; 90% wanted more mathematics classes for ecologists; and 95% more statistics classes. Respondents thought that 30% of classes in ecology-related degrees should be focused on quantitative disciplines, which is likely higher than for most existing programs. The main suggestion to improve quantitative training was to relate theoretical and statistical modeling to applied ecological problems. Improving quantitative training will require dedicated, quantitative classes for ecology-related degrees that contain good mathematical and statistical practice.
Supplemental Information
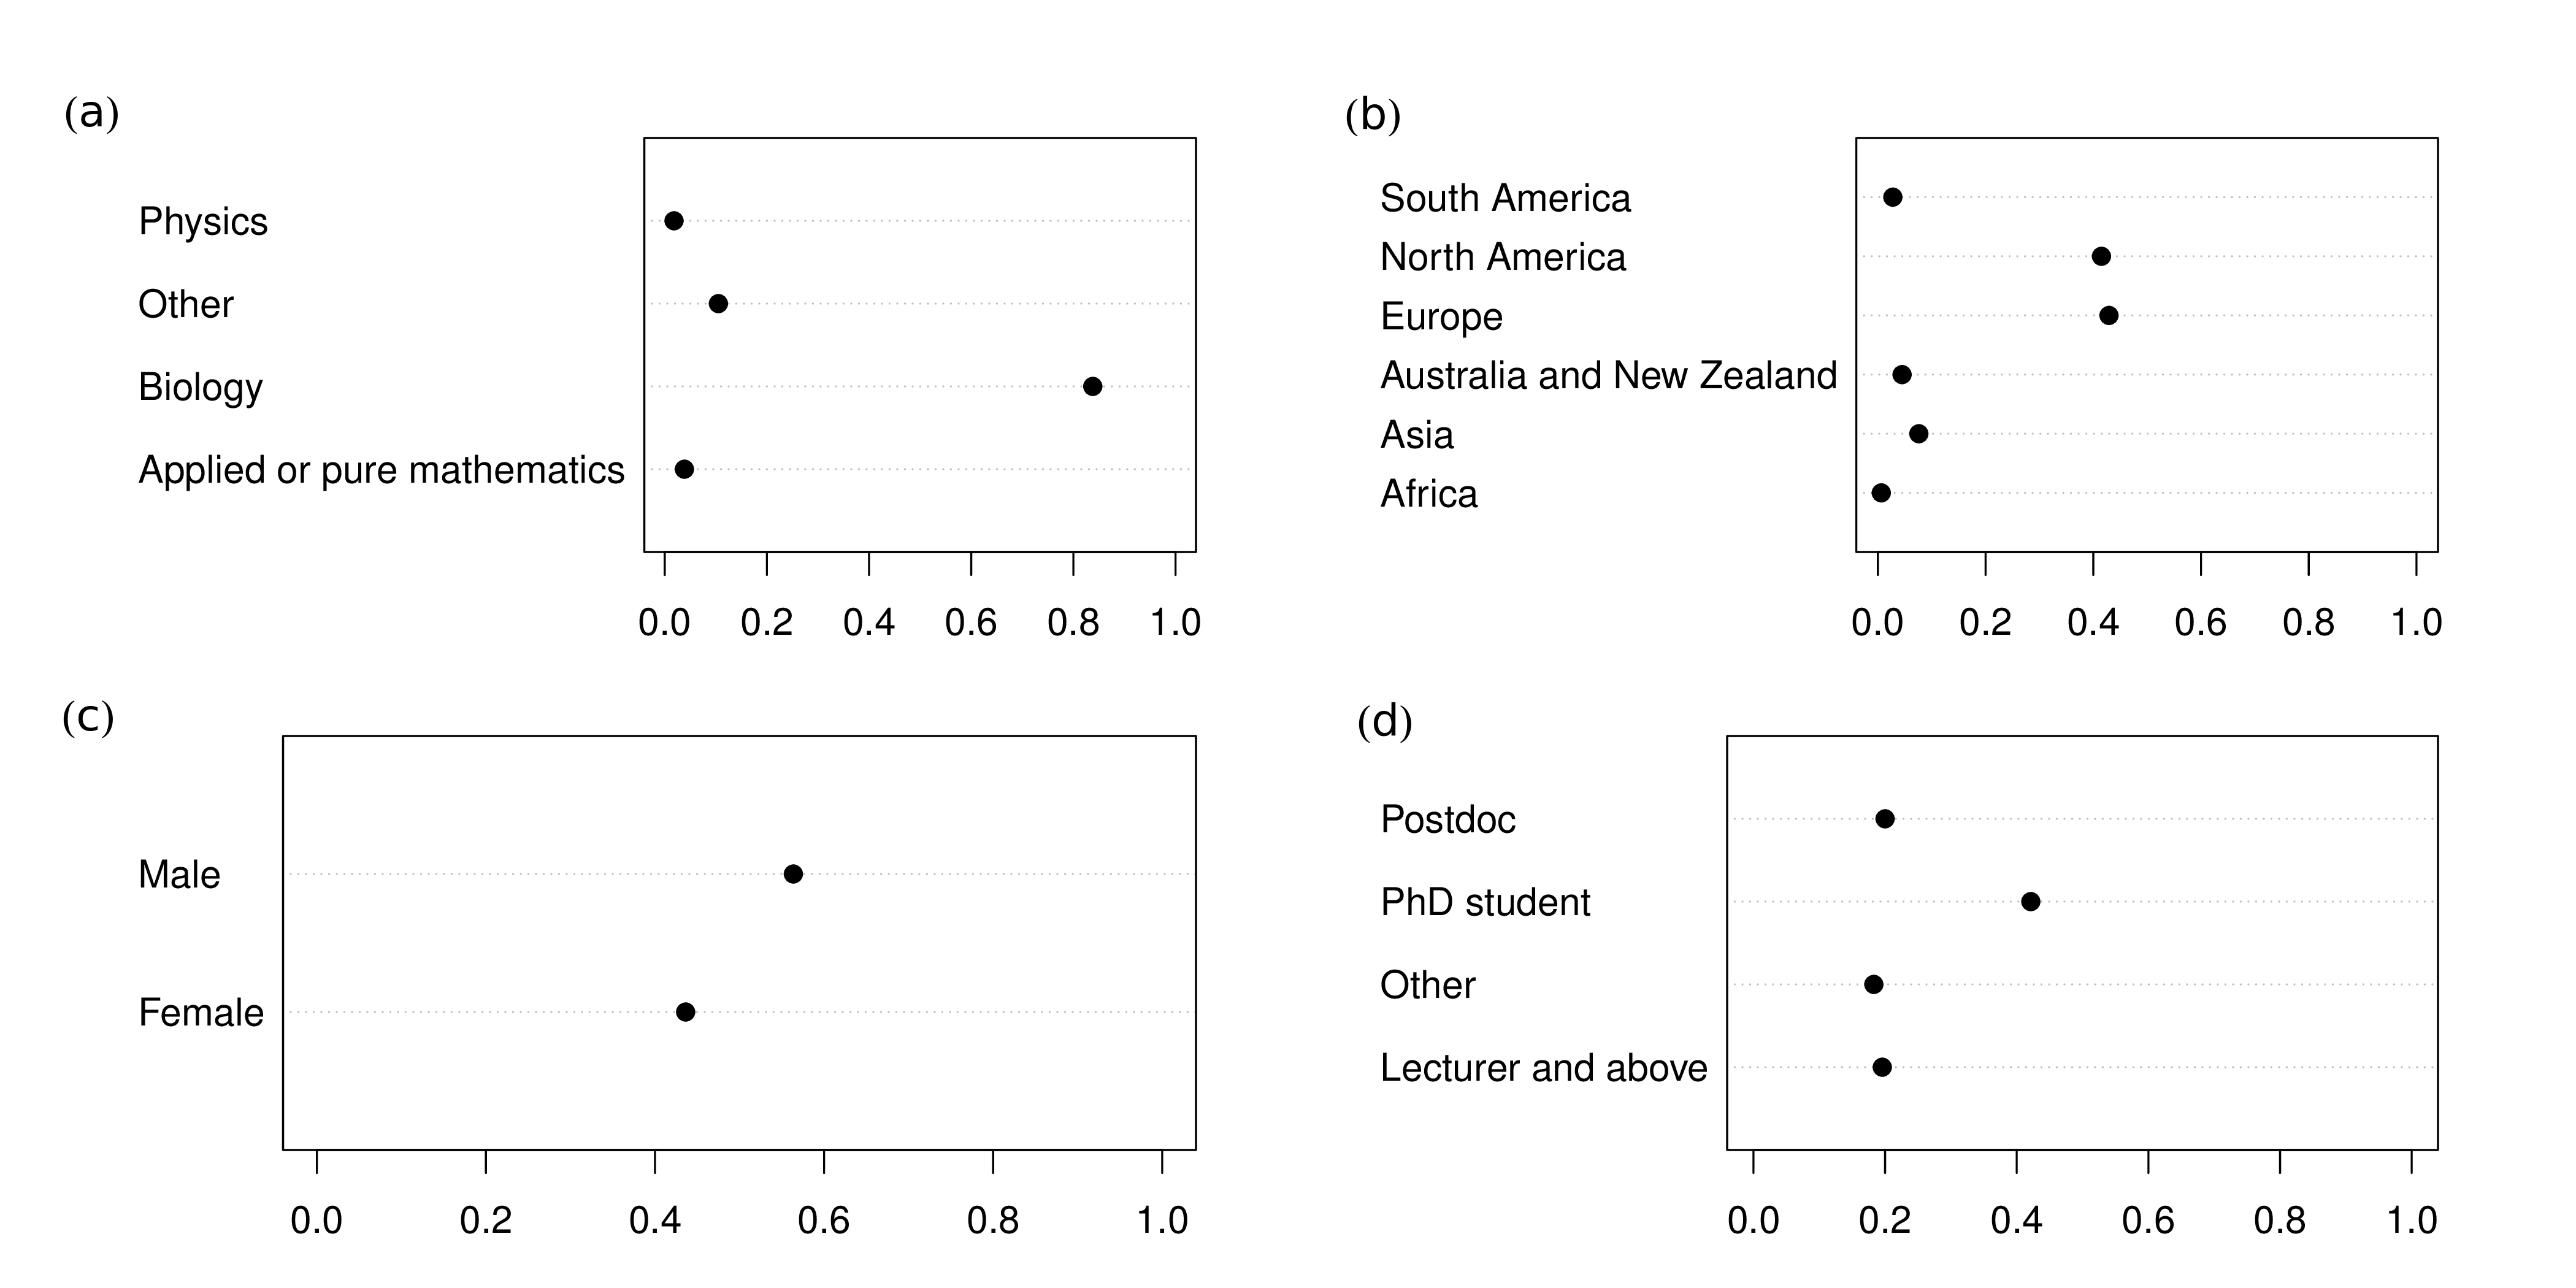
Figure 1 - Survey composition
Partitioning of the respondents with respect to (a) background (i.e. discipline of undergraduate studies), (b) geographic origin, (c) gender, and (d) employment status/level.
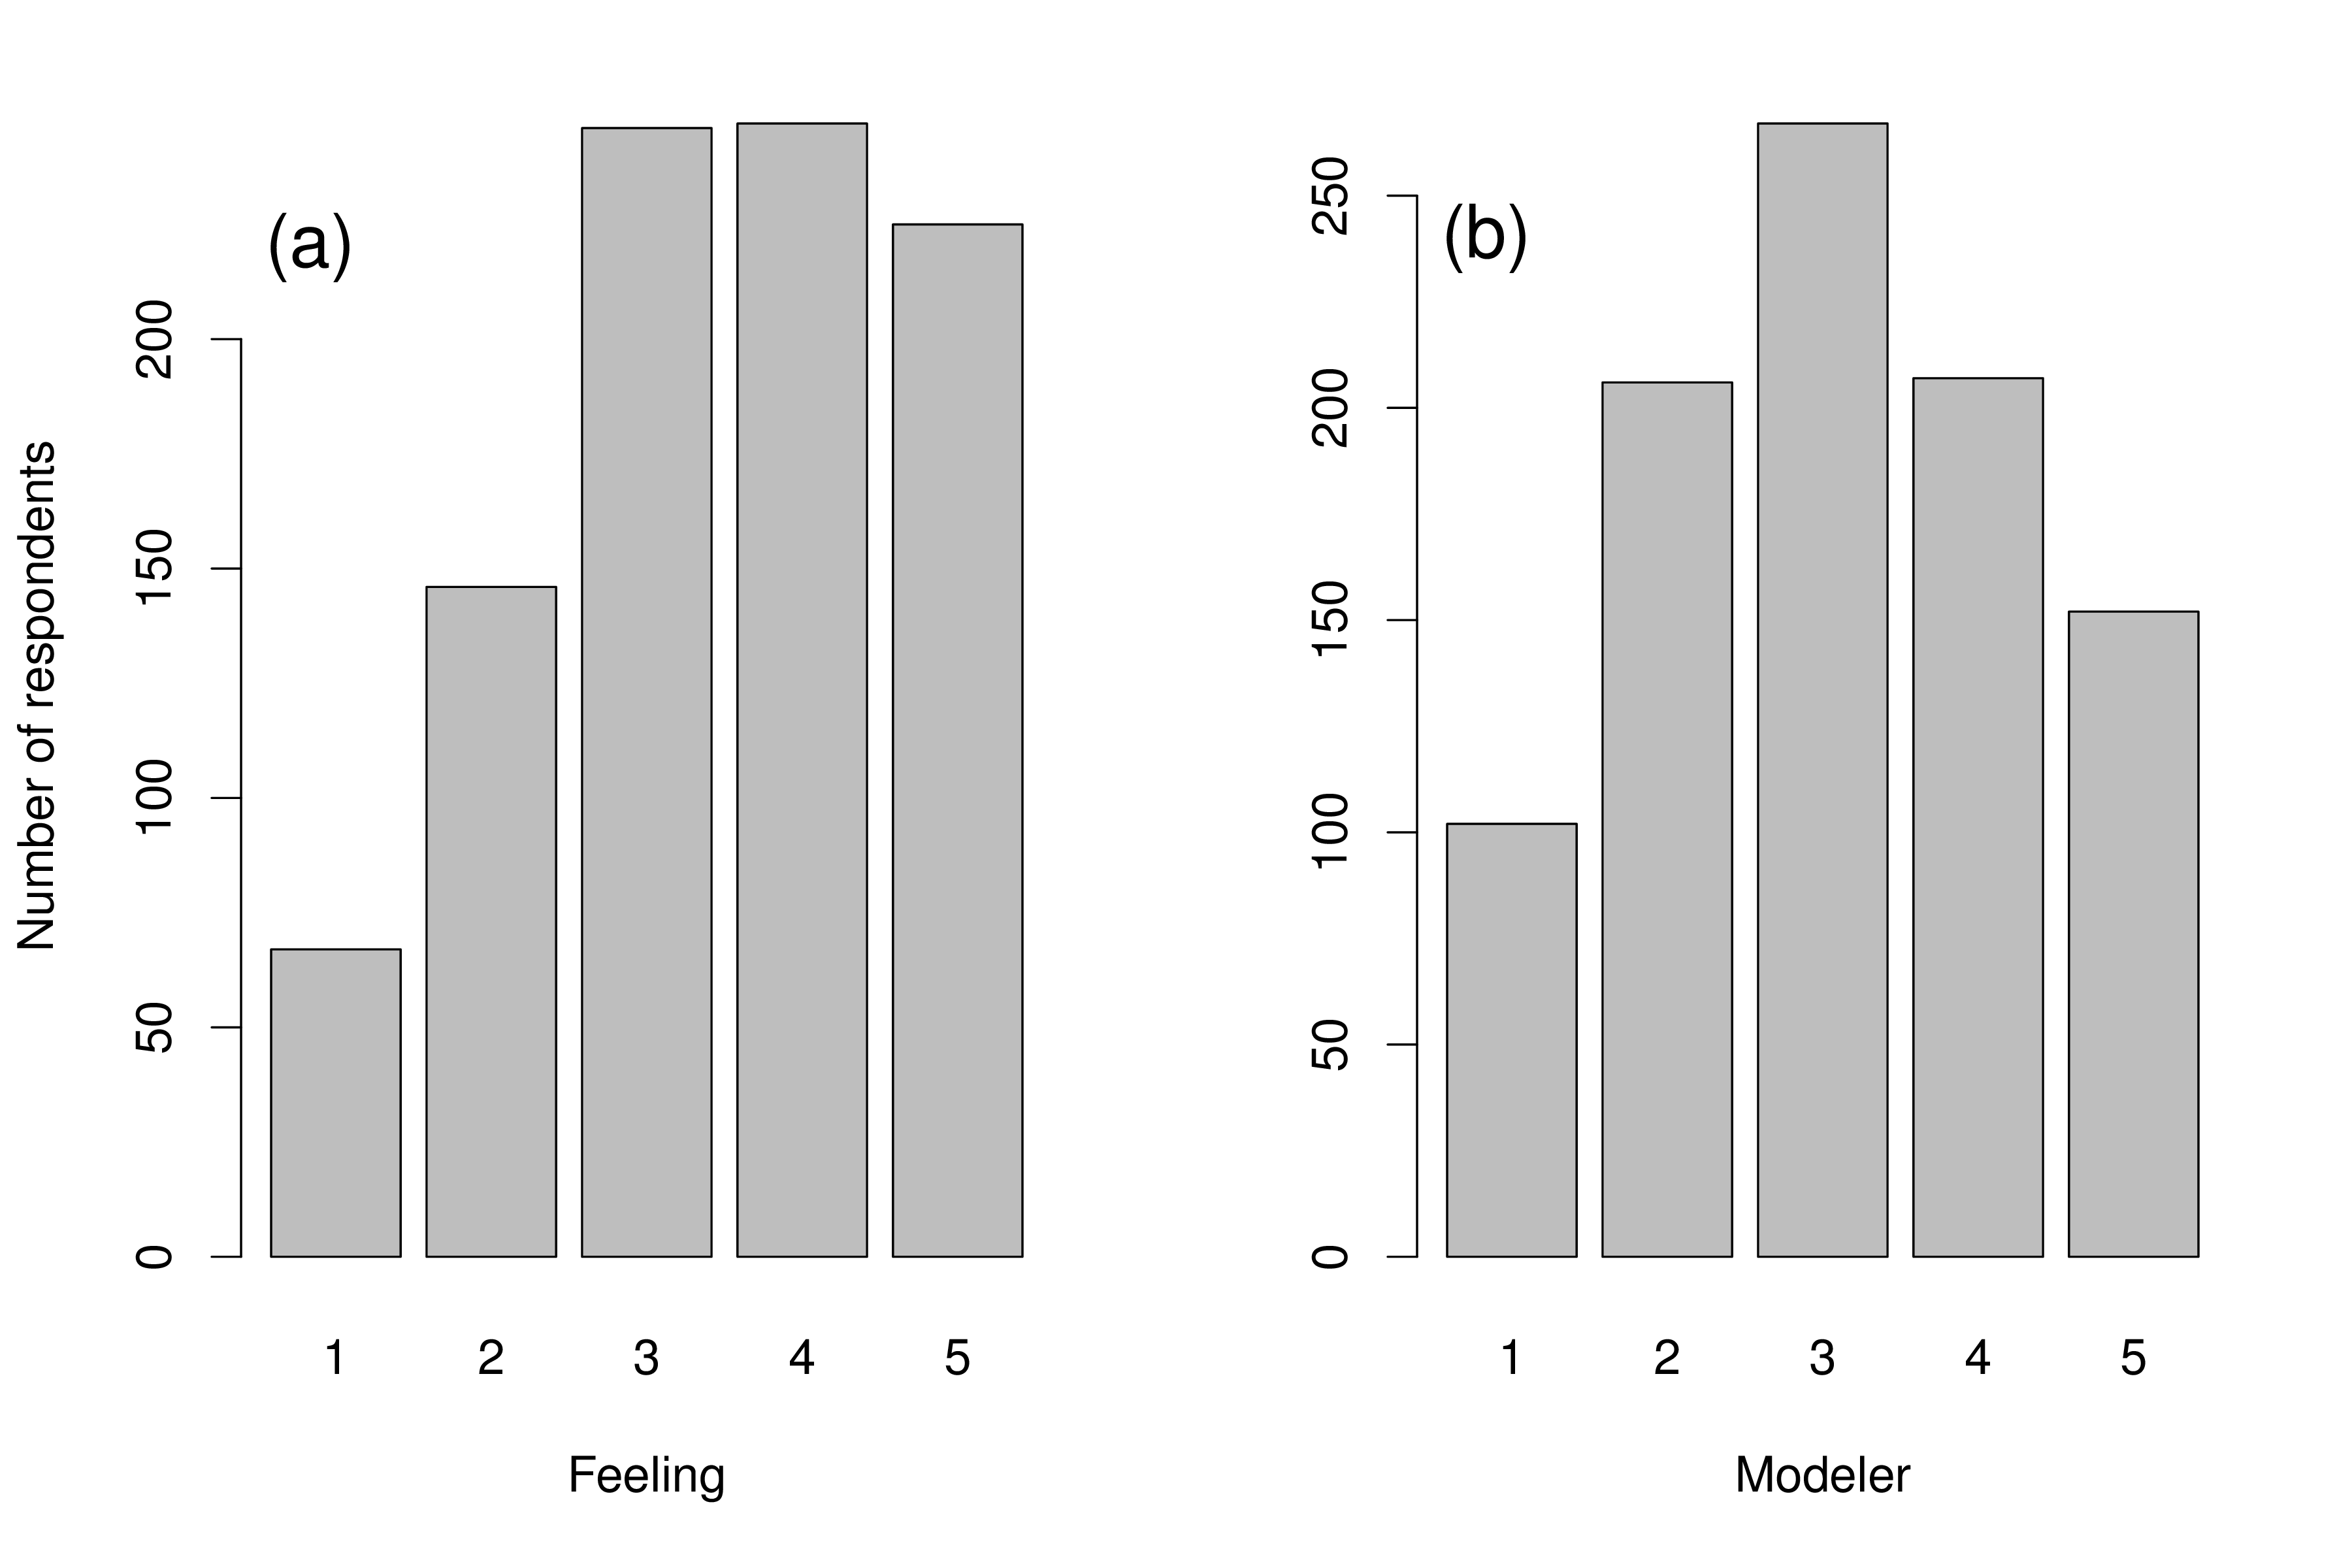
Figure 2 - Distribution of variables quantifying attitudes towards mathematics
(a) Distribution of “Feeling” variable (from 1:”really dislike” mathematics to 5:”really like”) and (b) Distribution of “Modeler” variable (1:”do not model” to 5:”specialist modeler”). See Fig. S2 for correlation between these two variables.
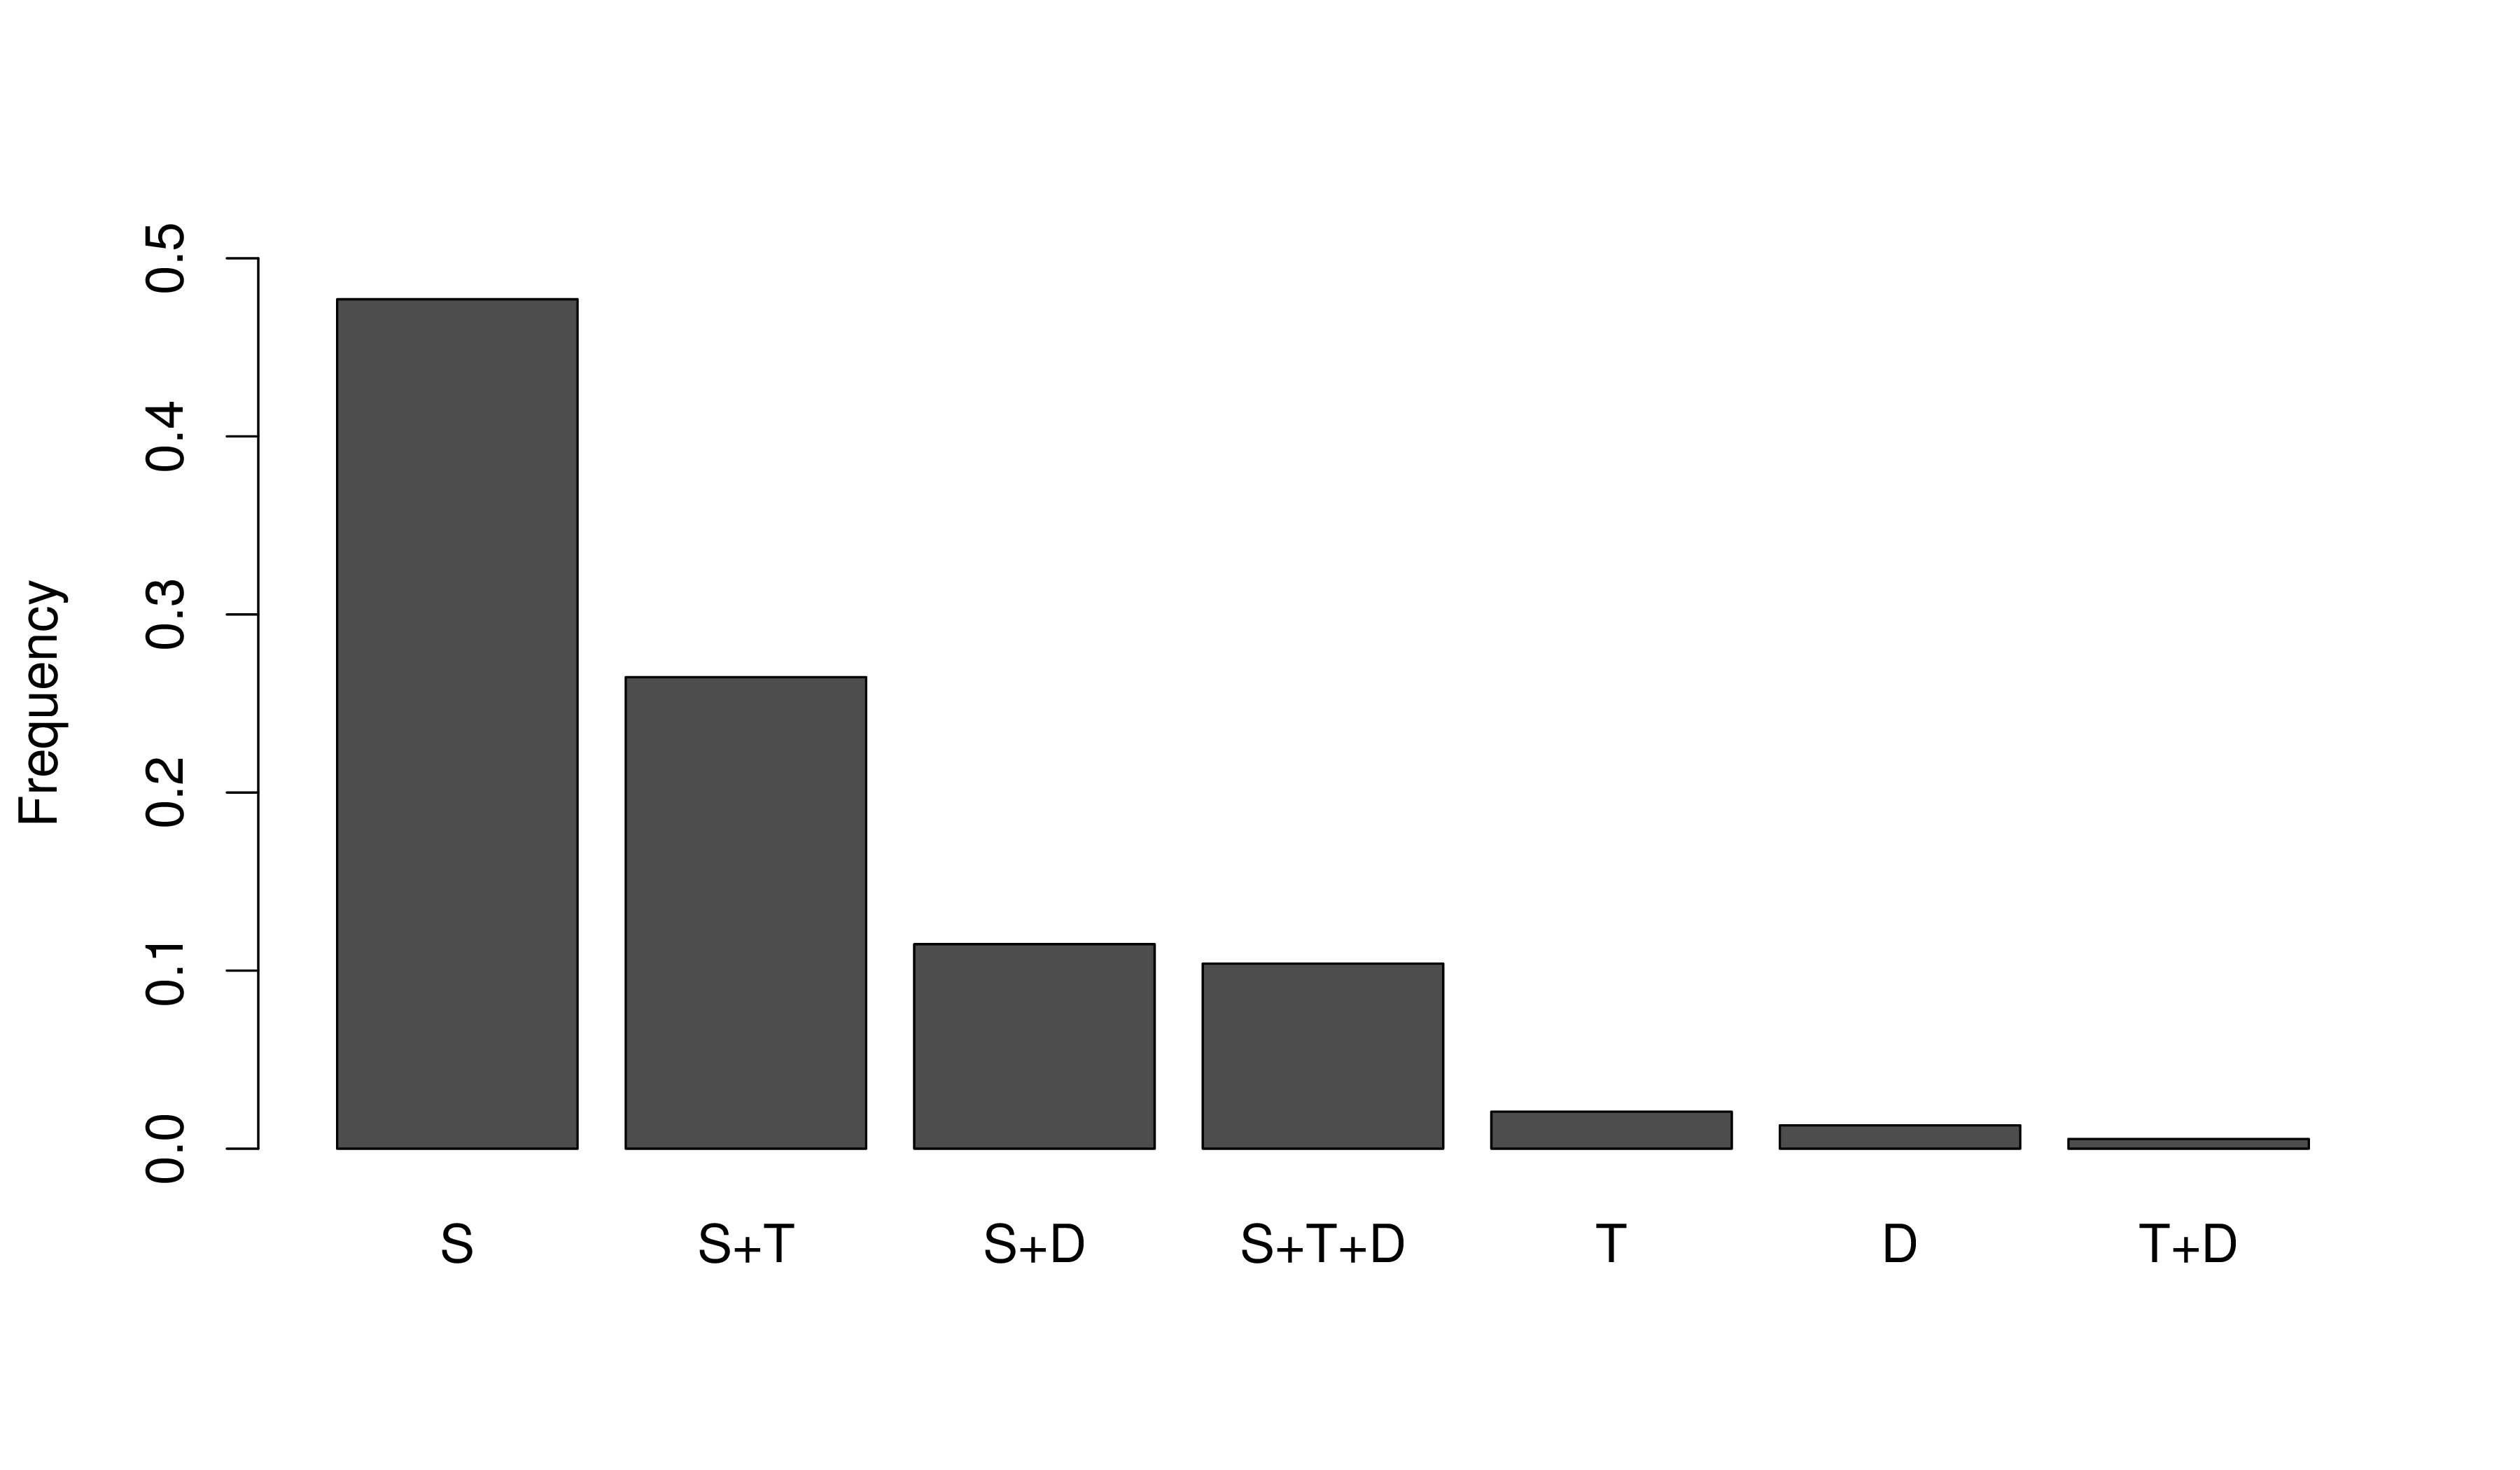
Figure 3 - Relative frequency of the uses of mathematics and association between categories.
Most respondents use mathematics primarily for statistics (S), and some other for statistics+theory (S+T, 26%), and the remaining 11% for statistics+decision making (S+D) and 10% for statistics+theory+decision making (S+T+D). Pure theoreticians (T) are therefore negligible in the sample.
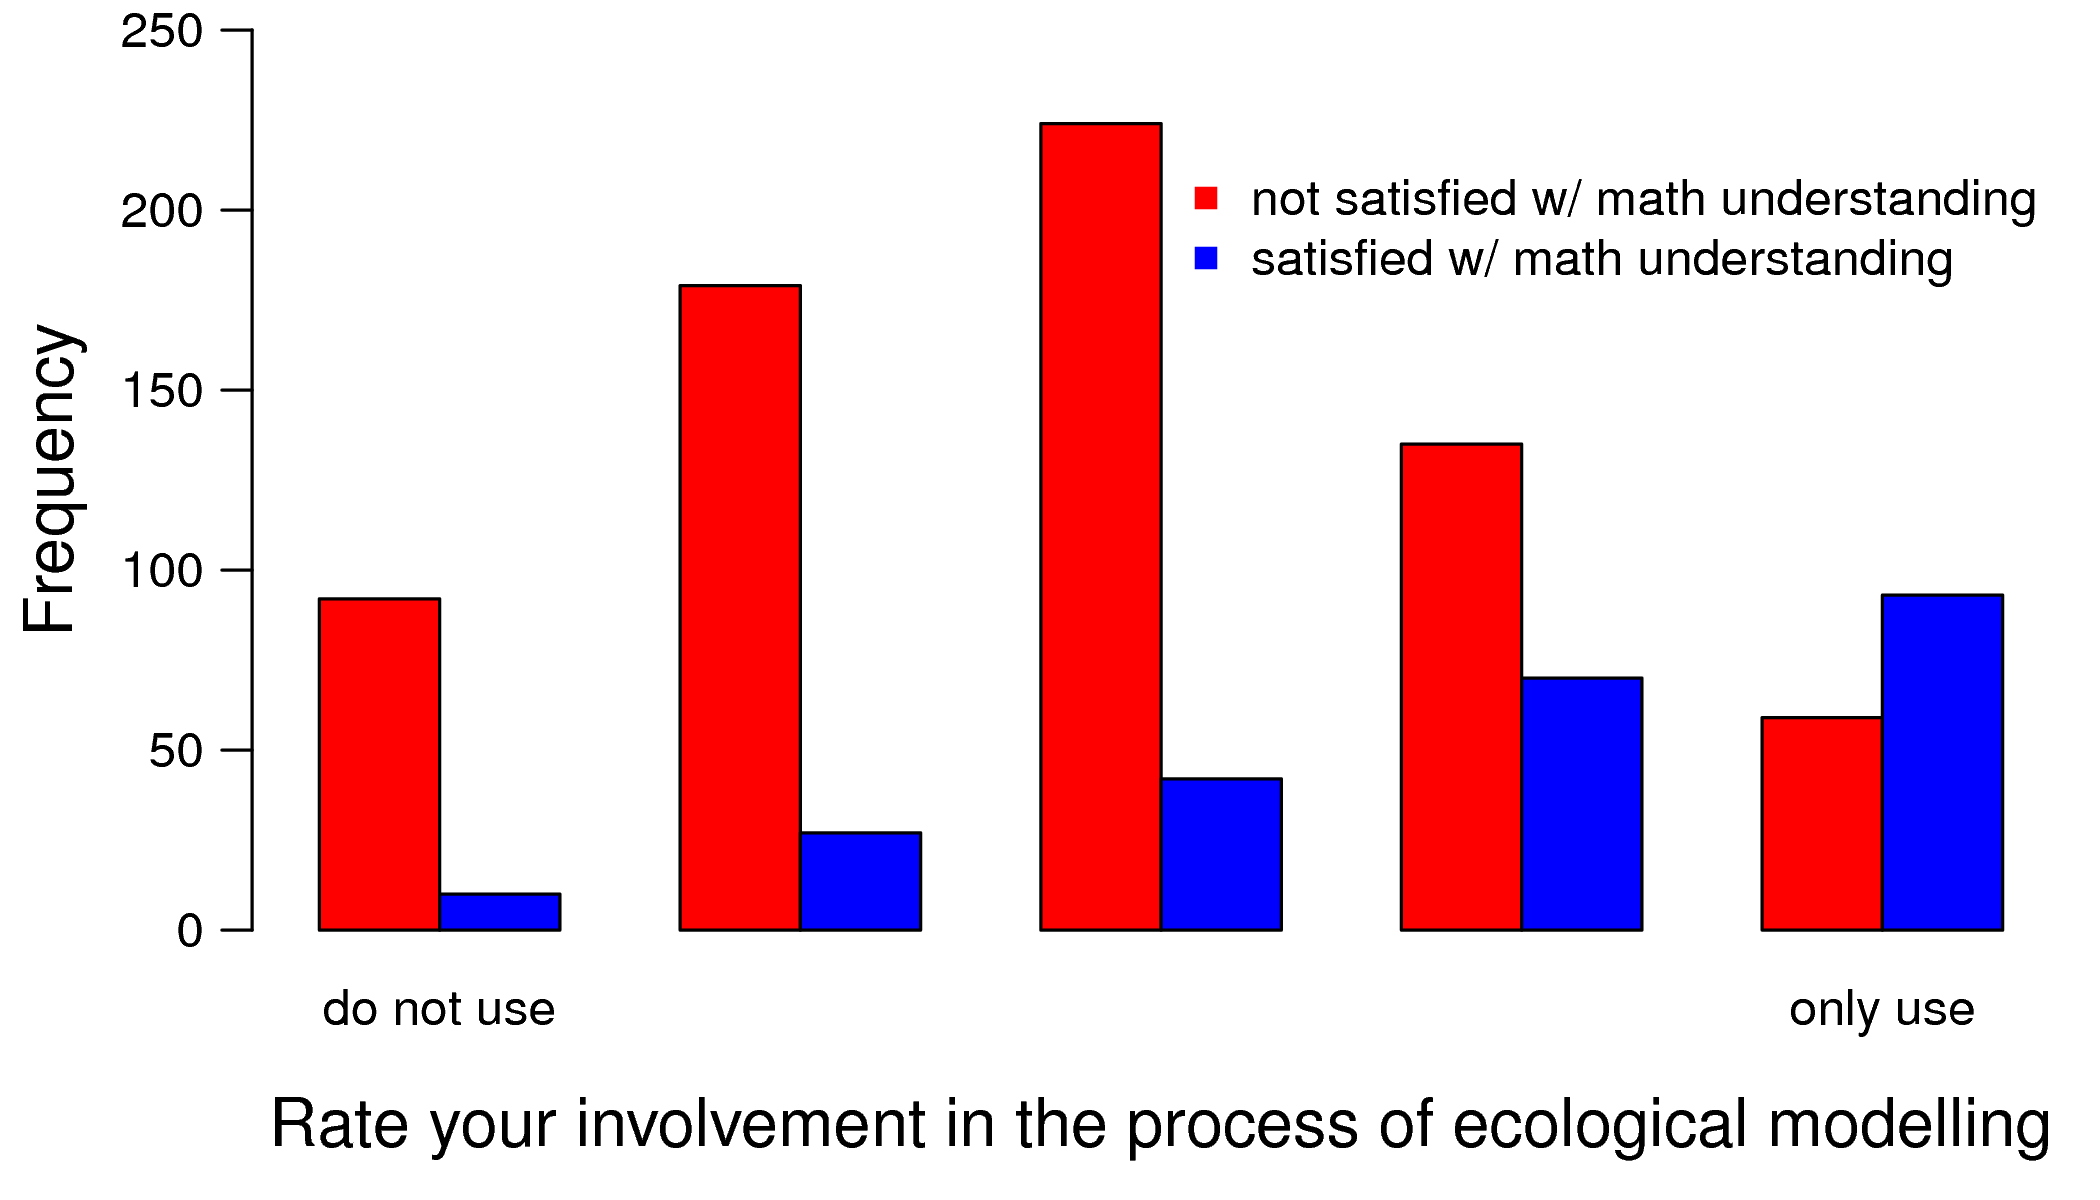
Figure 4 - Importance of involvement in modeling on the understanding of mathematical models.
The "Modeler” score goes from 1 (do not use models, on the left) to 5 (only use models, on the right). Red color is associated to dissatisfaction with mathematical understanding and blue satisfaction.
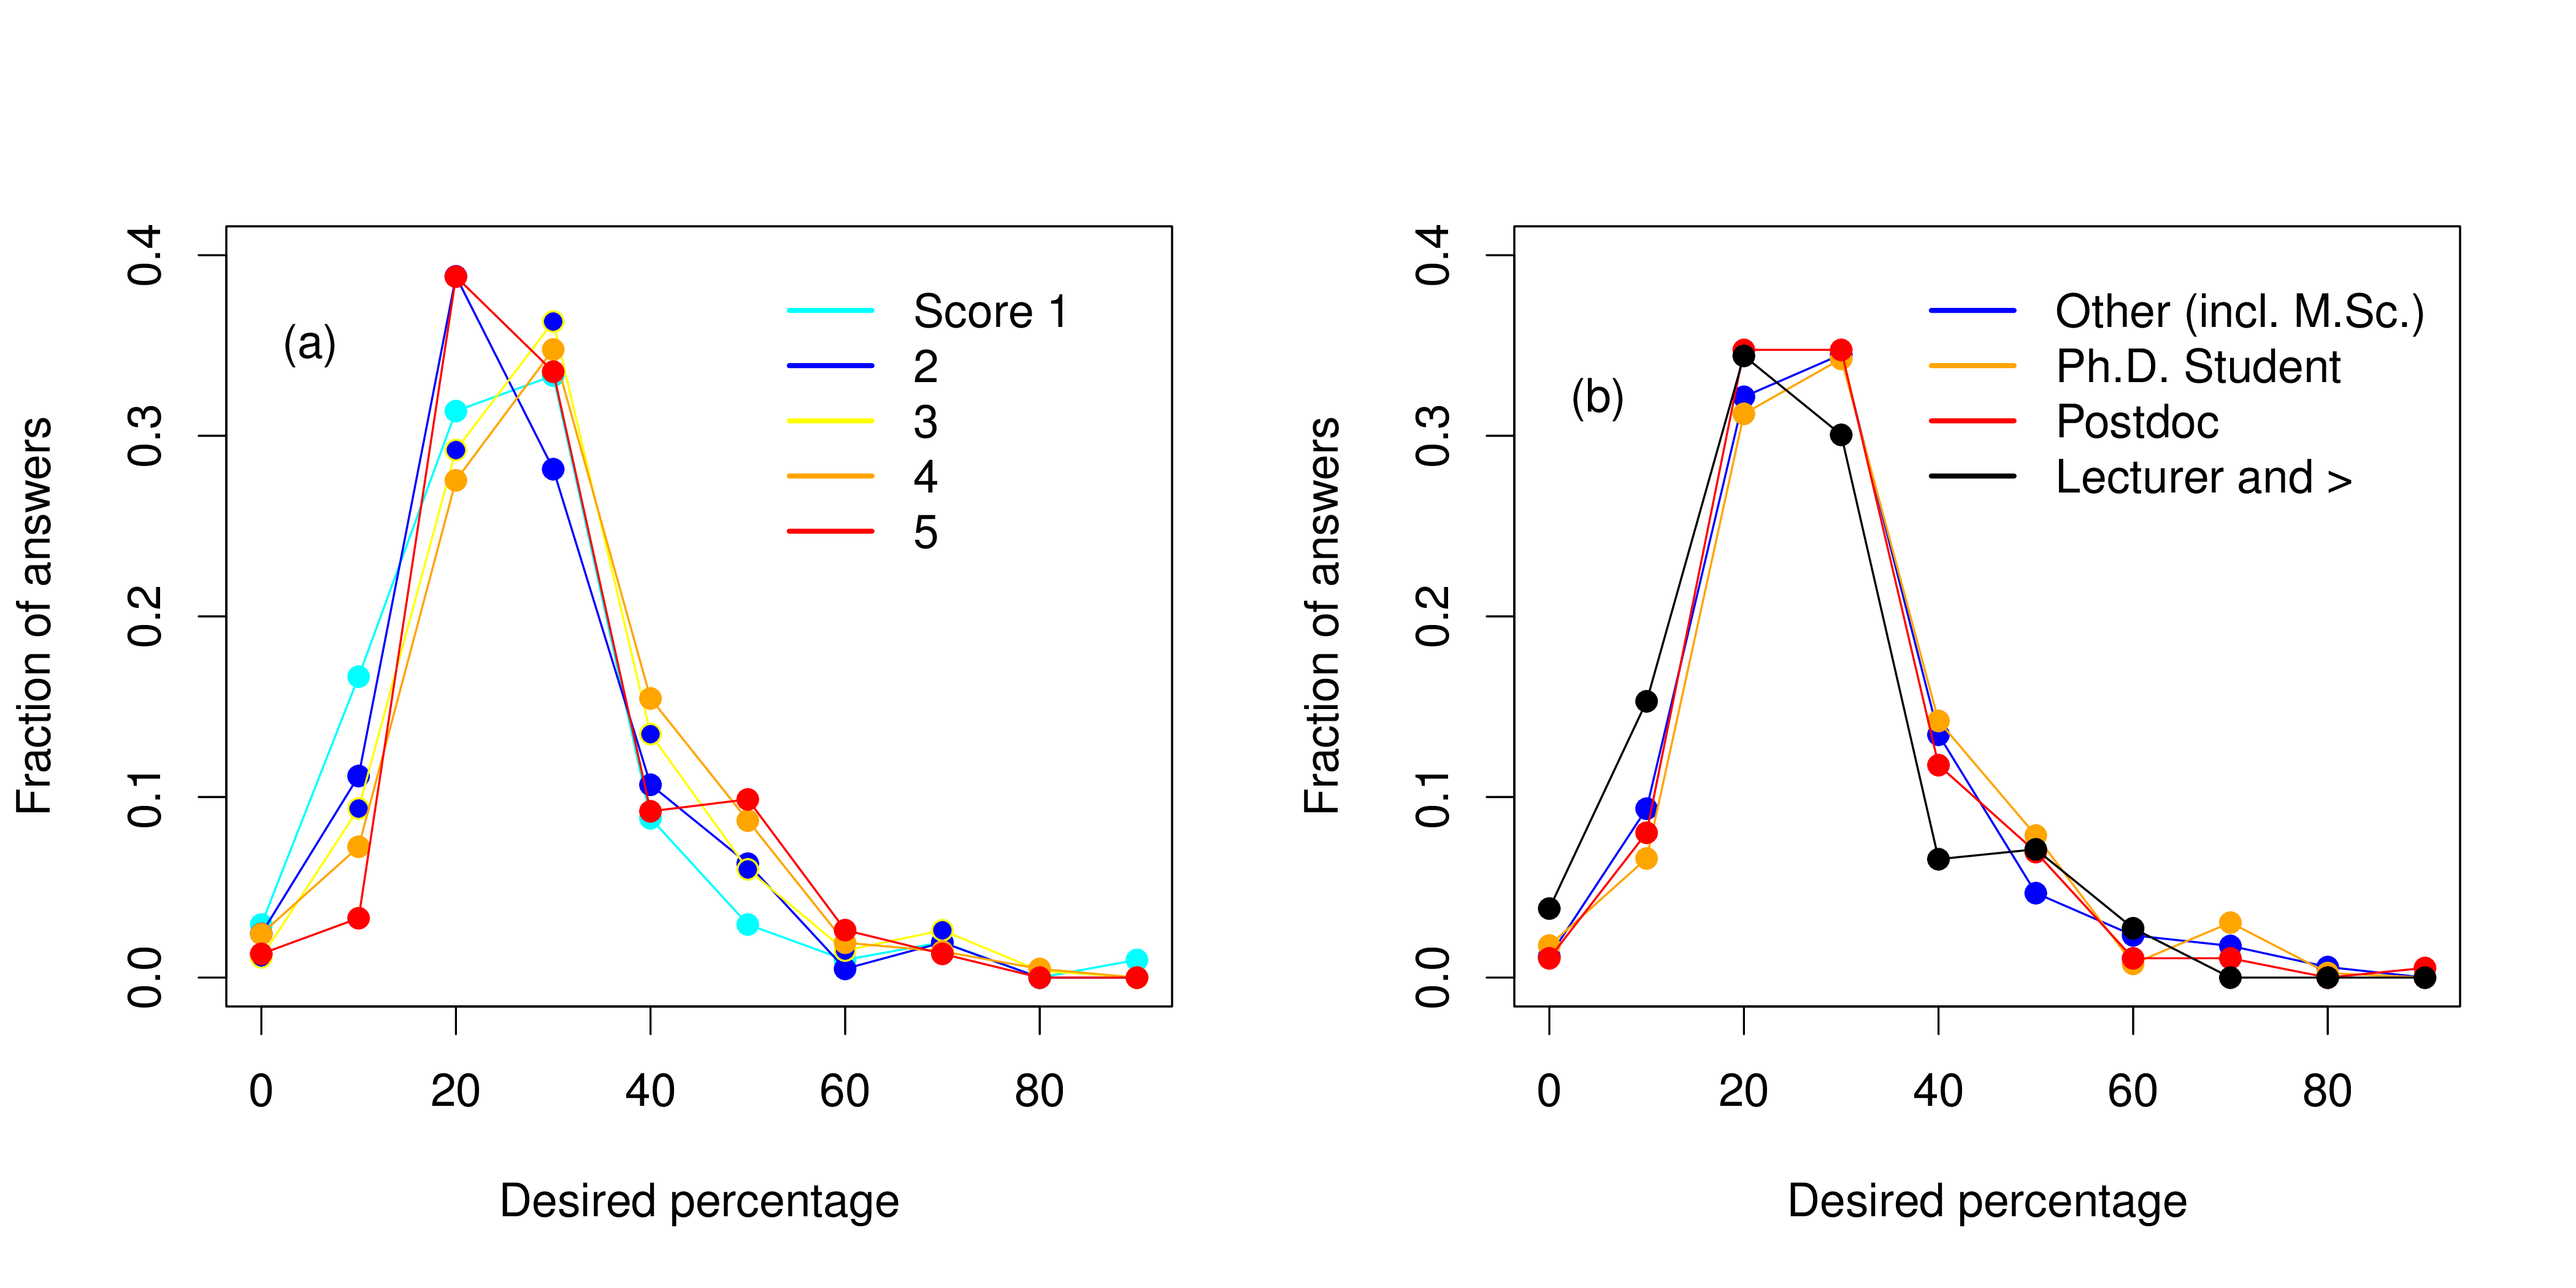
Figure 5 - Frequency distribution of the desired percentage of mathematics, statistics and programming (in the ecological curriculum).
(a): with respect to involvement in modeling (“Modeler” score, 1: no modeling to 5:specialist); (b): with respect to status / employment level.
Supplementary Information
Appendix 1 (questionnaire) and Supplementary Figures S1 to S5