Visual Analytics in healthcare education: Exploring novel ways to analyze and represent big data in undergraduate medical education
- Published
- Accepted
- Subject Areas
- Science and Medical Education, Human-Computer Interaction, Computational Science
- Keywords
- Visual Analytics, Big Data, Medical education, Data Analysis, Curriculum Mapping, Information Visualization, Medical Informatics
- Copyright
- © 2014 Vaitsis et al.
- Licence
- This is an open access article distributed under the terms of the Creative Commons Attribution License, which permits unrestricted use, distribution, reproduction and adaptation in any medium and for any purpose provided that it is properly attributed. For attribution, the original author(s), title, publication source (PeerJ PrePrints) and either DOI or URL of the article must be cited.
- Cite this article
- 2014. Visual Analytics in healthcare education: Exploring novel ways to analyze and represent big data in undergraduate medical education. PeerJ PrePrints 2:e456v1 https://doi.org/10.7287/peerj.preprints.456v1
Abstract
Big data in undergraduate medical education that consist the medical curriculum are beyond human abilities to be perceived and analyzed. The medical curriculum is the main tool used by teachers and directors to plan, design and deliver teaching activities, assessment methods and student evaluation in medical education in a continuous effort to improve it. It remains unexploited mainly for medical education improvement purposes. The emerging research field of Visual Analytics has the advantage to combine data analysis and manipulation techniques, information and knowledge representation, and human cognitive strength to perceive and recognize visual patterns. Nevertheless, there is lack of findings reporting use and benefits of Visual Analytics in medical education.
We analyzed data from the medical curriculum of an undergraduate medical program concerning teaching activities, assessment methods and results and learning outcomes in order to explore Visual Analytics as a tool for finding ways of representing big data from undergraduate medical education for improvement purposes. We used Cytoscape to build networks of the identified aspects and visualize them.
The analysis and visualization of the identified aspects resulted in building an abstract model of the examined data from the curriculum presented in three different variants; (i) learning outcomes and teaching methods, (ii) examination and learning outcomes and (iii) teaching methods, learning outcomes, examination results and gap analysis
This study identified aspects of medical curriculum. The implementation of VA revealed three novel ways of representing big data from undergraduate medical education. It seems to be a useful tool to explore such data and may have future implications on healthcare education. It also opens a new direction in medical informatics research.
Author Comment
This is a submission to PeerJ for review.
Supplemental Information
Teaching methods
Fig. S1 - Teaching methods and learning outcomes (taught and non-taught) of the CM-RD course
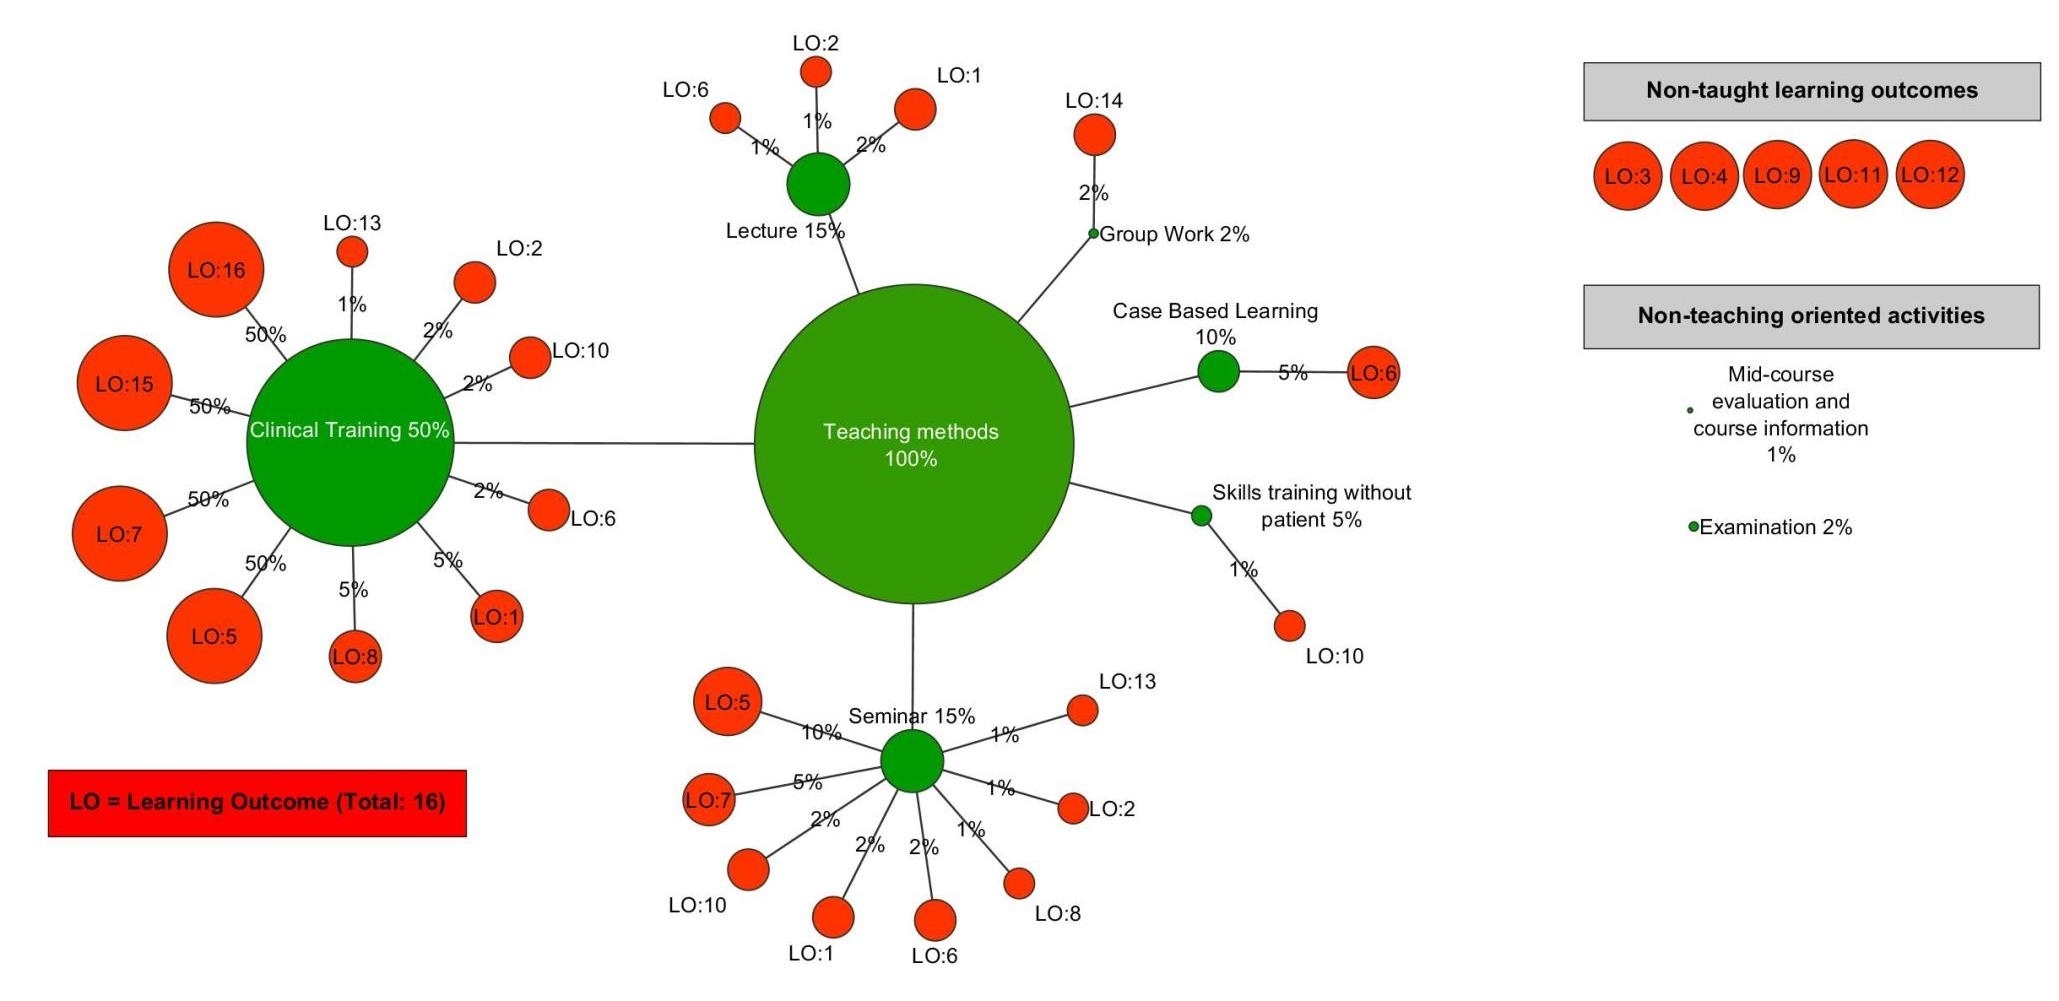
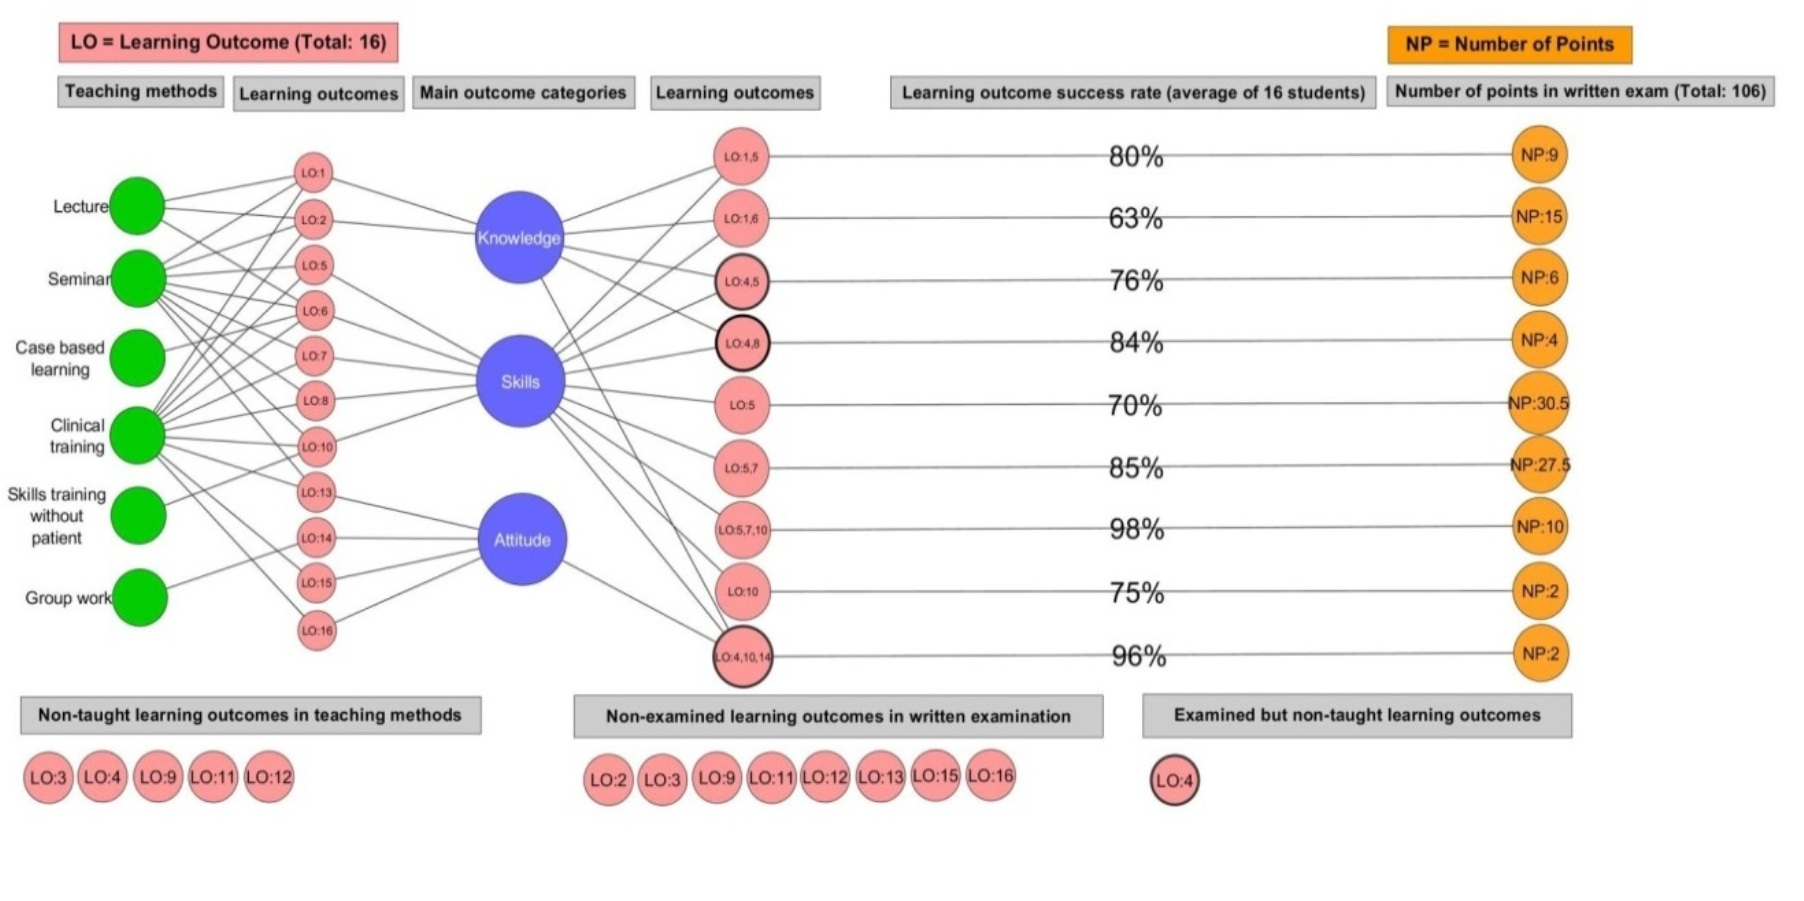
Assessment
Fig S2 - Questions in written examination, learning outcomes (assessed and non-assessed) and main outcomes of the CM-RD course
Constructive alignment
Fig S3 -Constructive alignment and gap analysis of the CM-RD course
Appendix S4
Appendix S4 - Description of the sixteen learning outcomes and main outcome categories they belong