Evaluating the adaptive evolutionary convergence of carnivorous plant taxa through functional genomics
- Published
- Accepted
- Subject Areas
- Bioinformatics, Evolutionary Studies, Genomics, Plant Science
- Keywords
- Carnivorous Plants, Gene Ontology, Functional Genomics, Convergent Evolution
- Copyright
- © 2018 Wheeler et al.
- Licence
- This is an open access article distributed under the terms of the Creative Commons Attribution License, which permits unrestricted use, distribution, reproduction and adaptation in any medium and for any purpose provided that it is properly attributed. For attribution, the original author(s), title, publication source (PeerJ Preprints) and either DOI or URL of the article must be cited.
- Cite this article
- 2018. Evaluating the adaptive evolutionary convergence of carnivorous plant taxa through functional genomics. PeerJ Preprints 6:e3525v1 https://doi.org/10.7287/peerj.preprints.3525v1
Abstract
Carnivorous plants are striking examples of evolutionary convergence, displaying complex and often highly similar adaptations despite lack of shared ancestry. Using available carnivorous plant genomes along with non-carnivorous reference taxa, this study examines the convergence of functional overrepresentation of genes previously implicated in plant carnivory. Gene Ontology (GO) coding was used to quantitatively score functional representation in these taxa, in terms of proportion of carnivory-associated functions relative to all functional sequence. Statistical analysis revealed that, in carnivorous plants as a group, only two of the 24 functions tested showed a signal of substantial overrepresentation. However, when the four carnivorous taxa were analyzed individually, 11 functions were found to be significant in at least one taxon. Though carnivorous plants collectively may show overrepresentation in functions from the predicted set, the specific functions that are overrepresented vary substantially from taxon to taxon. While it is possible that some functions serve a similar practical purpose such that one taxon does not need to utilize both to achieve the same result, it appears that there are multiple approaches for the evolution of carnivorous function in plant genomes. Our approach could be applied to tests of functional convergence in other systems provided on the availability of genomes and annotation data for a group.
Author Comment
This is a submission to PeerJ for review.
Supplemental Information
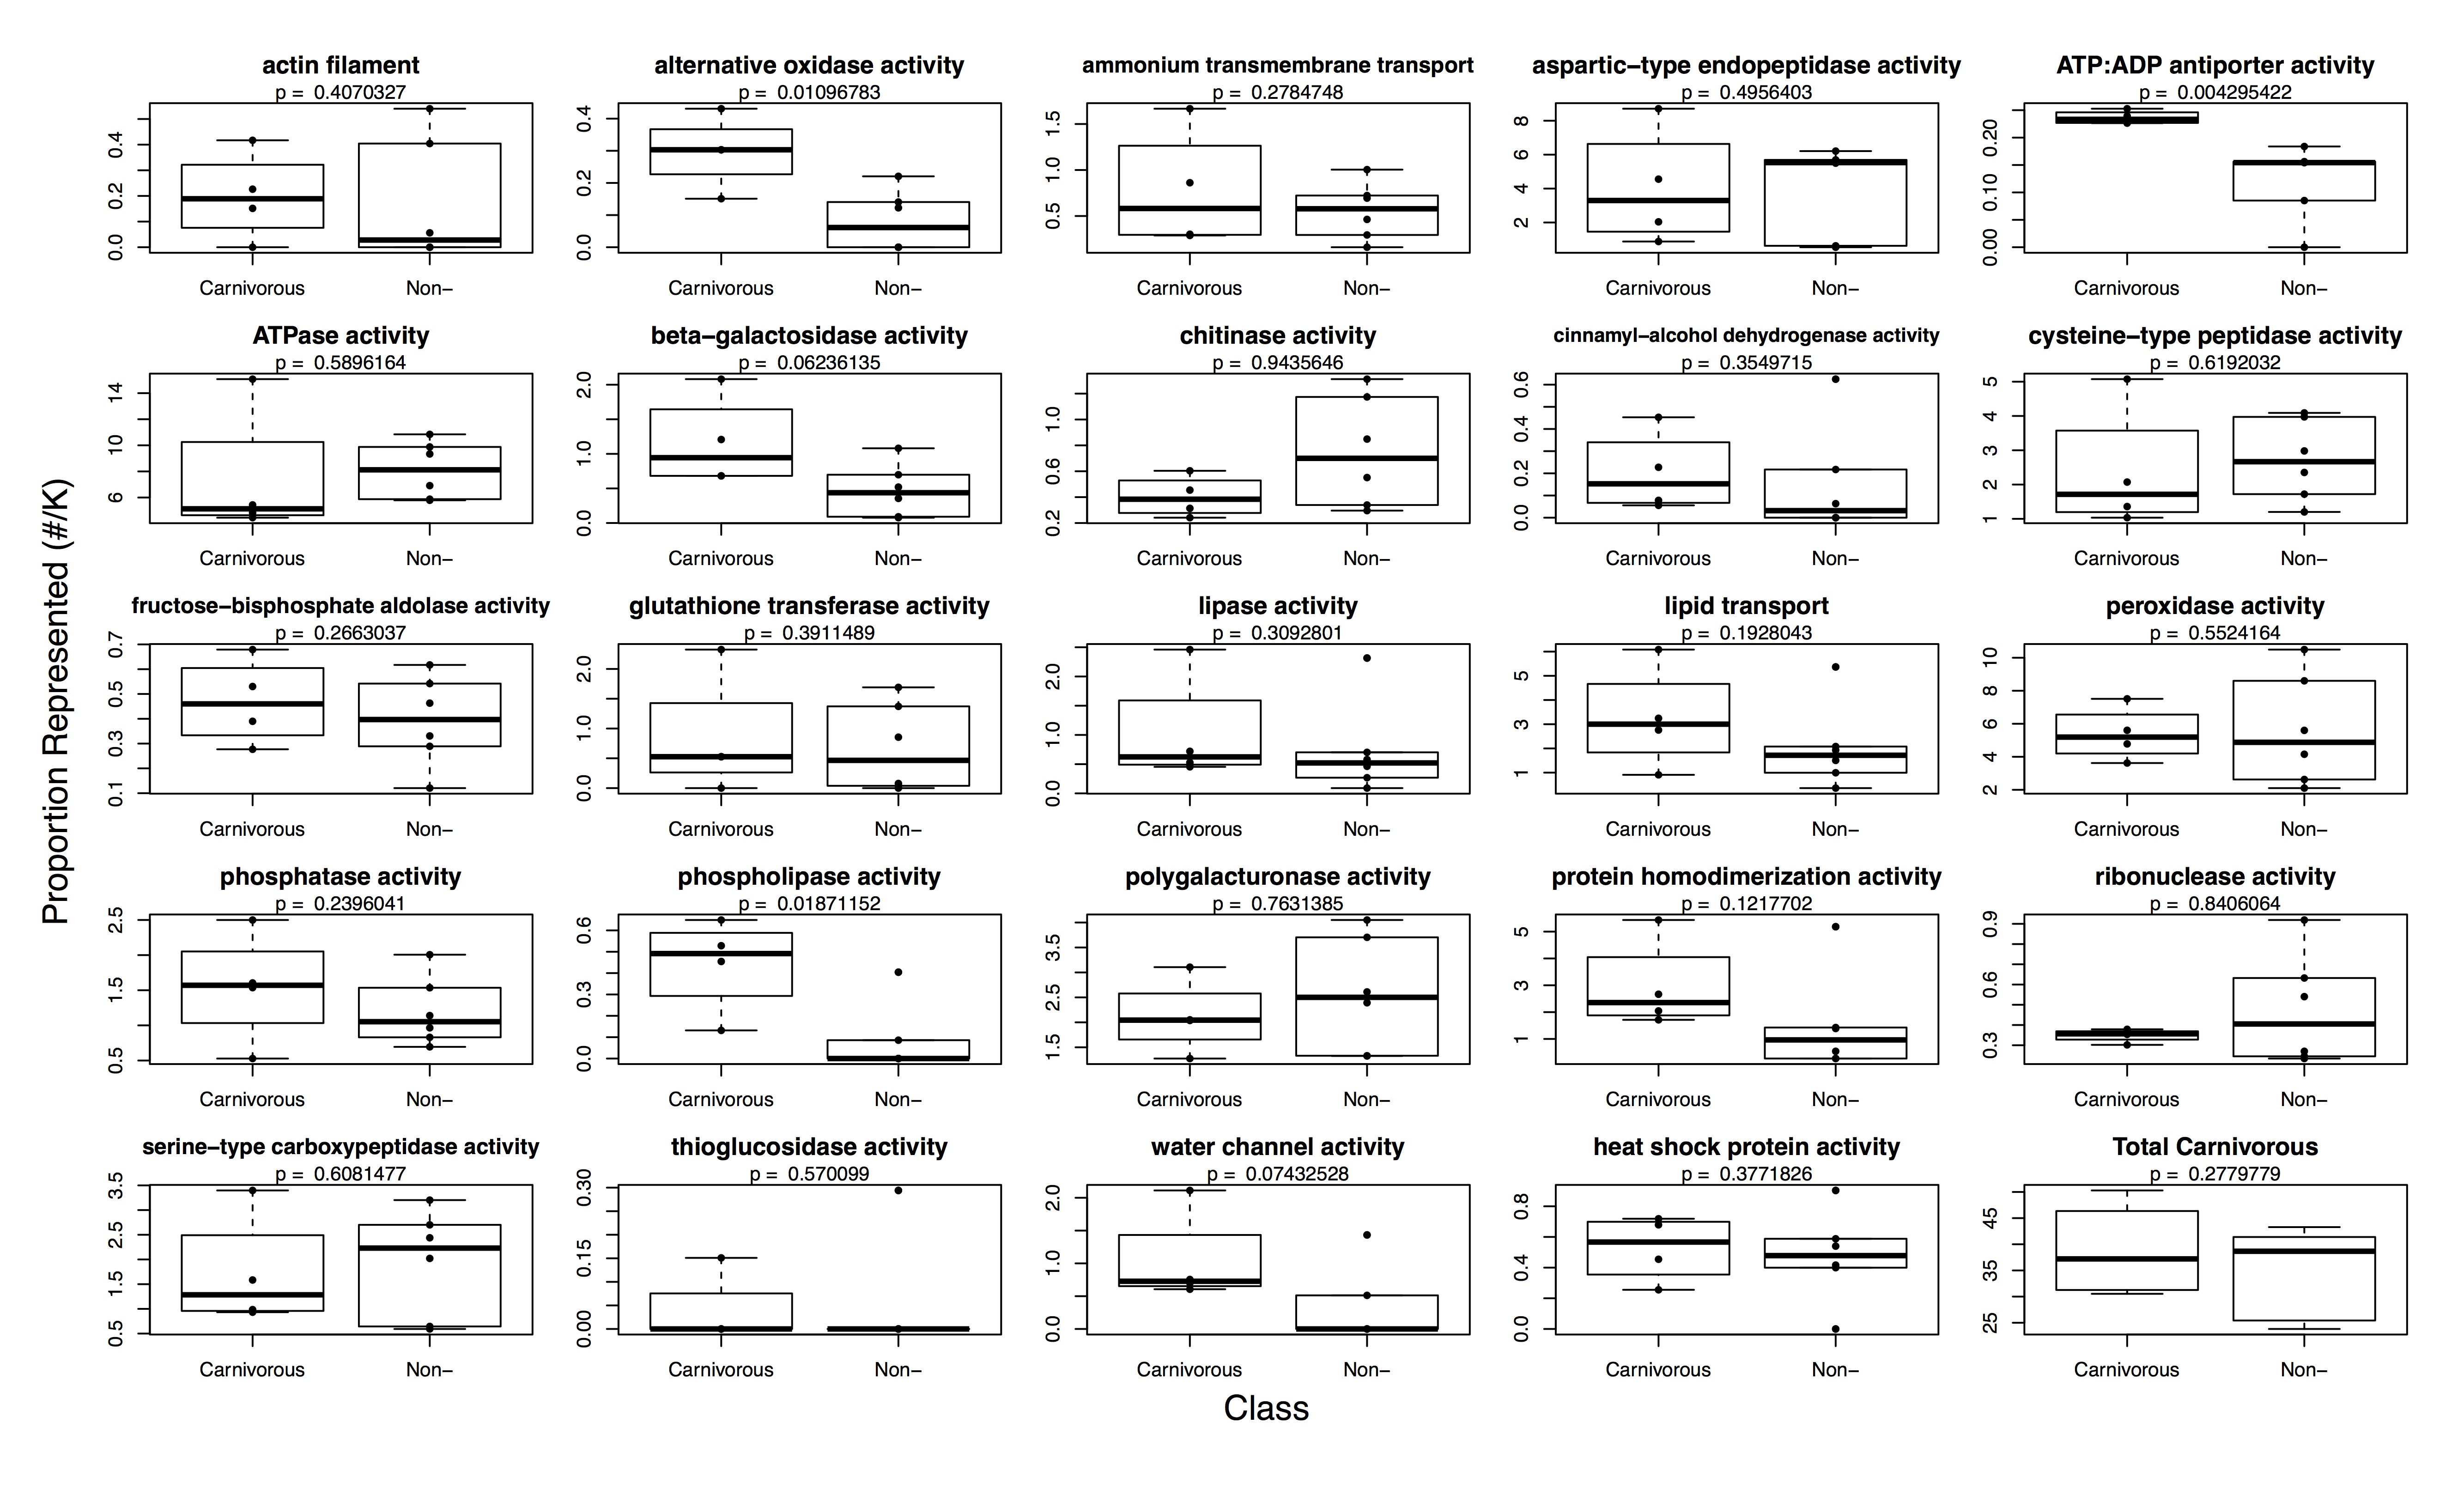
Graphical depiction of data presented in Table 3
Each boxplot depicts one of 24 comparisons between the relative proportion of a carnivory-associated function in carnivorous vs. non-carnivorous plants, plus the sum of all these functions. Dots show the position and effects of individual samples within each distribution.
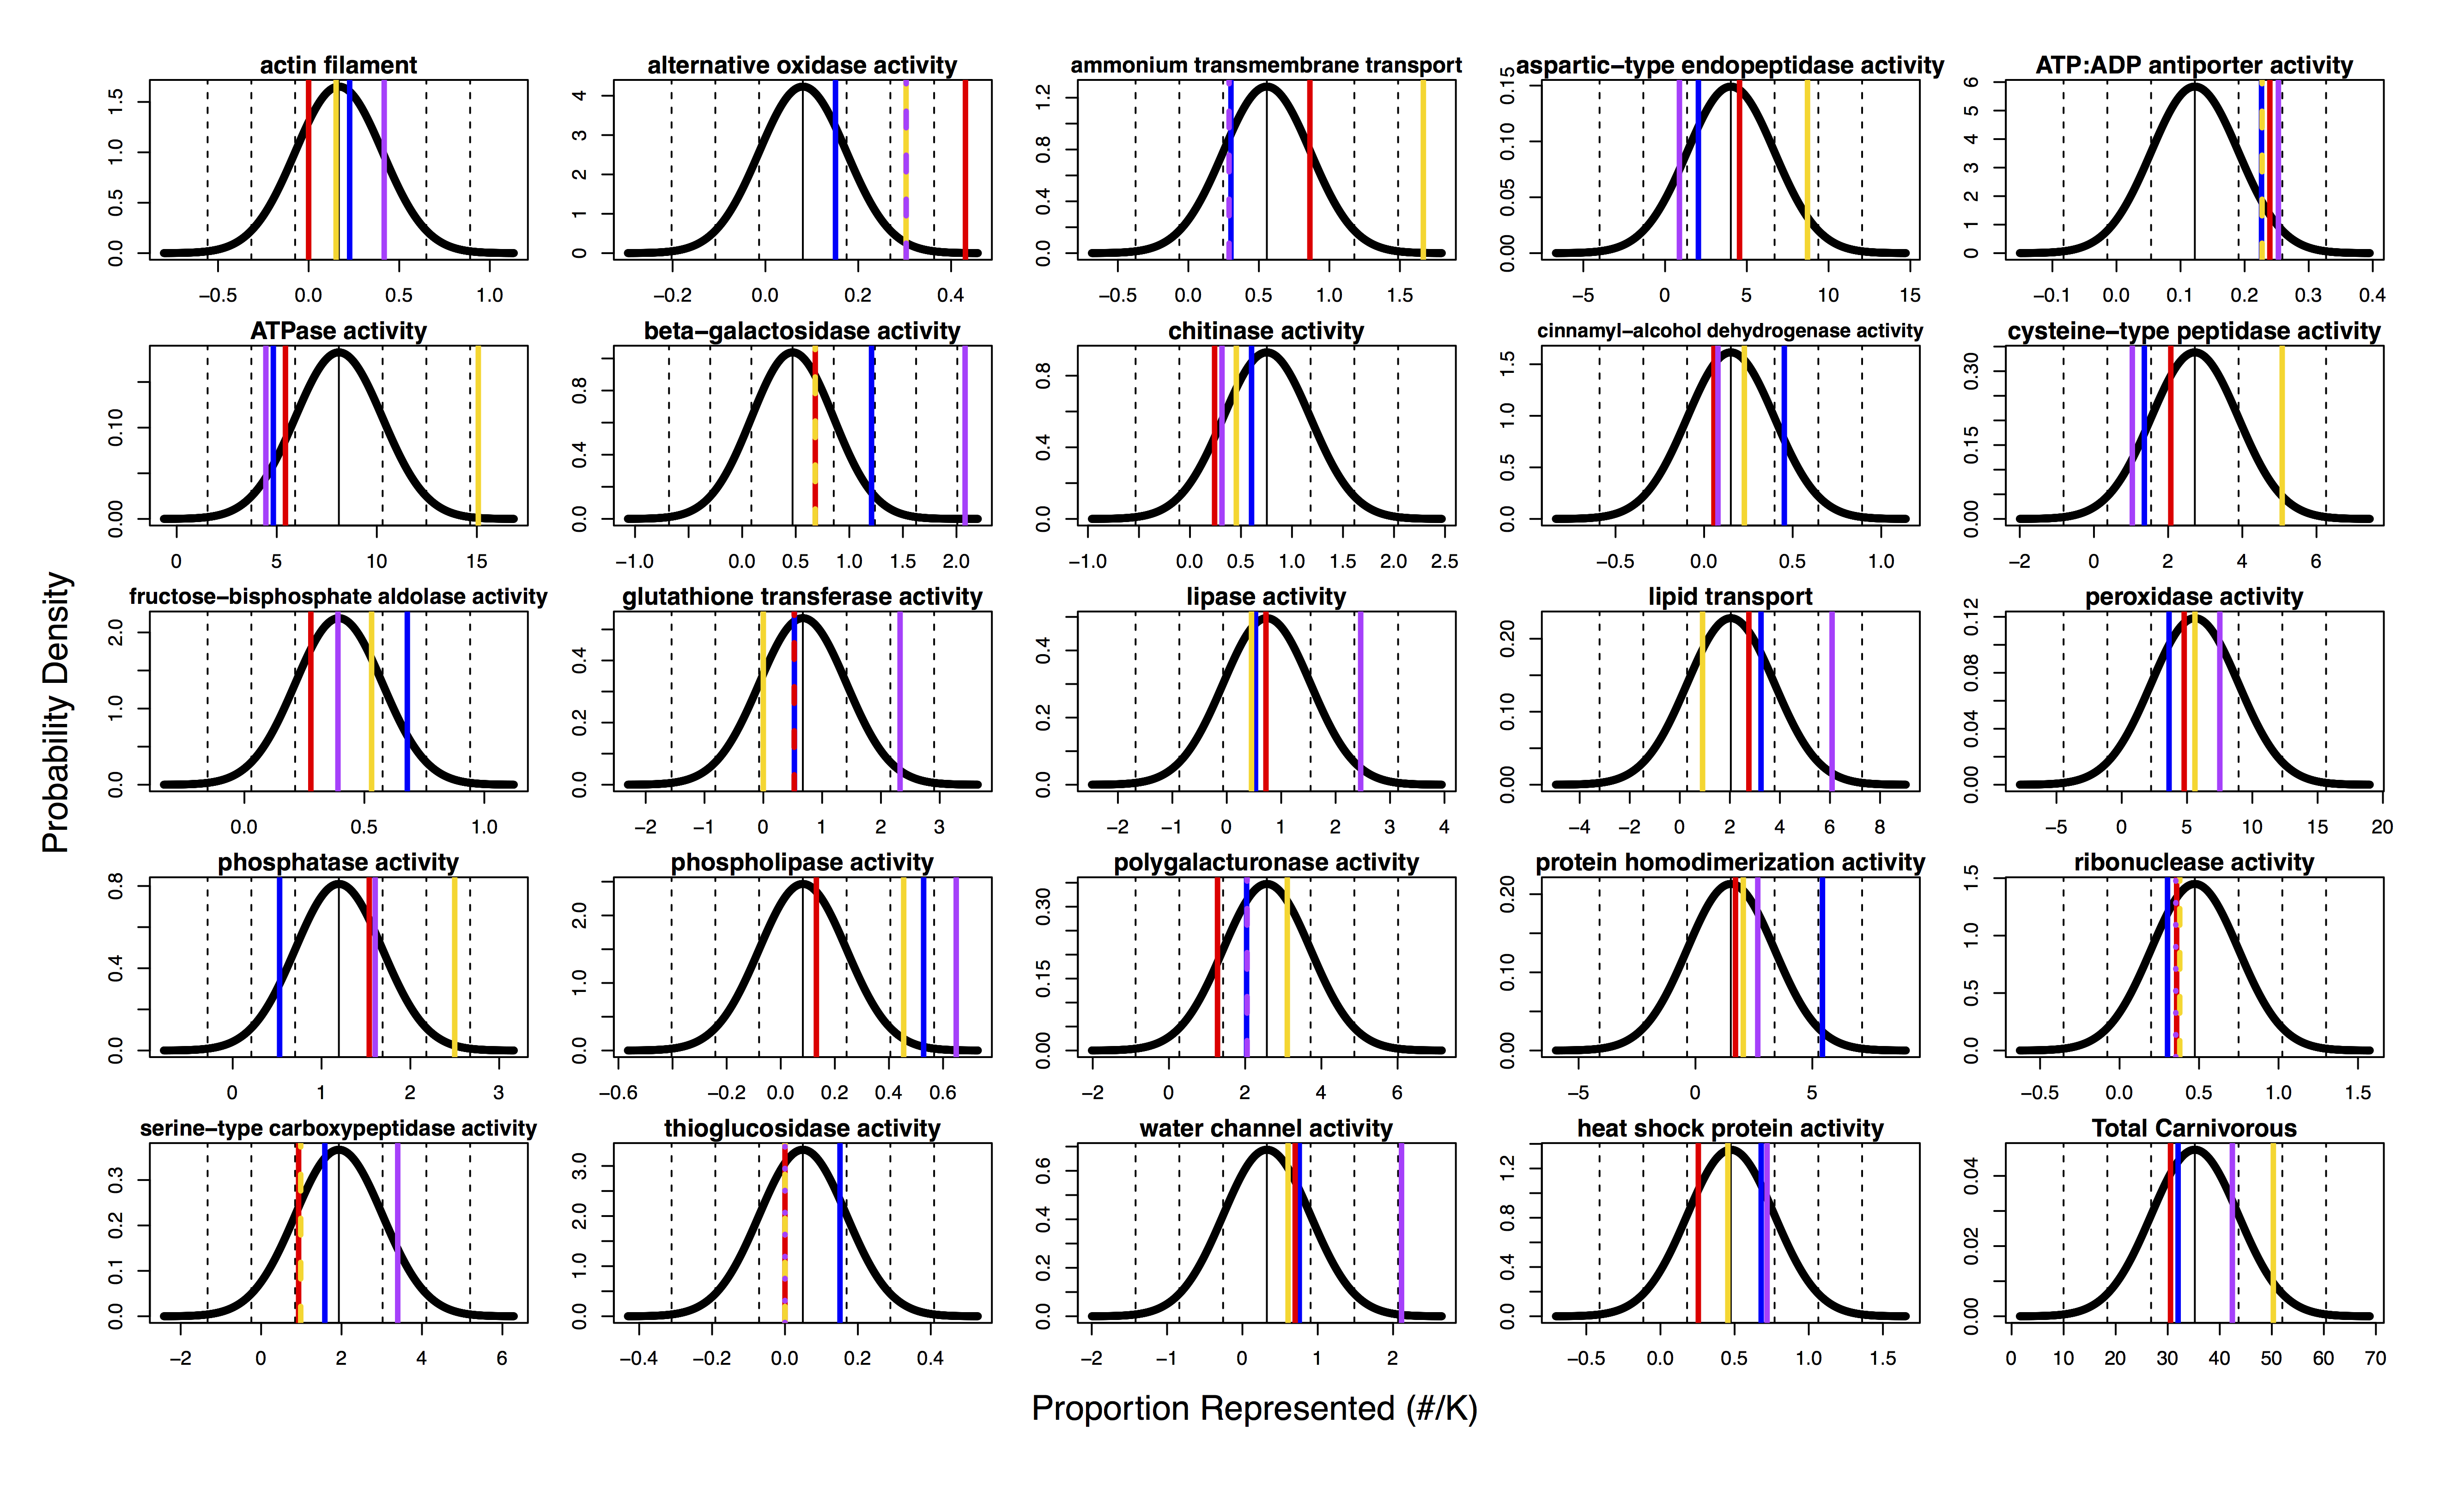
Graphical depiction of data presented in Table 4
Each normal distribution represents the range of values found in non-carnivorous taxa for a function analyzed. Colored lines each indicate the value found for a carnivorous taxon (Blue: Genlisea aurea; Red: Drosera capensis; Yellow: Utricularia gibba; Purple: Cephalotus follicularis). Black vertical lines indicate mean (solid) and standard deviations from the mean (dashed).
List of protein functions identified in past studies of carnivorous plants, as published, and the taxon in which they were identified
Where zones of the plant are given (eg., trap, fluid, or secretion), analysis was localized to that specific zone or accounted for differential expression. Where only the taxon is specified, analysis considered the whole plant. Information from: Rotloff et al., 2016 [1], Schulze et al., 2012 [2], Scherzer et al., 2013 [3], Owen et al., 1999 [4], Bohm et al., 2016 [5], Ibarra-Laclette et al., 2011 [6], and An, Fukusaki, and Kobayashi, 2002 [7].
Calculation of adjustment parameters to correct for differential detection of functions between GenBank-annotated and BLAST-annotated samples
The “Adjustment” column indicates the value that BLAST proportions are multiplied by to match the value distribution expected of their GenBank counterparts. Nullset symbols indicate functions for which one or both methods detected zero instances, preventing adjustment calculations. Hyphens indicate values that are calculated individually for each sample, using the sum of other post-adjustment values.
Representation of each carnivory-associated function proportion to the total of all carnivory-associated functions, as depicted graphically in Figure 4
Functions are ordered by their representation on average (given in far-right column), from most common to most rare. “Other” indicates the total of the nine rarest carnivory-associated functions, listed with indentation. [Abbreviation key: CFOL – Cephalotus follicularis; DCAP – Drosera capensis; GAUR – Genlisea aurea; UGIB – Utricularia gibba; ACHI – Actinidia chinensis; ATHA – Arabidopsis thaliana; BHYG – Boea hygrometrica; GSOJ – Glycine soja; OSAT – Oryza sativa; OTEN – Ocimum tenuiflorum]
Results of statistical analyses comparing non-carnivorous plants to carnivorous plants for each of 24 carnivory-associated functions, plus the total of all functions
Equivalent to main text Table 3, but using unadjusted data. “t” indicates the test statistic of an upper-tailed Student’s t-test. “p” indicates the p-value of this test. “q” indicates a corrected p-value accounting for multiple comparisons, using Storey’s correction. Significance (“Sig.”) is indicated by bolding and with “*” for q < 0.05, “**” for q < 0.01, and “*** for q < 0.001. A non-bolded “.” indicates marginal values (q < 0.10), while “NS” indicates non-significance (q > 0.10).
Results of statistical analyses comparing non-carnivorous plants to carnivorous plants for each of 24 carnivory-associated functions, plus the total of all functions
Equivalent to main text Table 4 but using unadjusted data. “t” indicates the test statistic of an upper-tailed Student’s t-test. “p” indicates the p-value of this test. “q” indicates a corrected p-value accounting for multiple comparisons, using Storey’s correction. Significance (“Sig.”) is indicated by bolding and with “*” for q < 0.05, “**” for q < 0.01, and “*** for q < 0.001. A non-bolded “.” indicates marginal values (q < 0.10), while “NS” indicates non-significance (q > 0.10).
Gene data (Adjusted)
Gene representation data set, adjusted version (used in main text). Rows indicate taxa; columns indicate carnivory-associated functions. Values are given in genes per thousand. Column 28 (AB), "Class", specifies whether a taxon is carnivorous (study group) or non-carnivorous (reference).
Gene data (Non-Adjusted)
Gene representation data set, non-adjusted version (used in Supplemental Note). Rows indicate taxa; columns indicate carnivory-associated functions. Values are given in genes per thousand. Column 28 (AB), "Class", specifies whether a taxon is carnivorous (study group) or non-carnivorous (reference).
AnnotationConverter.pl
Perl script, used to convert Blast2GO mapping outputs into input filesets for downstream use by Functionalizer.pl.
GBFFConvert.pl
Perl script, used to convert GenBank GBFF data files into input filesets for downstream use by Functionalizer.pl.
Functionalizer.pl
Checks a file containing genes and GO codes against a reference GO list, determining if one or more of the reference GOs are present.
Reference GO list
Reference list of carnivory-associated GOs, for use as an input to Functionalizer.pl.
Analysis 1 (t-test)
R-script for analyzing study taxa as classes (carnivorous vs. non-carnivorous).
Analysis 2 (Z-test)
R-script for analyzing study taxa individually (each taxon against a non-carnivorous reference range).
Sampled taxa GO mapping
Archive containing the gene ontology codes assigned to each putative gene of the taxa sampled in this study. Files containing "ORF-450F" are lists of genes identified using ORFFinder; files containing "Protein" were produced by annotation of the taxon's protein database, available on GenBank. GO code assignment was performed via BLAST-P against the non-redundant protein database (nr) followed by the "Mapping" function of Blast2GO.