Genetic effects on life-history traits in the Glanville fritillary butterfly
- Published
- Accepted
- Subject Areas
- Evolutionary Studies, Genetics
- Keywords
- Melitaea cinxia, life-history, association study, fragmented population, Pgi
- Copyright
- © 2017 Duplouy et al.
- Licence
- This is an open access article distributed under the terms of the Creative Commons Attribution License, which permits unrestricted use, distribution, reproduction and adaptation in any medium and for any purpose provided that it is properly attributed. For attribution, the original author(s), title, publication source (PeerJ Preprints) and either DOI or URL of the article must be cited.
- Cite this article
- 2017. Genetic effects on life-history traits in the Glanville fritillary butterfly. PeerJ Preprints 5:e2944v1 https://doi.org/10.7287/peerj.preprints.2944v1
Abstract
Background. Adaptation to local habitat conditions may lead to the natural divergence of populations in life-history traits such as body size, time of reproduction, mate signaling or dispersal capacity. Given enough time and strong enough selection pressures, populations may experience local genetic differentiation. The genetic basis of many life-history traits, and their evolution according to different environmental conditions remain however poorly understood.
Methods. We conducted an association study on the Glanville fritillary butterfly, using material from five populations along a latitudinal gradient within the Baltic Sea region, which show different degrees of habitat fragmentation. We investigated variation in ten principal components, cofounding in total 21 life-history traits, according to two environmental types, and 33 genetic SNP markers from 15 candidate genes.
Results. We found that nine SNPs from five genes showed strong trend for trait associations (p-values under 0.001 before correction). These associations, yet non-significant after multiple test corrections, with a total number of 1086 tests, were consistent across the study populations. Additionally, these nine genes also showed an allele frequency difference between the populations from the northern fragmented versus the southern continuous landscape.
Discussion. Our study provides further support for previously described trait associations within the Glanville fritillary butterfly species across different spatial scales. Although our results alone are inconclusive, they are concordant with previous studies that identified these associations to be related to climatic changes or habitat fragmentation within the Åland population.
Author Comment
This is a submission to PeerJ for review.
Supplemental Information
The five study populations and their monthly average temperatures
(A) Map of the Baltic Sea region with five populations of the Glanville fritillary: the Uppland coastal region, and Öland, Gotland, Saaremaa and Åland Islands. (B) Average monthly temperatures (full lines) and average monthly maximum and minimum temperatures (dashed) from 1992 to 2001 in Åland (orange), Uppland (purple), Öland (green), Gotland (red) and Saaremaa (blue). The map was created by A. Duplouy using a modified version of the image “Location map of the Baltic Sea” (https://commons.wikimedia.org/wiki/File:Baltic_Sea_location_map.svg , under the licence CC BY-SA 3.0, https://creativecommons.org/licenses/by-sa/3.0/) by NordNordWest/Wikipedia. The original image was cropped using Adobe Photoshop CS6 (Version: 13.06x64, http://www.adobe.com/products/photoshop.html).
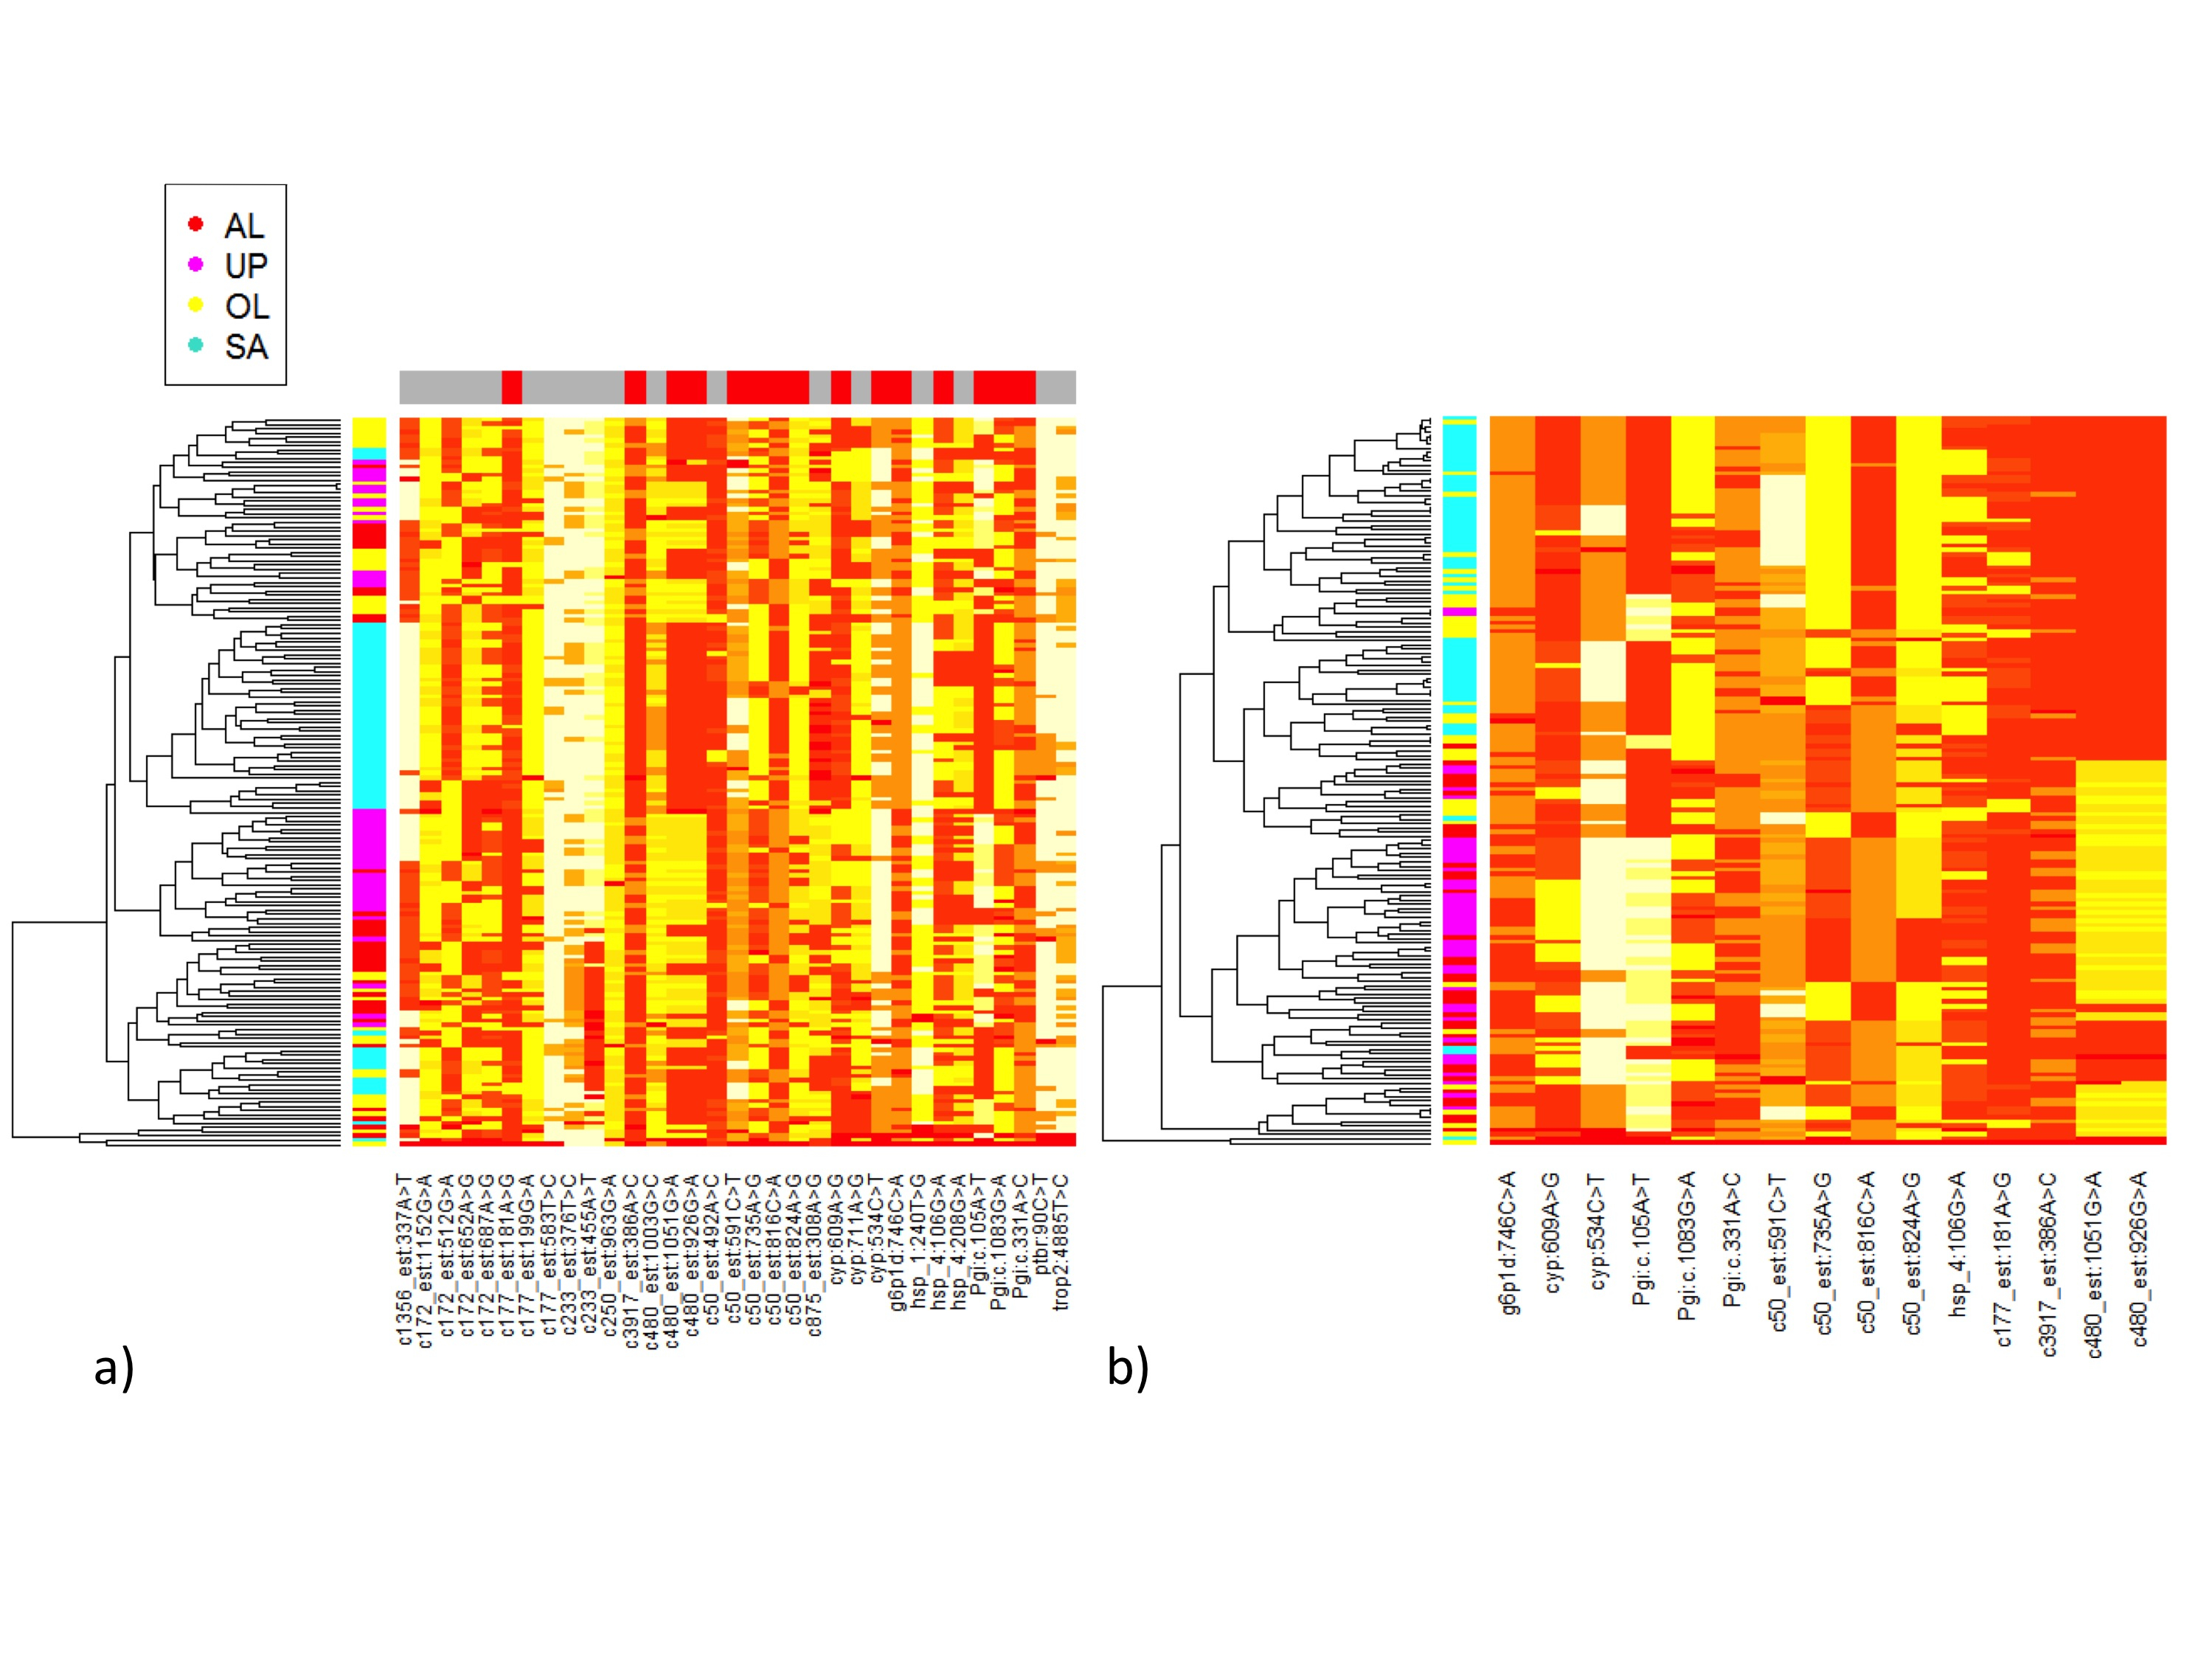
Heatmap for allele count variation between individuals of the Glanville fritillary butterfly from four populations in the Baltic region
Dendograms on the Y-axes show the hierarchical clustering of all samples used in the study, color coded by population of origin (ÅL, UP, ÖL and SA, in red, magenta, yellow and turquoise, respectively). The SNPs appear on the X-axis. (a) The heatmap includes 33 SNPs. The red colour at the top coloured panel highlights the15 SNPs with significant allele frequencies differences between landscape type (northern fragmented, Åland and Uppland, versus southern continuous, Saaremaa and Öland). (b) The heatmap includes only the 15 SNPs with allele frequency differences between landscape types. Only samples collected in 2009 are included in this analysis.
Larval development-related traits and genotypes of the SNP EU888473.1(Pgi):c.331A>C
(A) The 5th instar larval weight (mg) for the different genotypes of samples collected in 2009. (B) The pupal weight (mg) for the different genotypes of samples collected in 2006. Sample size is given by the number above the bar. Heavy horizontal lines represent median values, boxes give interquartile ranges, whiskers and dots give the minimum and maximum, and outlier values, respectively.
Values of developmental PC1-2 for the different genotypes of the two SNPs c50_est:735A>G and c50_est:824A>G in the Hemolymph proteinase-5 gene
Sample size for each category is given by the number at the top of the graph. Heavy horizontal lines represent median values, boxes give interquartile ranges, whiskers give minimum and maximum values, dots represent outliers.
Values of developmental PC1-1 for the different genotypes of the SNP hsp_4:106G>A in the Heat shock protein 70kDa gene
Sample size for each category is given by the number at the top of the graph. Heavy horizontal lines represent median values, boxes give interquartile ranges, whiskers give minimum and maximum values, dots represent outliers.
Values of male PCM1 for the different genotypes of the SNP c3917_est:386A>C in the Serine proteinase-like protein gene
Sample size for each category is given by the number at the top of the graph. Heavy horizontal lines represent median values, boxes give interquartile ranges, whiskers give minimum and maximum values, dots represent outliers.
Values of male PCM3 for the different genotypes of a SNP in either the Heat shock protein gene or the Hemolymph proteinase genes
Sample size for each category is given by the number at the top of the graph. Heavy horizontal lines represent median values, boxes give interquartile ranges, whiskers give minimum and maximum values, dots represent outliers.
Number of male and female individuals genotyped for each population (Åland, Gotland, Öland, Saaremaa, and Uppland)
in the main experiment (2009) and the pilot experiment (2007), and number of individuals included in each PCA1 (larval and pupal traits only), PCAM (male adult traits only) and PCAF (female adult traits only).
Pearson correlation matrices for the larval and pupal traits, the adult male traits and the adult females traits
Values are Pearson correlative values (R) and asterisks denote significance at the 0.05 (*), 0.01 (**) and 0.001 (***) levels. The Bonferroni alpha values were corrected for 27, 15 and 91 correlations, respectively.
Eigen values, cumulative proportion of variance value and component loadings for the four first principal components of the principal component analysis performed on the larval and pupal traits
Highest values from each PCA appear in bold for easier visualization of the results.
Eigen values, cumulative proportion of variance value and component loadings for the three first principal components of the principal component analysis performed on the male adult traits
Highest values from each PCA appear in bold for easier visualization of the results.
Eigen values, cumulative proportion of variance value and component loadings for the three first principal components of the principal component analysis performed on the female adult traits
Highest values from each PCA appear in bold for easier visualization of the results
Minimum allele frequency (MAF), and minor allele for the 49 SNPs genotyped
Each Pgi locus was genotyped twice. SNPs tagged with “(f)” failed our quality criteria, while SNPs tagged with “(*)” were genotyped for the 2007 pilot study. HWE: Hardy Weinberg Equilibrium; MAF: Minimum Allele Frequency; Gen: Genotyping; Homoz: Homozygote. Aland (AL) and Uppland (UP) populations evolve in northern fragmented environments, while Gotland (GO), Oland (OL) and Saaremaa (SA) populations evolve in southern continuous environments.
Details of statistical analyses showing significant results, including statistical models used for each trait, as well as the explanatory variables included in the models
Models of inheritance are given within brackets as Dominant, Recessive or Additive. Both main effects and interactions are reported. “NS” stands for non-significant.
The 15 SNPs showing significant environment effect on allele frequency, with the type of substitution and allele frequencies
The minimum allele frequency for each SNP is shown in bold to ease visualization of the results. Allele frequencies differences between environments were calculated using directed permutation tests (1e+6 random permutations). The p-values give the posterior probability of the hypothesis that there is no difference between the environment types.
Details of the genotyping quality for the 49 SNPs genotyped. (f): SNPs that failed the quality criteria
Each Pgi locus was genotyped twice. HW: Hardy Weinberg equilibrium; MAF: Minimum Allele Frequency; Gen: Genotyping; Homoz: Homozygote.