De novo assembly of expressed transcripts and analysis of pistil to identify genes involved in early stage of pollination in Liriodendron chinense
- Published
- Accepted
- Subject Areas
- Agricultural Science, Plant Science
- Keywords
- Liriodendron chinense, transcriptome, pistil, sexual reproduction
- Copyright
- © 2017 Li et al.
- Licence
- This is an open access article distributed under the terms of the Creative Commons Attribution License, which permits unrestricted use, distribution, reproduction and adaptation in any medium and for any purpose provided that it is properly attributed. For attribution, the original author(s), title, publication source (PeerJ Preprints) and either DOI or URL of the article must be cited.
- Cite this article
- 2017. De novo assembly of expressed transcripts and analysis of pistil to identify genes involved in early stage of pollination in Liriodendron chinense. PeerJ Preprints 5:e2803v1 https://doi.org/10.7287/peerj.preprints.2803v1
Abstract
Plant sexual reproduction is a complicated and a key biological process with profuse interactions between pollen and pistil. This process determines whether fertilization will be successful or not and thus affect the seed setting. To explore the reason why L. chinense has a low seed setting ratio, transcriptome analysis on pistils of L. chinense during pollination were conducted. After analyzing the sequencing data, 206,858 unigenes with an average length of 646 bp were generated using the assembled transcripts. Among total unigenes, 3844 genes which expression fold change during early stage of pollination was higher or lower than 10 were selected as significant differentially expressed genes. 54 differentially expressed genes involved in sexual reproduction processes including the regulation of pollen tube growth process and double fertilization process might be partially causing the low seed setting in L. chinense. These results indicated that the barrier between pollen tube and pistil might be the reason why L. chinense have low seed setting. This study might be helpful to understand why L. chinense has such a low seed setting ratio.
Author Comment
This is a preprint submission to PeerJ Preprints.
Supplemental Information
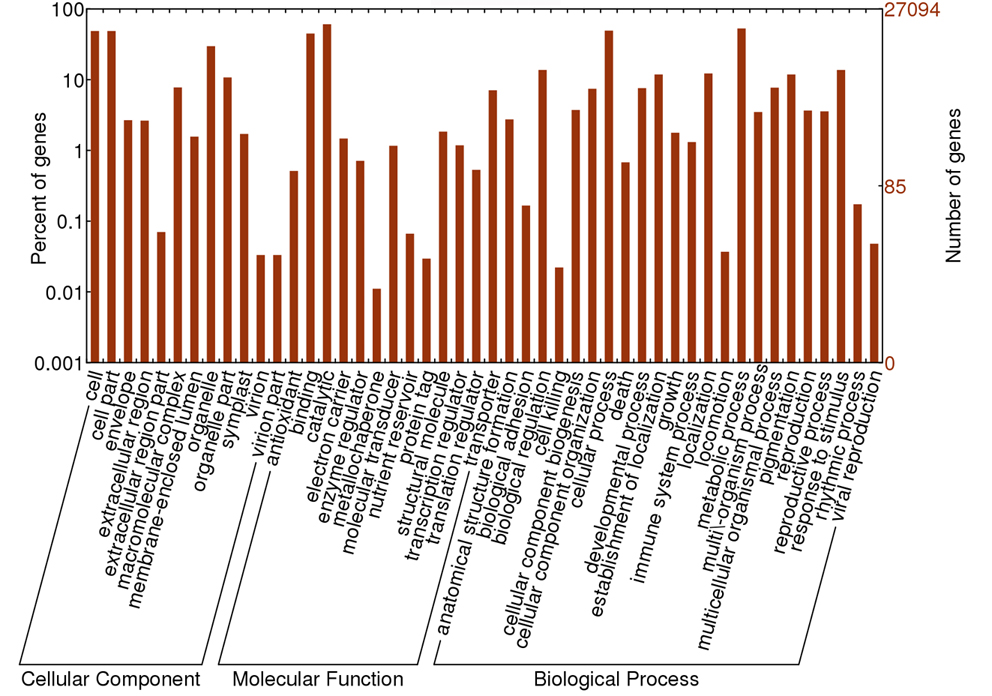
Gene Ontology classifications of assembled unigenes
The 27094 matched unigenes were classified into 3 functional categories: molecular function, biological process and cellular component.
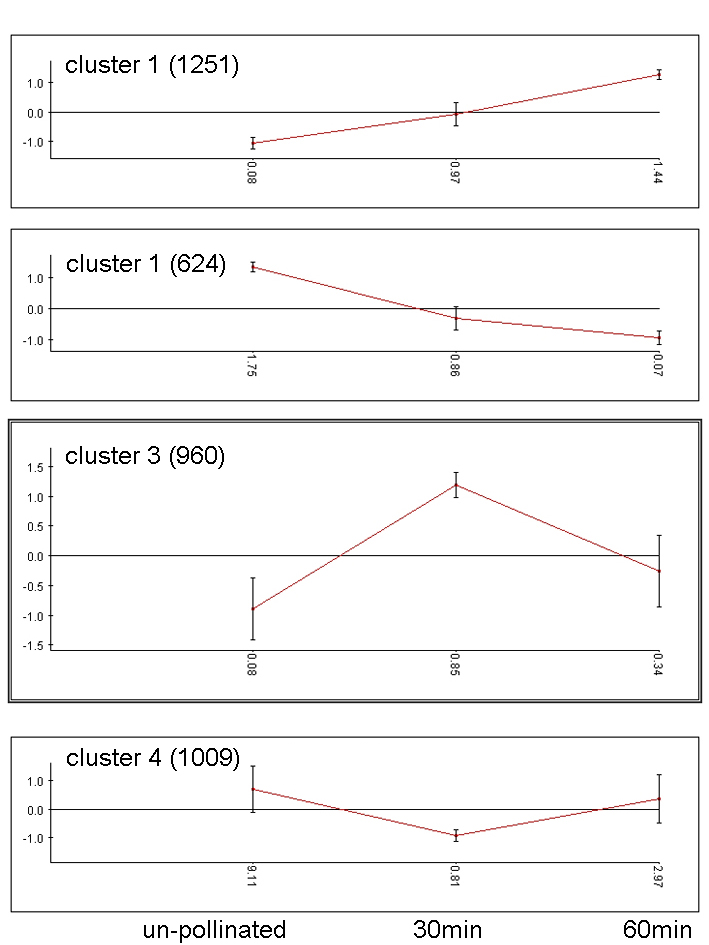
Cluster analysis of 3844 differentially expressed genes during early stage of pollination
Un-pollinated, 30min, and 60 min means un-pollinated pistil, pollinated pistil after 30 min, and pollinated pistil after 60 min.
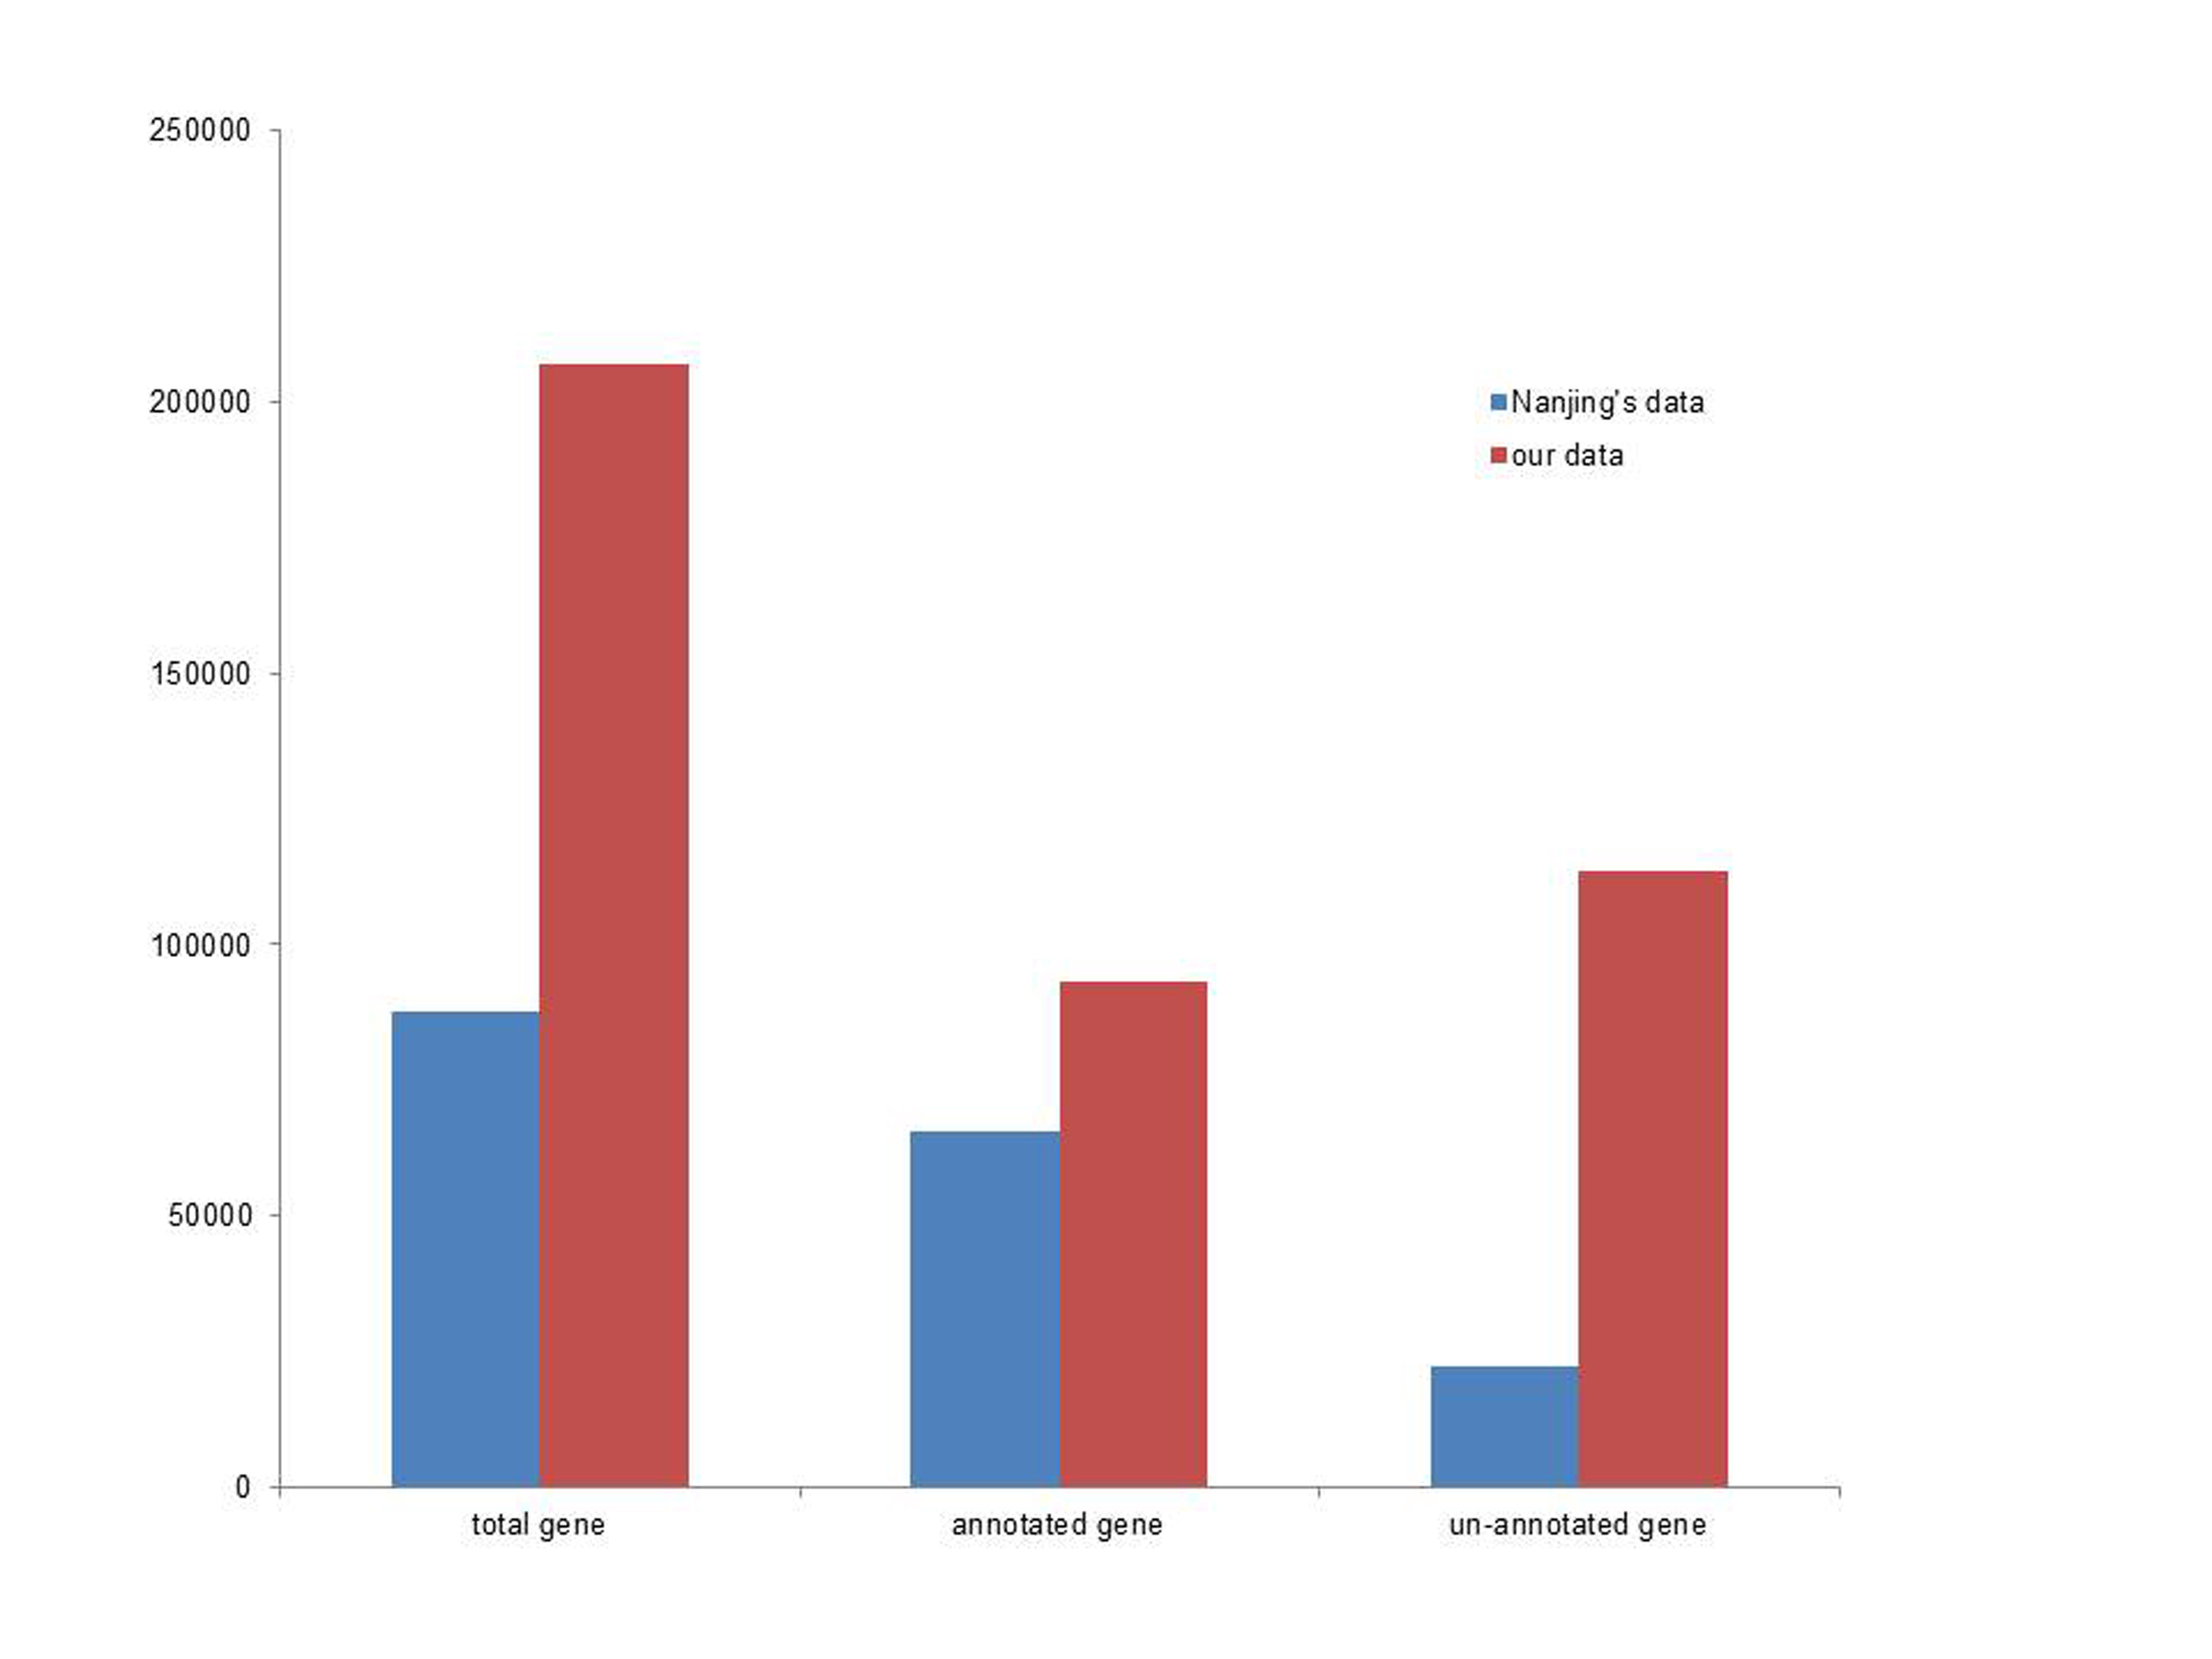
Supplemental table 1 The comparison of transcriptome data from two research group. Supplemental table 2 The information of 3844 differentially expressed genes
Supplemental table 1 The comparison of transcriptome data from two research group. Supplemental table 2 The information of 3844 differentially expressed genes.
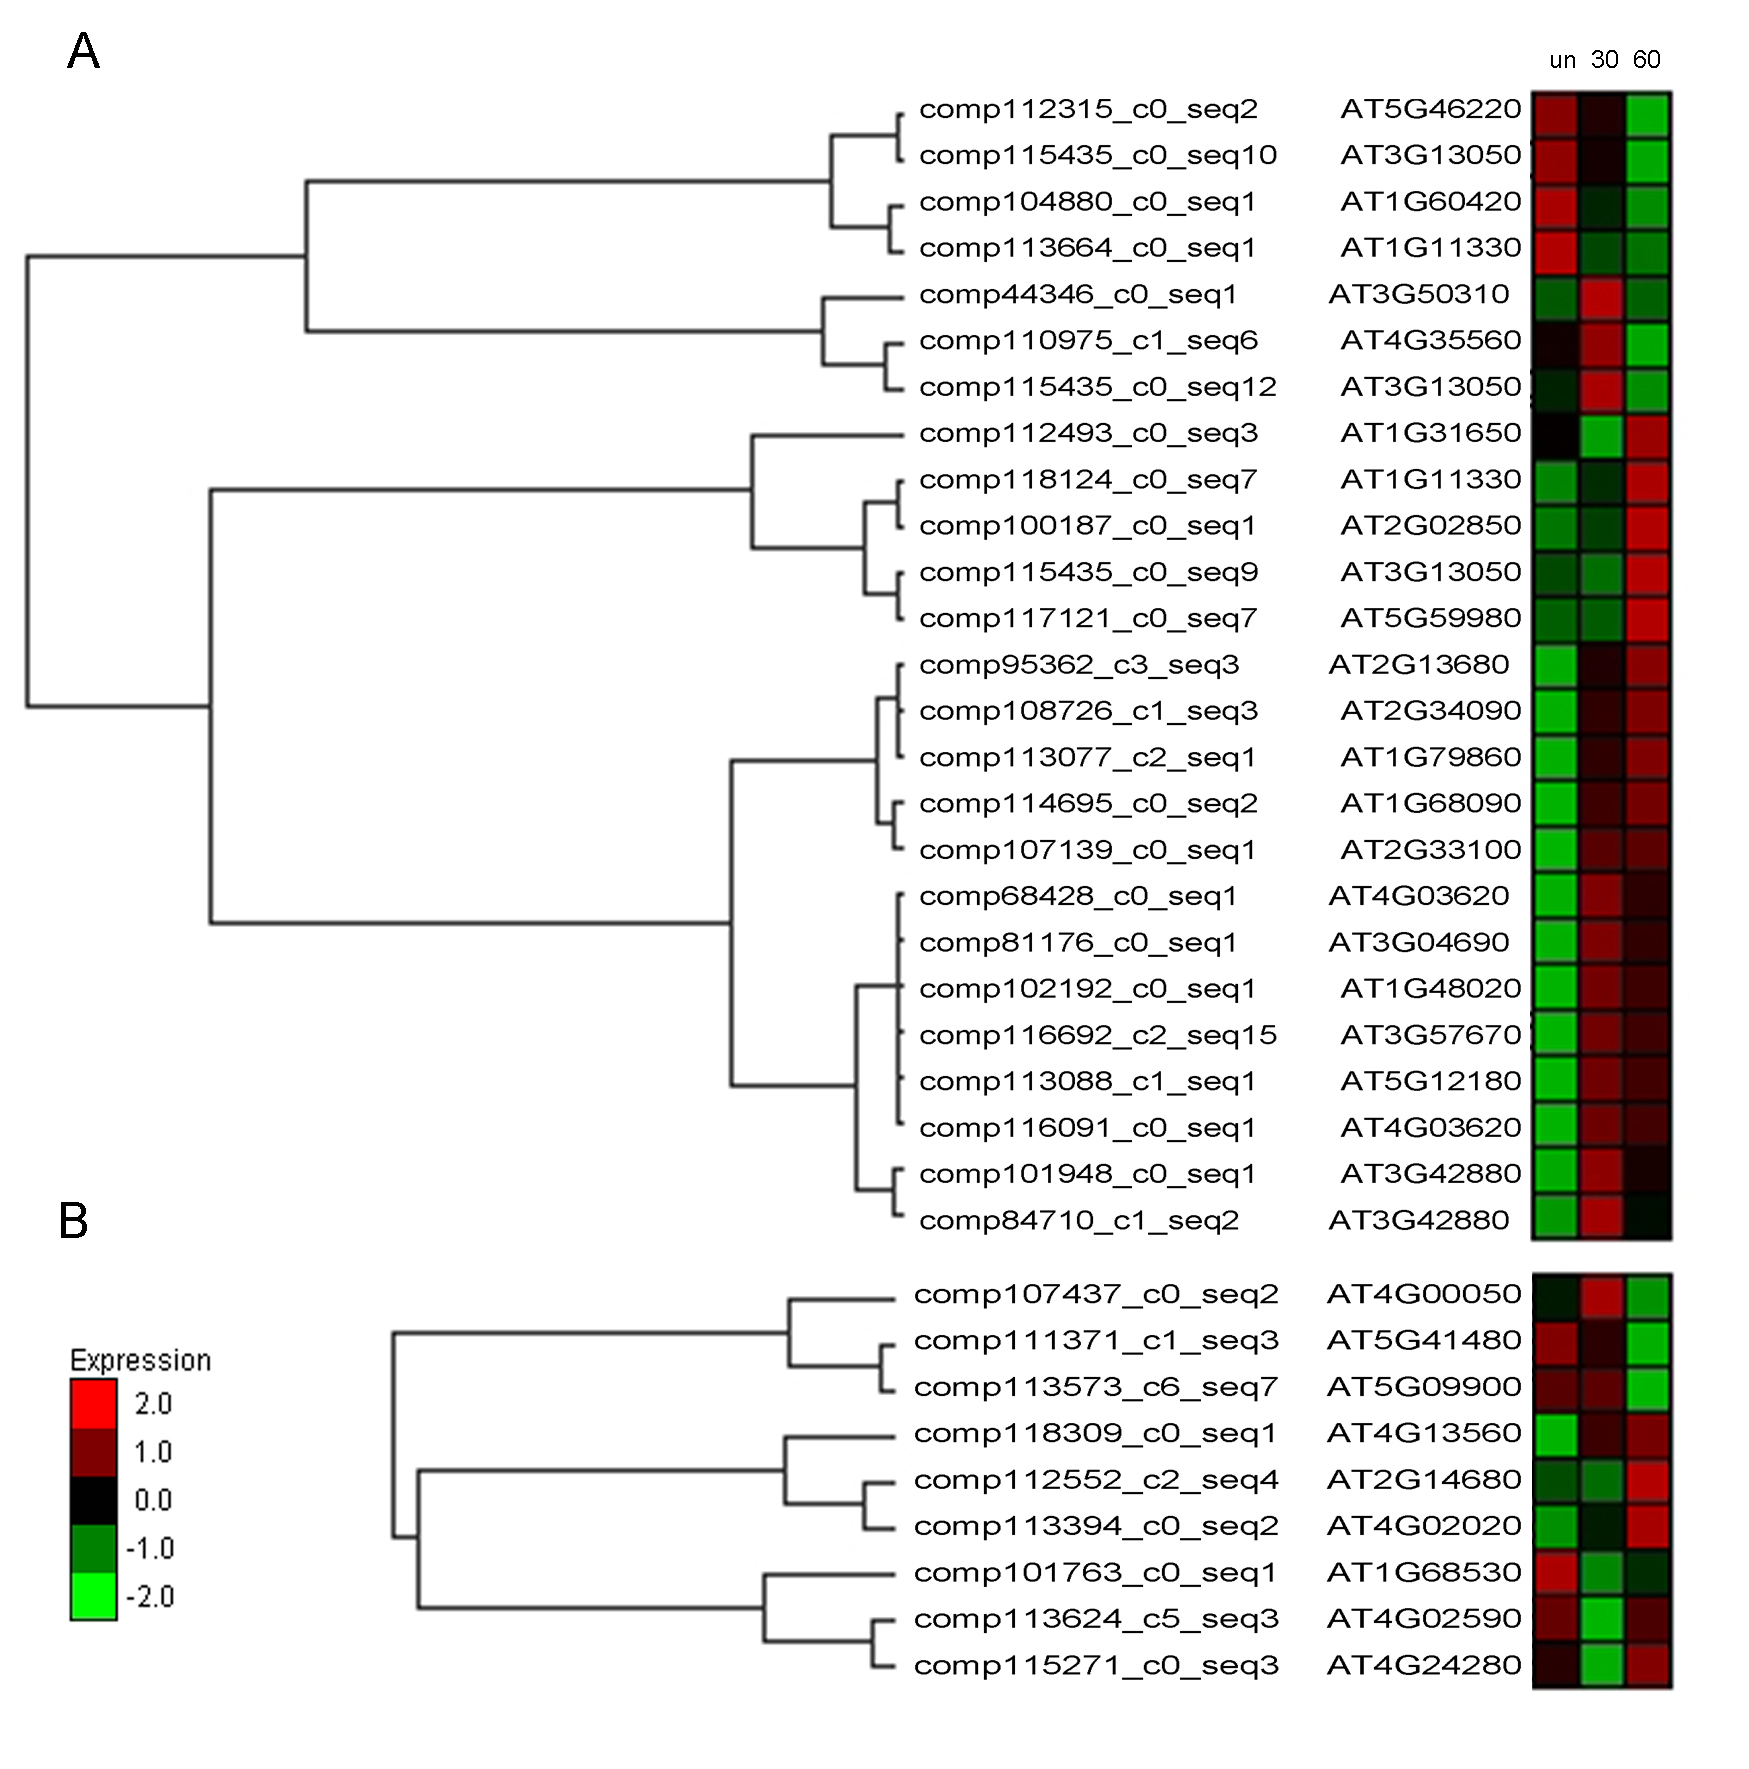
Cluster analyses of differentially expressed genes which involved in the regulation of pollen tube growth process and double fertilization process during early stage of pollination
Un, 30, and 60 means un-pollinated pistil, pollinated pistil after 30 min, and pollinated pistil after 60 min. A means differentially expressed genes which involved in the regulation of pollen tube growth process and B means differentially expressed genes which involved in double fertilization process.
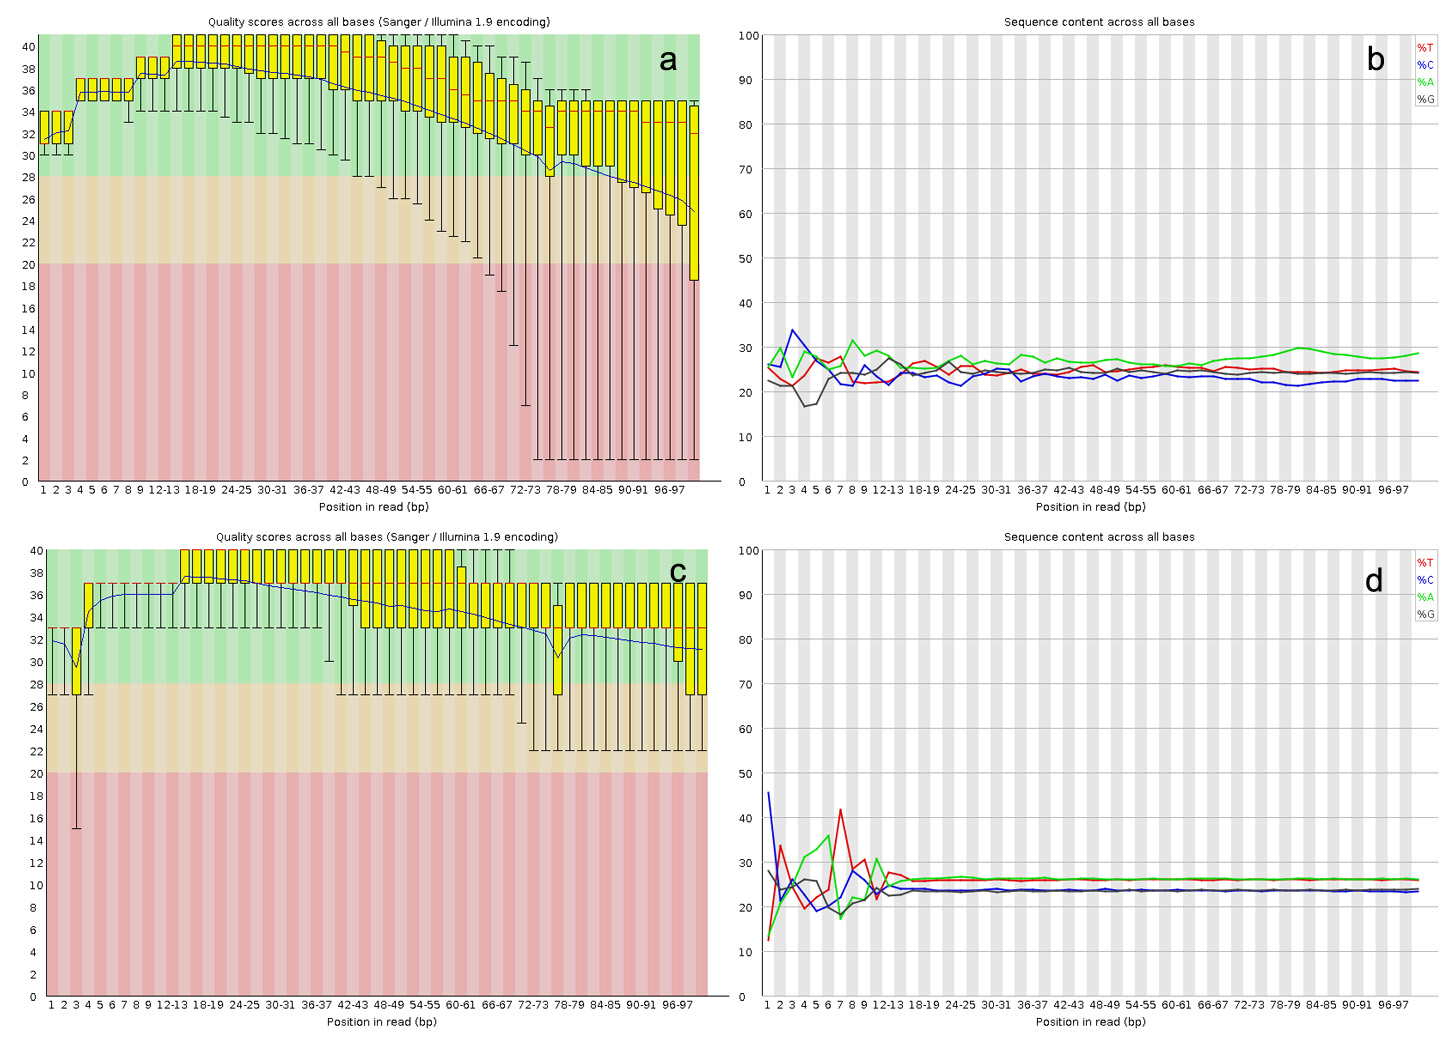
Supplementary Figure 1 Comparation of quality of sequencing data between our data and Nanjing’s data
a, b were Nanjing’s data and c, d were our data. The red and blue lines in a, c means median and average values of quality of sequencing data. The up line and down line of box plots in a, c means maximum and minimum values of quality of sequencing data. The red, blue, green and black lines in b, d means the concentration of T, C, A, and G.