RIdeogram: drawing SVG graphics to visualize and map genome-wide data on the idiograms
- Published
- Accepted
- Subject Areas
- Bioinformatics, Data Science, Graphics
- Keywords
- Genome, Chromosome, Idiogram, R package, Data visualization
- Copyright
- © 2019 Hao et al.
- Licence
- This is an open access article distributed under the terms of the Creative Commons Attribution License, which permits unrestricted use, distribution, reproduction and adaptation in any medium and for any purpose provided that it is properly attributed. For attribution, the original author(s), title, publication source (PeerJ Preprints) and either DOI or URL of the article must be cited.
- Cite this article
- 2019. RIdeogram: drawing SVG graphics to visualize and map genome-wide data on the idiograms. PeerJ Preprints 7:e27928v1 https://doi.org/10.7287/peerj.preprints.27928v1
Abstract
Background: Owing to the rapid advances in DNA sequencing technologies, whole genome from more and more species are becoming available at increasing pace. For whole-genome analysis, idiograms provide a very popular, intuitive and effective way to map and visualize the genome-wide information, such as GC content, gene and repeat density, DNA methylation distribution, etc. However, most available software programs and web servers are available only for a few model species, such as human, mouse and fly. As boundaries between model and non-model species are shifting, tools are urgently needs to generate idiograms for a broad range of species are needed to help better understanding fundamental genome characteristics.
Results: The R package RIdeogram allows users to build high-quality idiograms of any species of interest. It can map continuous and discrete genome-wide data on the idiograms and visualize them in a heat map and track labels, respectively.
Conclusion: The visualization of genome-wide data mapping and comparison allow users to quickly establish a clear impression of the chromosomal distribution pattern, thus making RIdeogram a useful tool for any researchers working with omics.
Author Comment
This is a submission to PeerJ Computer Science for review.
Supplemental Information
Supplementary Figure 1: The distribution of 200,481 SNPs selected for the pear array design
The SNP markers are counted in a 100-Kb window. The light-yellow color represents a low content and the navy-blue color represents a high content of SNPs (range 0–215). The red circles represent the SNP markers which are significantly associated with nine traits. The plot shows that these 200,481 SNPs selected from original 18.3 million SNPs have a uniform distribution and are appropriate to be used to further develop the pear array.
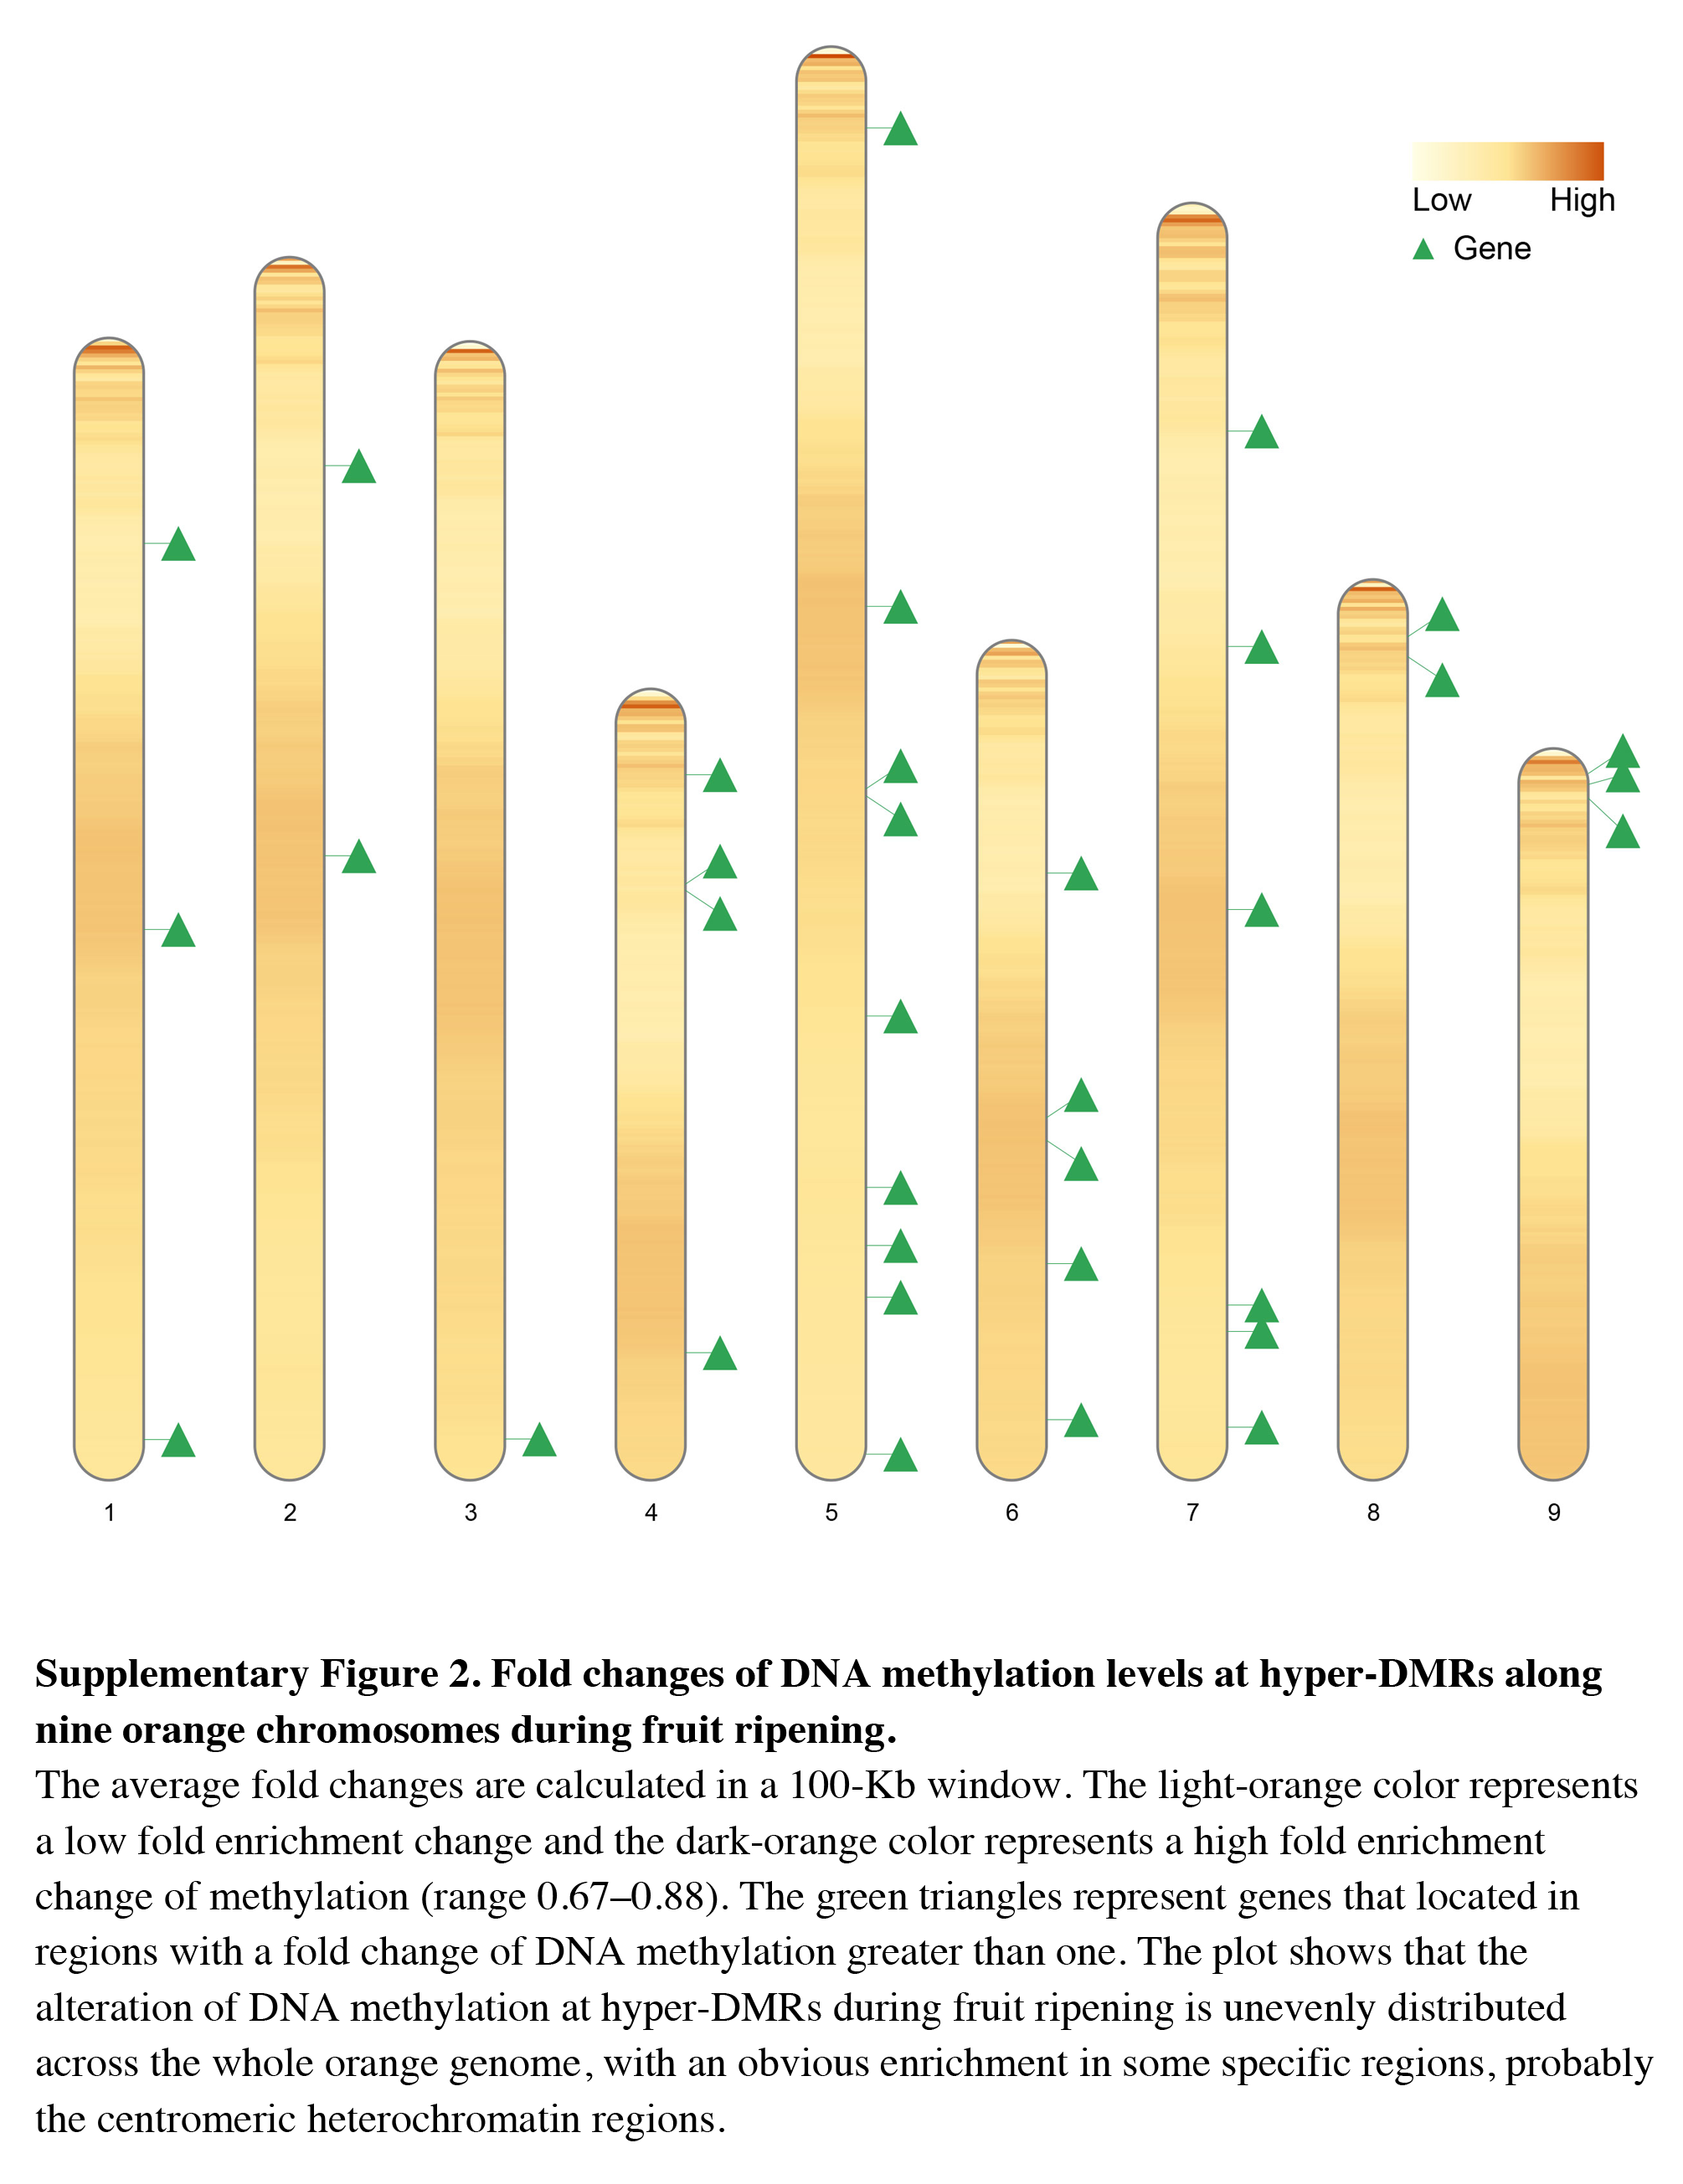
Supplementary Figure 2: Fold changes of DNA methylation levels at hyper-DMRs along nine orange chromosomes during fruit ripening
The average fold changes are calculated in a 100-Kb window. The light-orange color represents a low fold enrichment change and the dark-orange color represents a high fold enrichment change of methylation (range 0.67–0.88). The green triangles represent genes that located in regions with a fold change of DNA methylation greater than one. The plot shows that the alteration of DNA methylation at hyper-DMRs during fruit ripening is unevenly distributed across the whole orange genome, with an obvious enrichment in some specific regions, probably the centromeric heterochromatin regions.
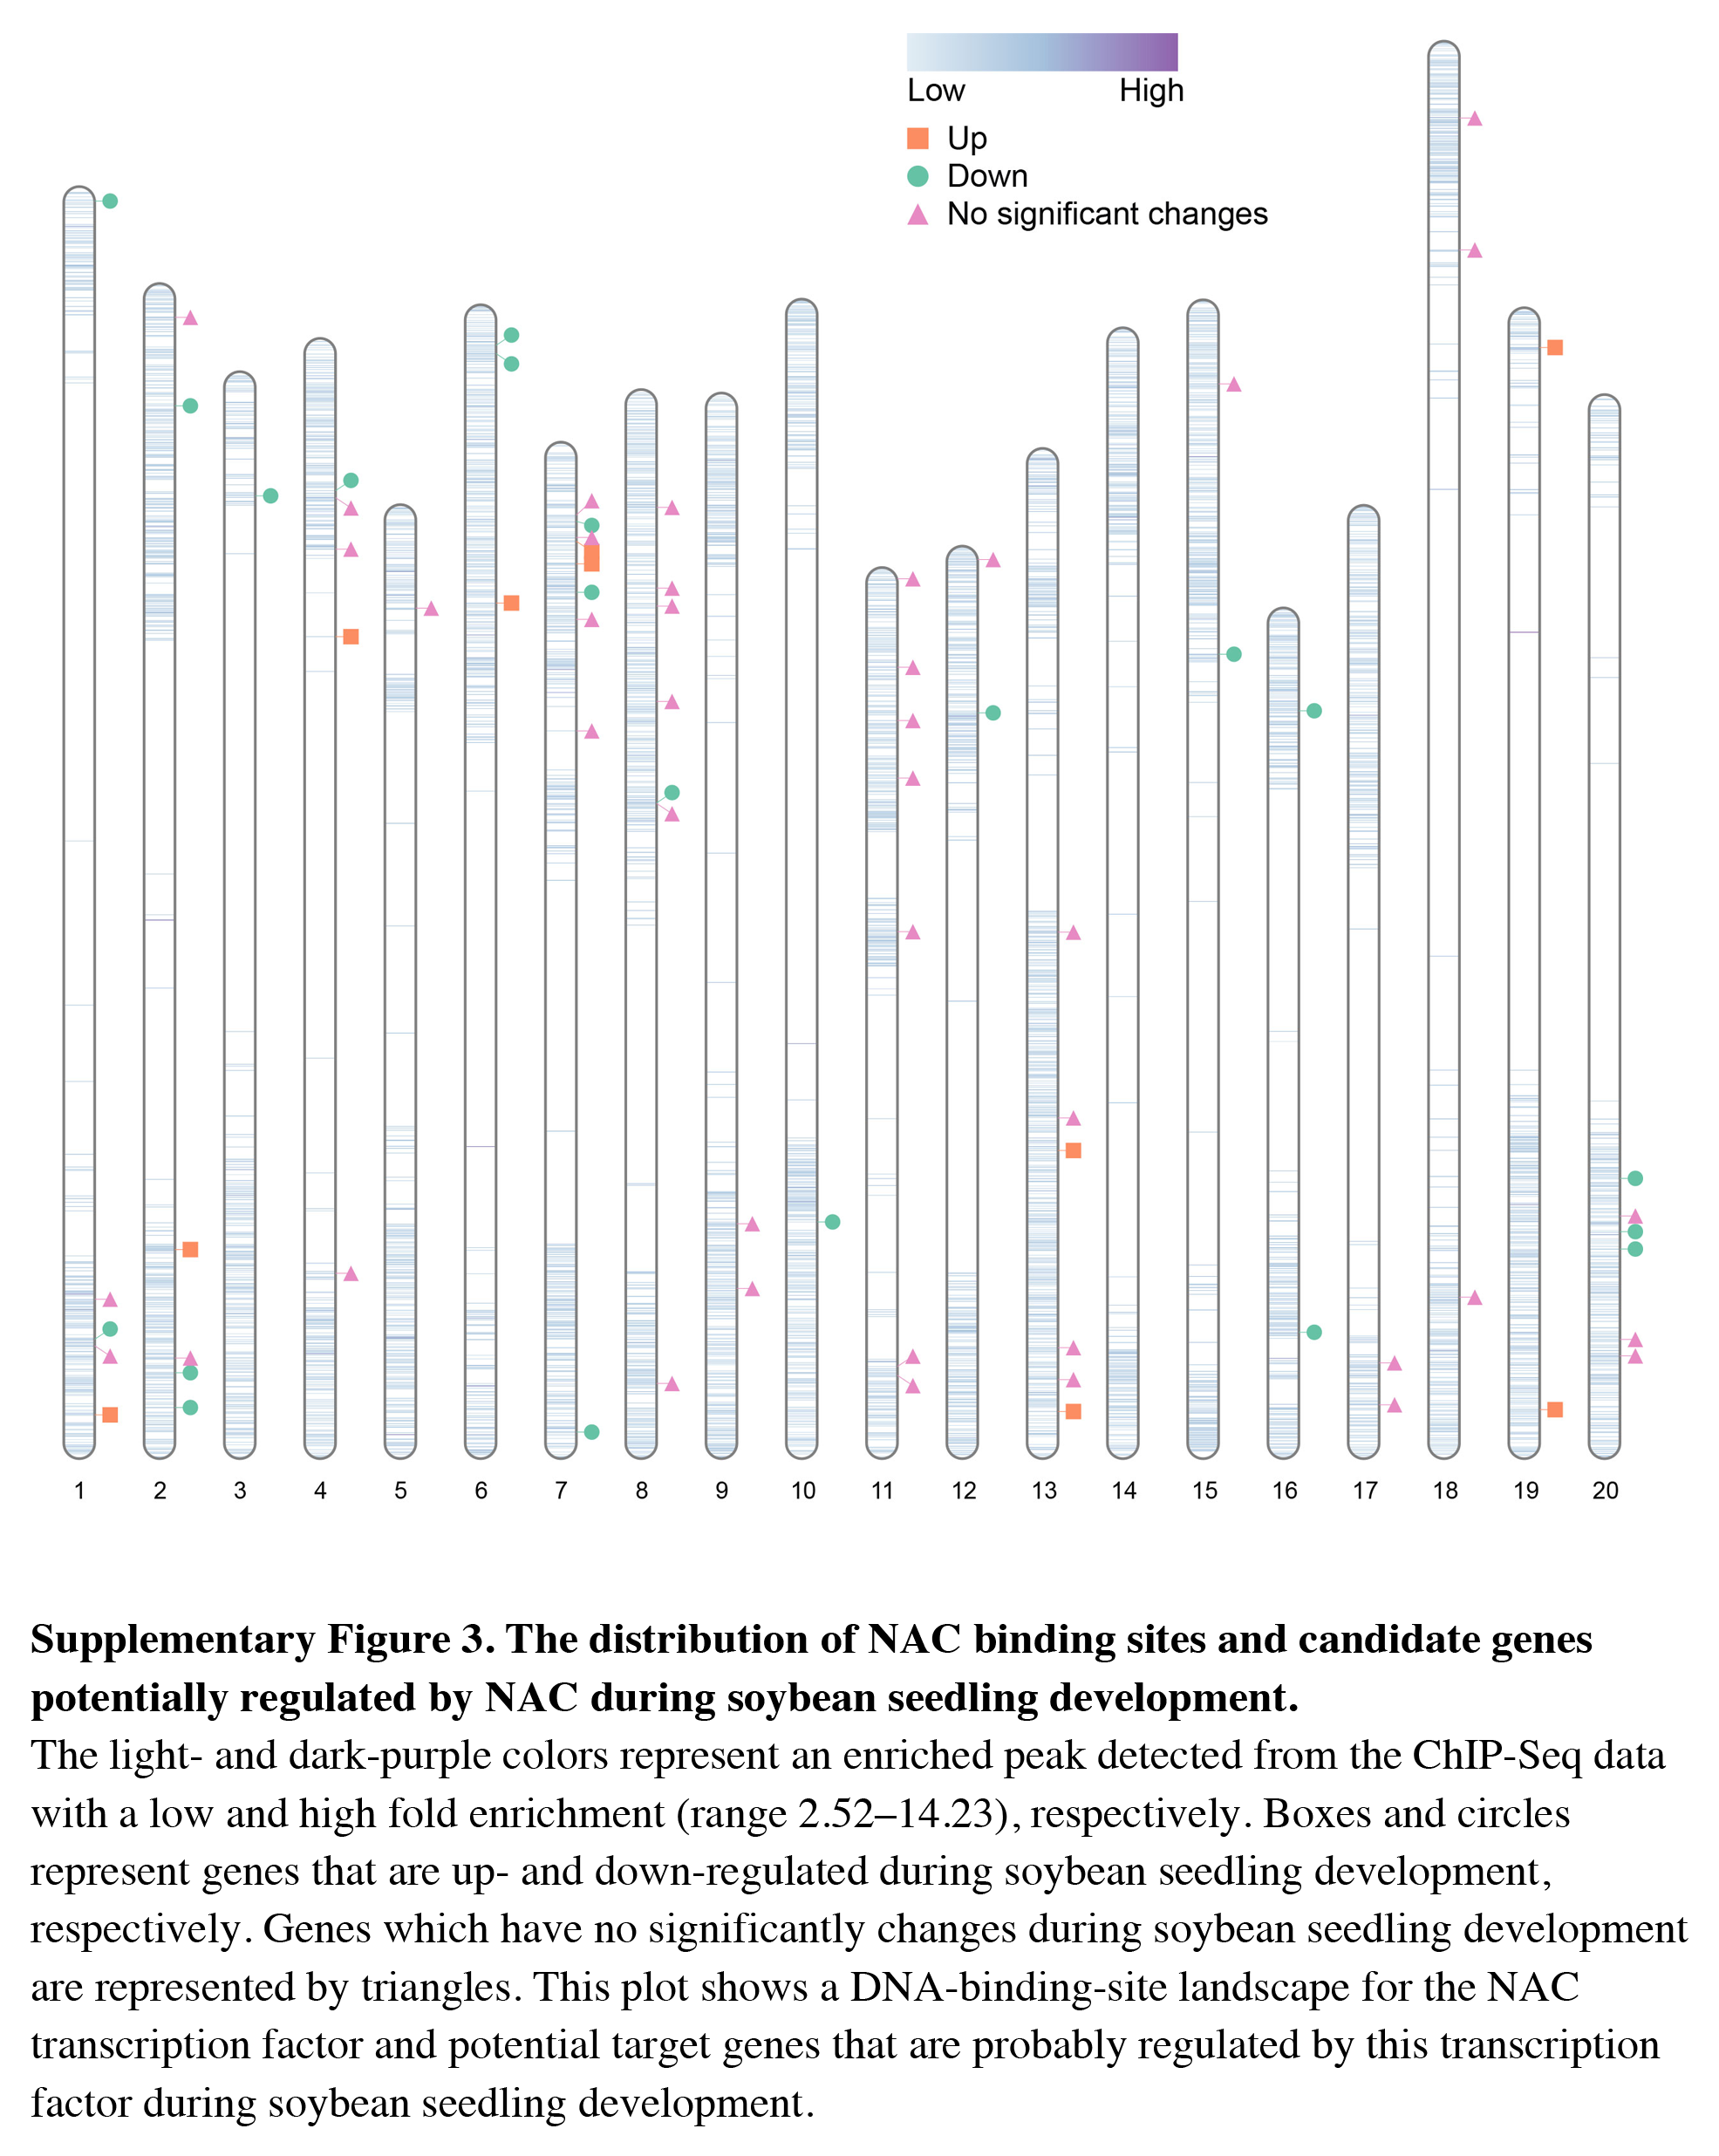
Supplementary Figure 3: The distribution of NAC binding sites and candidate genes potentially regulated by NAC during soybean seedling development
The light- and dark-purple colors represent an enriched peak detected from the ChIP-Seq data with a low and high fold enrichment (range 2.52–14.23), respectively. Boxes and circles represent genes that are up- and down-regulated during soybean seedling development, respectively. Genes which have no significantly changes during soybean seedling development are represented by triangles. This plot shows a DNA-binding-site landscape for the NAC transcription factor and potential target genes that are probably regulated by this transcription factor during soybean seedling development.
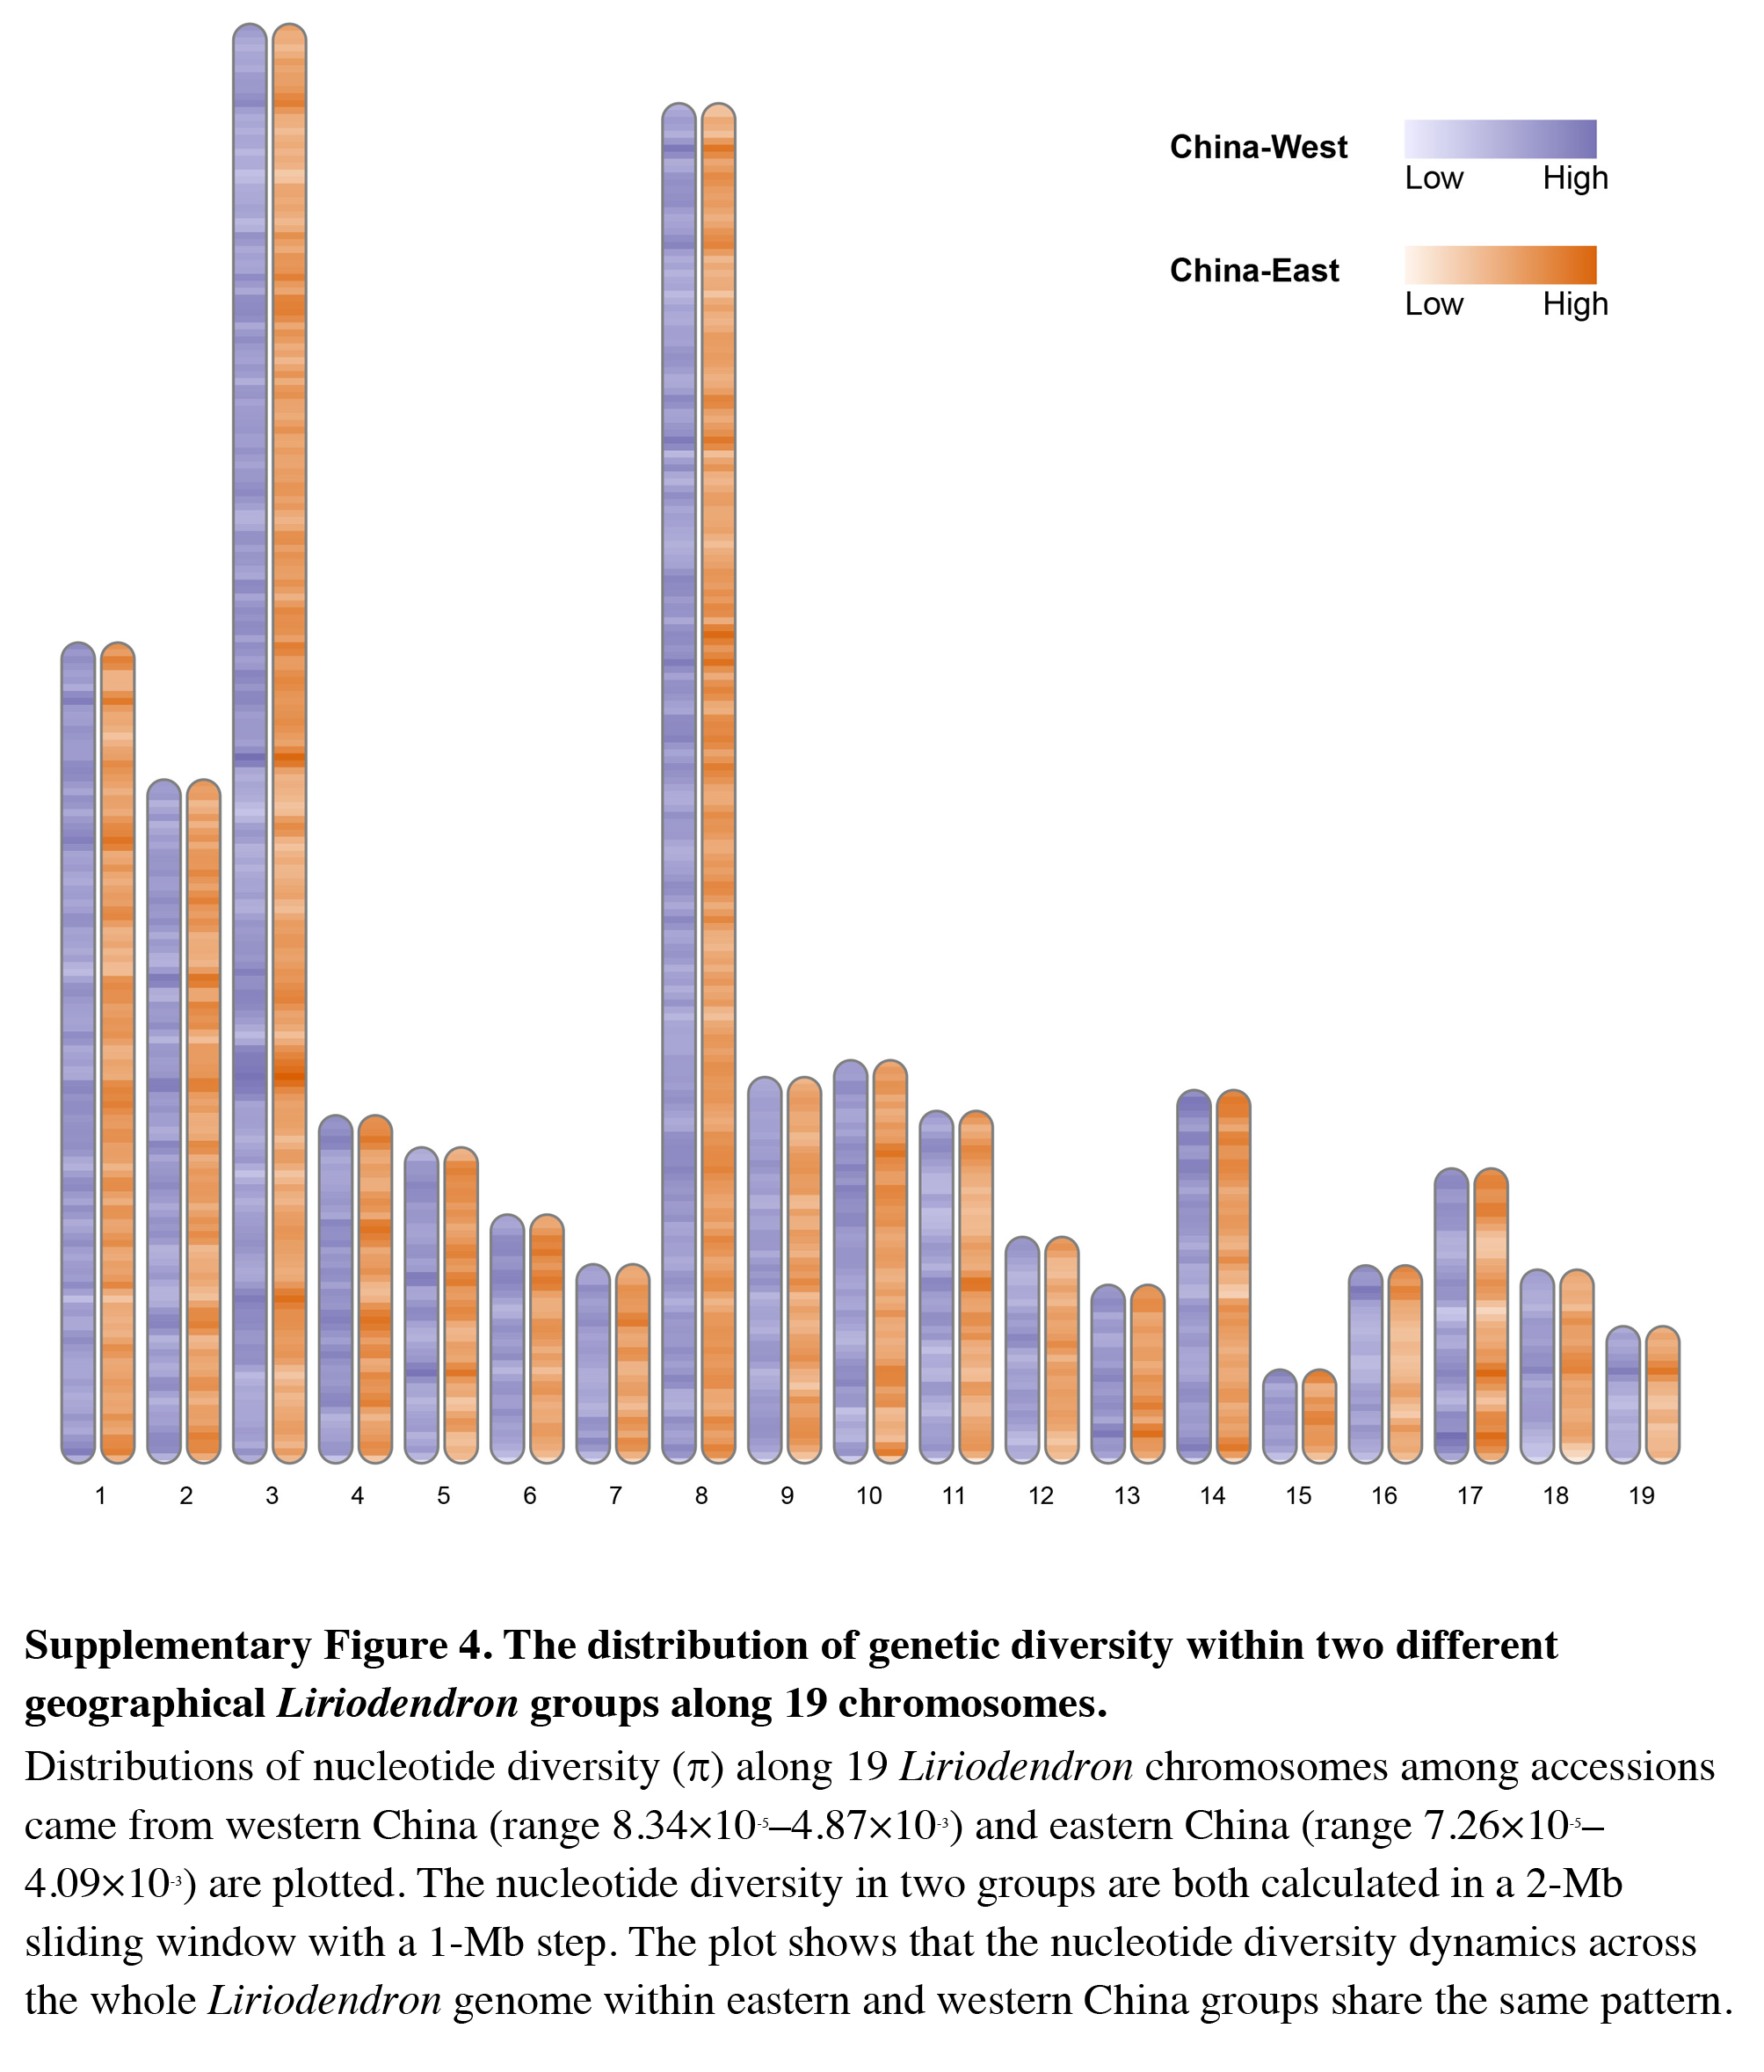
Supplementary Figure 4: The distribution of genetic diversity within two different geographical Liriodendrongroups along 19 chromosomes
Distributions of nucleotide diversity (p) along 19 Liriodendronchromosomes among accessions came from western China (range 8.34×10⁻⁵–4.87×10⁻³) and eastern China (range 7.26×10⁻⁵–4.09×10⁻³) are plotted. The nucleotide diversity in two groups are both calculated in a 2-Mb sliding window with a 1-Mb step. The plot shows that the nucleotide diversity dynamics across the whole Liriodendrongenome within eastern and western China groups share the same pattern.