A Sparse-Modeling based approach for Class-Specific feature selection
- Published
- Accepted
- Subject Areas
- Bioinformatics, Data Mining and Machine Learning
- Keywords
- feature selection, sparse coding, bioinformatics, dictionary learning, ensemble learning
- Copyright
- © 2019 Nardone et al.
- Licence
- This is an open access article distributed under the terms of the Creative Commons Attribution License, which permits unrestricted use, distribution, reproduction and adaptation in any medium and for any purpose provided that it is properly attributed. For attribution, the original author(s), title, publication source (PeerJ Preprints) and either DOI or URL of the article must be cited.
- Cite this article
- 2019. A Sparse-Modeling based approach for Class-Specific feature selection. PeerJ Preprints 7:e27740v1 https://doi.org/10.7287/peerj.preprints.27740v1
Abstract
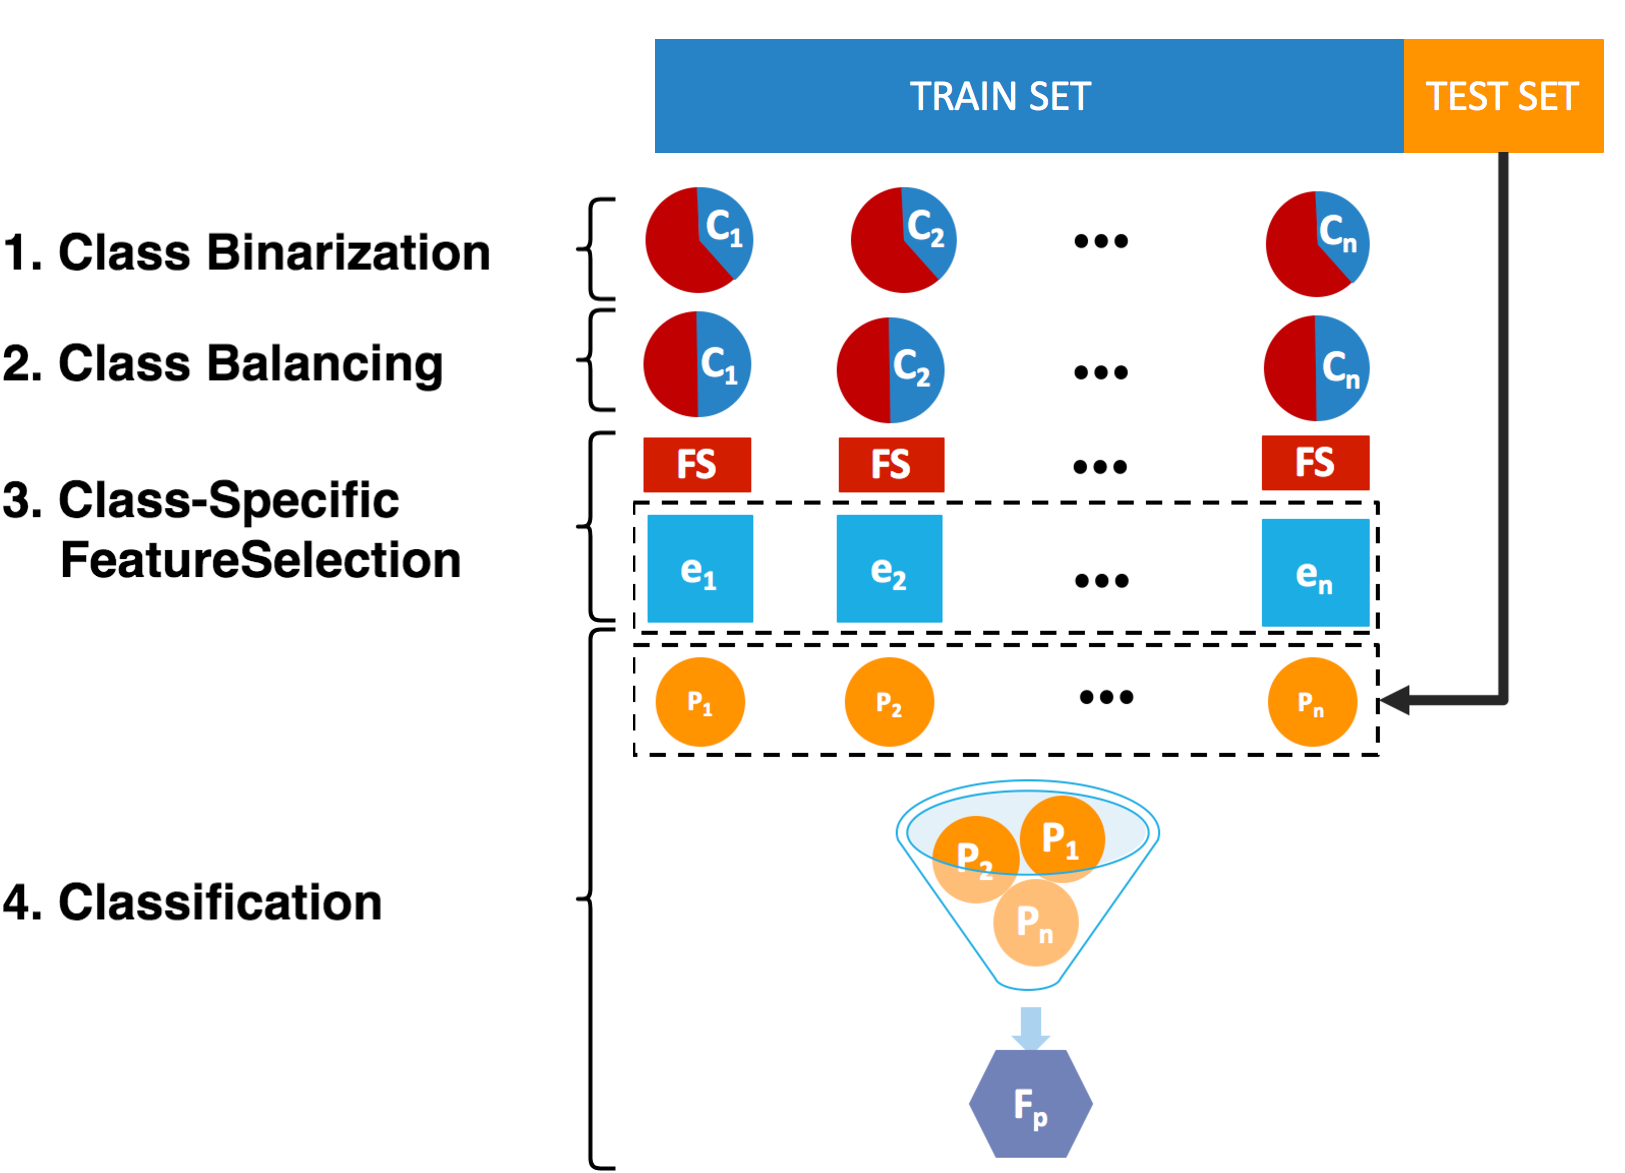
In this work, we propose a novel Feature Selection framework, called Sparse-Modeling Based Approach for Class Specific Feature Selection (SMBA-CSFS), that simultaneously exploits the idea of Sparse Modeling and Class-Specific Feature Selection. Feature selection plays a key role in several fields (e.g., computational biology), making it possible to treat models with fewer variables which, in turn, are easier to explain, by providing valuable insights on the importance of their role, and might speed the experimental validation up. Unfortunately, also corroborated by the no free lunch theorems, none of the approaches in literature is the most apt to detect the optimal feature subset for building a final model, thus it still represents a challenge. The proposed feature selection procedure conceives a two steps approach: (a) a sparse modeling-based learning technique is first used to find the best subset of features, for each class of a training set; (b) the discovered feature subsets are then fed to a class-specific feature selection scheme, in order to assess the effectiveness of the selected features in classification tasks. To this end, an ensemble of classifiers is built, where each classifier is trained on its own feature subset discovered in the previous phase, and a proper decision rule is adopted to compute the ensemble responses. In order to evaluate the performance of the proposed method, extensive experiments have been performed on publicly available datasets, in particular belonging to the computational biology field where feature selection is indispensable: the acute lymphoblastic leukemia and acute myeloid leukemia, the human carcinomas, the human lung carcinomas, the diffuse large B-cell lymphoma, and the malignant glioma. SMBA-CSFS is able to identify/retrieve the most representative features that maximize the classification accuracy. With top 20 and 80 features, SMBA-CSFS exhibits a promising performance when compared to its competitors from literature, on all considered datasets, especially those with a higher number of features. Experiments show that the proposed approach might outperform the state-of-the-art methods when the number of features is high. For this reason, the introduced approach proposes itself for selection and classification of data with a large number of features and classes.
Author Comment
This is a submission to PeerJ Computer Science for review.
Supplemental Information
A General Framework for Class-Specific Feature Selection
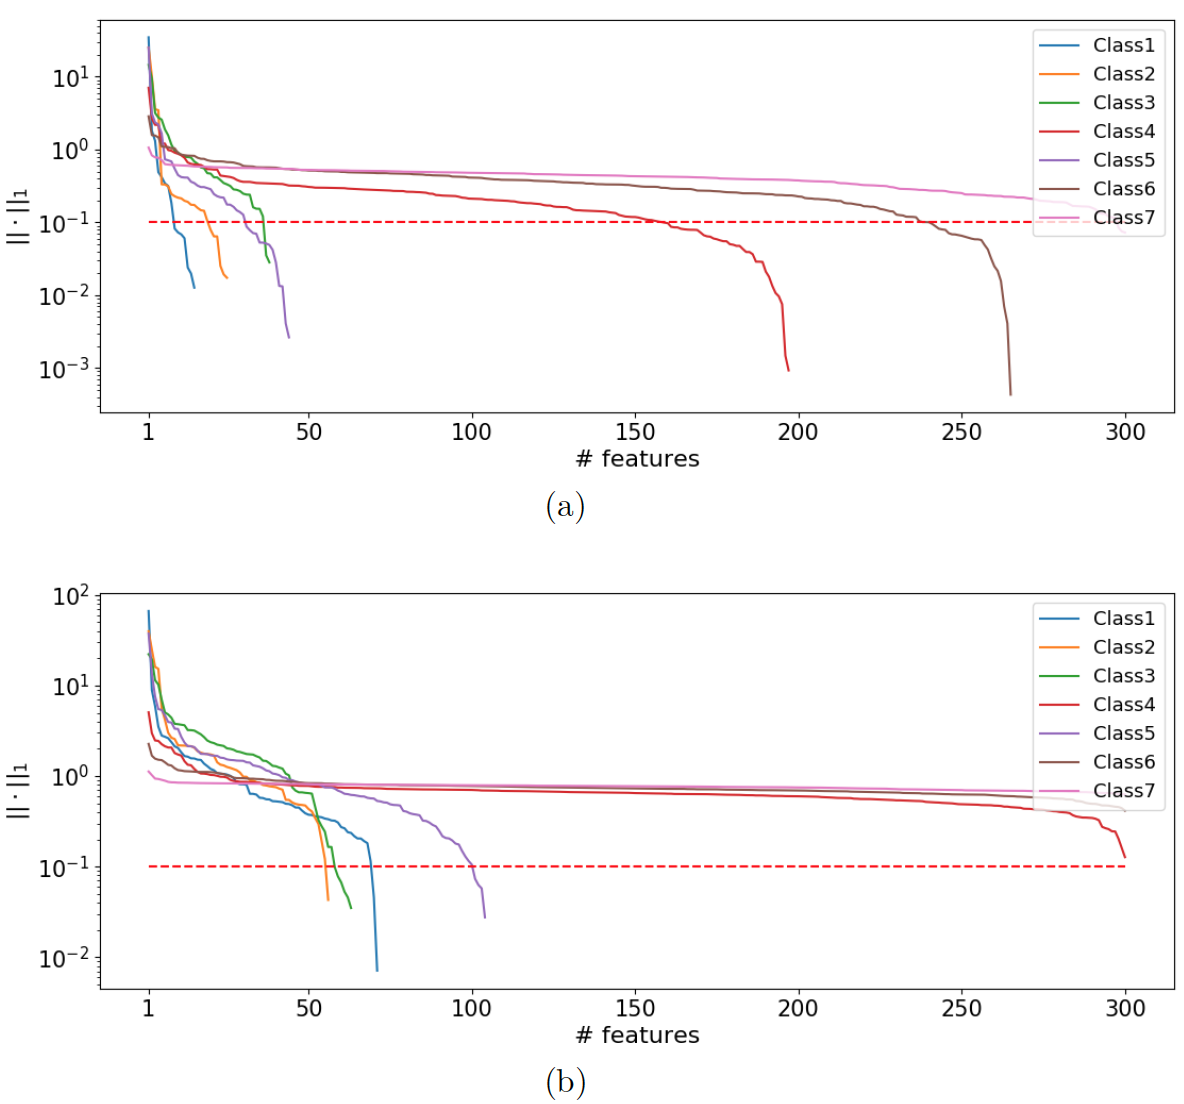
Cumulative sum of the rows of matrix C in descending order of ||•||1. The regularization parameter in eq. 7 is set to 20 and 50, respectively
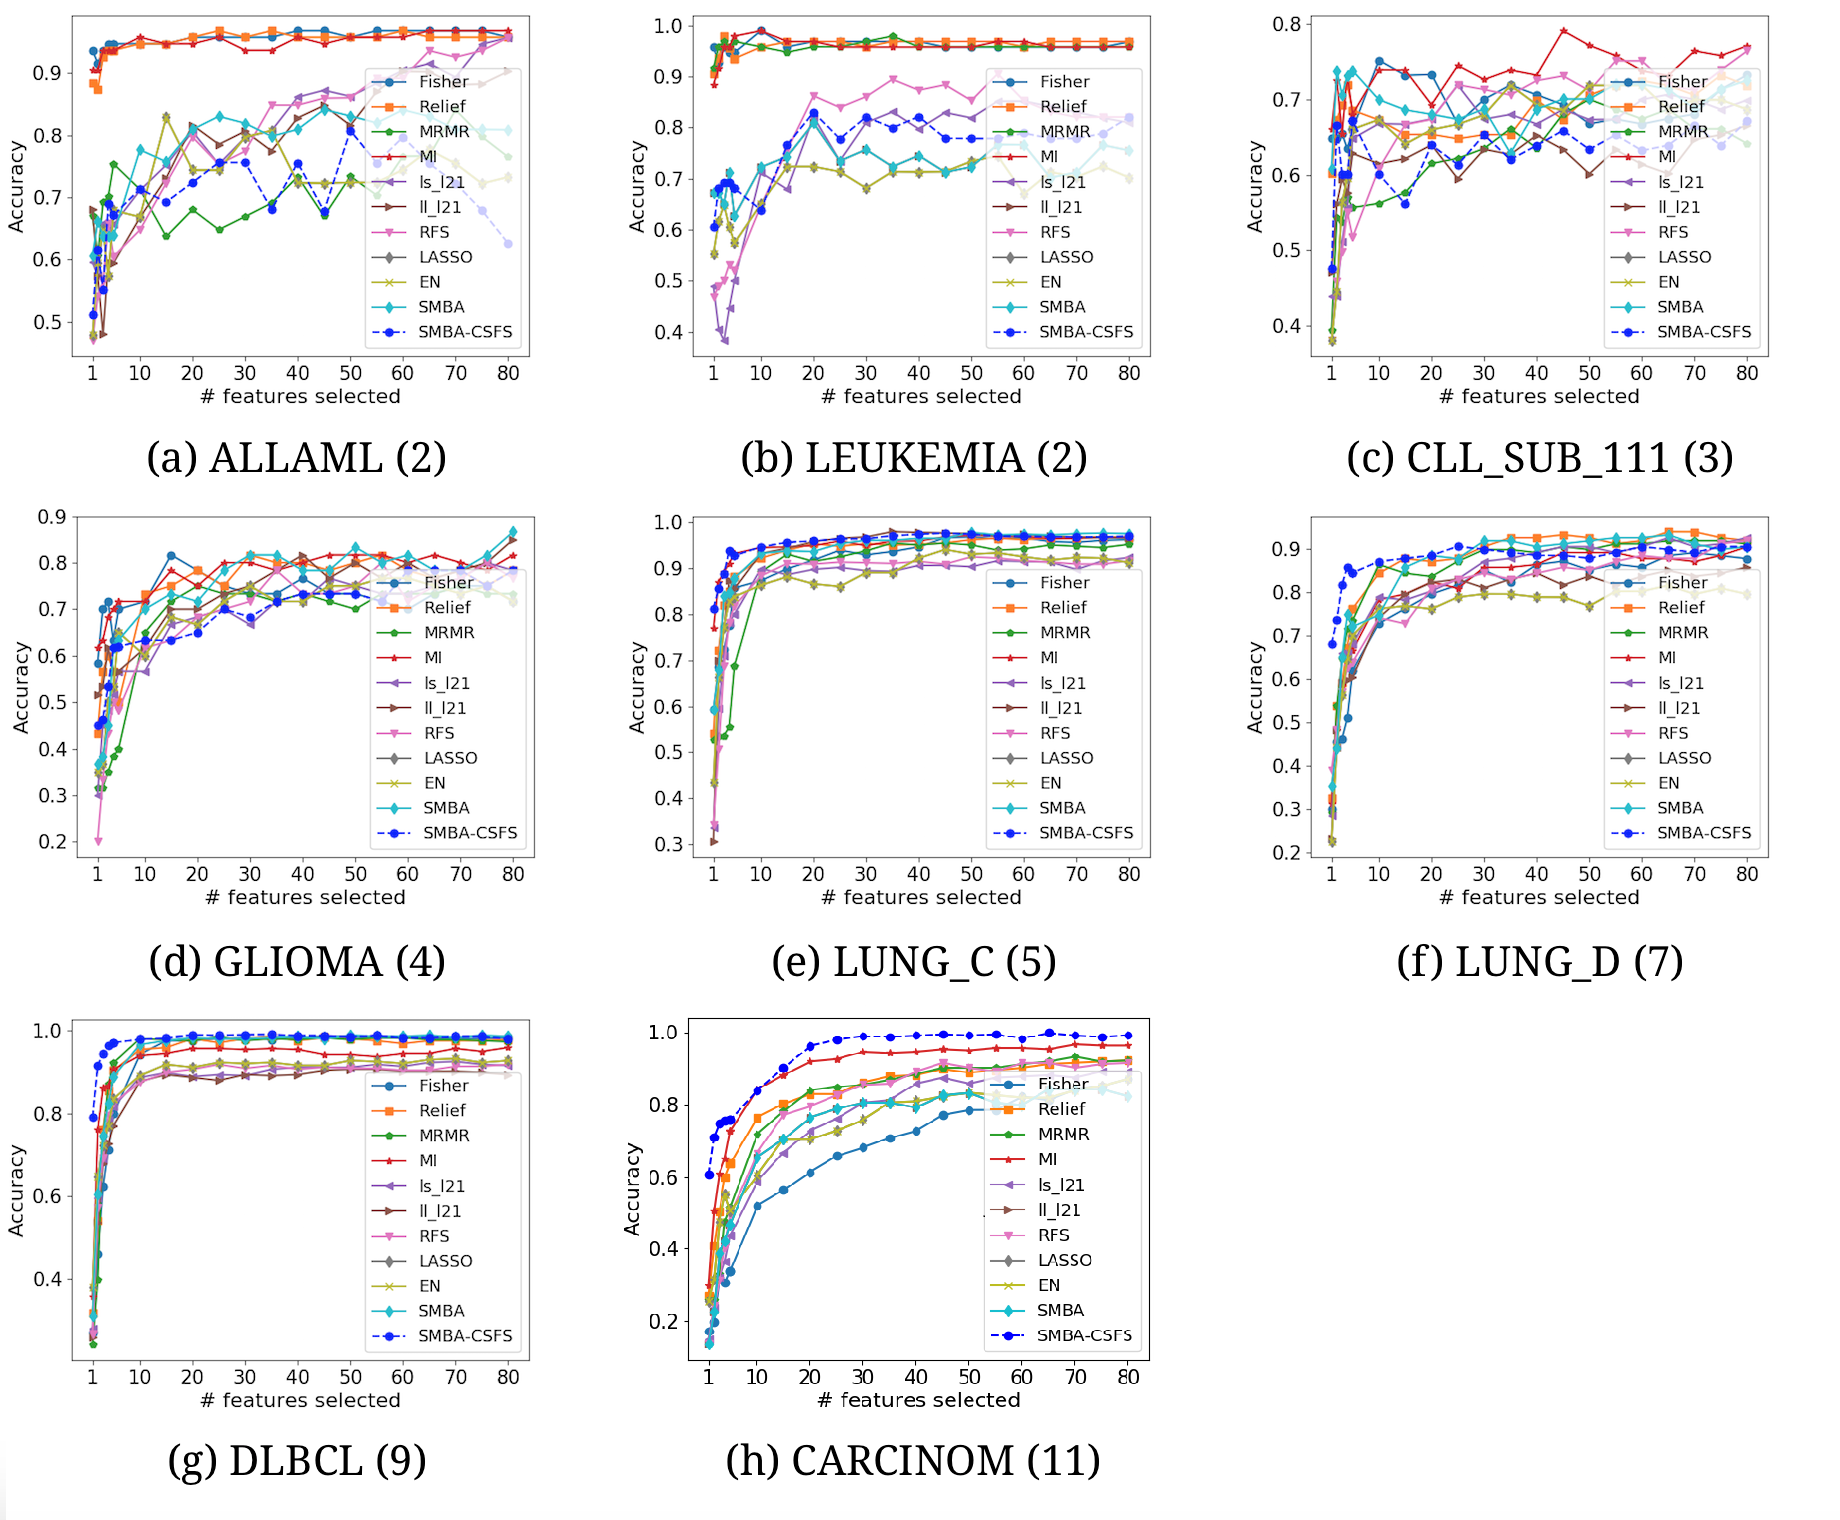
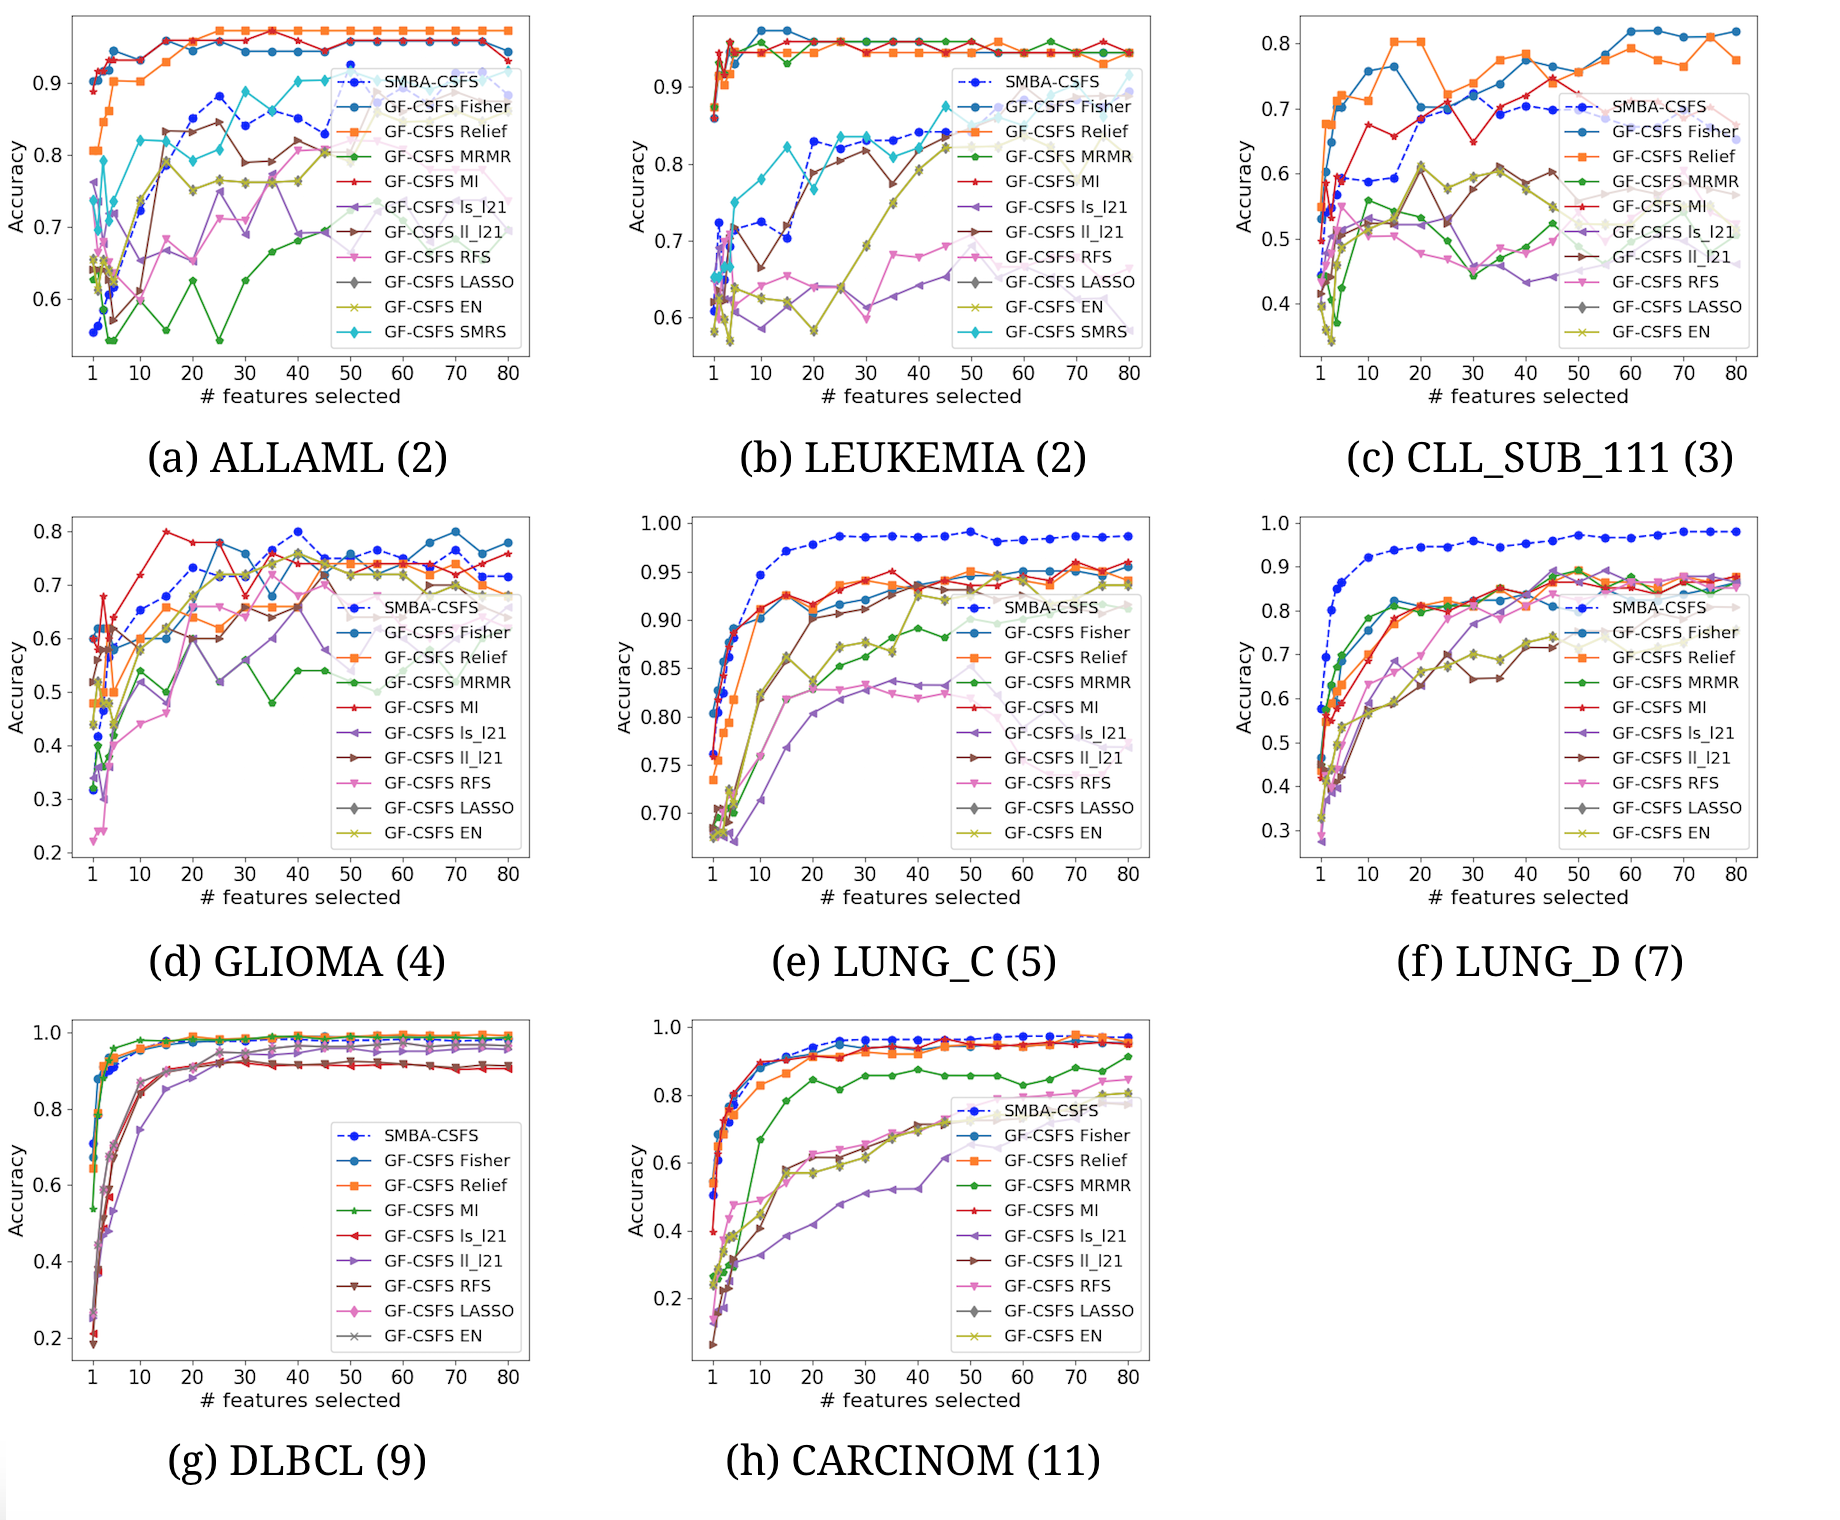
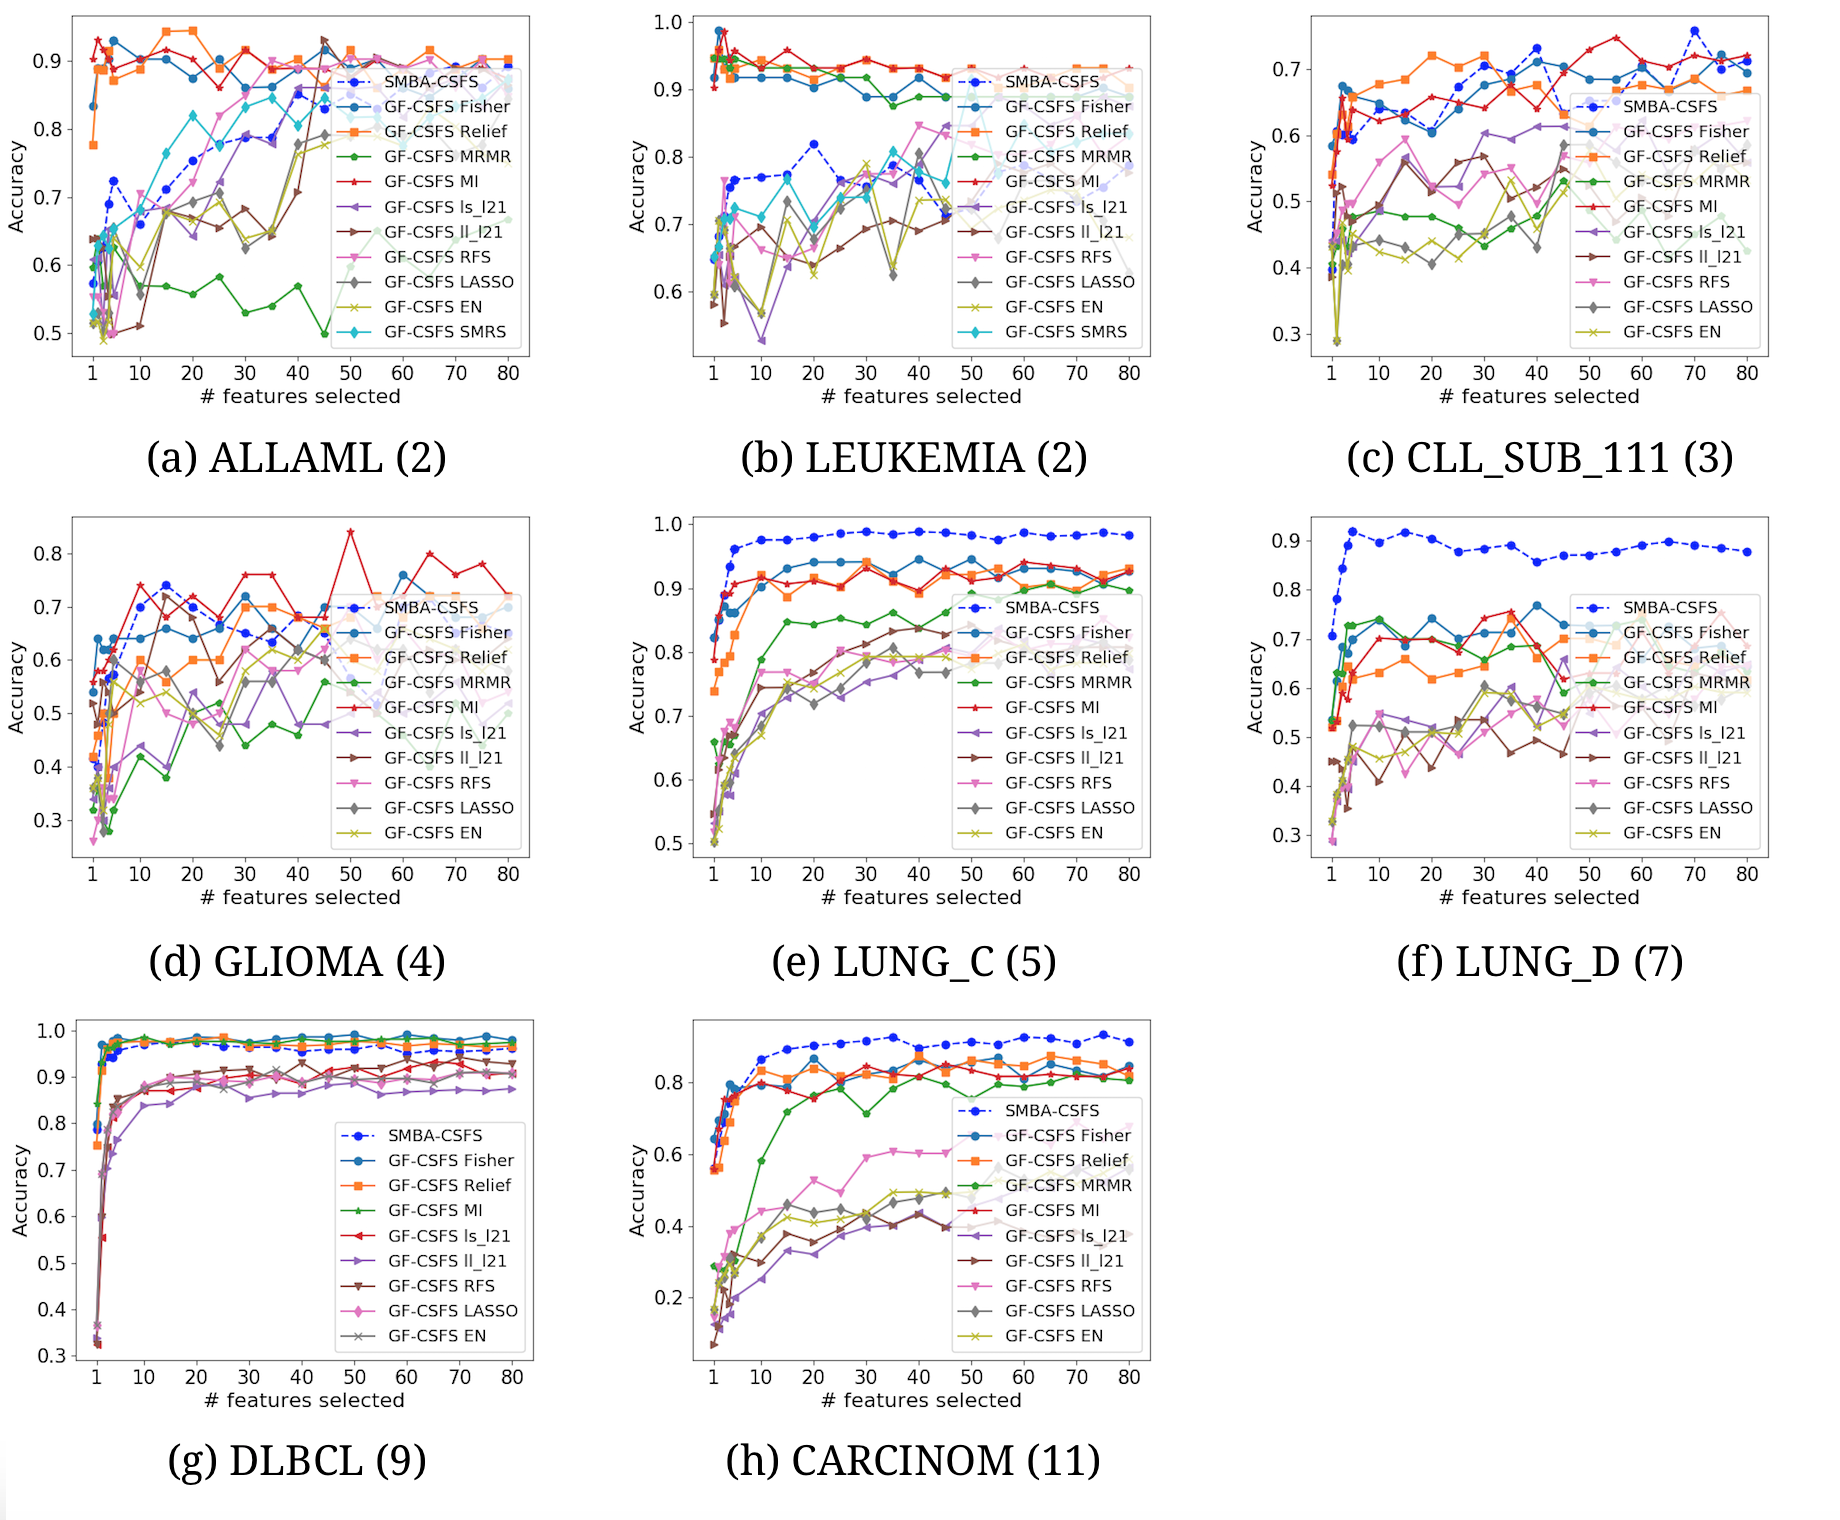
Comparison of several CSFS accuracies against SMBA-CSFS on eight datasets, when a varying number of features is selected. KNN classifier with 5-fold CV was used
Comparison of several CSFS accuracies against SMBA-CSFS on eight datasets, when a varying number of features is selected. KNN classifier with 5-fold CV was used
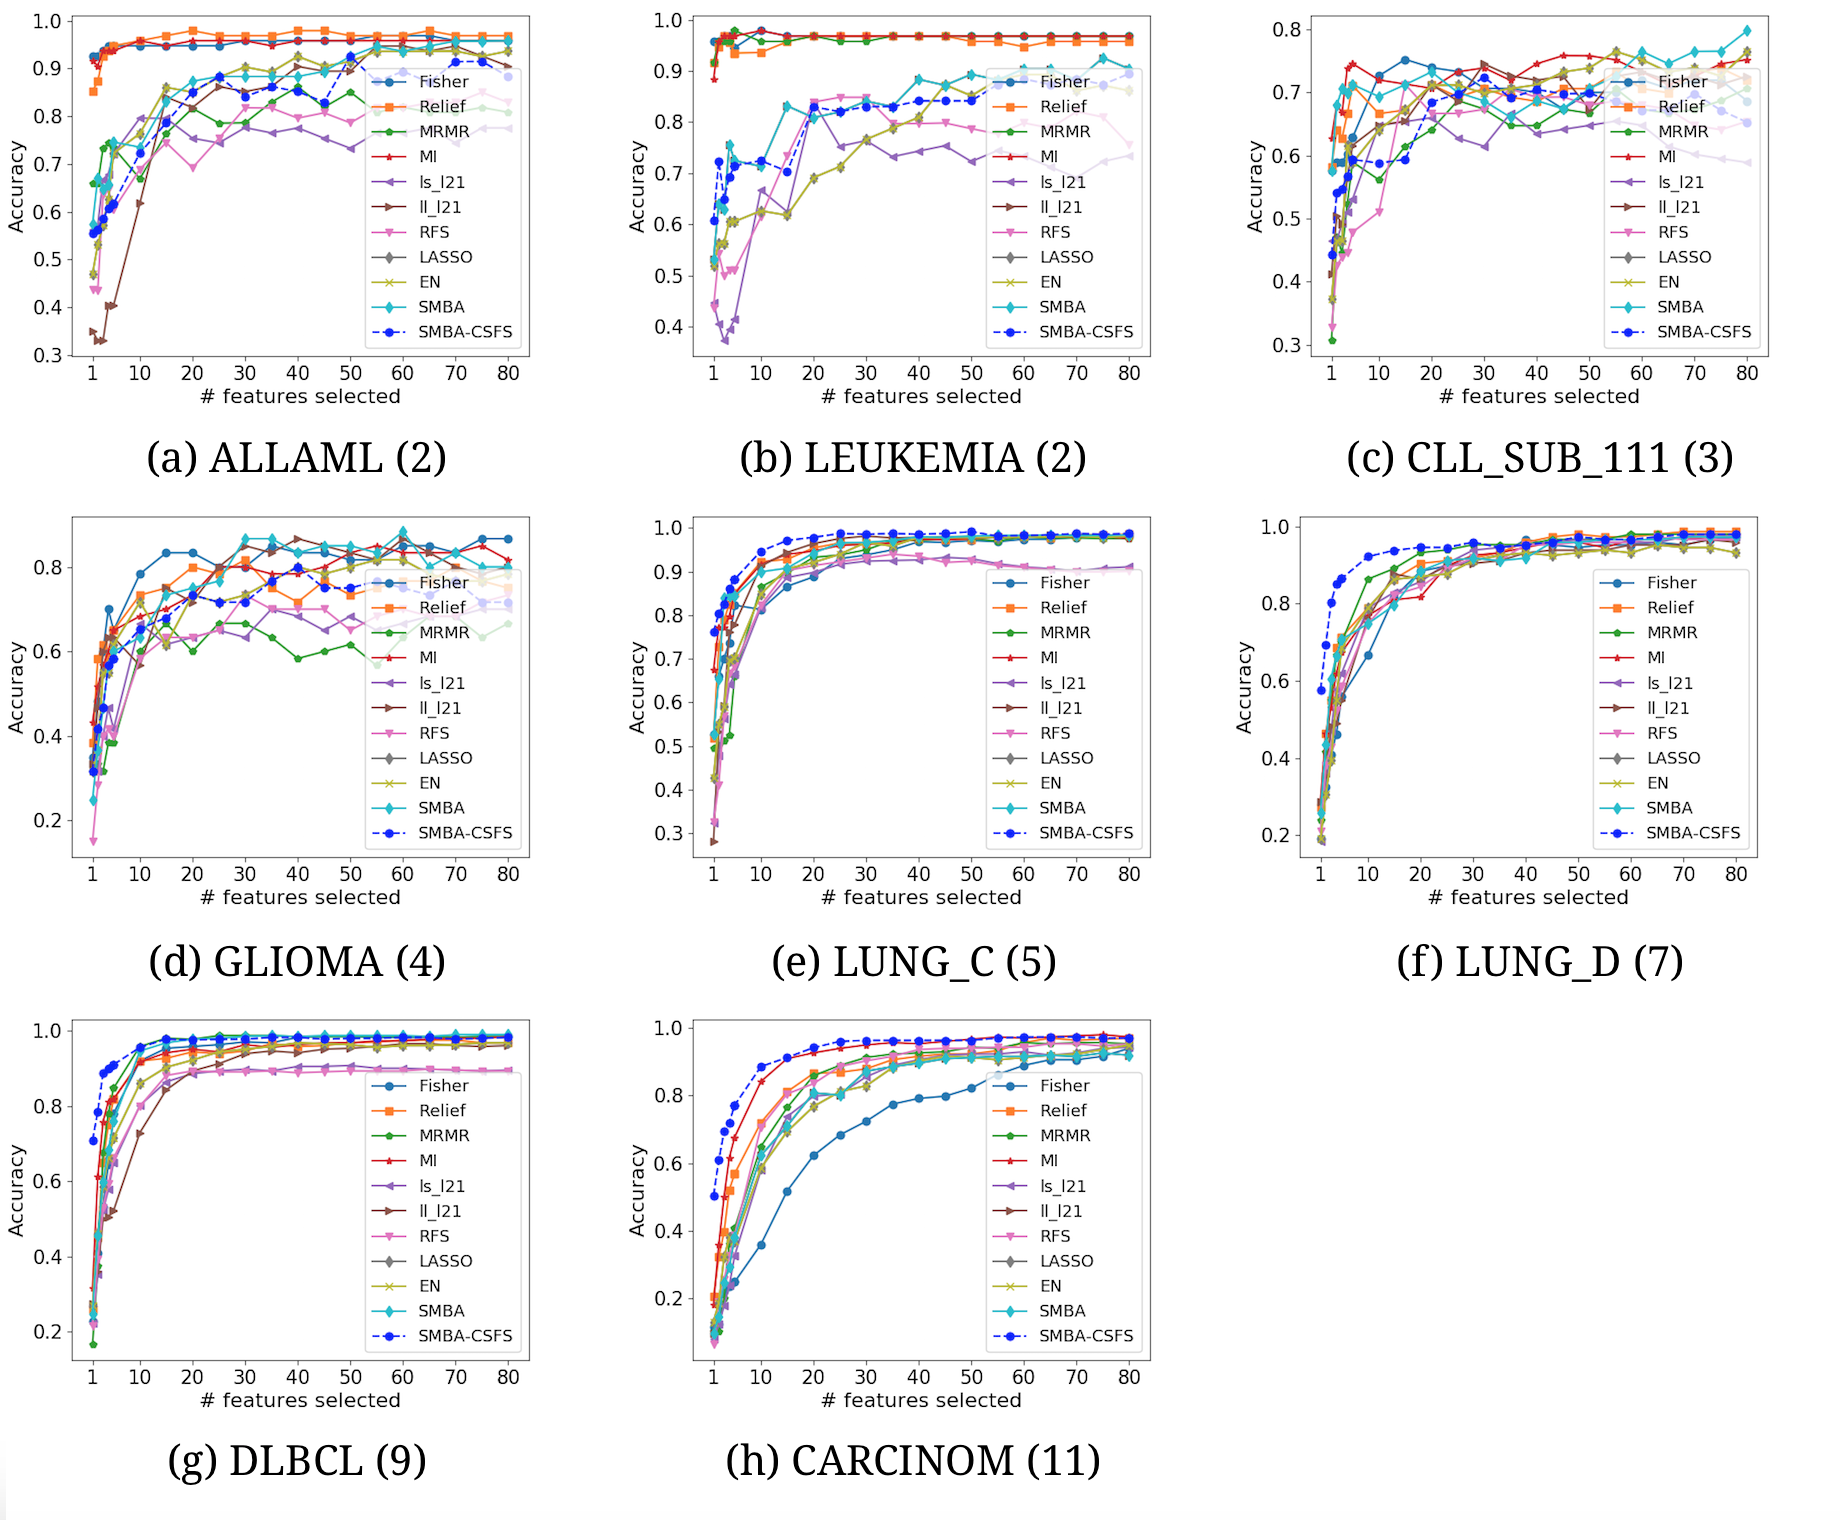
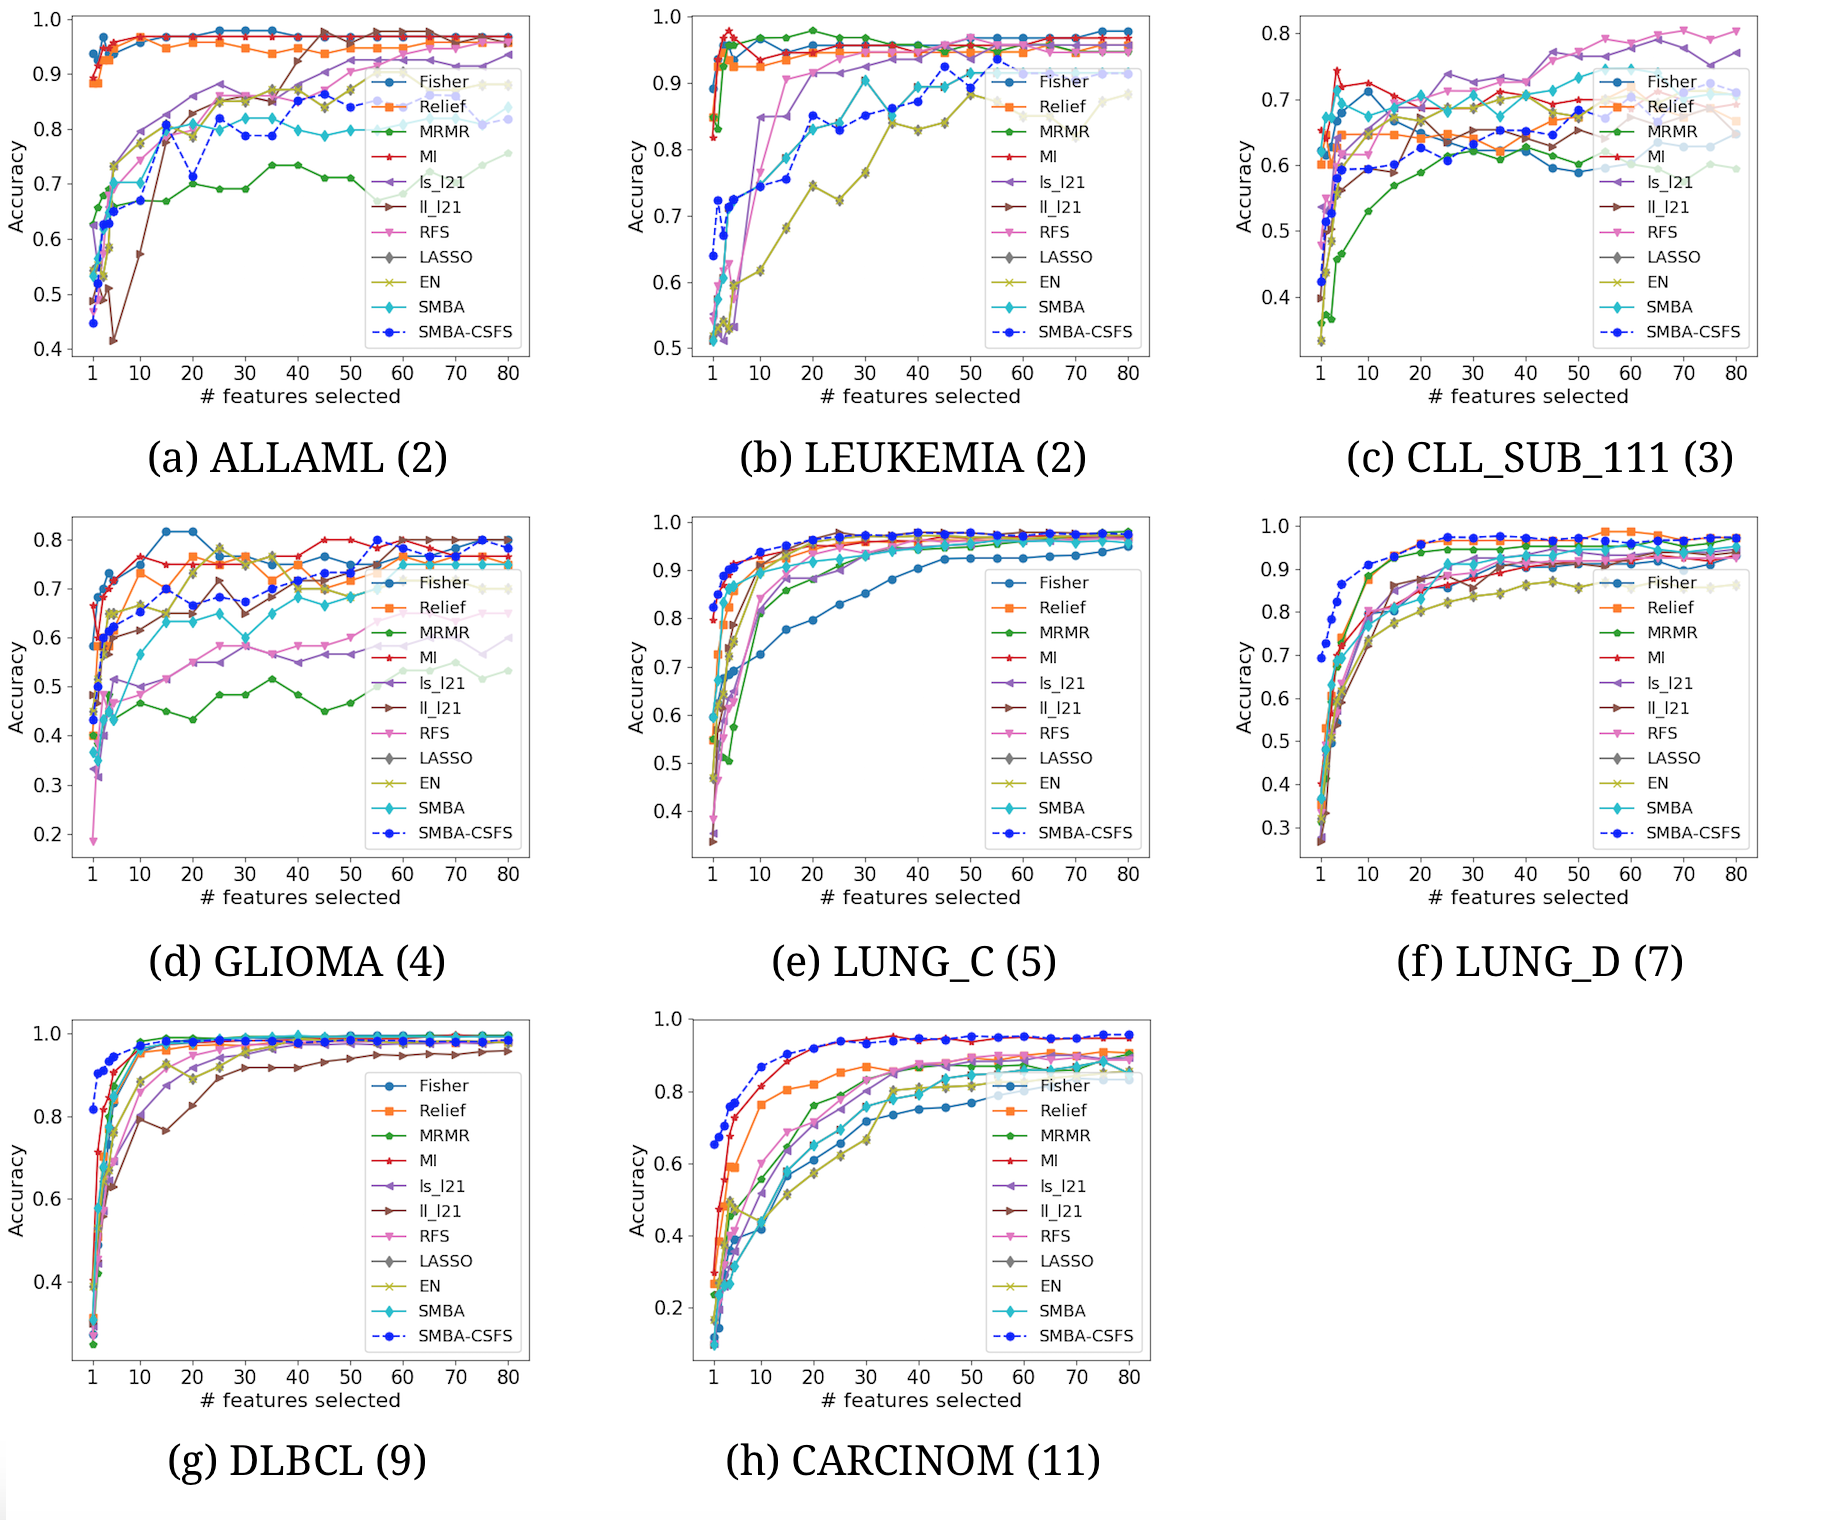
Comparison of several TFS accuracies against SMBA and SMBA-CSFS on eight datasets, when a varying number of features is selected. Logistic Regression classifier with 5-fold CV was used
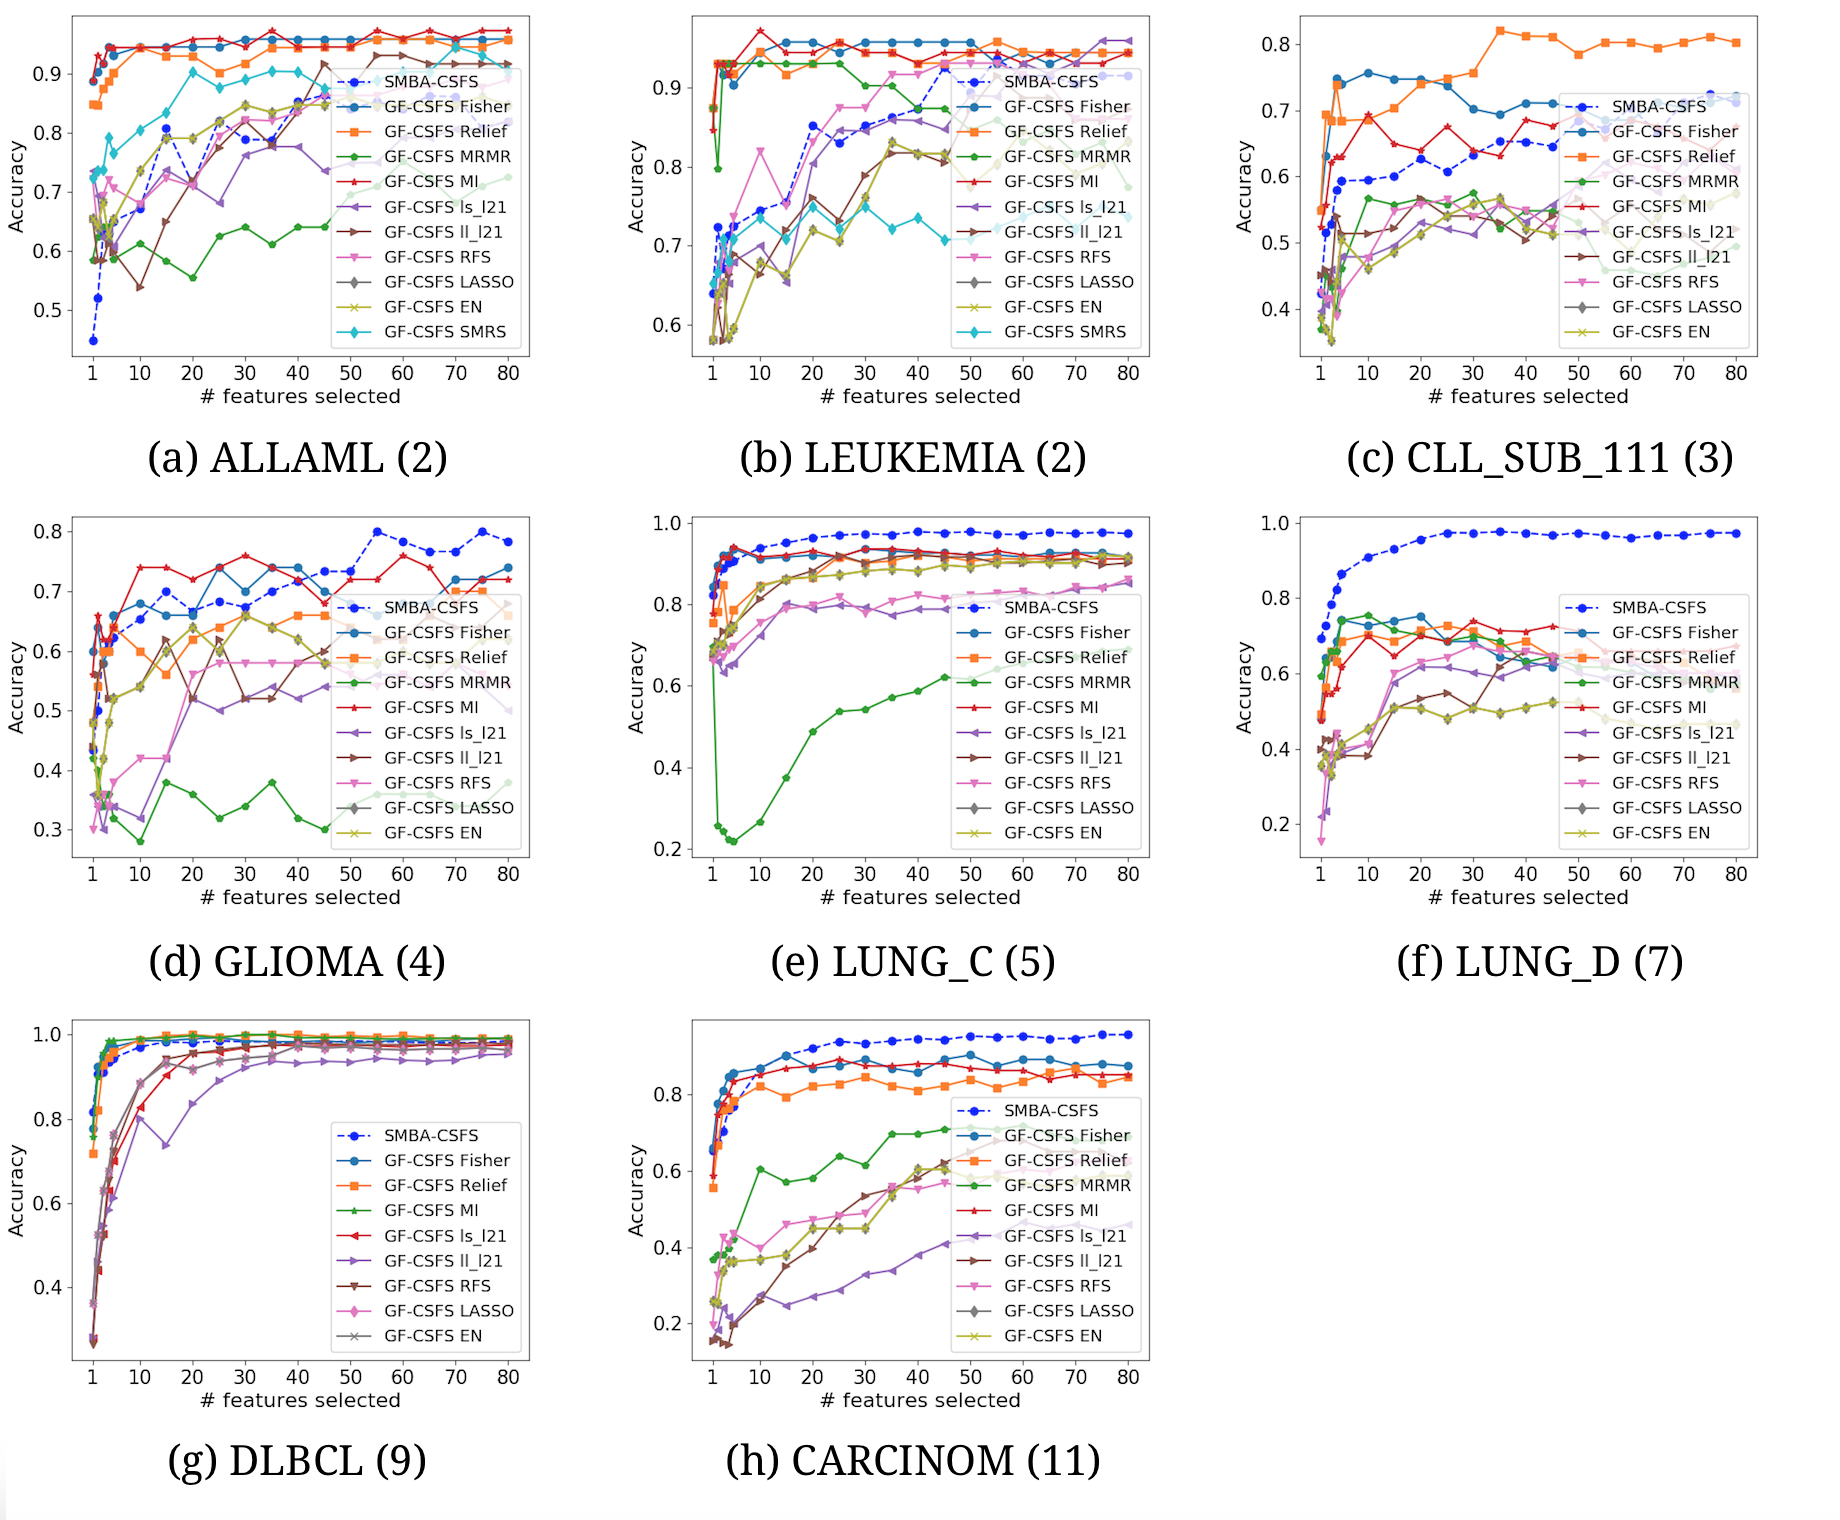
Comparison of several CSFS accuracies against SMBA-CSFS on eight datasets, when a varying number of features is selected. Logistic Regression classifier with 5-fold CV was used
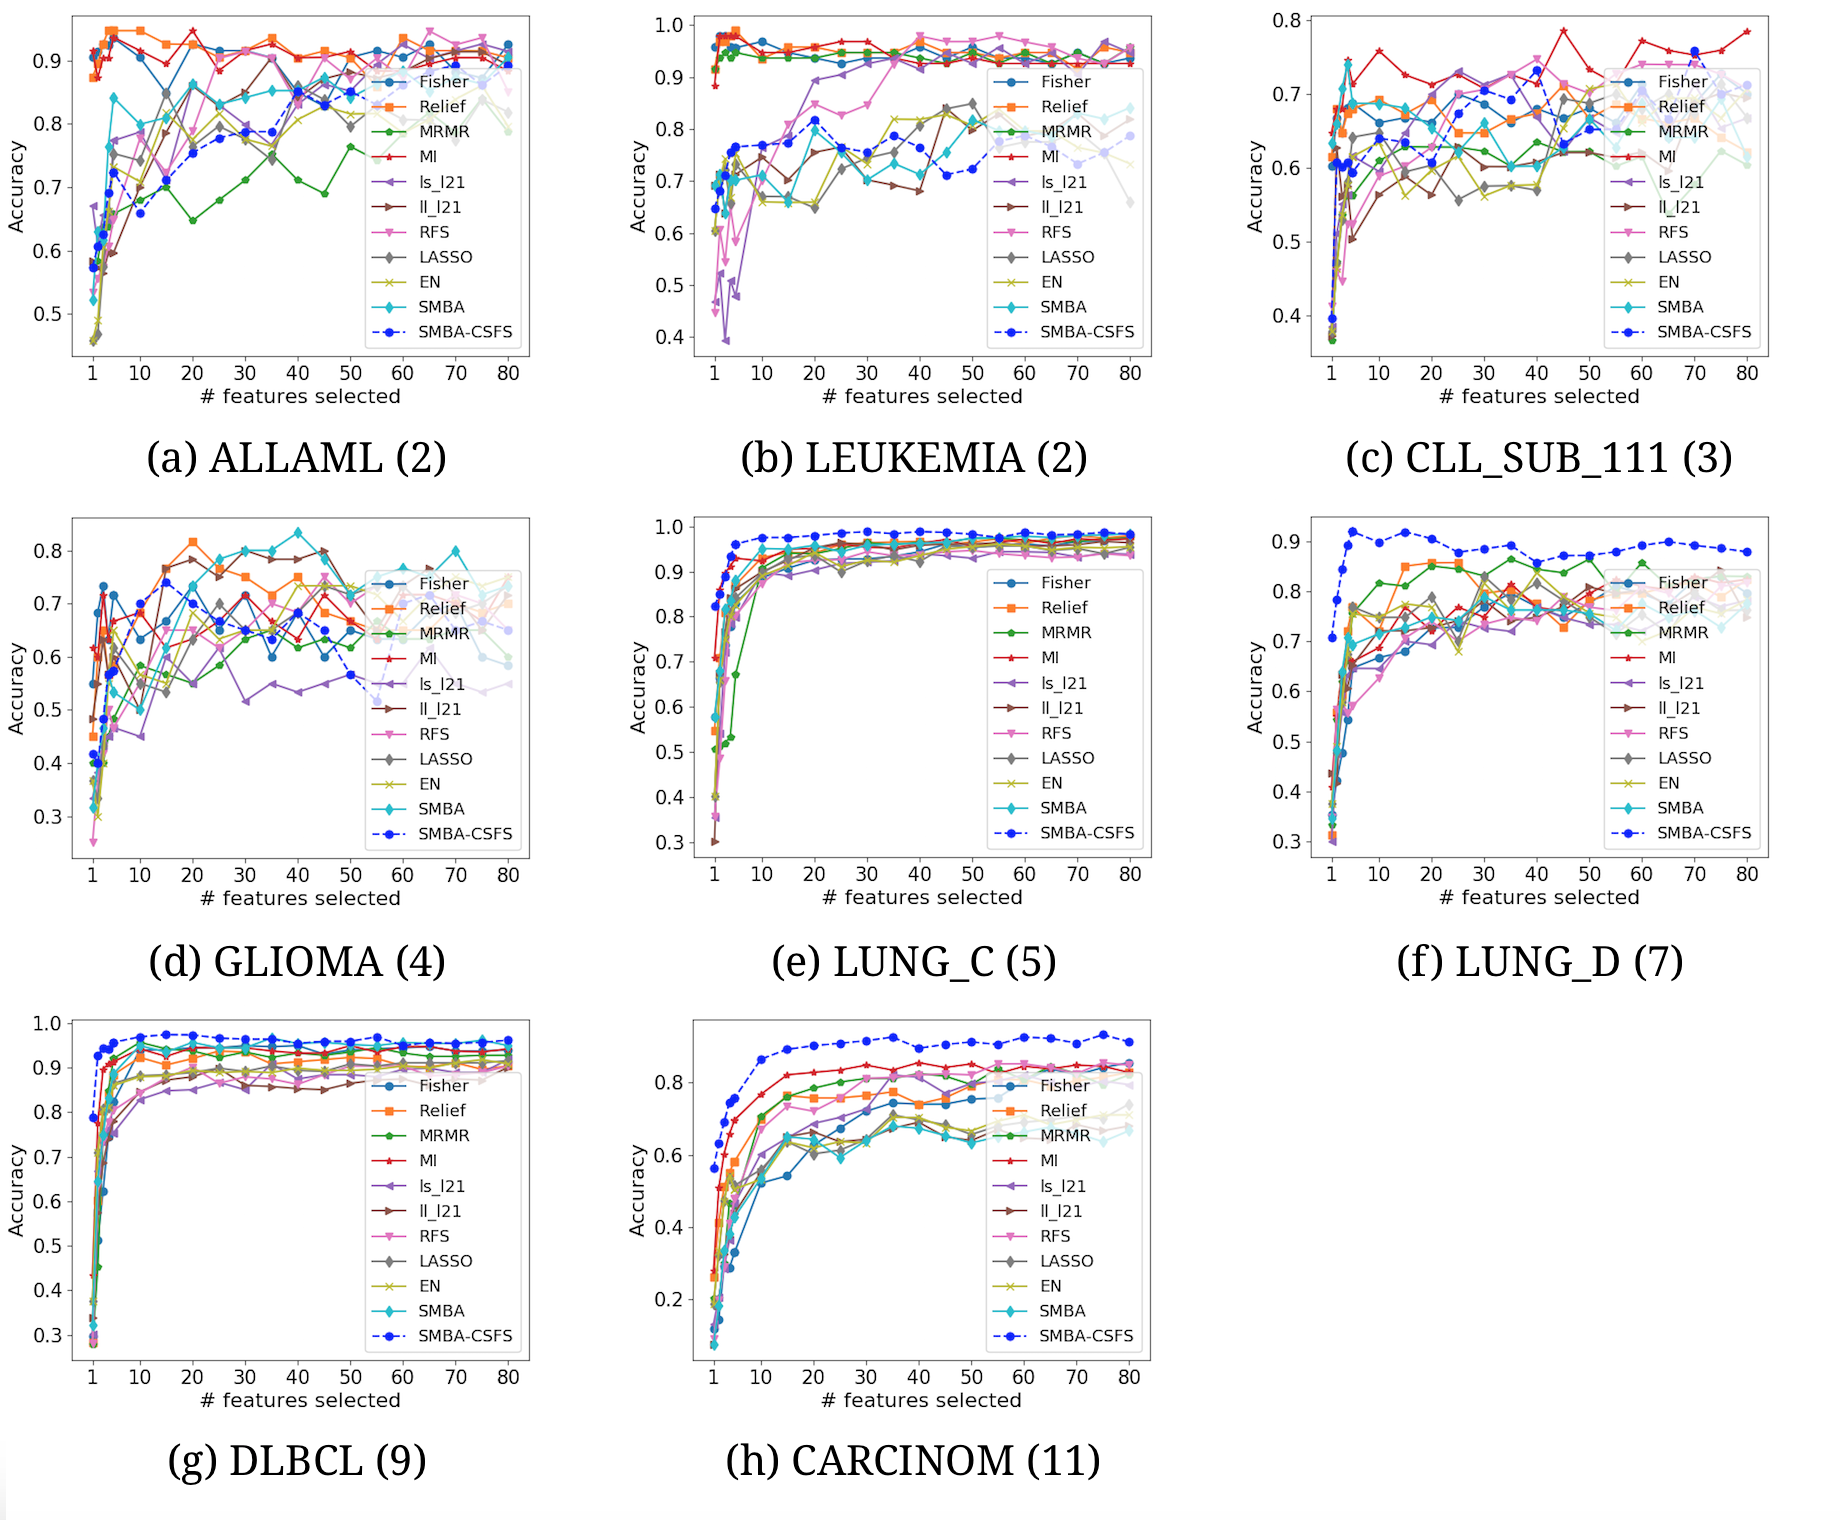
Comparison of several CSFS accuracies against SMBA-CSFS on eight datasets, when a varying number of features is selected. Naive Bayes classifier with 5-fold CV was used
Comparison of several CSFS accuracies against SMBA-CSFS on eight datasets, when a varying number of features is selected. Naive Nayes classifier with 5-fold CV was used
Comparison of several TFS accuracies against SMBA and SMBA-CSFS on eight datasets, when a varying number of features is selected. Decision Tree classifier with 5-fold CV was used
Comparison of several CSFS accuracies against SMBA-CSFS on eight datasets, when a varying number of features is selected. Decision Tree classifier with 5-fold CV was used
Supplemental Tables - KNN
In the Excel file we have reported the accuracy results on top 20 and 80 selected features by using the KNN classifier, comparing TFS vs SMBA-CSFS and GF-CSFS vs SMBA-CSFS. We also have reported the Friedman test to rank the algorithms’ performance across multiple datasets, taking into account the accuracy results achieved on subsets of 20 and 80. This involves ranking each row together and then considering the values of ranks by columns where the best performing algorithm gets the rank of 1, the second best rank 2 and so on. In addition, we have reported the Cumulative Rank(CR) considering either all the dataset or a subset of them (CR≥5). Finally, a Nemenyi post-hoc test (all vs all) is ran to compare all the other methods against SMBA-CSFS with the aim to determine which groups are significantly different, with respect to SMBA-CSFS. The significance level α is set to 5%. We have provided the ranking of the classification procedures based on TFS against SMBA-CSFS, for the top 20 and 80 features and the p-values corresponding. We also provided the ranking of the classification procedures based on GF-CSFS against SMBA-CSFS, for the top 20 and 80 features, respectively along with the corresponding p-values tables.
Supplemental_Tables - Logistic Regression
In the Excel file we have reported the accuracy results on top 20 and 80 selected features by using the Logistic Regression classifier, comparing TFS vs SMBA-CSFS and GF-CSFS vs SMBA-CSFS. We also have reported the Friedman test to rank the algorithms’ performance across multiple datasets, taking into account the accuracy results achieved on subsets of 20 and 80. This involves ranking each row together and then considering the values of ranks by columns where the best performing algorithm gets the rank of 1, the second best rank 2 and so on. In addition, we have reported the Cumulative Rank(CR) considering either all the dataset or a subset of them (CR≥5). Finally, a Nemenyi post-hoc test (all vs all) is ran to compare all the other methods against SMBA-CSFS with the aim to determine which groups are significantly different, with respect to SMBA-CSFS. The significance level α is set to 5%. We have provided the ranking of the classification procedures based on TFS against SMBA-CSFS, for the top 20 and 80 features and the p-values corresponding. We also provided the ranking of the classification procedures based on GF-CSFS against SMBA-CSFS, for the top 20 and 80 features, respectively along with the corresponding p-values tables.
Supplemental_Tables - Naive Bayes
In the Excel file we have reported the accuracy results on top 20 and 80 selected features by using the Naive Bayes classifier, comparing TFS vs SMBA-CSFS and GF-CSFS vs SMBA-CSFS. We also have reported the Friedman test to rank the algorithms’ performance across multiple datasets, taking into account the accuracy results achieved on subsets of 20 and 80. This involves ranking each row together and then considering the values of ranks by columns where the best performing algorithm gets the rank of 1, the second best rank 2 and so on. In addition, we have reported the Cumulative Rank(CR) considering either all the dataset or a subset of them (CR≥5). Finally, a Nemenyi post-hoc test (all vs all) is ran to compare all the other methods against SMBA-CSFS with the aim to determine which groups are significantly different, with respect to SMBA-CSFS. The significance level α is set to 5%. We have provided the ranking of the classification procedures based on TFS against SMBA-CSFS, for the top 20 and 80 features and the p-values corresponding. We also provided the ranking of the classification procedures based on GF-CSFS against SMBA-CSFS, for the top 20 and 80 features, respectively along with the corresponding p-values tables.
Supplemental_Tables - Decision Tree
In the Excel file we have reported the accuracy results on top 20 and 80 selected features by using the Decision Tree classifier, comparing TFS vs SMBA-CSFS and GF-CSFS vs SMBA-CSFS. We also have reported the Friedman test to rank the algorithms’ performance across multiple datasets, taking into account the accuracy results achieved on subsets of 20 and 80. This involves ranking each row together and then considering the values of ranks by columns where the best performing algorithm gets the rank of 1, the second best rank 2 and so on. In addition, we have reported the Cumulative Rank(CR) considering either all the dataset or a subset of them (CR≥5). Finally, a Nemenyi post-hoc test (all vs all) is ran to compare all the other methods against SMBA-CSFS with the aim to determine which groups are significantly different, with respect to SMBA-CSFS. The significance level α is set to 5%. We have provided the ranking of the classification procedures based on TFS against SMBA-CSFS, for the top 20 and 80 features and the p-values corresponding. We also provided the ranking of the classification procedures based on GF-CSFS against SMBA-CSFS, for the top 20 and 80 features, respectively along with the corresponding p-values tables.