Albumin promotes proliferation of G1 arrested serum starved hepatocellular carcinoma cells
- Published
- Accepted
- Subject Areas
- Biochemistry, Biotechnology, Cell Biology, Molecular Biology
- Keywords
- Albumin, Hepatocellular carcinoma, HepG2/C3A cells, Cell cycle, TUNEL assay, Ethidium bromide staining, Proliferation
- Copyright
- © 2019 Ibrahim et al.
- Licence
- This is an open access article distributed under the terms of the Creative Commons Attribution License, which permits unrestricted use, distribution, reproduction and adaptation in any medium and for any purpose provided that it is properly attributed. For attribution, the original author(s), title, publication source (PeerJ Preprints) and either DOI or URL of the article must be cited.
- Cite this article
- 2019. Albumin promotes proliferation of G1 arrested serum starved hepatocellular carcinoma cells. PeerJ Preprints 7:e27728v1 https://doi.org/10.7287/peerj.preprints.27728v1
Abstract
Albumin is the most abundant plasma protein and functions as a transport molecule that continuously interacts with various cell types. Because of these properties, albumin has been exploited by the pharmaceutical industry to improve drug delivery to target cells. Understanding the immediate effects of albumin on cells is however limited. The cell interacting properties and pharmaceutical applications of albumin incentivises continual research into the immediate effects of albumin on cells. The HepG2/C3A hepatocellular carcinoma cell line is used as a model for studying cancer pathology as well as liver biosynthesis and cellular responses to drugs. Here we investigated the direct effect of purified albumin on HepG2/C3A cell proliferation in the absence of serum, growth factors and other serum originating albumin bound molecules. We demonstrated that serum starvation causes HepG2/C3A cell numbers to stagnate, whereas inclusion of albumin allows an increase in cell numbers. Cell cycle analysis demonstrated that the percentage of cells in G1 phase during serum starvation was reduced by the inclusion of albumin whereas percentage of cells in S phase was increased. We have also observed that the levels of dead cells determined by DNA fragmentation and membrane permeabilization caused by serum starvation were not significantly altered by the inclusion of albumin. Therefore, the increase in cell number was mainly caused by albumin promoting proliferation rather than protection against cell death. These primary findings demonstrate that albumin has immediate effects on HepG2/C3A hepatocellular carcinoma cells. These effects should be taken into consideration when studying the effects of albumin bound drugs or pathological ligands bound to albumin on HepG2/C3A cells.
Author Comment
This is a submission to PeerJ for review.
Supplemental Information
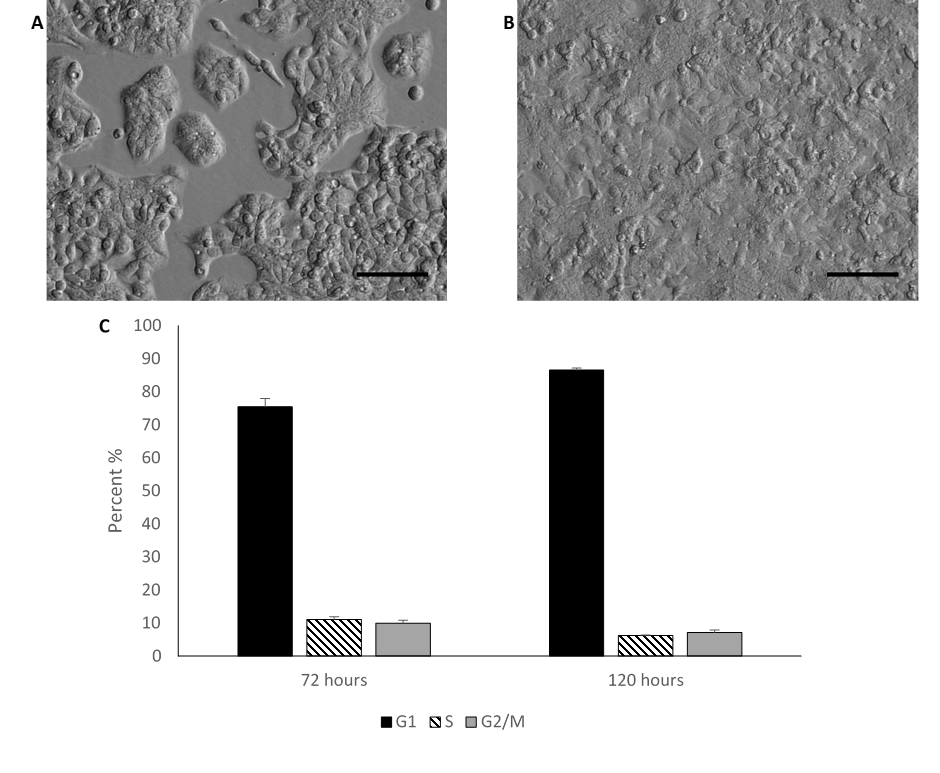
Morphology and cell counts of HepG2/C3A cells cultured in media containing 10%FBS
HEPG2/C3A cells grown in media supplemented with 10% foetal bovine serum (FBS) characteristically display a regular polygonal morphology and grow in monolayer colonies (A) after 72 hours in culture, (B) after 120 hours in culture (confluent). (C) Bar chart demonstrating the cell cycle stages calculated using the Watson pragmatic algorithm. Values are mean ± SD (n=2).
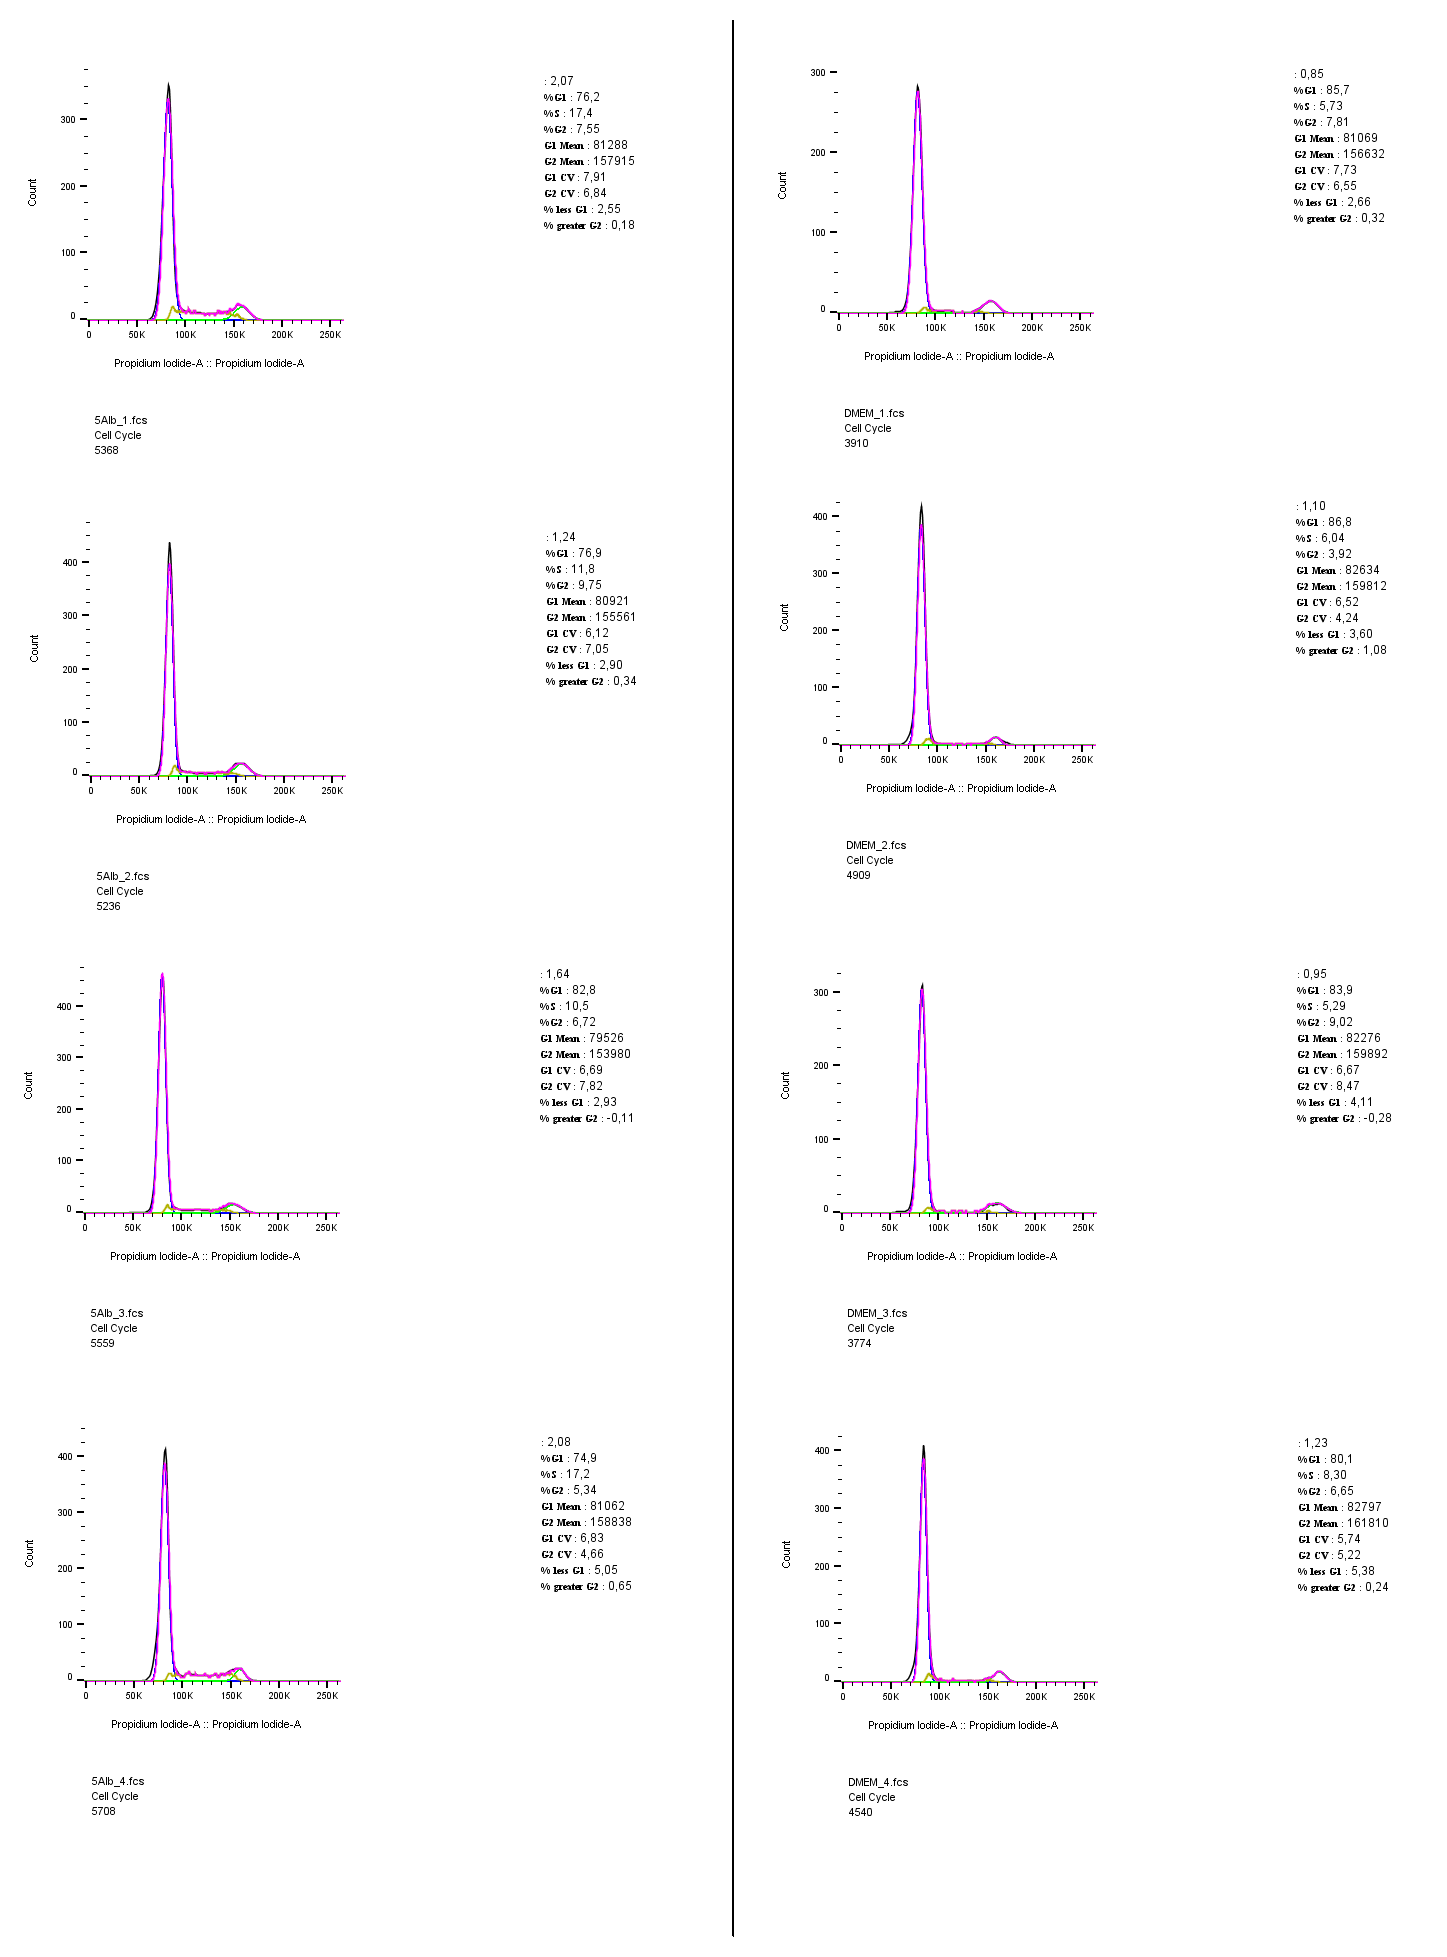
Individual cell cycle histograms
Individual histograms of the cell cycle analysis that were presented as overlays in figure 2. Gating, calculations and images presented in this figure were carried out using FlowJo 10.5.3.
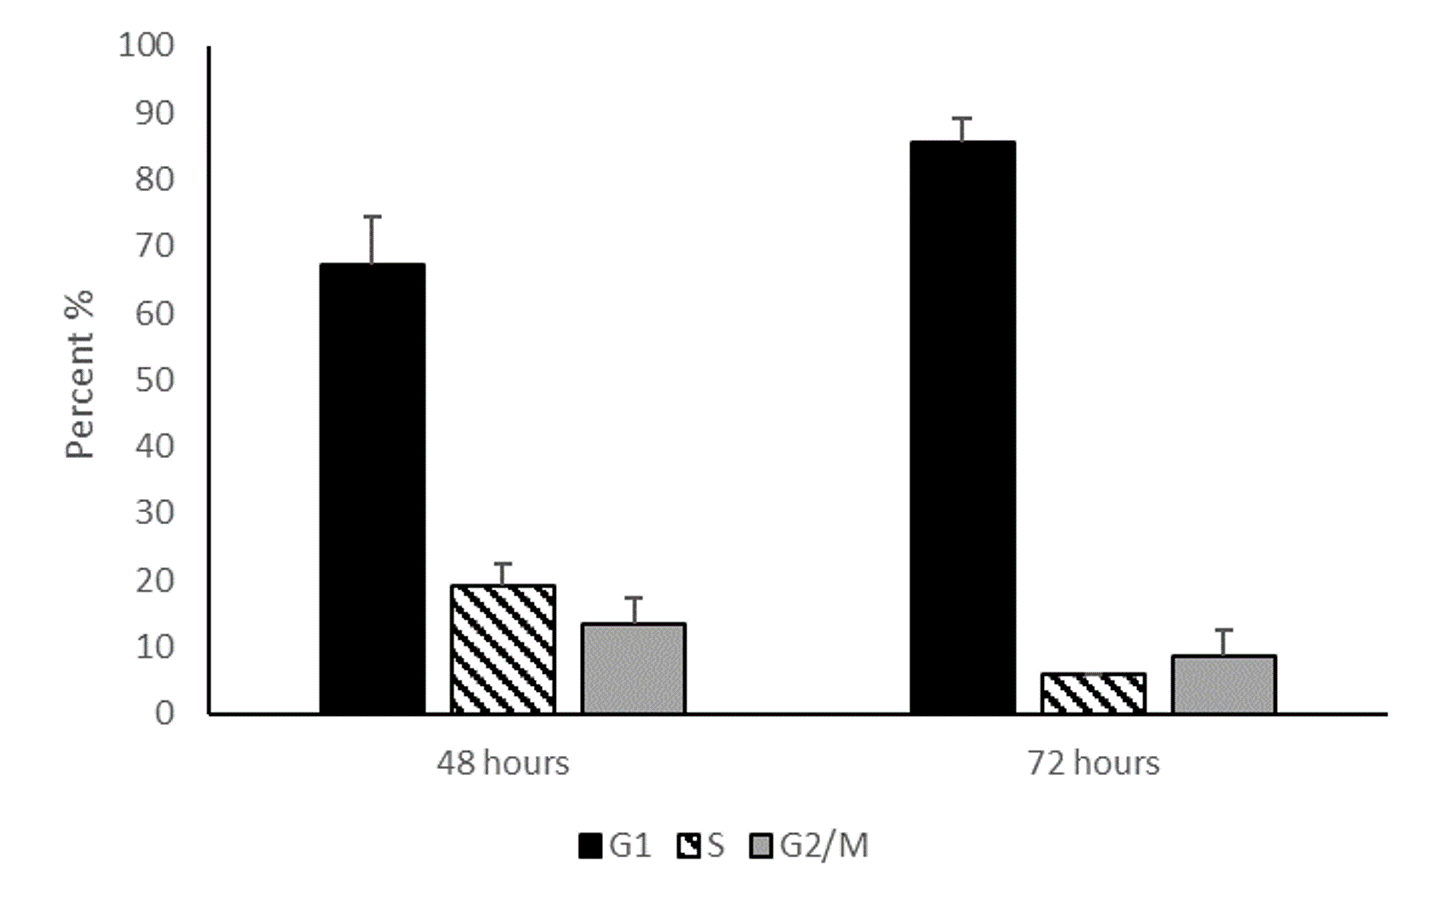
Cell cycle analysis of serum starved HepG2/C3A cells
Cell cycle analysis of HEPG2/C3A hepatocytes after 48 hours and 72 hours serum starvation demonstrate that cell cycle arrest gradually increases over time. Data represented in the graph are mean percentages of G1, S and G2/M cell cycle stages at 48 hours and 72 hours of serum starvation. Values are mean ± SD (n=2).
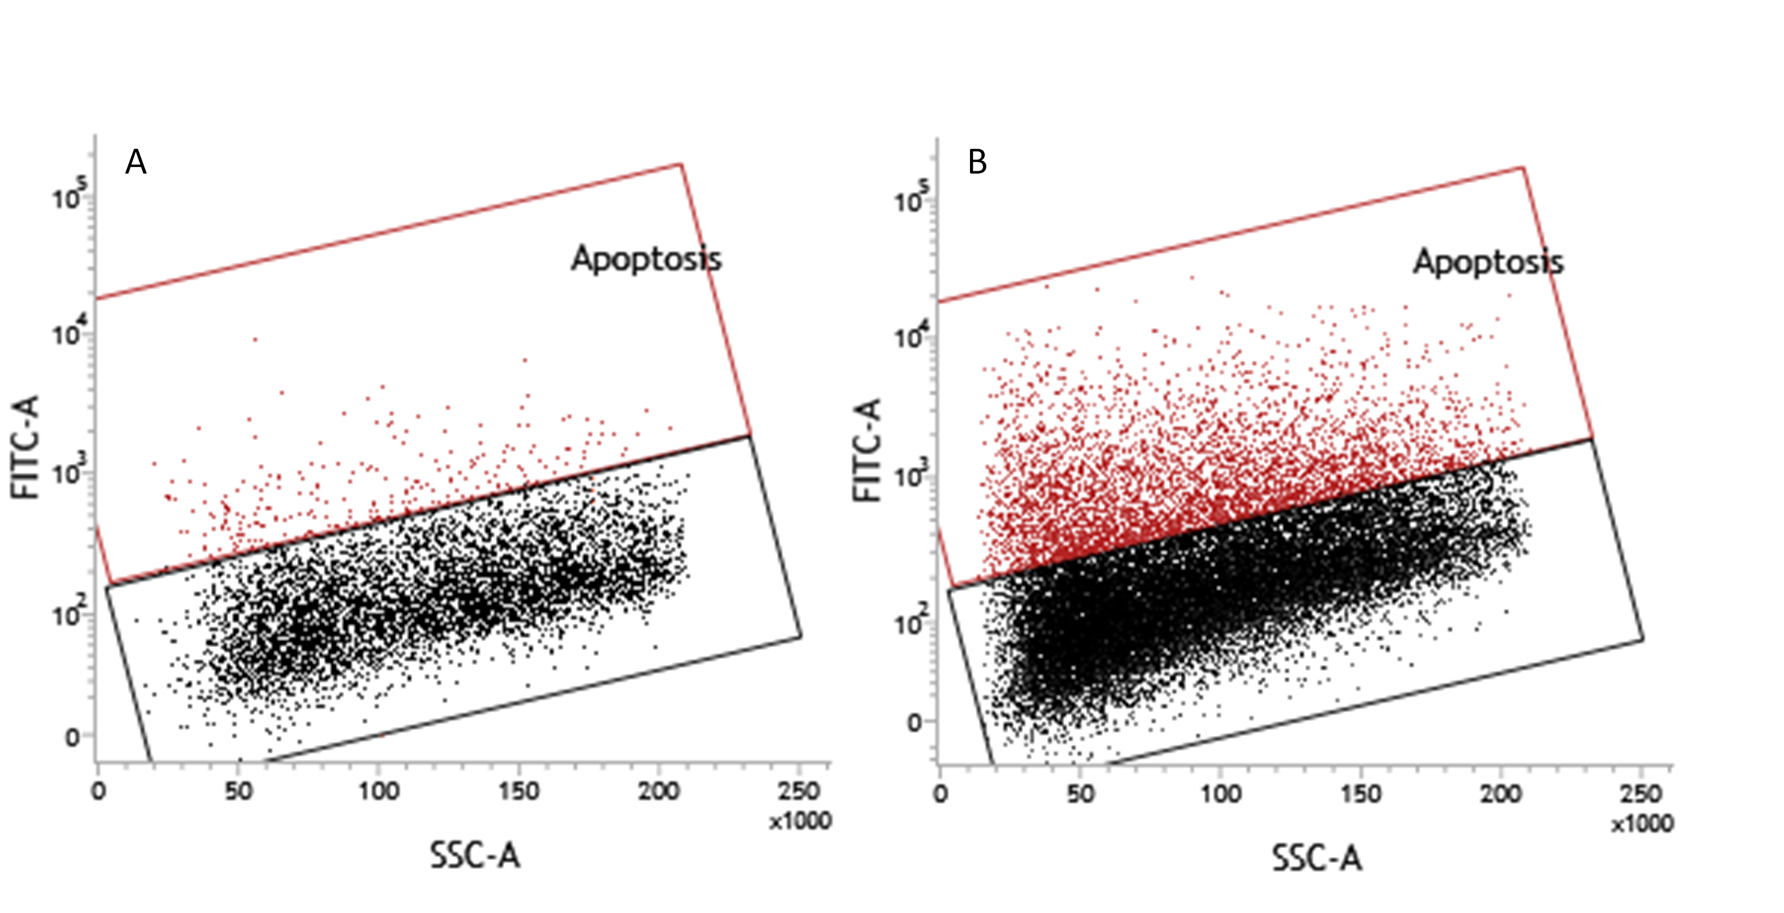
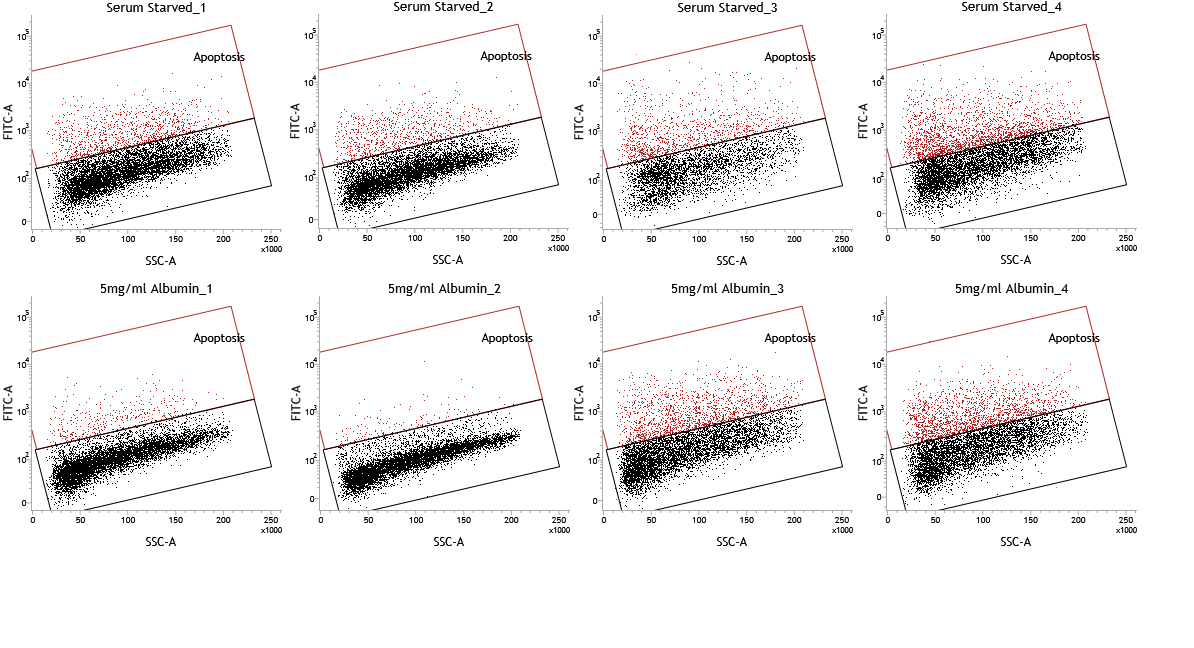
TUNEL assay of serum starved HepG2/C3A cells
TUNEL assay of HEPG2/C3A cells demonstrates apoptosis at 4% and 16.6% after (A) 48 and (B) 72 hours (image from fig 3 a of main text) of serum starvation respectively.
Individual dot plots of TUNEL assay
Individual dot plots of the TUNEL assay that were presented as overlays in figure 3.
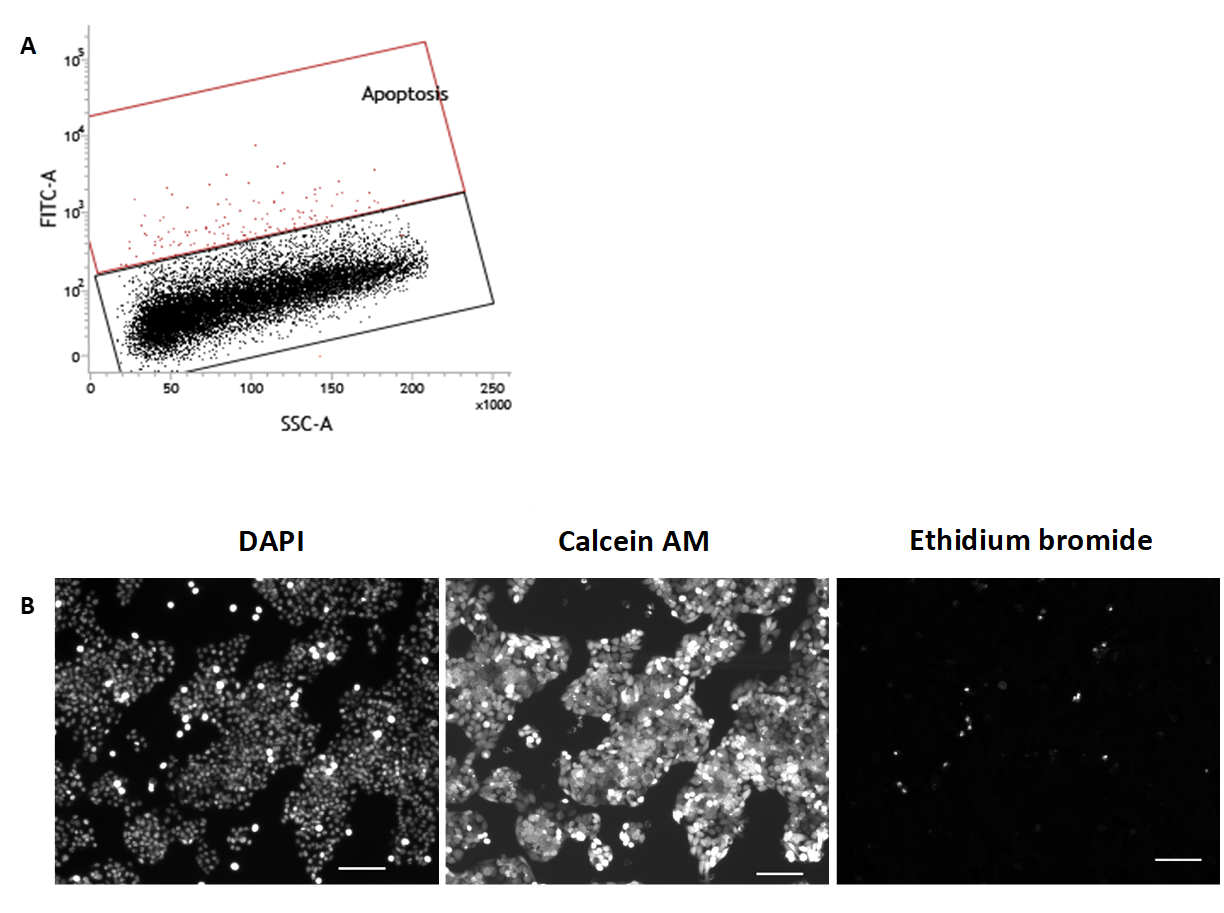
Analysis of HepG2/C3A cells cultured in media containing 10% FBS
HepG2/C3A cells cultured in media containing 10% FBS for 72 hours were analysed by (A) TUNEL assay using a flow cytometer for apoptosis (0.8 ± 0.2 %) (n=2). (B) fluorescence microscopy demonstrates 1) DAPI (nuclear), 2) calcein AM (cytoplasmic) and 3) ethidium bromide (nuclear) staining. Scale bar=100 µm. A necrotic index of 1.7 ± 0.8% was calculated as the percentage of necrotic cells (ethidium bromide) from the total cell count (DAPI) (n=2).
Treatment of HepG2/C3A cells cultured in media containing 10% FBS with human serum albumin
Mean cell counts of HepG2/C3A cells cultured for 72 hours in media containing 10% FBS (5830000 ± 40000) and media containing 10% FBS treated with 10mg/ml albumin (6470000 ± 1083097). Values are mean ± SD (n=3).