Integumentary structure and composition in an exceptionally well-preserved hadrosaur (Dinosauria: Ornithischia)
- Published
- Accepted
- Subject Areas
- Cell Biology, Paleontology, Histology
- Keywords
- integument, preservation, skin, fossil, hadrosaur, cell layer, synchrotron radiation, scanning electron microscopy, x-ray, spectromicroscopy
- Copyright
- © 2019 Barbi et al.
- Licence
- This is an open access article distributed under the terms of the Creative Commons Attribution License, which permits unrestricted use, distribution, reproduction and adaptation in any medium and for any purpose provided that it is properly attributed. For attribution, the original author(s), title, publication source (PeerJ Preprints) and either DOI or URL of the article must be cited.
- Cite this article
- 2019. Integumentary structure and composition in an exceptionally well-preserved hadrosaur (Dinosauria: Ornithischia) PeerJ Preprints 7:e27698v1 https://doi.org/10.7287/peerj.preprints.27698v1
Abstract
Preserved labile tissues (e.g. skin, muscle) in the fossil record of terrestrial vertebrates are increasingly becoming recognized as an important source of biological and taphonomic information. Here, we combine a variety of synchrotron radiation techniques with scanning electron and optical microscopes to elucidate the structure of 72 million-year-old squamous (scaly) skin associated with a hadrosaurid dinosaur from the Late Cretaceous of Alberta, Canada. Scanning electron and optical microscopy independently reveal that the three-dimensionally preserved scales are associated with a band of carbon-rich layers up to a total thickness of 75 μm. Compositionally, this band deviates from that of the surrounding matrix; Fourier-transform infrared spectroscopy and soft X-ray spectromicroscopy analyses indicate the presence of carboxylic compounds. The regions corresponding to the integumentary layers are distinctively enriched in iron compared to the associated sedimentary matrix and seem associated to kaolinite. These carbonyl-rich layers are apparently composed of subcircular bodies resembling preserved cell structures. Each of these structures is encapsulated by calcite/vaterite, with iron predominantly concentrated at its center. The presence of iron, calcite/vaterite and kaolinite might have played important roles in the preservation of the layered structures.
Author Comment
This is a submission to PeerJ for review.
Supplemental Information
Integumentary structure and composition in an exceptionally well-preserved hadrosaur (Dinosauria: Ornithischia): Supplemental Material
Extra information and data, including chemical spectroscopic data and maps are included in this supplemental material
XRF distribution for iron, calcium, copper and manganese
XRF distribution for iron, calcium, copper and manganese. Each pixel measures 25 micron-square; the entire mapped area measures 89.9 micron x 330 micron. Warmer colours correspond to higher concentrations for each element. Maps were plotted using PyMCA (Sole,2007). The concentration of iron, and to a lesser extent, copper, is higher in the region preserving the integument (region between the dashed lines) than to the sediment surrounding it.
SEM spectrum
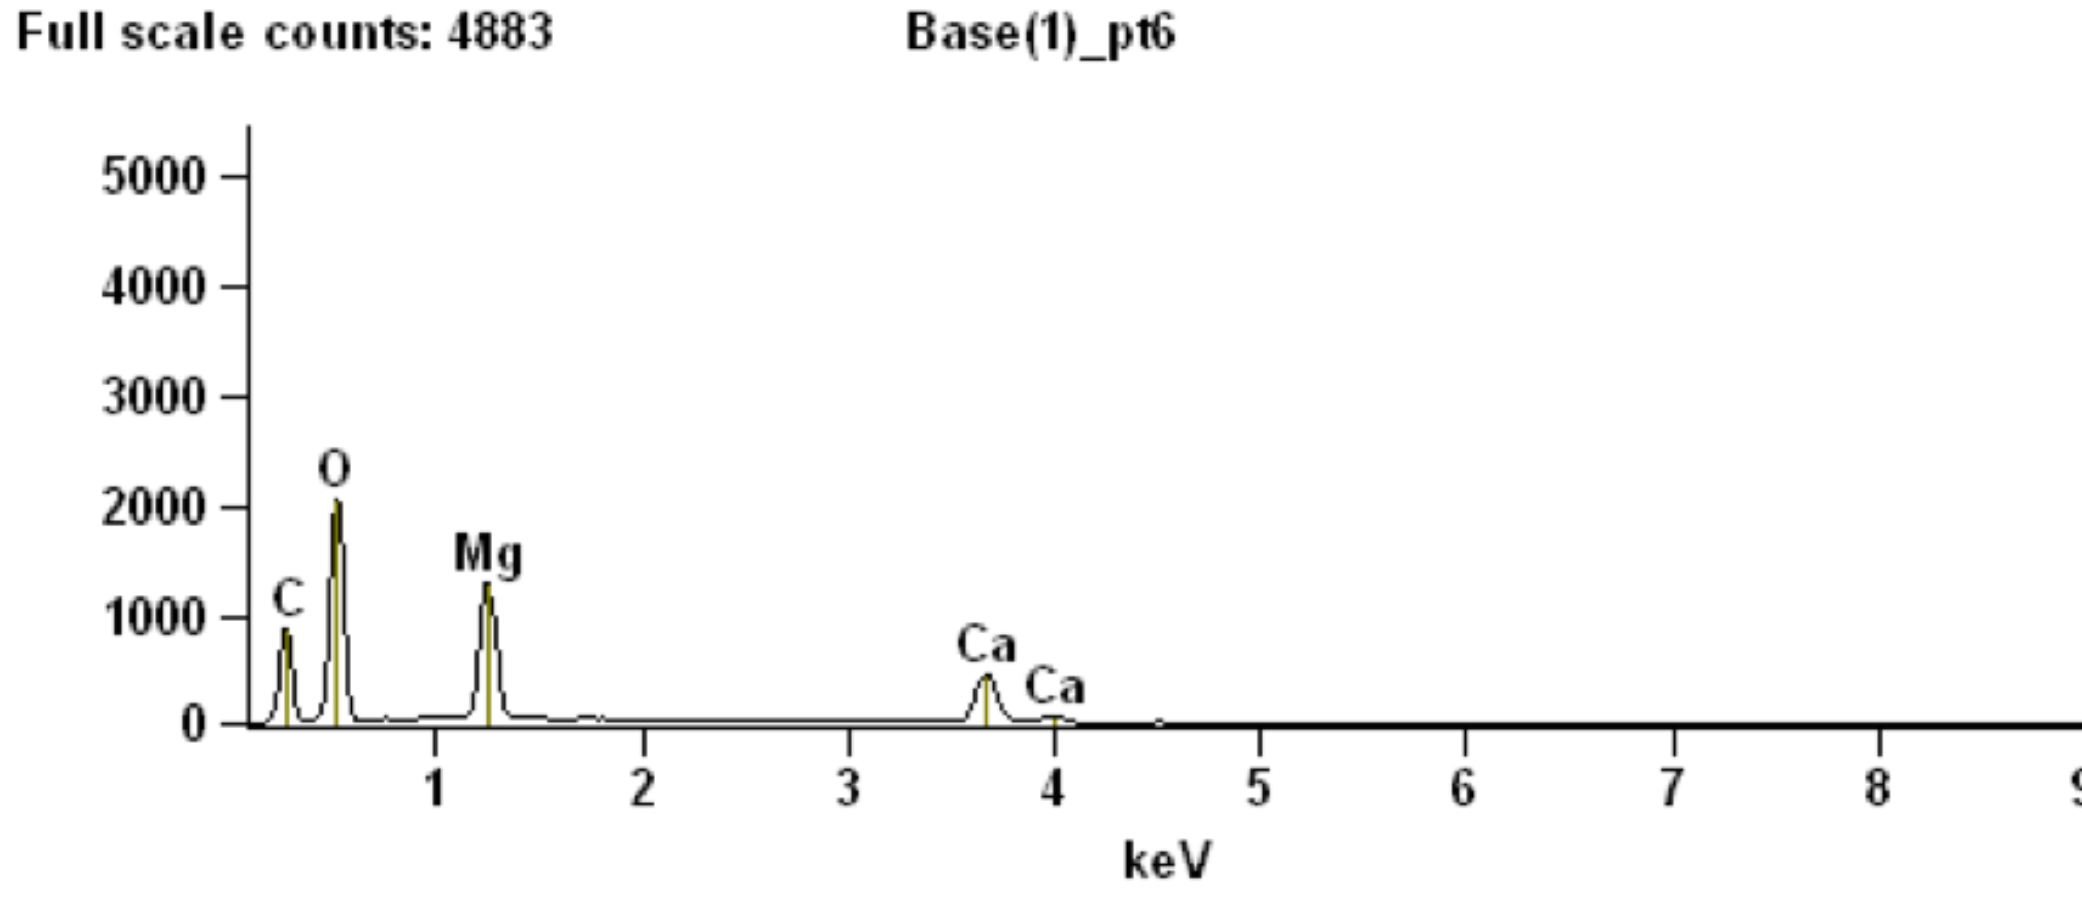
SEM spectrum from point 6 as indicated in Fig. 2c.
SEM spectrum
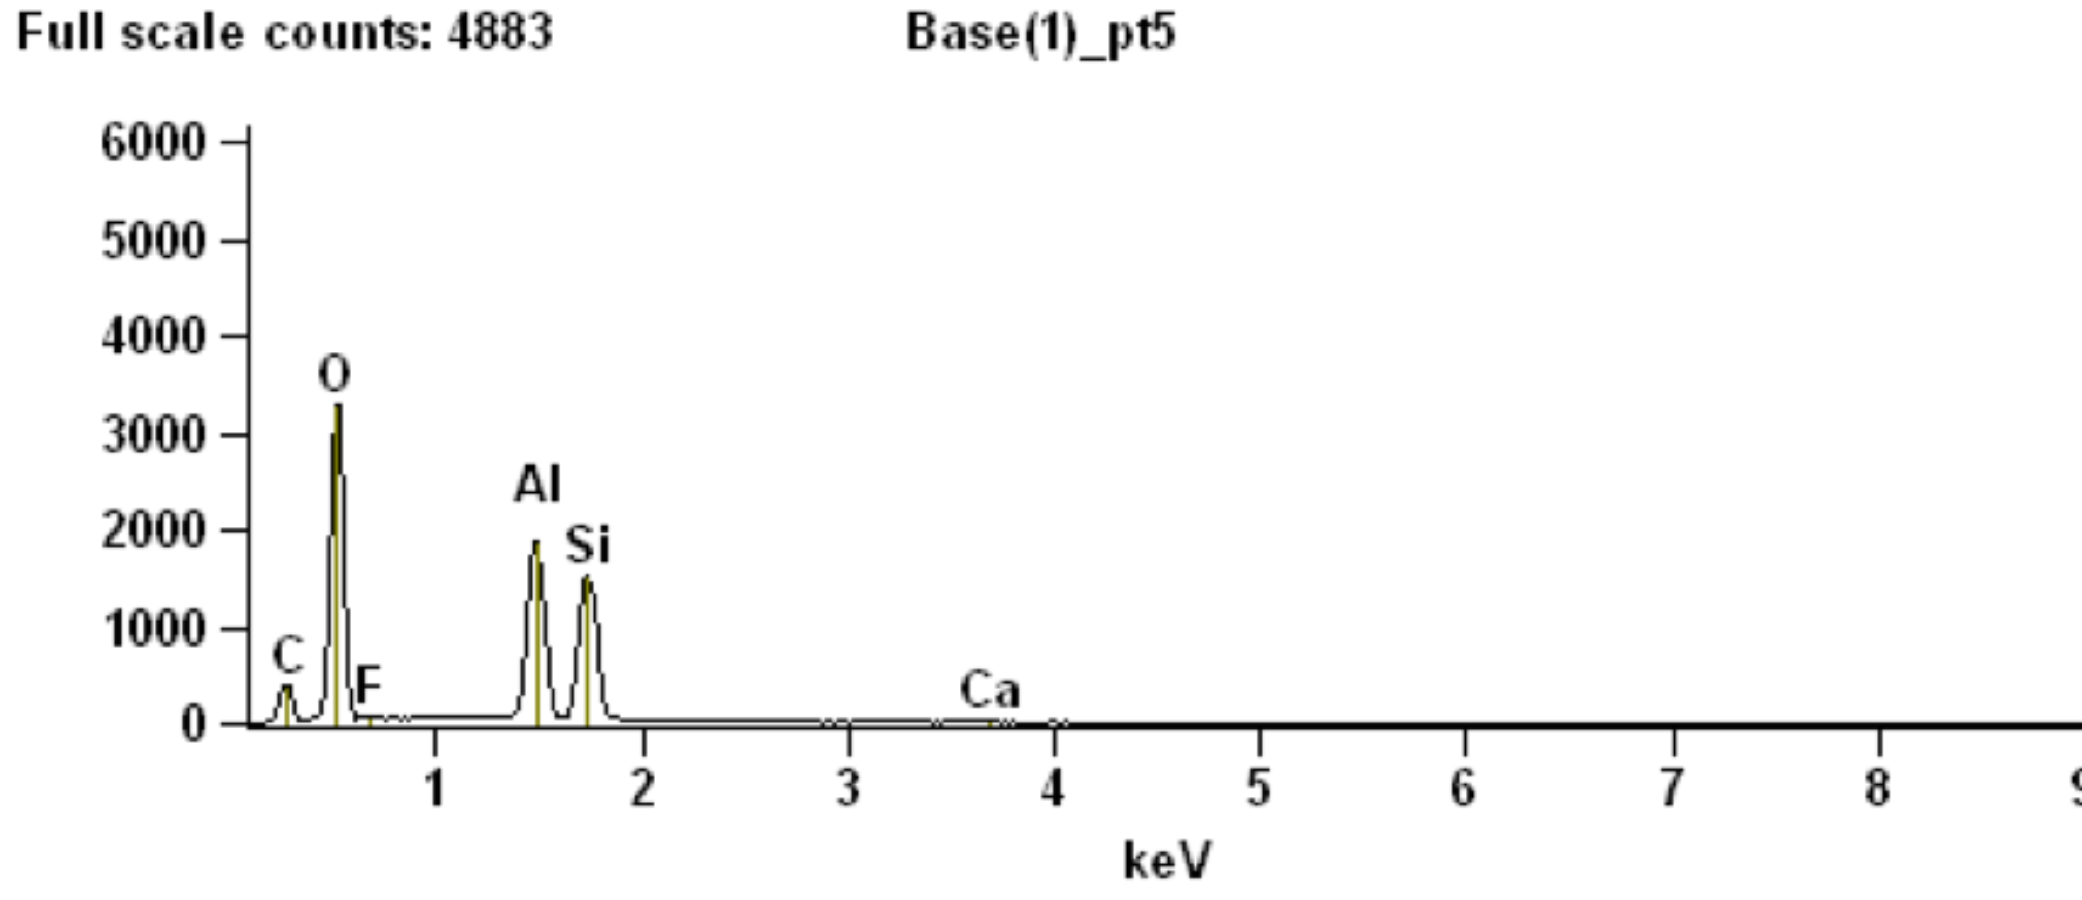
SEM spectrum from point 5 as indicated in Fig. 2c.
SEM spectrum
SEM spectrum from point 4 as indicated in Fig. 2c.
SEM spectrum
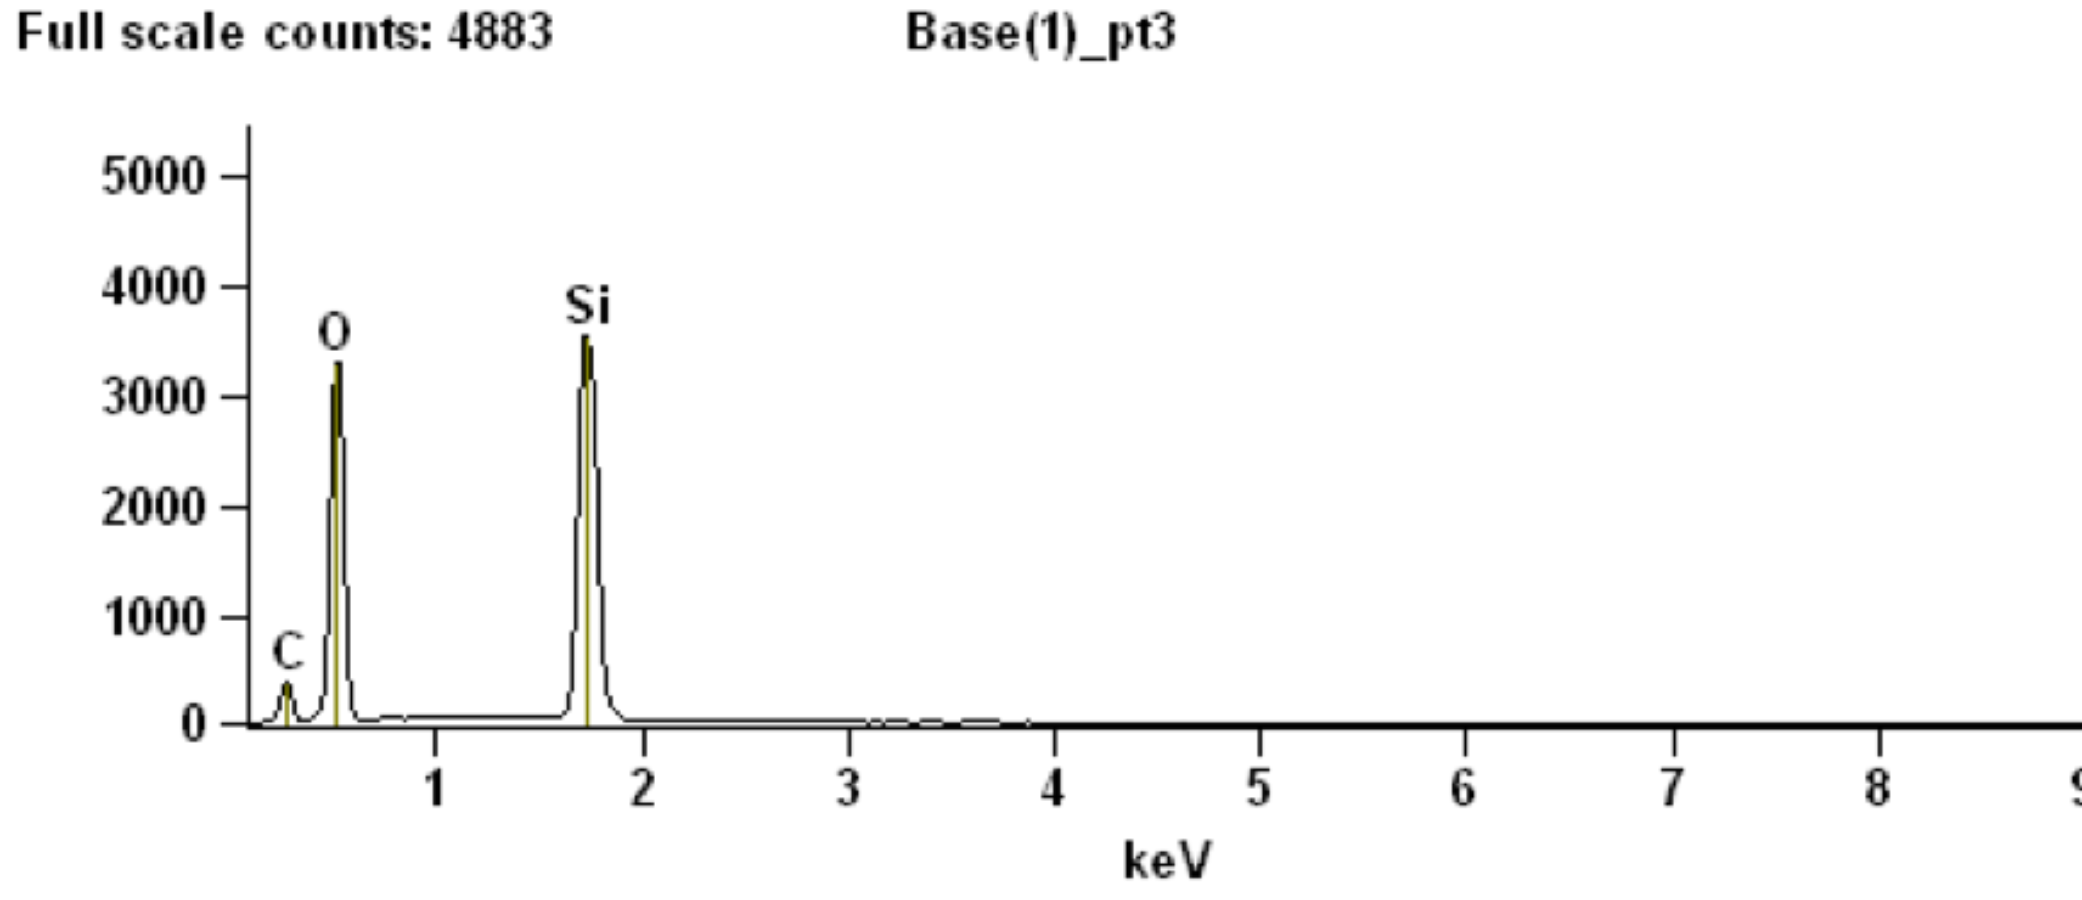
SEM spectrum from point 3 as indicated on Fig. 2c.
SEM spectrum
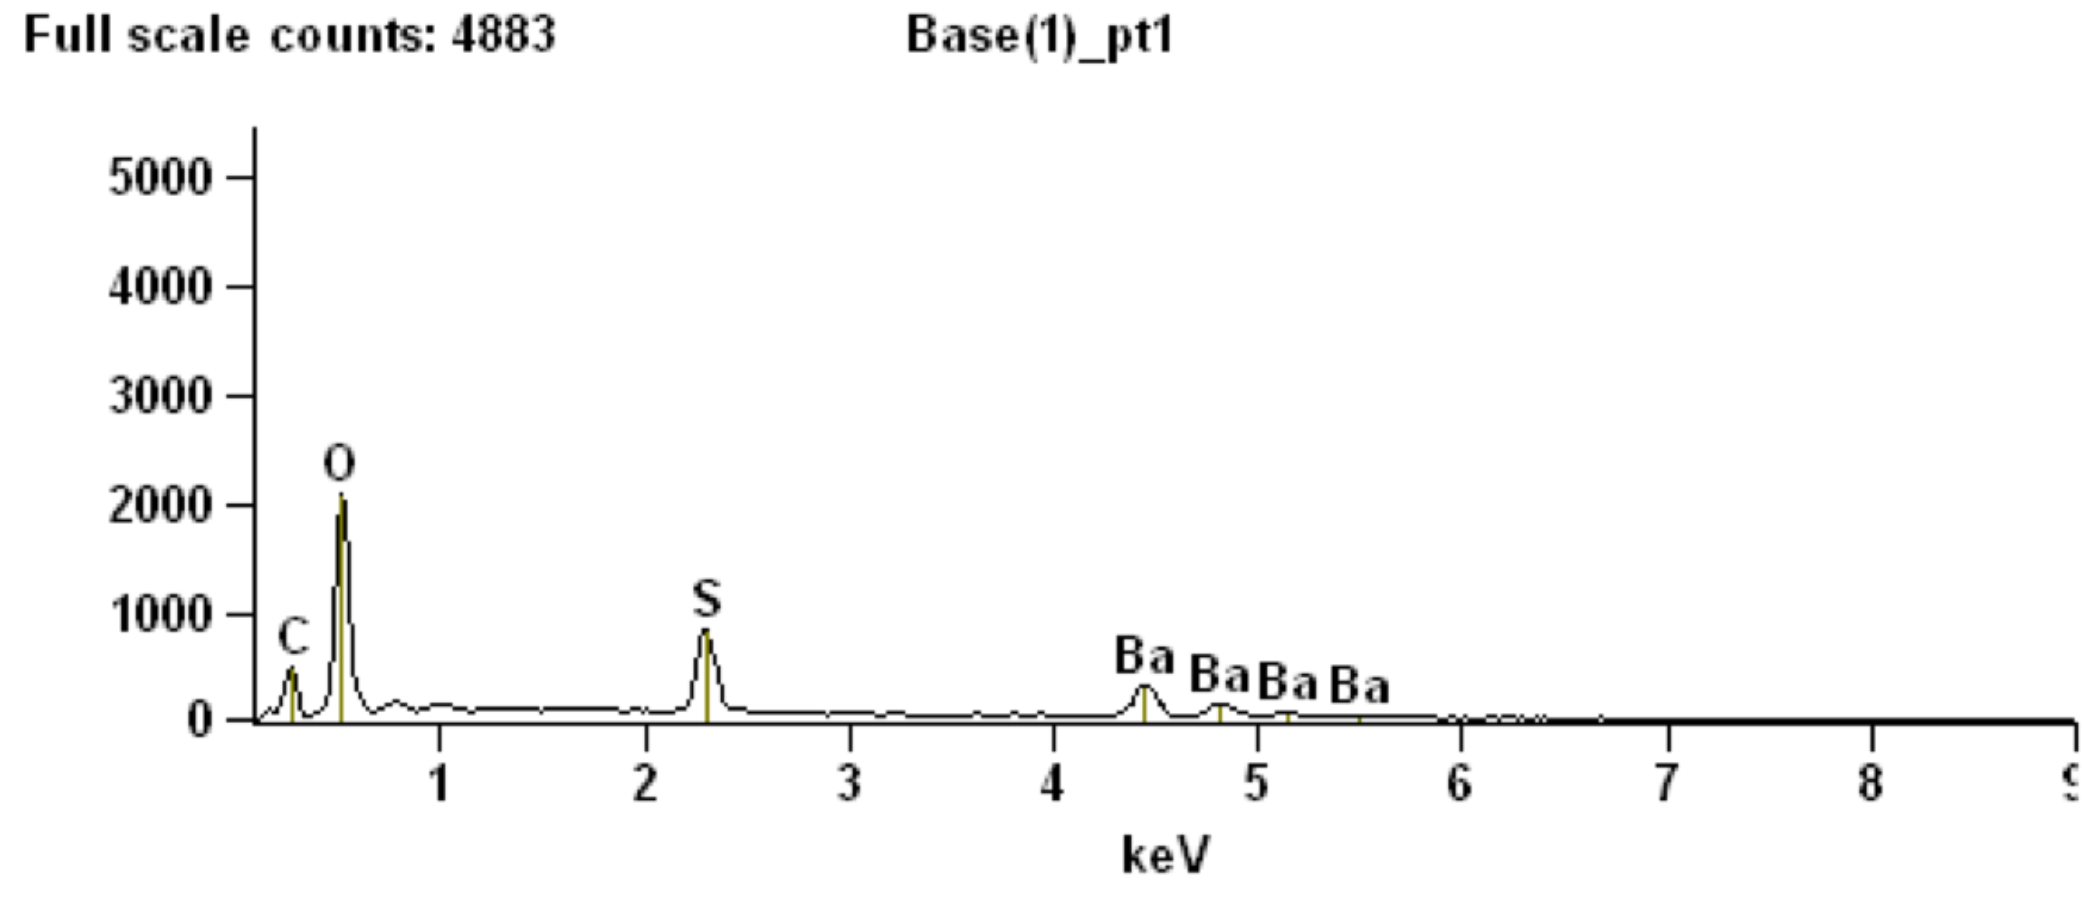
SEM spectrum from point 1 as indicated in Fig. 2c.
MidIR spectra
Complete set of spectra collected at the MidIR beamline endstation corresponding to the points indicated in Fig. 7.
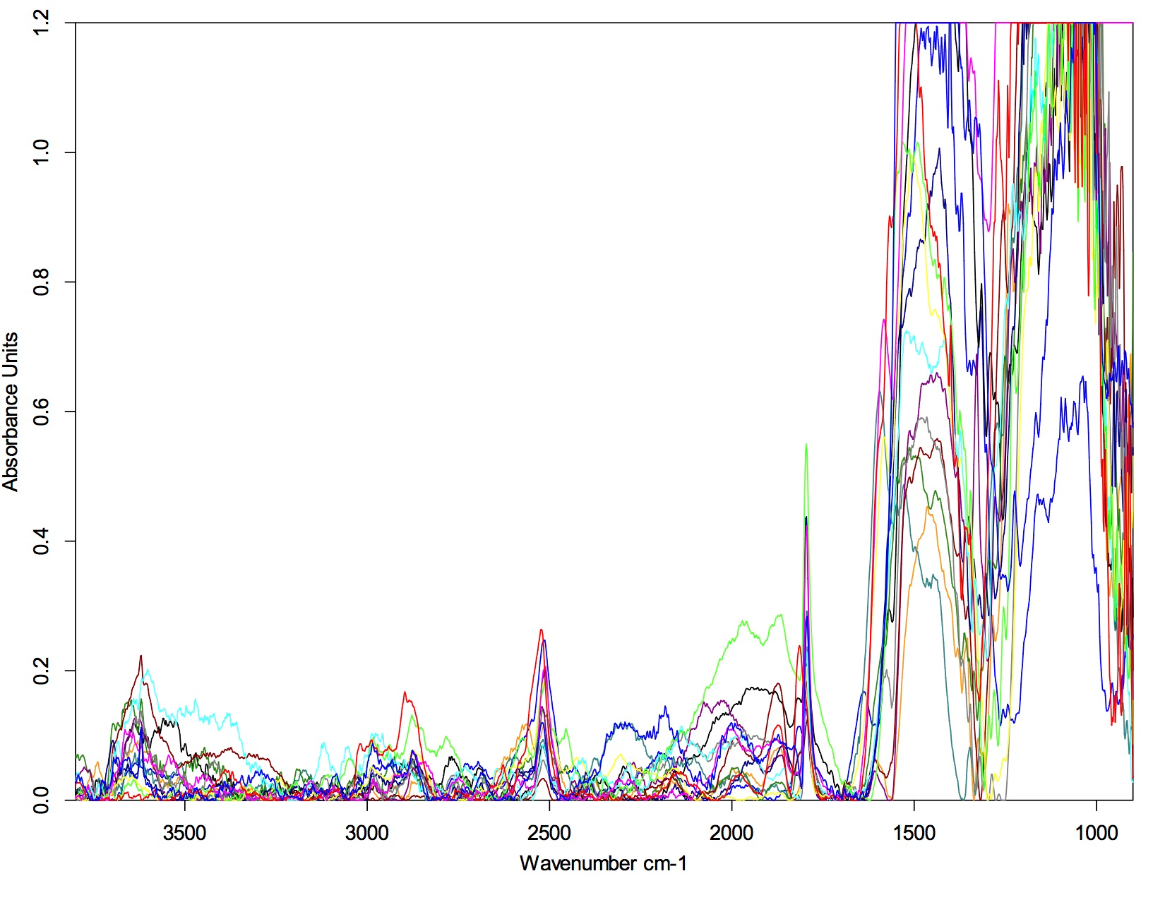
Spectra collected from the light powder sample
Set of spectra collected from the light powder sample. The absence of any remarkable peaks in the "organic" region of the spectrum, situated between 1500 - 1800 cm-1, is in clear contrast relative to the same region identified in the spectral collection for the dark powder shown in Fig. S7.
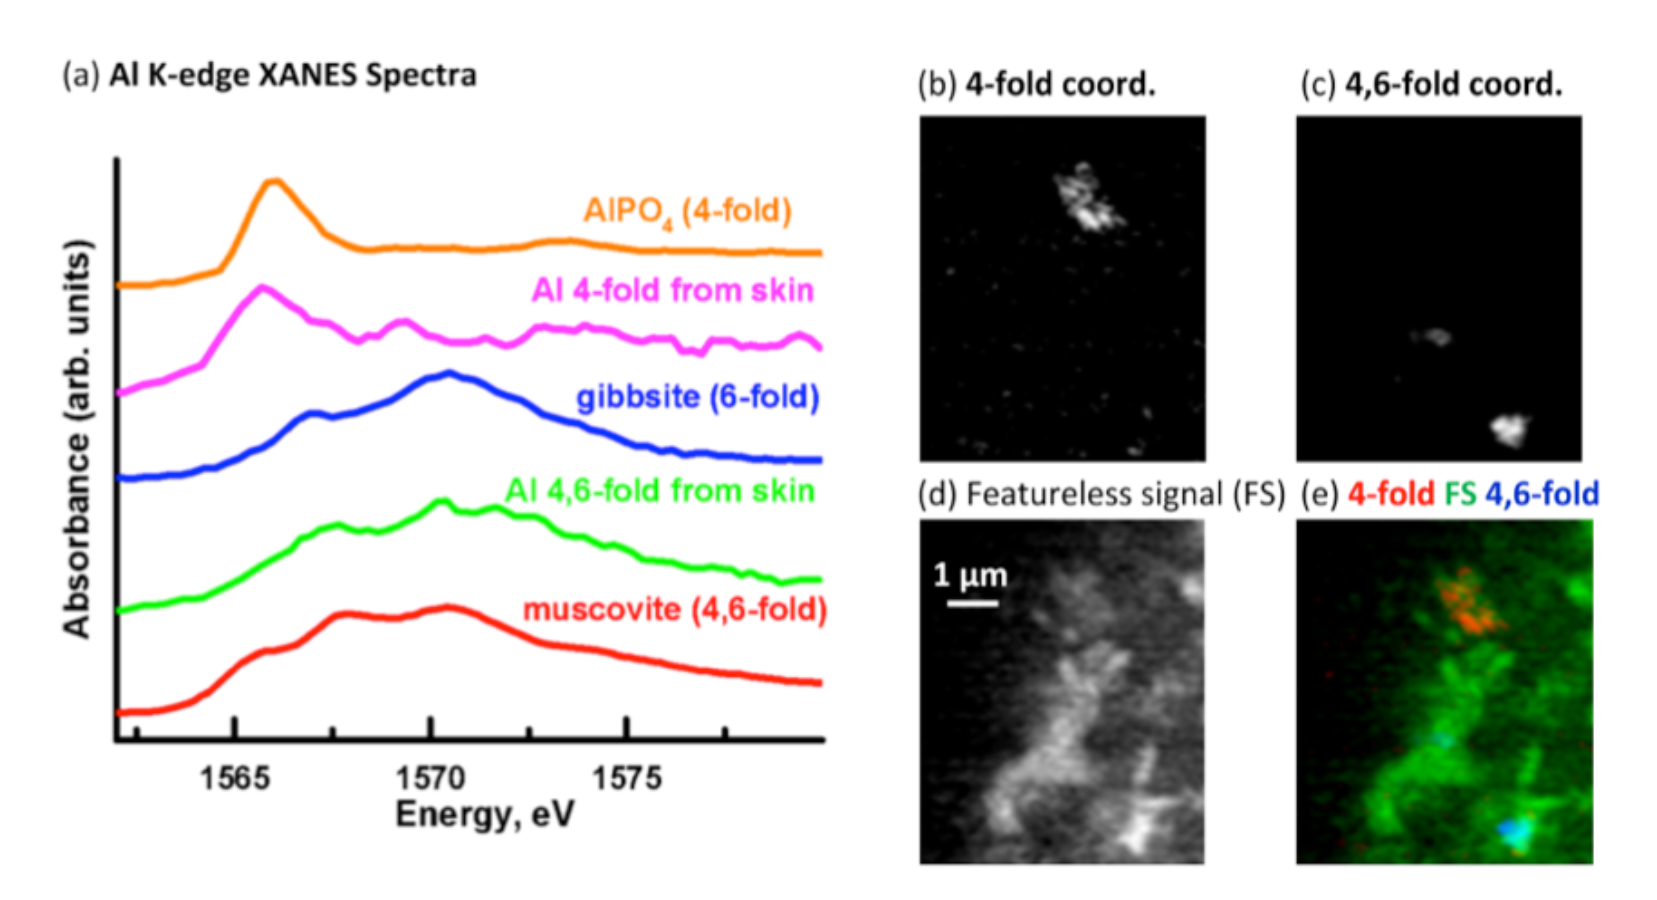
Aluminum component maps
Aluminum component maps derived from the linear regression fitting of an Al K-edge image sequence using reference spectra. (a) Comparison of Al 4-fold coordinated and Al 4, 6-fold coordinated spectra derived by threshold masking of the component maps to the muscovite (4, 6-fold coordinated), gibbsite (6-fold coordinated Al) and AlPO4 (4-fold coordinated Al) reference spectra. Component maps (b-e). (b) 4-fold coordinated Al, (c) 4, 6-fold coordinated Al and (d) slow varying featureless signal (FS). (e) Color composite of the component maps (4-fold coordinated Al = red, featureless signal = green and 4, 6-fold coordinated Al = blue).
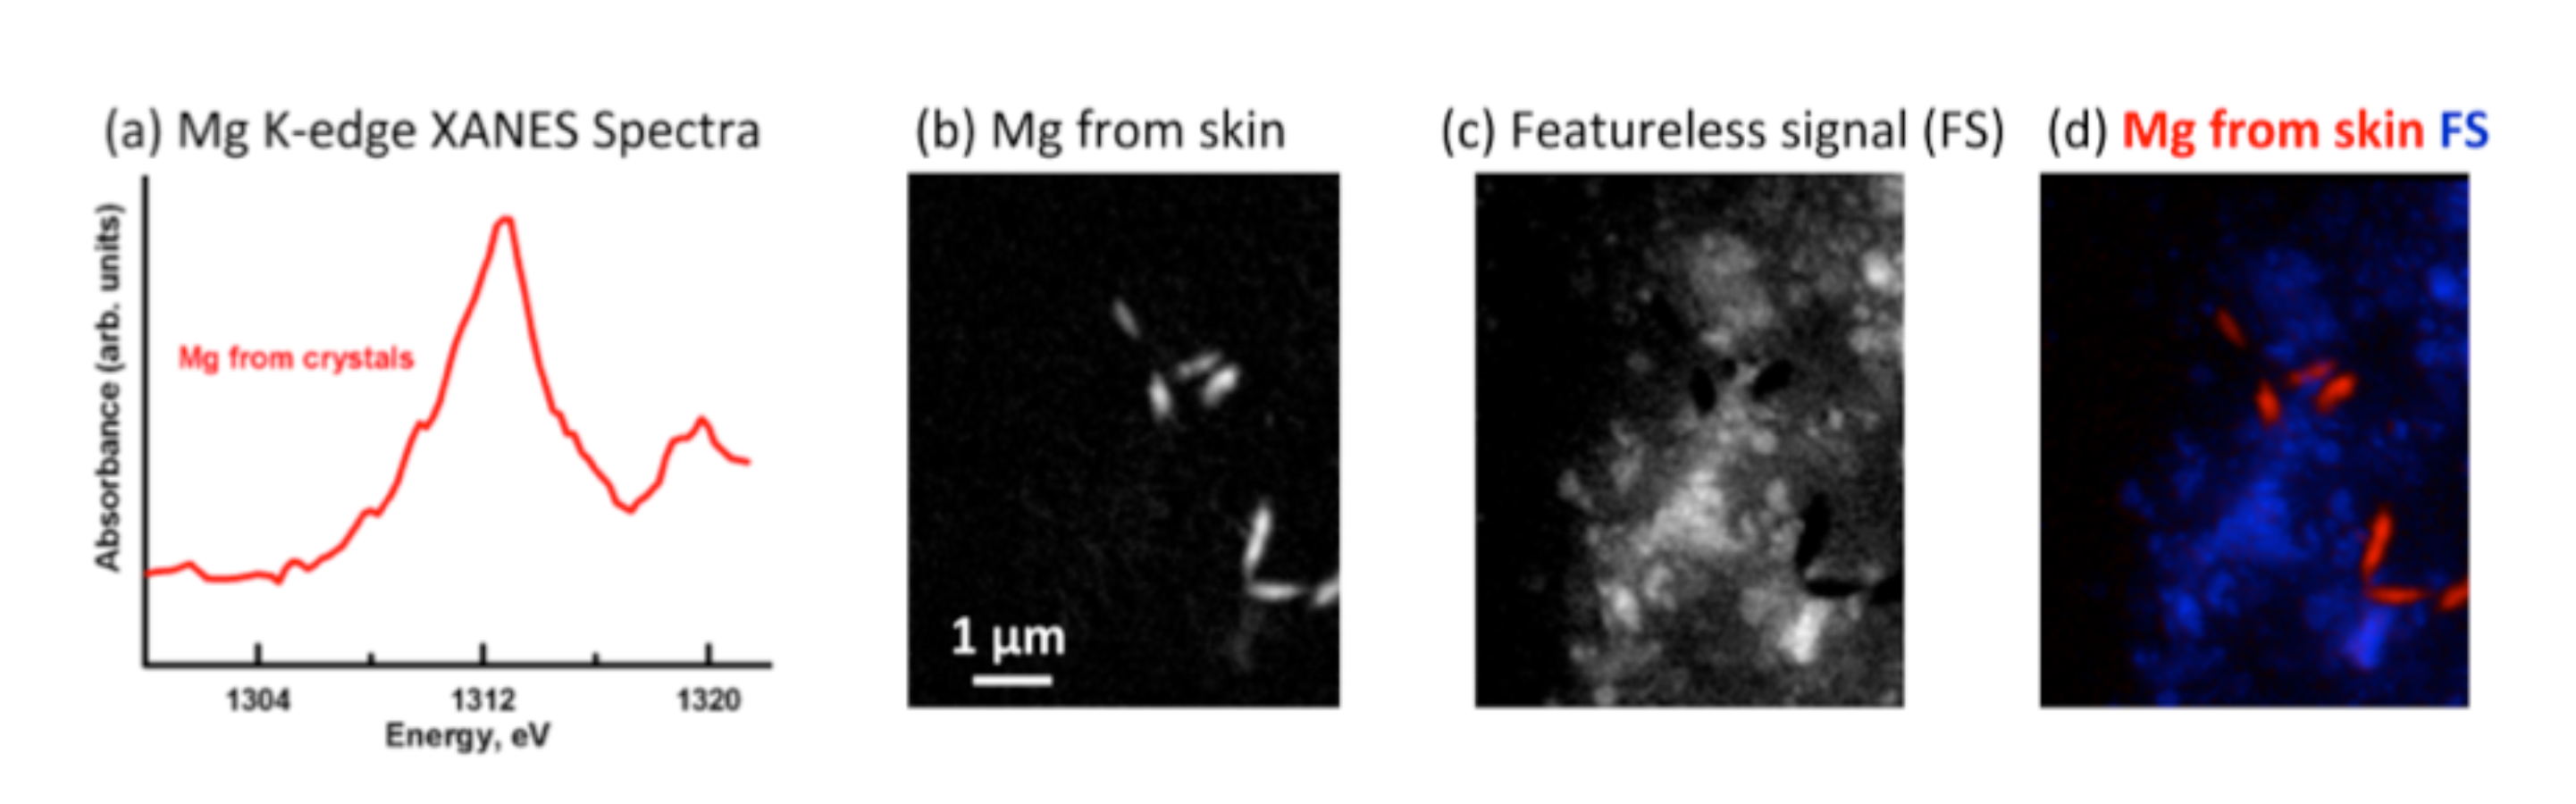
Magnesium component map
Magnesium component map derived from the linear regression fitting of an Mg K-edge image sequence using a spectrum taken from the image sequence. (a) Mg spectrum from the crystals (sediment). Component maps: (b) Mg and, (c) slow varying featureless signal (FS). Color composite of the component maps (Mg = red; featureless signal = blue).
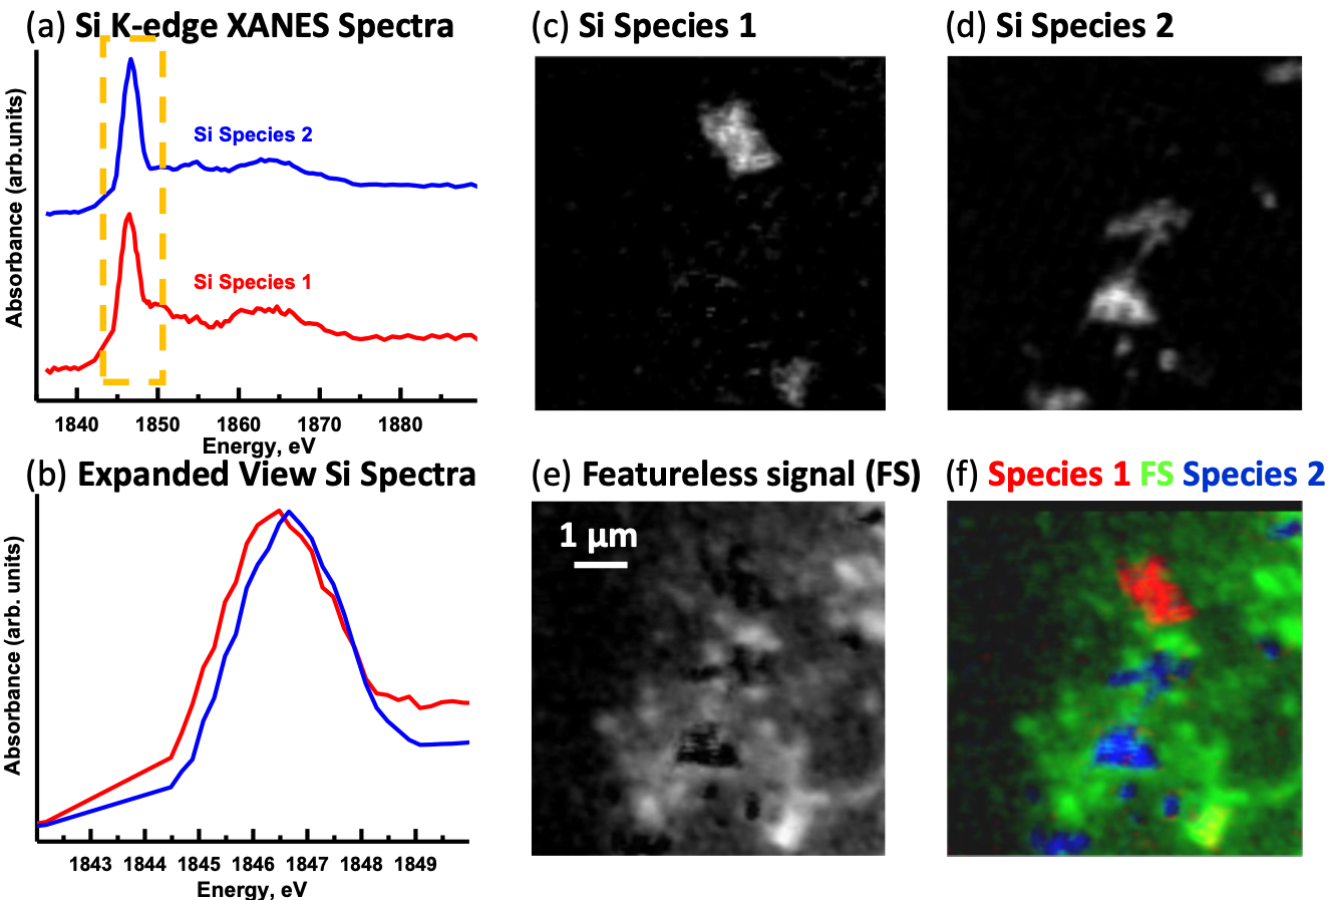
Silicon component maps
Silicon component maps derived from the linear regression fitting of an Si K-edge image sequence using spectra taken from the image sequence. (a) Si spectra (Si species 1 and Si species 2) derived by threshold masking of the respective component maps. (b) Overlay of the Si spectra. Orange box shows the area expanded from (a). Component maps: (c) Si Species 1, (d) Si Species 2 and (e) slow varying featureless signal (FS). (f) Color composite of the component maps (Si species 1 = red, featureless signal = green and Si species 2 = blue).