Nucleotide substitution rates of diatom plastid encoded protein genes are correlated with genome architecture
- Published
- Accepted
- Subject Areas
- Evolutionary Studies, Genomics
- Keywords
- evolutionary rates, plastome size, Bacillariophyta, genomic rearrangements, plastid genome
- Copyright
- © 2019 Yu et al.
- Licence
- This is an open access article distributed under the terms of the Creative Commons Attribution License, which permits unrestricted use, distribution, reproduction and adaptation in any medium and for any purpose provided that it is properly attributed. For attribution, the original author(s), title, publication source (PeerJ Preprints) and either DOI or URL of the article must be cited.
- Cite this article
- 2019. Nucleotide substitution rates of diatom plastid encoded protein genes are correlated with genome architecture. PeerJ Preprints 7:e27636v1 https://doi.org/10.7287/peerj.preprints.27636v1
Abstract
Diatoms are the largest group of heterokont algae with more than 100,000 species. They are photosynthetic, unicellular eukaryotes that contribute ~ 45% of global primary production and inhabit marine, aquatic and terrestrial ecosystems. Despite their ubiquity and environmental significance very few diatom plastid genomes (plastomes) have been sequenced and studied. This study explored the pattern of diatom plastid nucleotide substitution rates across the entire suite of plastome protein-coding genes for 40 taxa representing the major clades. Substitution rate acceleration was lineage specific with the highest rates in the araphid 2 taxon Astrosyne radiata and radial 2 taxon Proboscia sp. Rate heterogeneity was also evident in different functional classes of genes. Similar to land plants, proteins genes involved in photosynthetic metabolism have substantially lower rates than those involved in transcription and translation. Significant positive correlations were identified between rates and measures of genomic rearrangement, but not plastome size. This work advances the current understanding of diatom plastomes and provides a foundation for future studies of their evolution.
Author Comment
This paper is not currently under review in a peer reviewed journal.
Supplemental Information
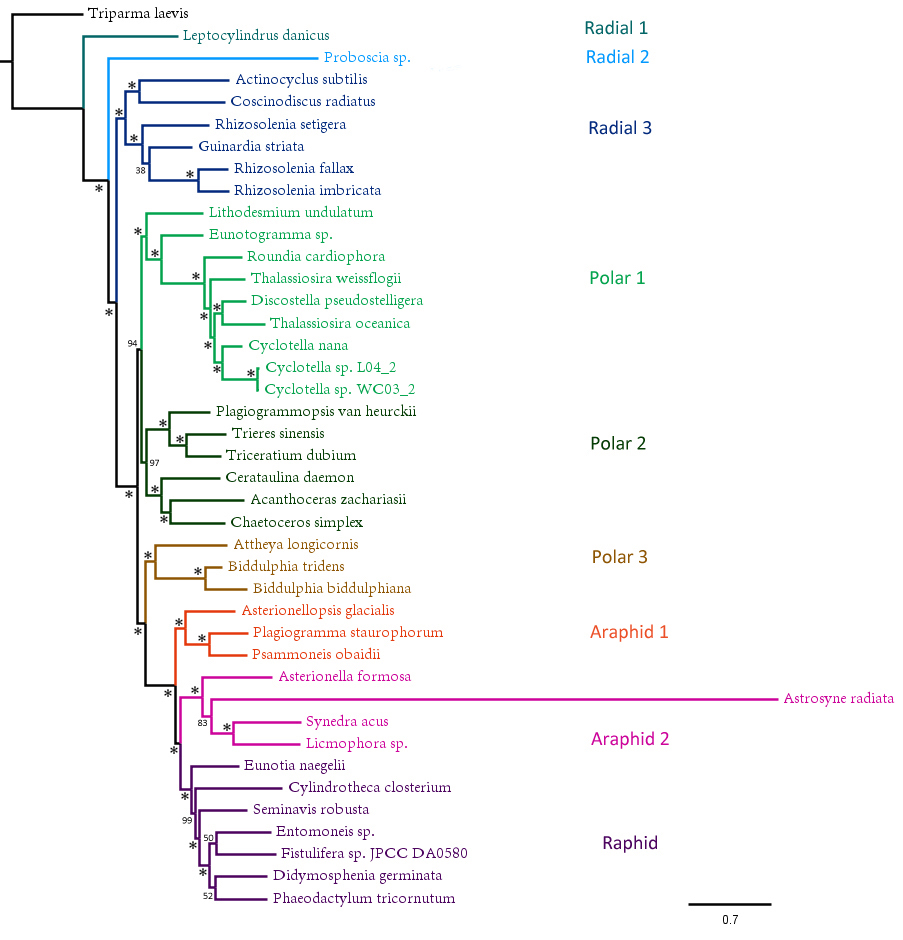
Fig. S1. Maximum likelihood phylogeny of 40 diatom species and outgroup Triparma laevis
Maximum likelihood phylogeny of 40 diatom species and outgroup Triparma laevis. Phylogeny was used as constraint tree in substitution rate analyses. Bootstrap values less than 100% are indicated at the nodes. * indicates bootstrap of 100%. Scale is substitutions per codon.
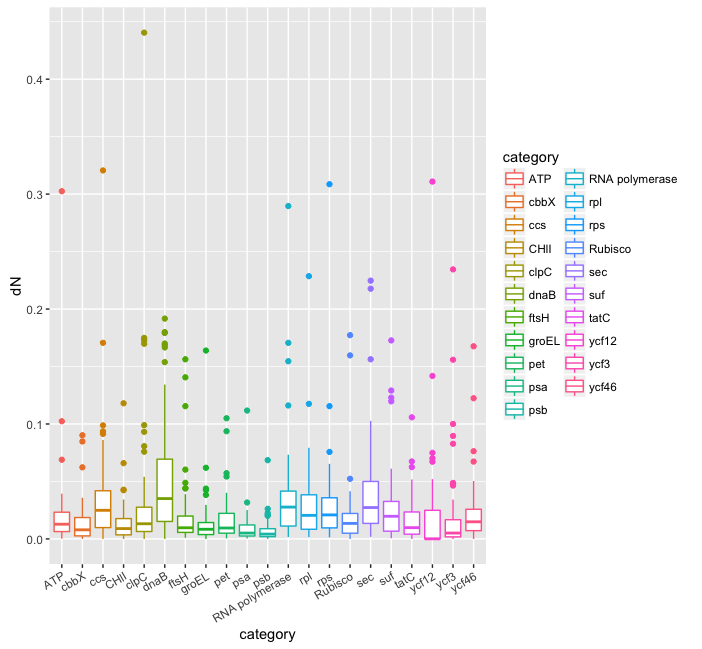
Fig. S2. Distribution of nonsynonymous (dN) substitution rates for groups of genes and individual genes
Distribution of nonsynonymous (dN) substitution rates for groups of genes and individual genes. The top and bottom lines of each box represent the 75th and 25th percentiles, respectively and the middle line in each box represents the 50th percentile. The whisker lines represent the minimum to the maximum points and the points outside of the whisker lines are outliers.
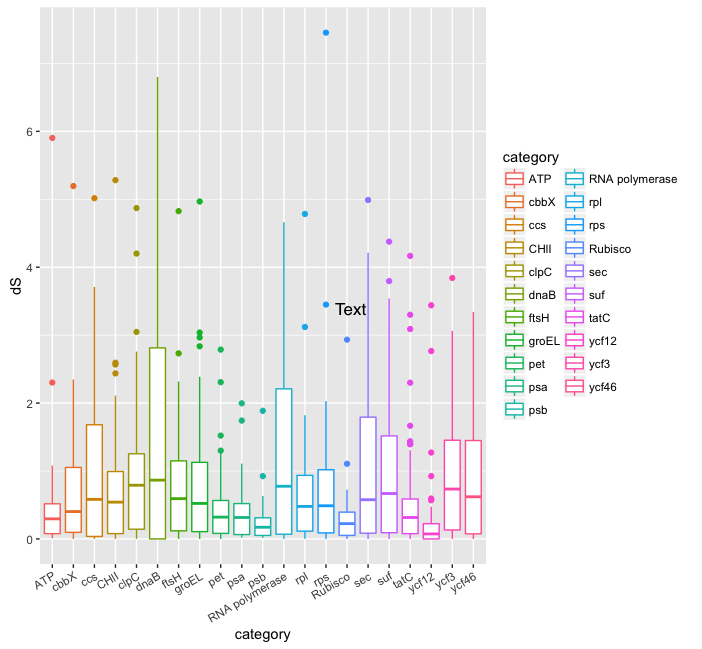
Fig. S3. Distribution of synonymous (dS) substitution rates for groups of genes and individual genes
Distribution of synonymous (dS) substitution rates for groups of genes and individual genes. The top and bottom lines of each box represent the 75th and 25th percentiles, respectively and the middle line in each box represents the 50th percentile. The whisker lines represent the minimum to the maximum points and the points outside of the whisker lines are outliers.