Ultra-performance liquid chromatography-mass spectrometry for precise fatty acid profiling of oilseed crops
- Published
- Accepted
- Subject Areas
- Agricultural Science, Plant Science
- Keywords
- Ultra -performance liquid chromatography-mass spectrometry, oil crops, rapeseed, fatty acids, breeding, gas chromatography - flame ionization detection, sunflower
- Copyright
- © 2019 Chernova et al.
- Licence
- This is an open access article distributed under the terms of the Creative Commons Attribution License, which permits unrestricted use, distribution, reproduction and adaptation in any medium and for any purpose provided that it is properly attributed. For attribution, the original author(s), title, publication source (PeerJ Preprints) and either DOI or URL of the article must be cited.
- Cite this article
- 2019. Ultra-performance liquid chromatography-mass spectrometry for precise fatty acid profiling of oilseed crops. PeerJ Preprints 7:e27501v1 https://doi.org/10.7287/peerj.preprints.27501v1
Abstract
Oilseed crops are one of the most important sources of vegetable oils for food and industry. Nutritional and technical properties of vegetable oil are primarily determined by its fatty acid (FA) composition. The content and composition of FAs in plants are commonly determined using gas chromatography-mass spectrometry (GS-MS) or gas chromatography-flame ionization detection (GC-FID) techniques. In the present work, we applied ultra-performance liquid chromatography-mass spectrometry (UPLC-MS) technique to FA profiling of sunflower and rapeseed seeds and compared this method with the GC-FID technique. GC-FID detected 11 FAs in sunflower and 13 FAs in rapeseed, UPLC-MS appeared to be more sensitive, detecting about 2.5 times higher number of FAs in both plants. In addition to even-chain FAs, UPLC-MS was able to detect odd-chain Fas. The longest FA detected using GC-FID was a FA with 24 carbon atoms, whereas UPLC-MS could reveal the presence of longer FAs with the tails of up to 28 carbon atoms. Based on our results, we may conclude that UPLC-MS has a great potential to be used for the assessment of the FA profile of oil crops.
Author Comment
This is a submission to PeerJ for review.
Supplemental Information
List of samples used in the study
Each sample is indicated by Species name, winter or spring type (for rapeseed), line id number from the catalog and id number used in mass specrometry analysis.
UPLC-MS data
TableA: UPLC-MS data for sunflower and rapeseed. For each sample in the table the information about species, method of analysis (UPLC-5 and UPLC-400), mass spectrometry id number and the intensity of each FA are presented. tableB: sunflower UPLC-5 statistics. For each FA mean value, standard deviation, minimum and maximum values and coefficient of variation are presented. tableC: sunflower UPLC-400 statistics. For each FA mean value, standard deviation, minimum and maximum values and coefficient of variation are presented. tableD: rapeseed UPLC-5 statistics. For each FA mean value, standard deviation, minimum and maximum values and coefficient of variation are presented. tableE: rapeseed UPLC-400. For each FA mean value, standard deviation, minimum and maximum values and coefficient of variation are presented. tableF: repeatability control: technical quality control samples (tQC). For each tQC the intensity of each FA are presented. For each FA mean value, standard deviation, minimum and maximum values and coefficient of variation are presented calculated from tQC samples.
GC-FID data
TableA: GC-FID data for sunflower and rapeseed. For each sample in the table the information about species, line id and GC data for each FA are presented.tableB: rapeseed GC-FID statistics. For each FA mean value, standard deviation, minimum and maximum values and coefficient of variation are presented. tableC: sunflower GC-FID statistics. For each FA mean value, standard deviation, minimum and maximum values and coefficient of variation are presented.
Example of isotopic pattern
A. Extracted ion chromatogram for 18:1 FA B. MS spectrum for 18:1 FA with 3 isotope peaks. X-axis -retention time in min, Y-axis -intensity in counts.
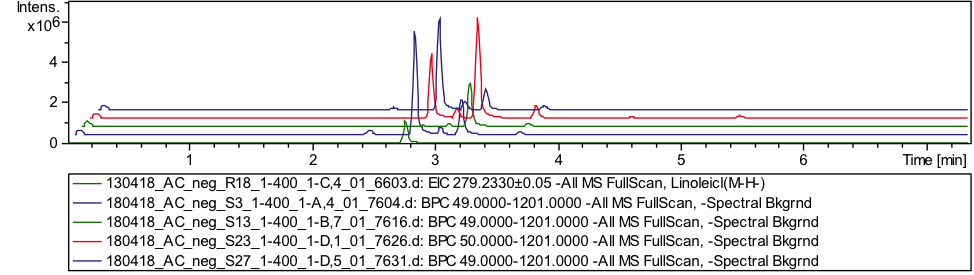
Variability between lines
The abundance of major FAs vary between sunflower samples measured by UPLC-5. Each colored line -chromatogram of 1 sample. X-axis -retention time in min, Y-axis -intensity in counts.