Foot pressure distribution in white rhinoceroses (Ceratotherium simum) during walking
- Published
- Accepted
- Subject Areas
- Animal Behavior, Zoology
- Keywords
- Perissodactyla, biomechanics, osteopathology, gait, mechanobiology, locomotion
- Copyright
- © 2018 Panagiotopoulou et al.
- Licence
- This is an open access article distributed under the terms of the Creative Commons Attribution License, which permits unrestricted use, distribution, reproduction and adaptation in any medium and for any purpose provided that it is properly attributed. For attribution, the original author(s), title, publication source (PeerJ Preprints) and either DOI or URL of the article must be cited.
- Cite this article
- 2018. Foot pressure distribution in white rhinoceroses (Ceratotherium simum) during walking. PeerJ Preprints 6:e27365v1 https://doi.org/10.7287/peerj.preprints.27365v1
Abstract
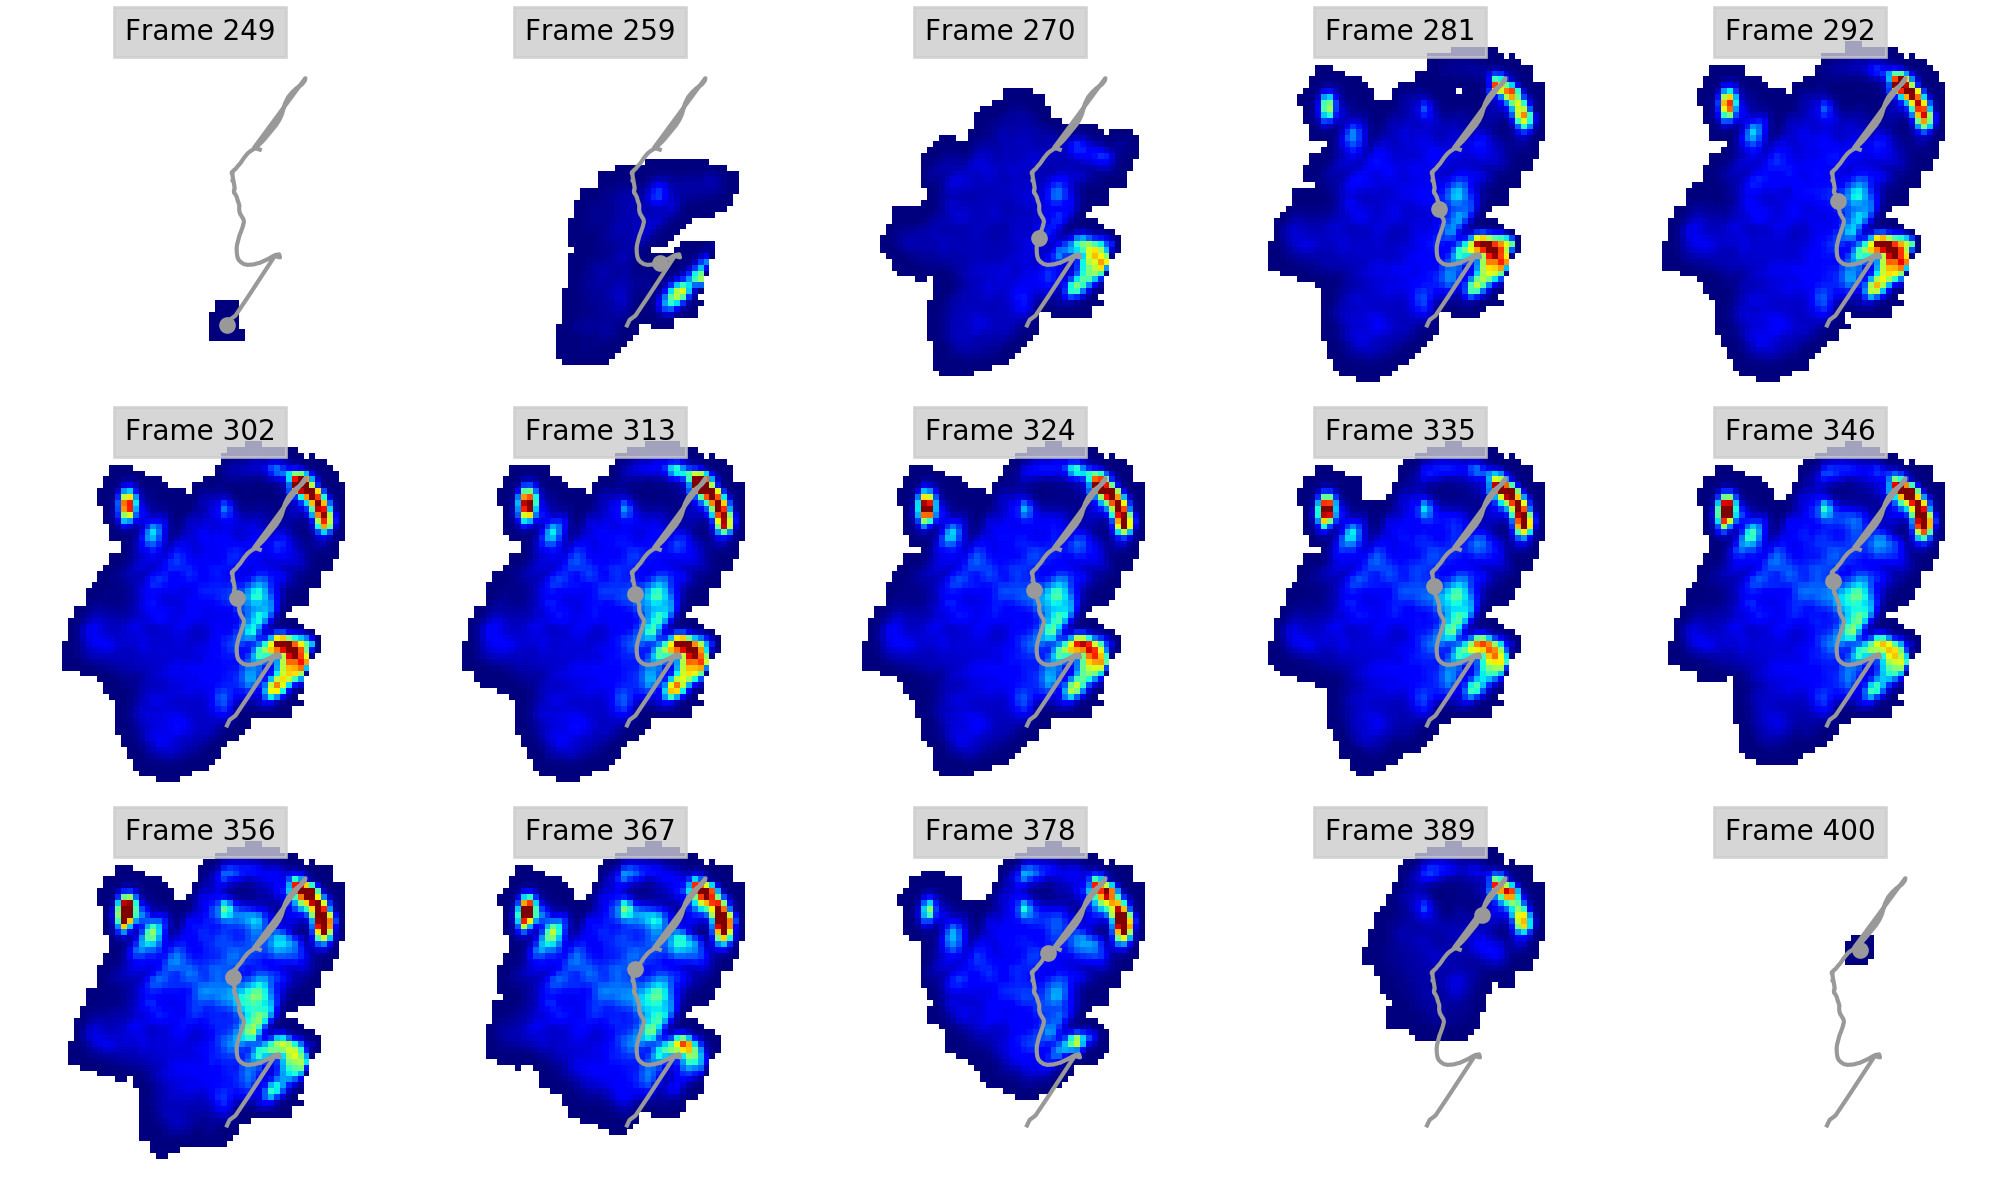
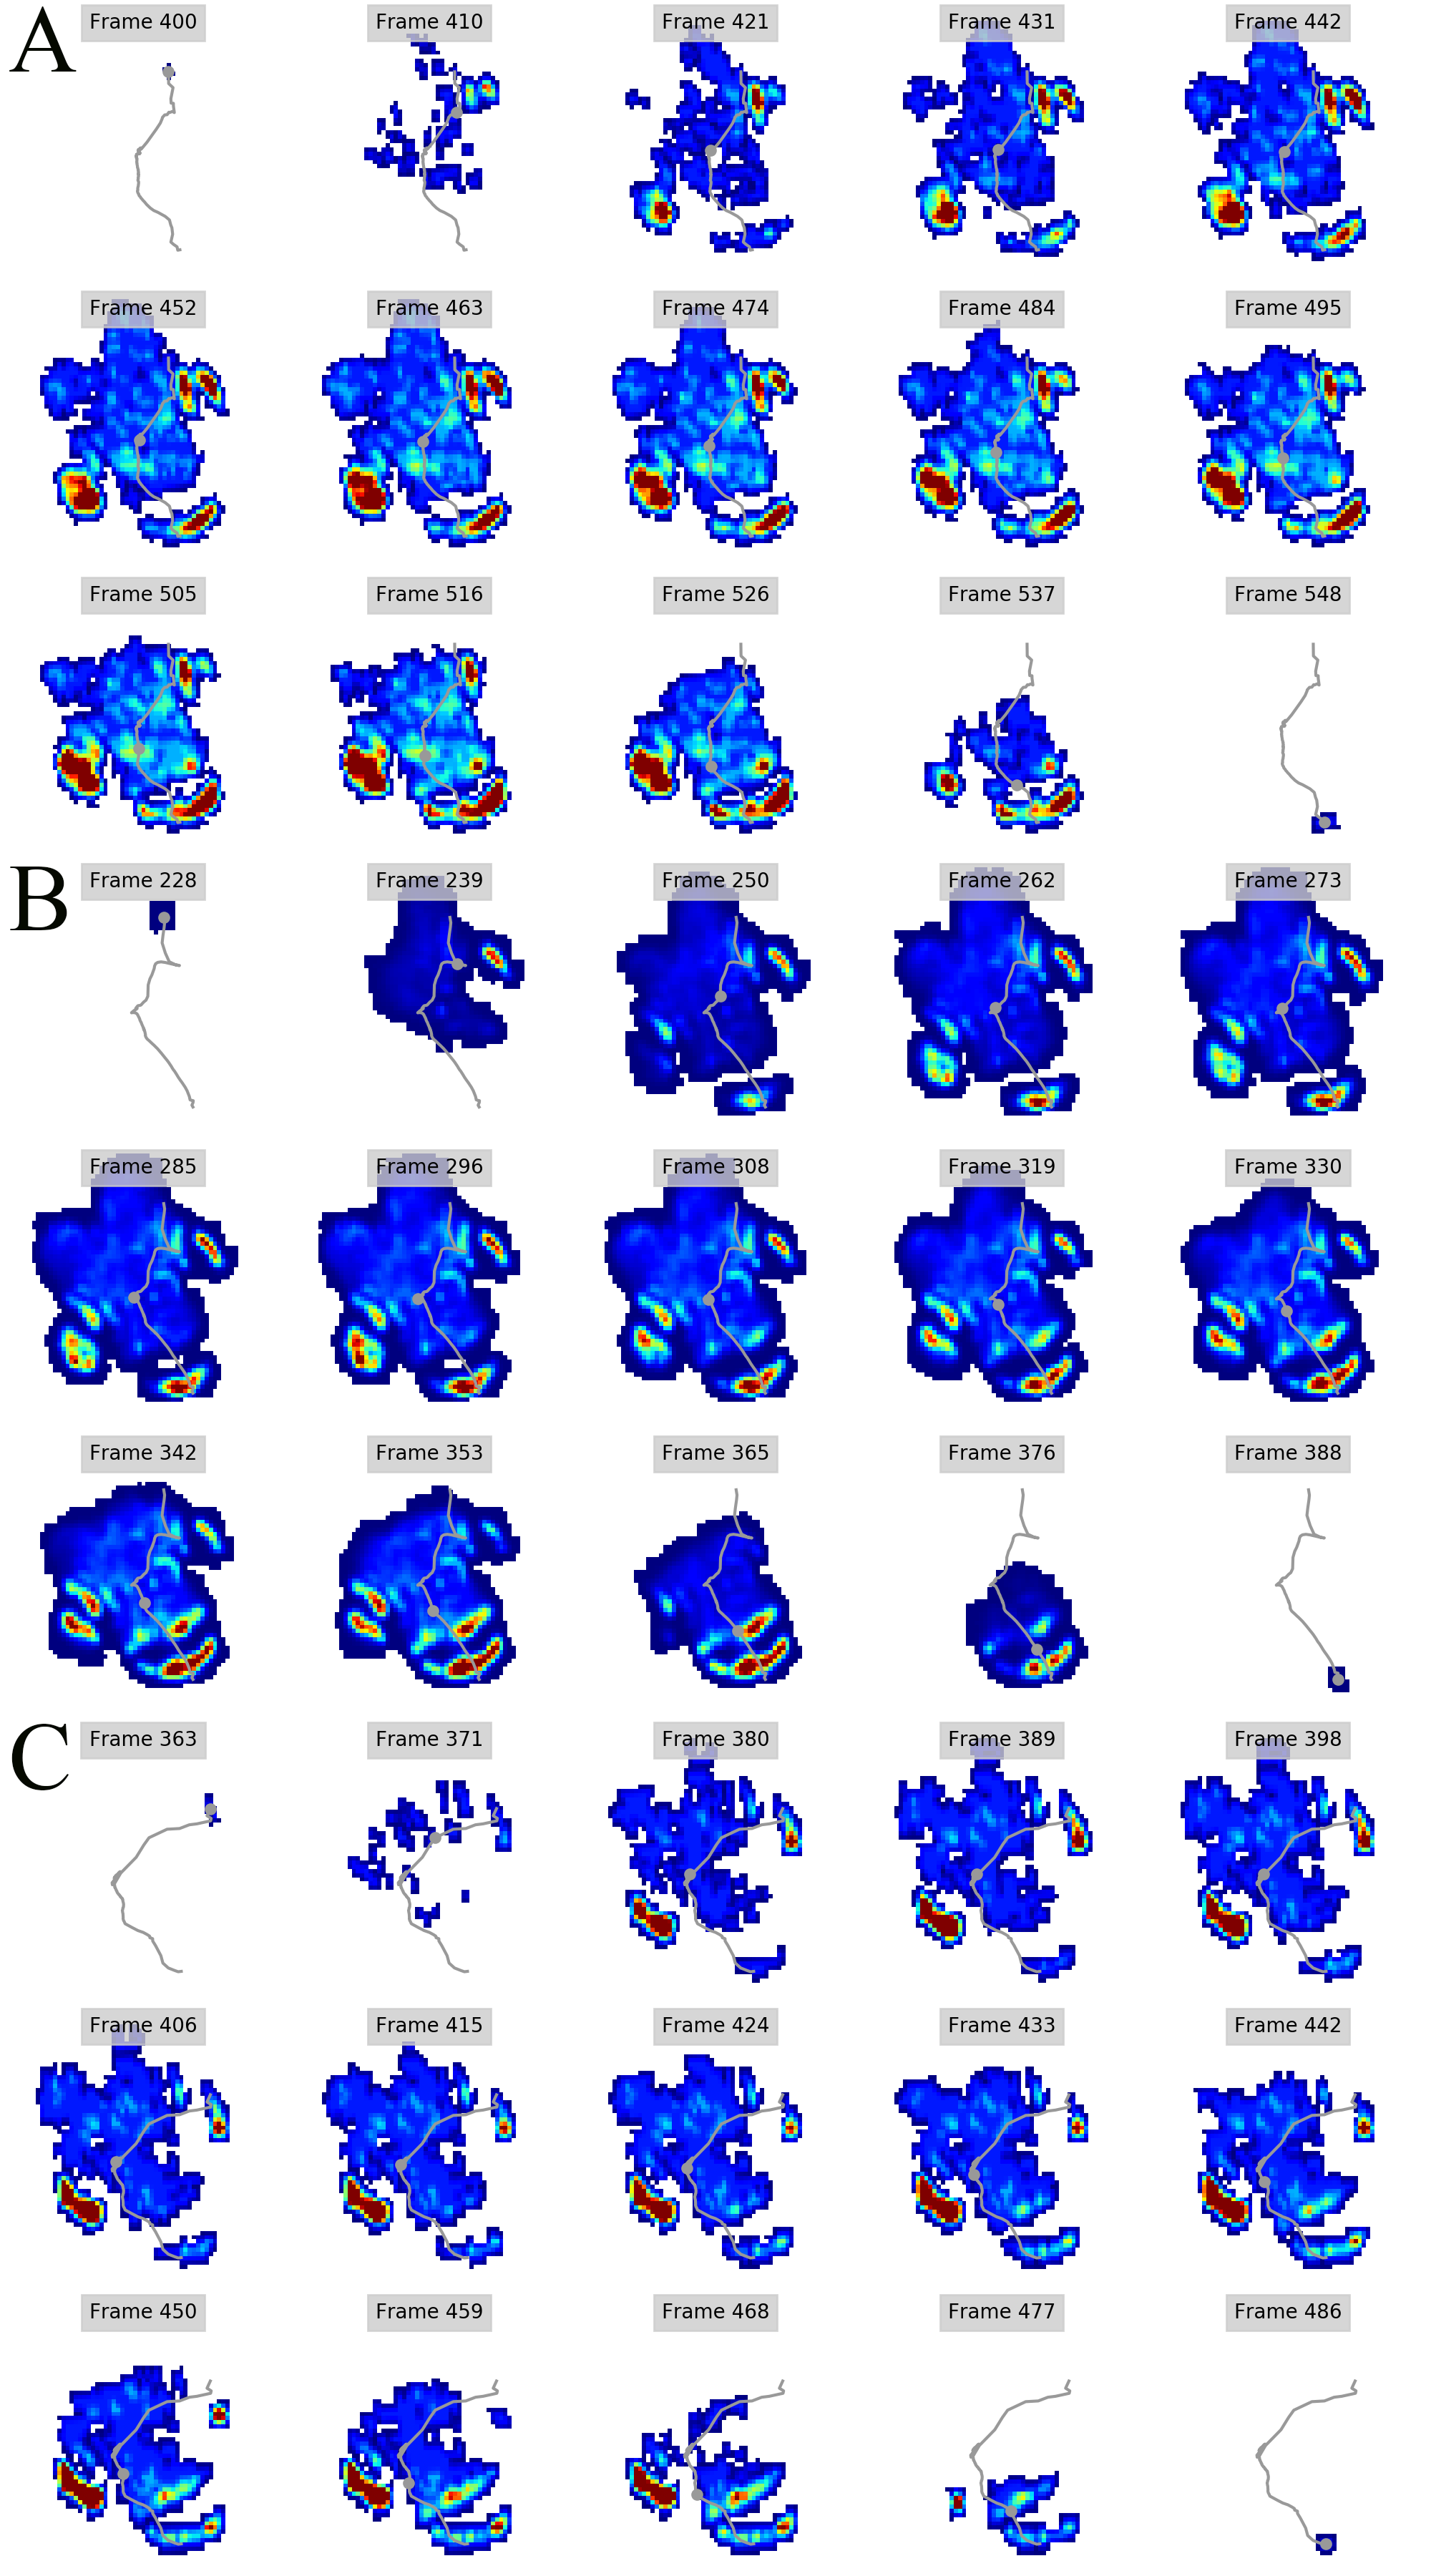
White rhinoceroses (Ceratotherium simum) are odd-toed ungulates that belong to the group Perissodactyla and are second only to elephants in terms of large body mass amongst extant tetrapods, making them fascinating studies for how large land animals support and move themselves. Rhinoceroses often are kept in captivity for protection from ivory poachers and for educational/touristic purposes, yet a detrimental side effect of captivity can be foot disease (i.e. enthesopathies and osteoarthritis around the phalanges). Foot diseases in large mammals are multifactorial, but locomotor biomechanics (e.g. pressures routinely experienced by the feet) surely can be a contributing factor. However, due to a lack of in vivo experimental data on rhinoceros foot pressures, our knowledge of locomotor performance and its links to foot disease is limited. The overall aim of this study was to characterize peak pressures and centre of pressure trajectories in white rhinoceroses during walking. We asked two major questions. First, are peak locomotor pressures the lowest around the fat pad and its lobes (as in the case of elephants)? Second, are peak locomotor pressures concentrated around the areas with the highest reported incidence of pathologies? Our results show a reduction of pressures around the fat pad and its lobes, which is potentially due to the material properties of the fat pad or the fact that our rhinoceros subjects avoided “heel” contact at impact. We also found an even and gradual concentration of foot pressures across all digits, which may be a by-product of the more horizontal foot roll-off during the stance phase. While our exploratory, descriptive sample precluded hypothesis testing, our study provides important new data on rhinoceros locomotion for future studies to build on, and thus impetus for improved implementation in the care of captive/managed rhinoceroses.
Author Comment
This is a submission to PeerJ for review.
Supplemental Information
Regional peak pressure data for all subjects and feet
Columns A-J show respectively the file name (A), subject ID (B), foot ID (C: left forefoot = 1; right forefoot = 2; left hindfoot = 3; right hindfoot = 4); ROI (D; also see Figure 1); peak pressure data in N cm-2 (E); walking speed in m s-1 (F); Shoulder height in metres (G); Froude number (H); Age (I; Adult=1; juvenile=2); Body mass estimate in kg (J; 1 = 2500; 2 = 1000). Some trials were excluded from further analyses due to being temporally incomplete. These are: [FORE LEFT: subject 1, trial 028_img001], [FORE RIGHT: subject 3, trial 033_img004; subject 3, trial 035_img003], HIND LEFT: subject 3, trial 010_img003], [HIND RIGHT: subject 3, trial 041_img006; subject 1, trial 001_img002; subject 1, trial 013_img005].