Summer diatom blooms in the eastern North Pacific gyre investigated with a long-endurance autonomous surface vehicle
- Published
- Accepted
- Subject Areas
- Ecosystem Science, Marine Biology, Biological Oceanography
- Keywords
- remote sensing, diatom bloom, oligotrophic ocean, marine, symbiosis, phytoplankton, autonomous vehicle, diatoms
- Copyright
- © 2018 Anderson et al.
- Licence
- This is an open access article distributed under the terms of the Creative Commons Attribution License, which permits unrestricted use, distribution, reproduction and adaptation in any medium and for any purpose provided that it is properly attributed. For attribution, the original author(s), title, publication source (PeerJ Preprints) and either DOI or URL of the article must be cited.
- Cite this article
- 2018. Summer diatom blooms in the eastern North Pacific gyre investigated with a long-endurance autonomous surface vehicle. PeerJ Preprints 6:e26961v1 https://doi.org/10.7287/peerj.preprints.26961v1
Abstract
Satellite chlorophyll (chl) observations have repeatedly observed summertime phytoplankton blooms in the North Pacific subtropical gyre (NPSG), a region of open ocean that is far removed from any land-derived or Ekman upwelling nutrient sources. These blooms are dominated by N2-fixing diatom-cyanobacteria associations of the diatom genera Rhizosolenia Brightwell and Hemiaulus Ehrenberg. Their nitrogen fixing endosymbiont, Richelia intracellularis J.A. Schmidt, is hypothesized to be critical to the development of blooms in this nitrogen limited region. However, due to the remote location and unpredictable duration of the summer blooms, prolonged in situ observations are rare outside of the Station ALOHA time-series off of Hawai’i. In summer, 2015, a proof-of–concept mission using the autonomous vehicle, Honey Badger (Wave Glider SV2), collected near-surface (<20m) observations in the NPSG using hydrographic, meteorological, optical, and imaging sensors designed to focus on phytoplankton abundance, distribution and physiology of this bloom-forming region. Hemiaulus and Rhizosolenia cell abundance was determined using digital holography for the entire June-November mission. Honey Badger was not able to reach the 30°N subtropical front region where most of the satellite chl blooms have been observed, but near-real time navigational control allowed it to transect two blooms near 25°N. The two taxa did not co-occur in large numbers, rather the blooms were dominated by either Hemiaulus or Rhizosolenia. The 2-4 August 2015 bloom was comprised of 96% Hemiaulus and the second bloom, 15-17 August 2015, was dominated by Rhizosolenia (75%). The holograms also imaged undisturbed, fragile Hemiaulus aggregates throughout the sampled area at ~10 L-1. Aggregated Hemiaulus represented the entire observed population at times and had a widespread distribution independent of the SEP. Aggregate occurrence was not consistent with a density dependent formation mechanism and may represent a natural growth form in undisturbed conditions. The photosynthetic potential index (Fv:Fm) increased from ~0.4 to ~0.6 during both blooms indicating a physiologically robust phytoplankton community in the blooms. The diel pattern of Fv:Fm(nocturnal maximum; diurnal minimum) was consistent with macronutrient limitation throughout the mission with no evidence of Fe-limitation despite the presence of nitrogen fixing diatom-diazotroph assemblages. During the 5-month mission, Honey Badger covered ~5690 km (3070 nautical miles), acquired 9336 holograms, and reliably transmitted data onshore in near real-time. Software issues developed with the active fluorescence sensor that terminated measurements in early September. Although images were still useful at the end of the mission, fouling of the LISST-Holo optics was considerable, and appeared to be the most significant issue facing deployments of this duration.
Author Comment
This is a submission to PeerJ for review.
Supplemental Information
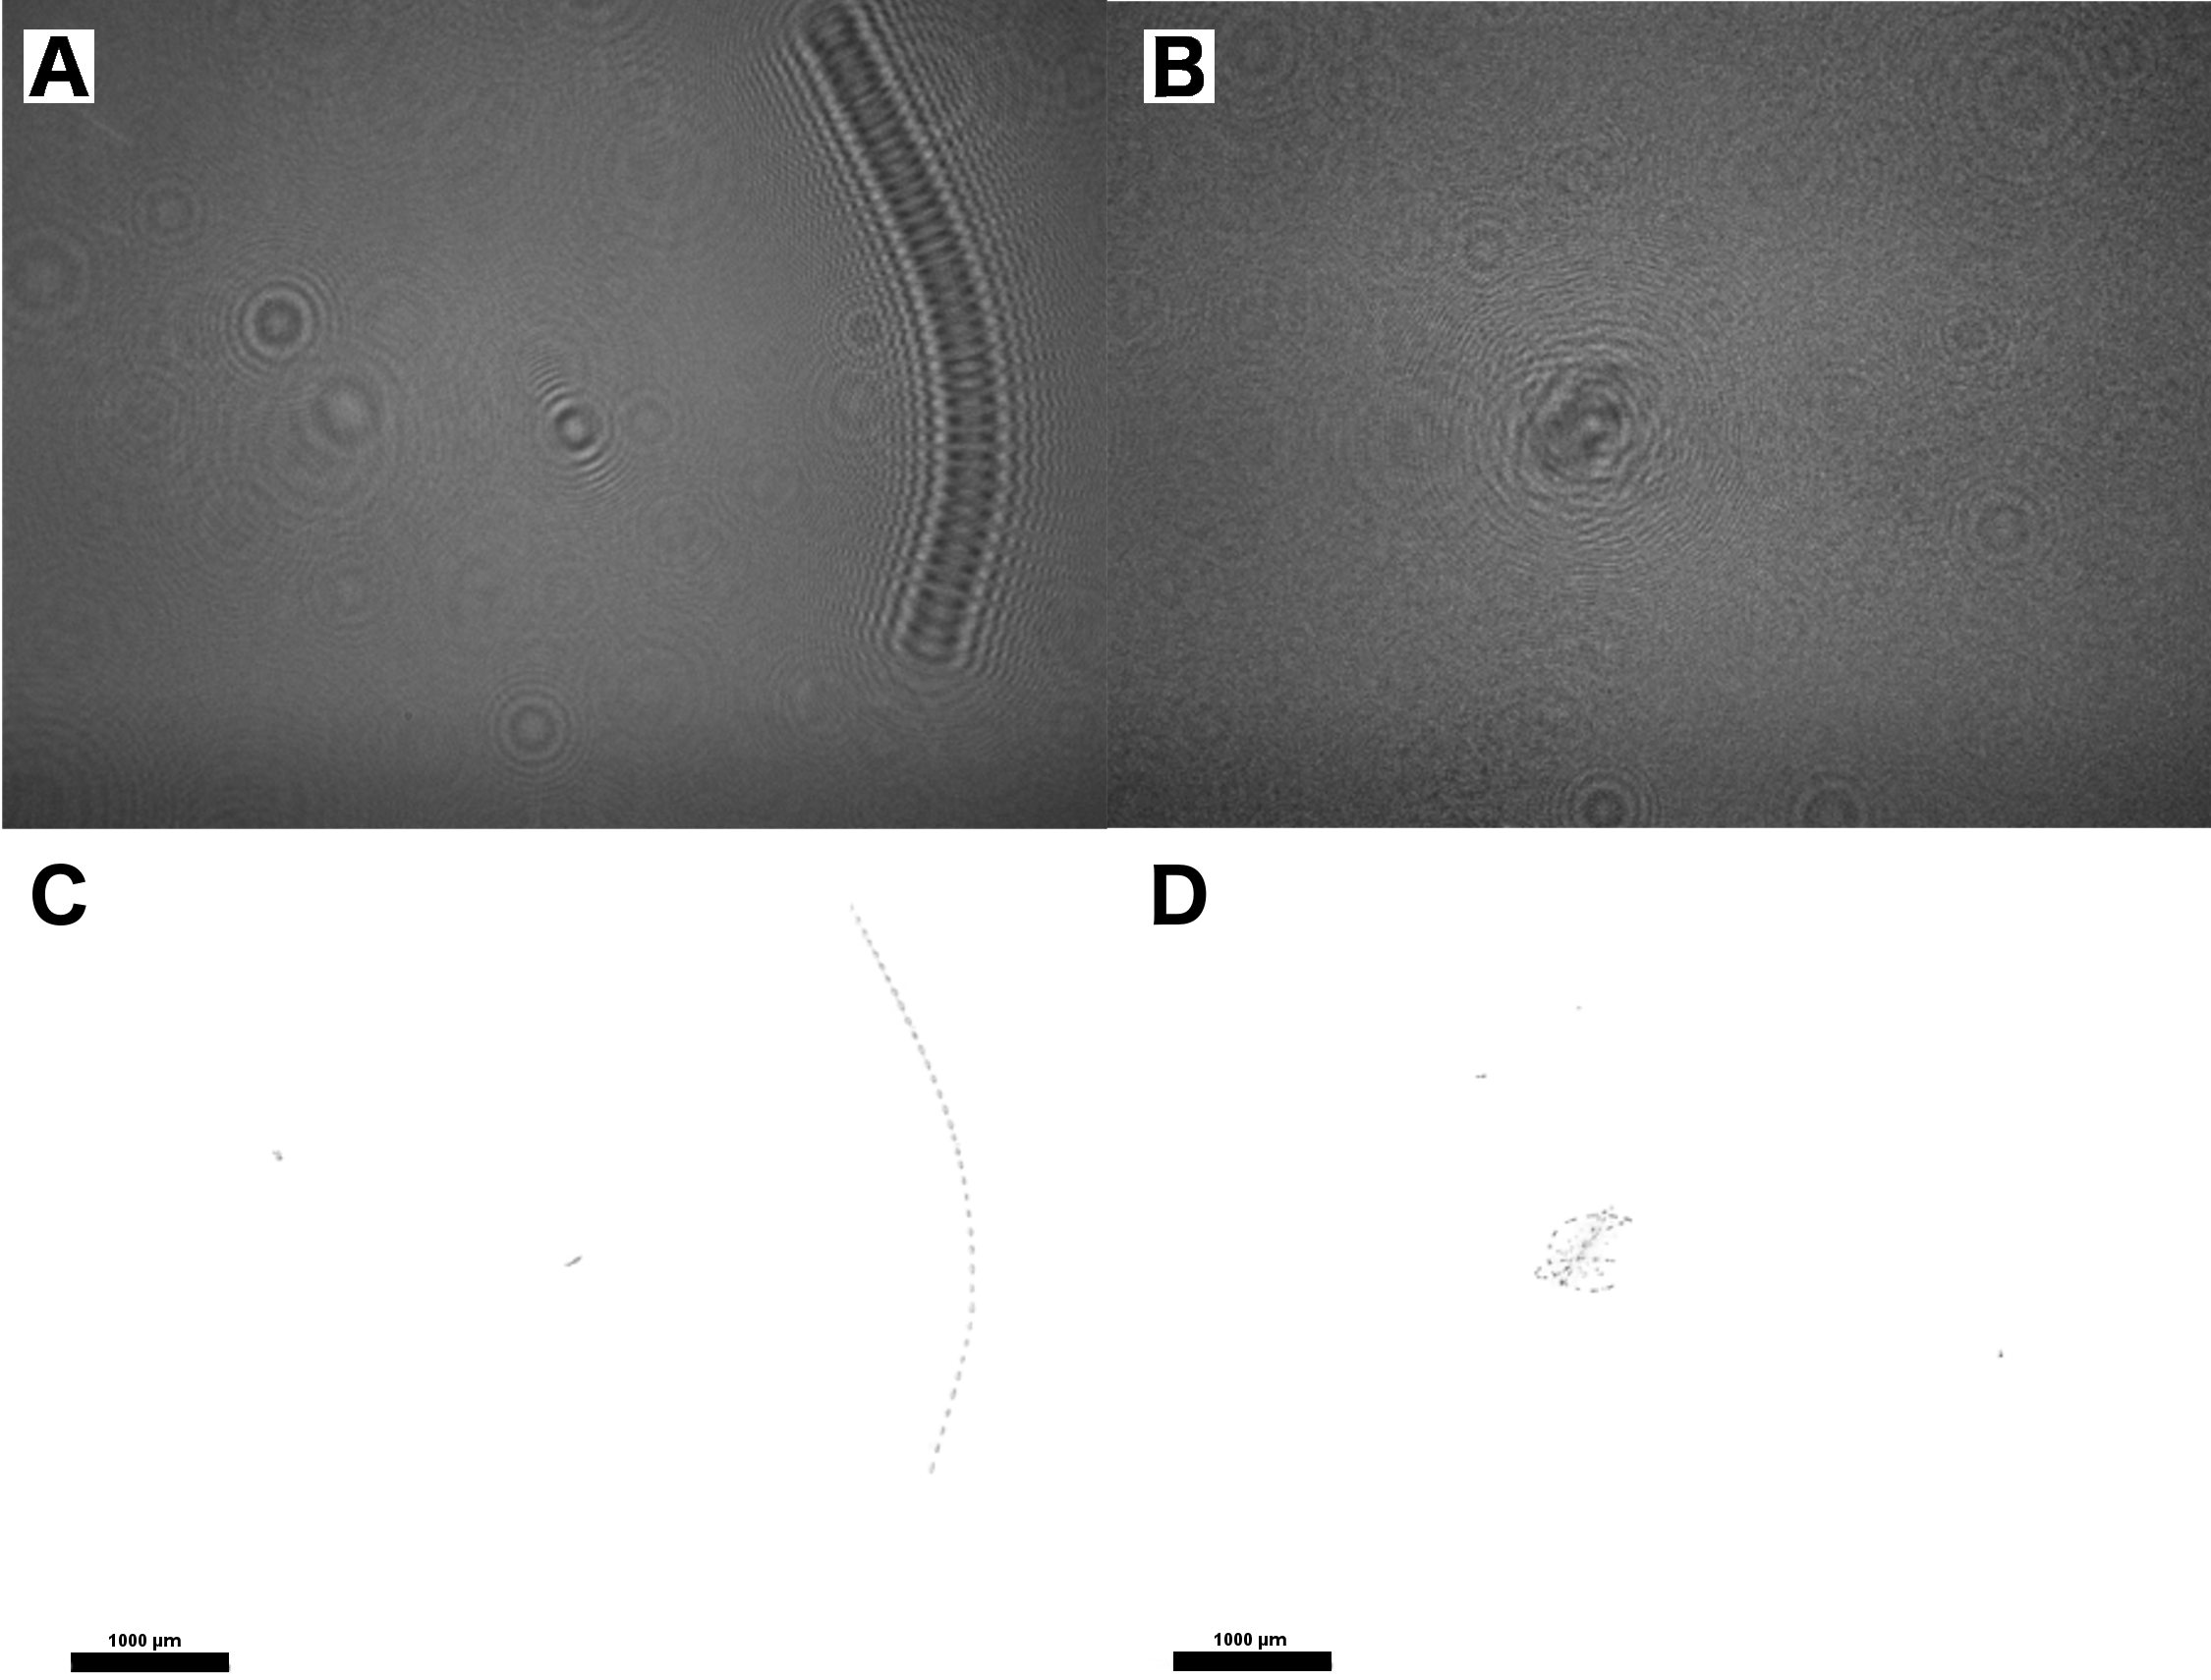
Hologram fouling comparison
(A) clean hologram early in mission (image 004-0973; 6/14/15 2:54), (B) dirty hologram late in mission (image 004-9029), note the extensive background refraction patterns caused by fouling. (C) Batch processed (image 004-0973: 10/27/15 19:57) (D) Batch processed (image 004-0973; 6/14/15 02:54).
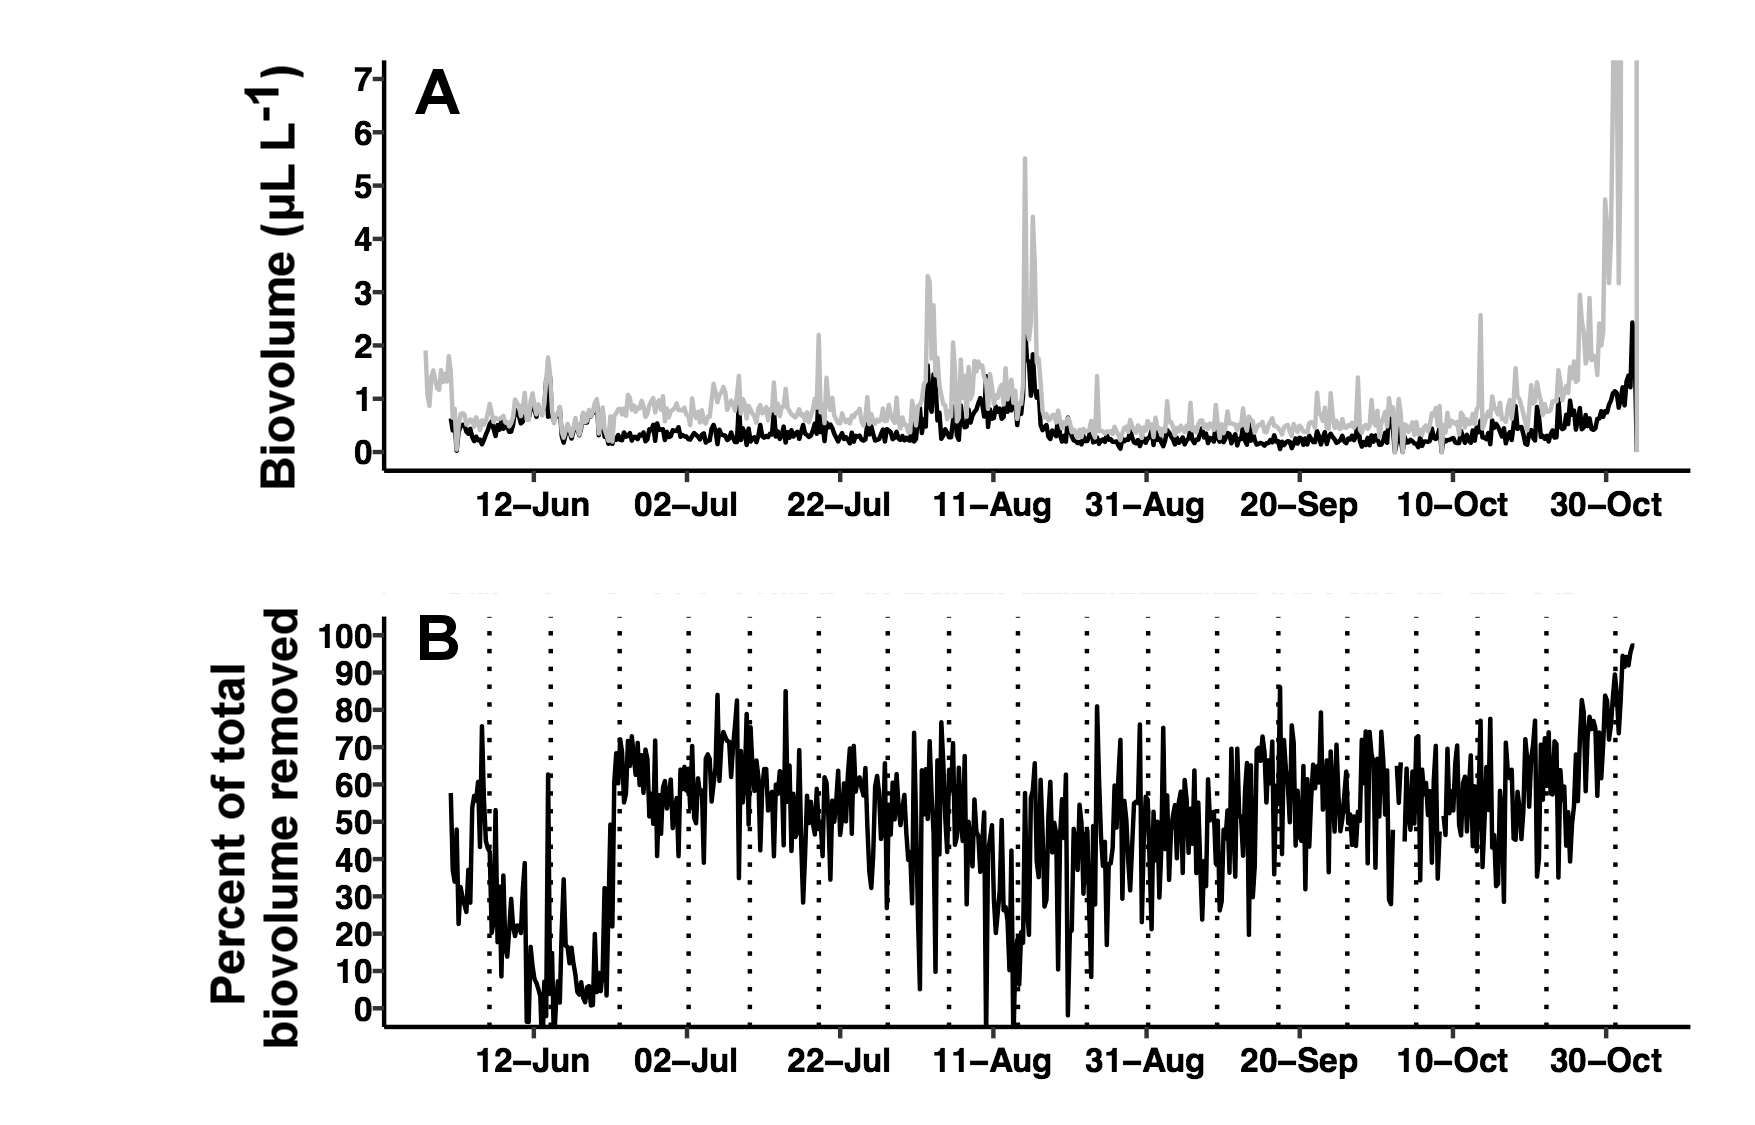
Biofouling corrections and impact on volume calculations
(A) Total biovolume reported by the LISST-Holo software (grey line) and corrected biovolume after background removal (black line). (B) Percentage of biovolume removed from the images over time. Vertical dotted lines are endpoints of the background averaging window (see text for details).
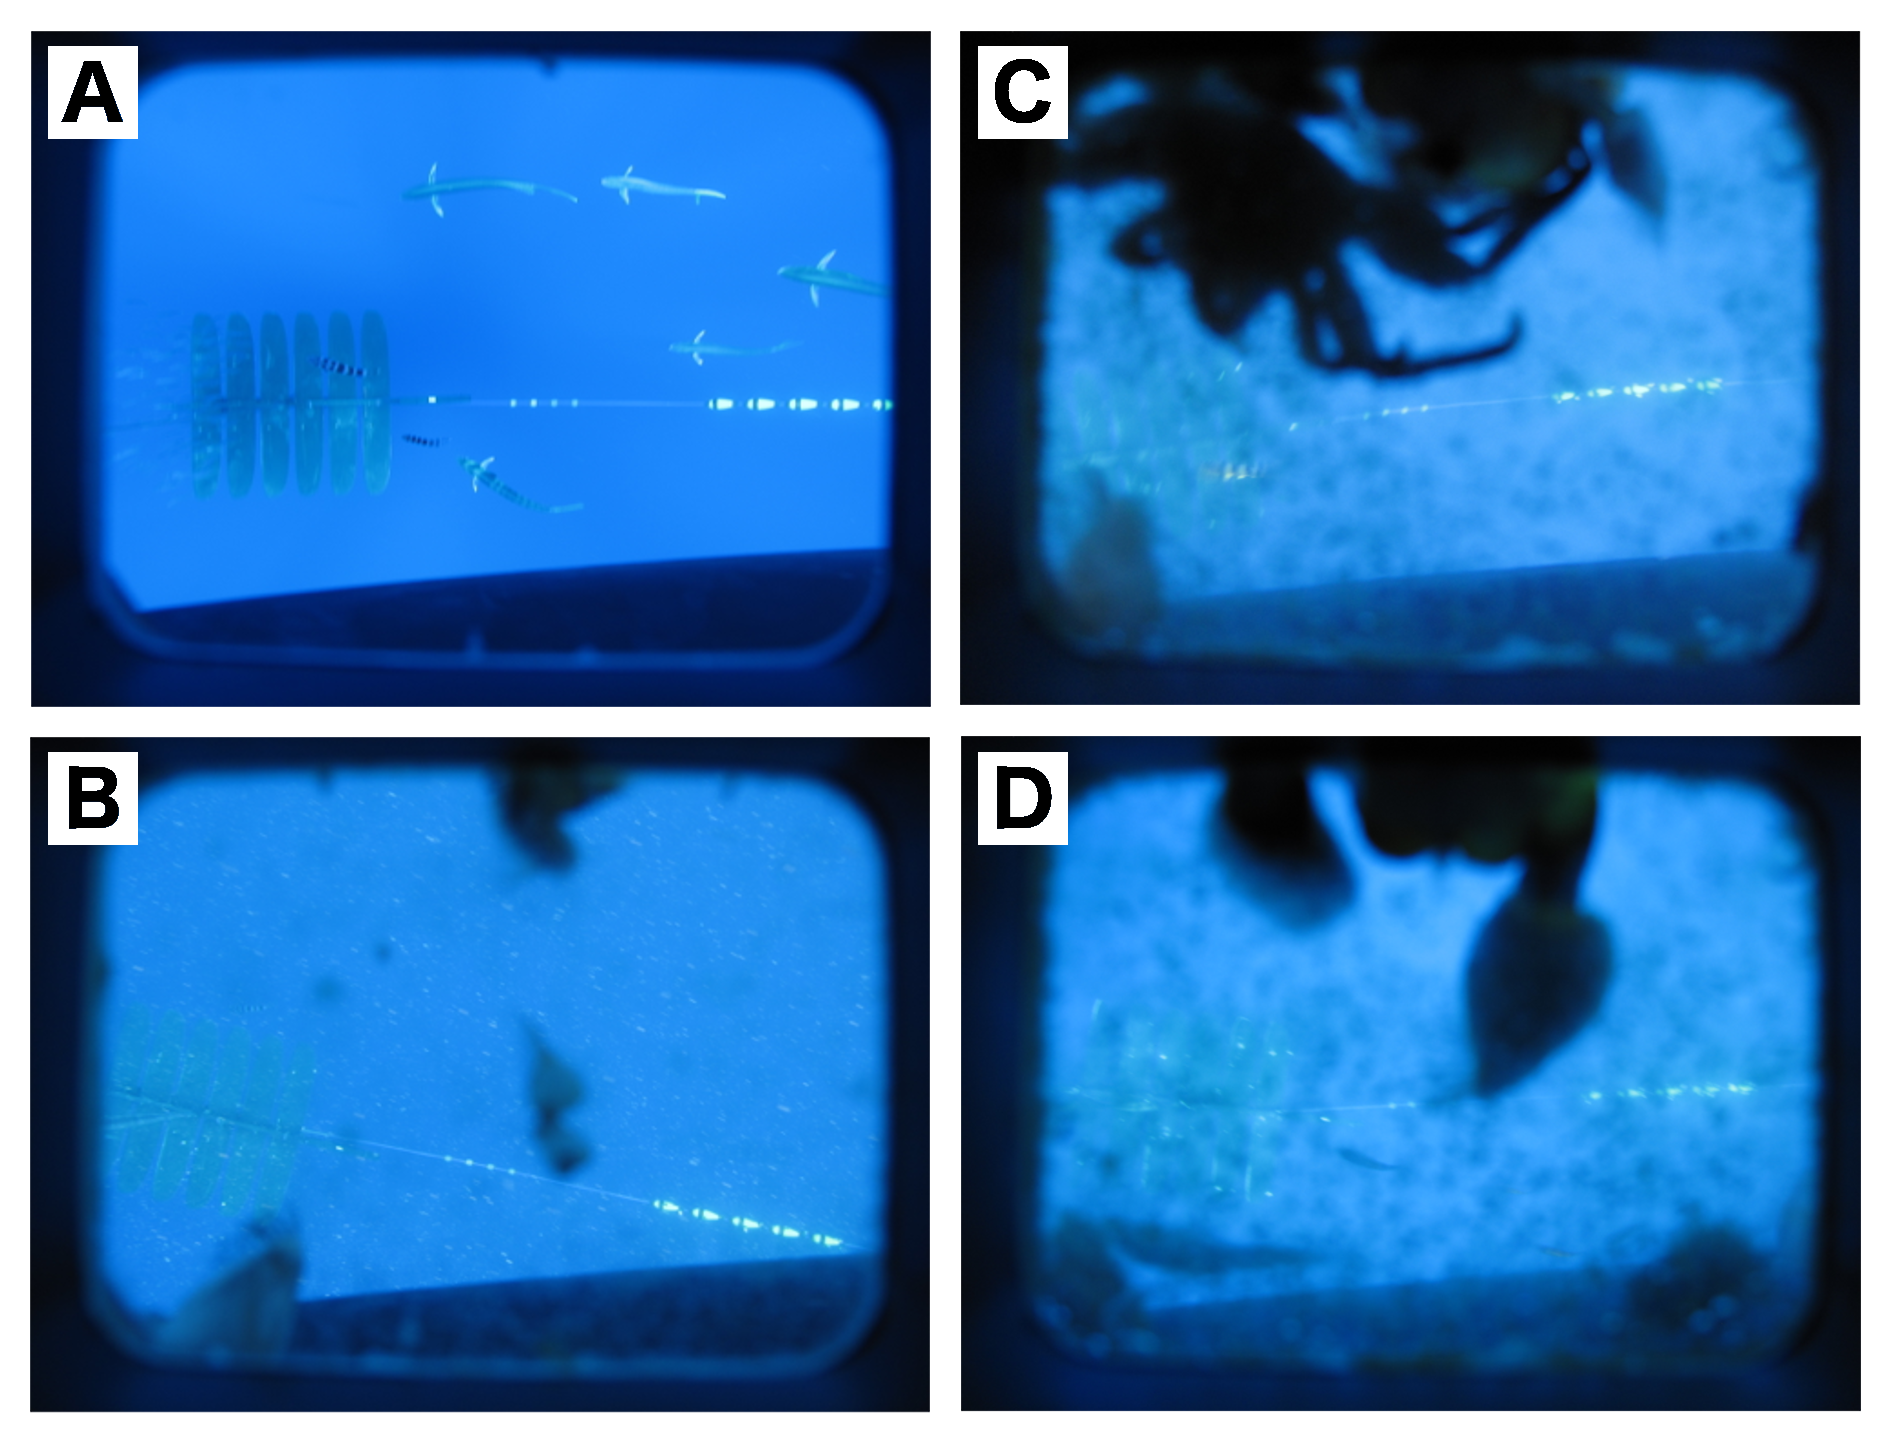
Images from the Canon G10 downward facing camera illustrating biofouling buildup
(A) IMG_20150701220016, 1 July 2015 1200 local time. (B) IMG_20150823220014 23 Aug. 2015 1200 local time. This image illustrates an apparent accumulation of marine aggregates. (C) IMG 20150920170016. 21 Sept. 2015 0700 local time. (D) IMG_201510312200 31 Oct. 2015 1200 local time.
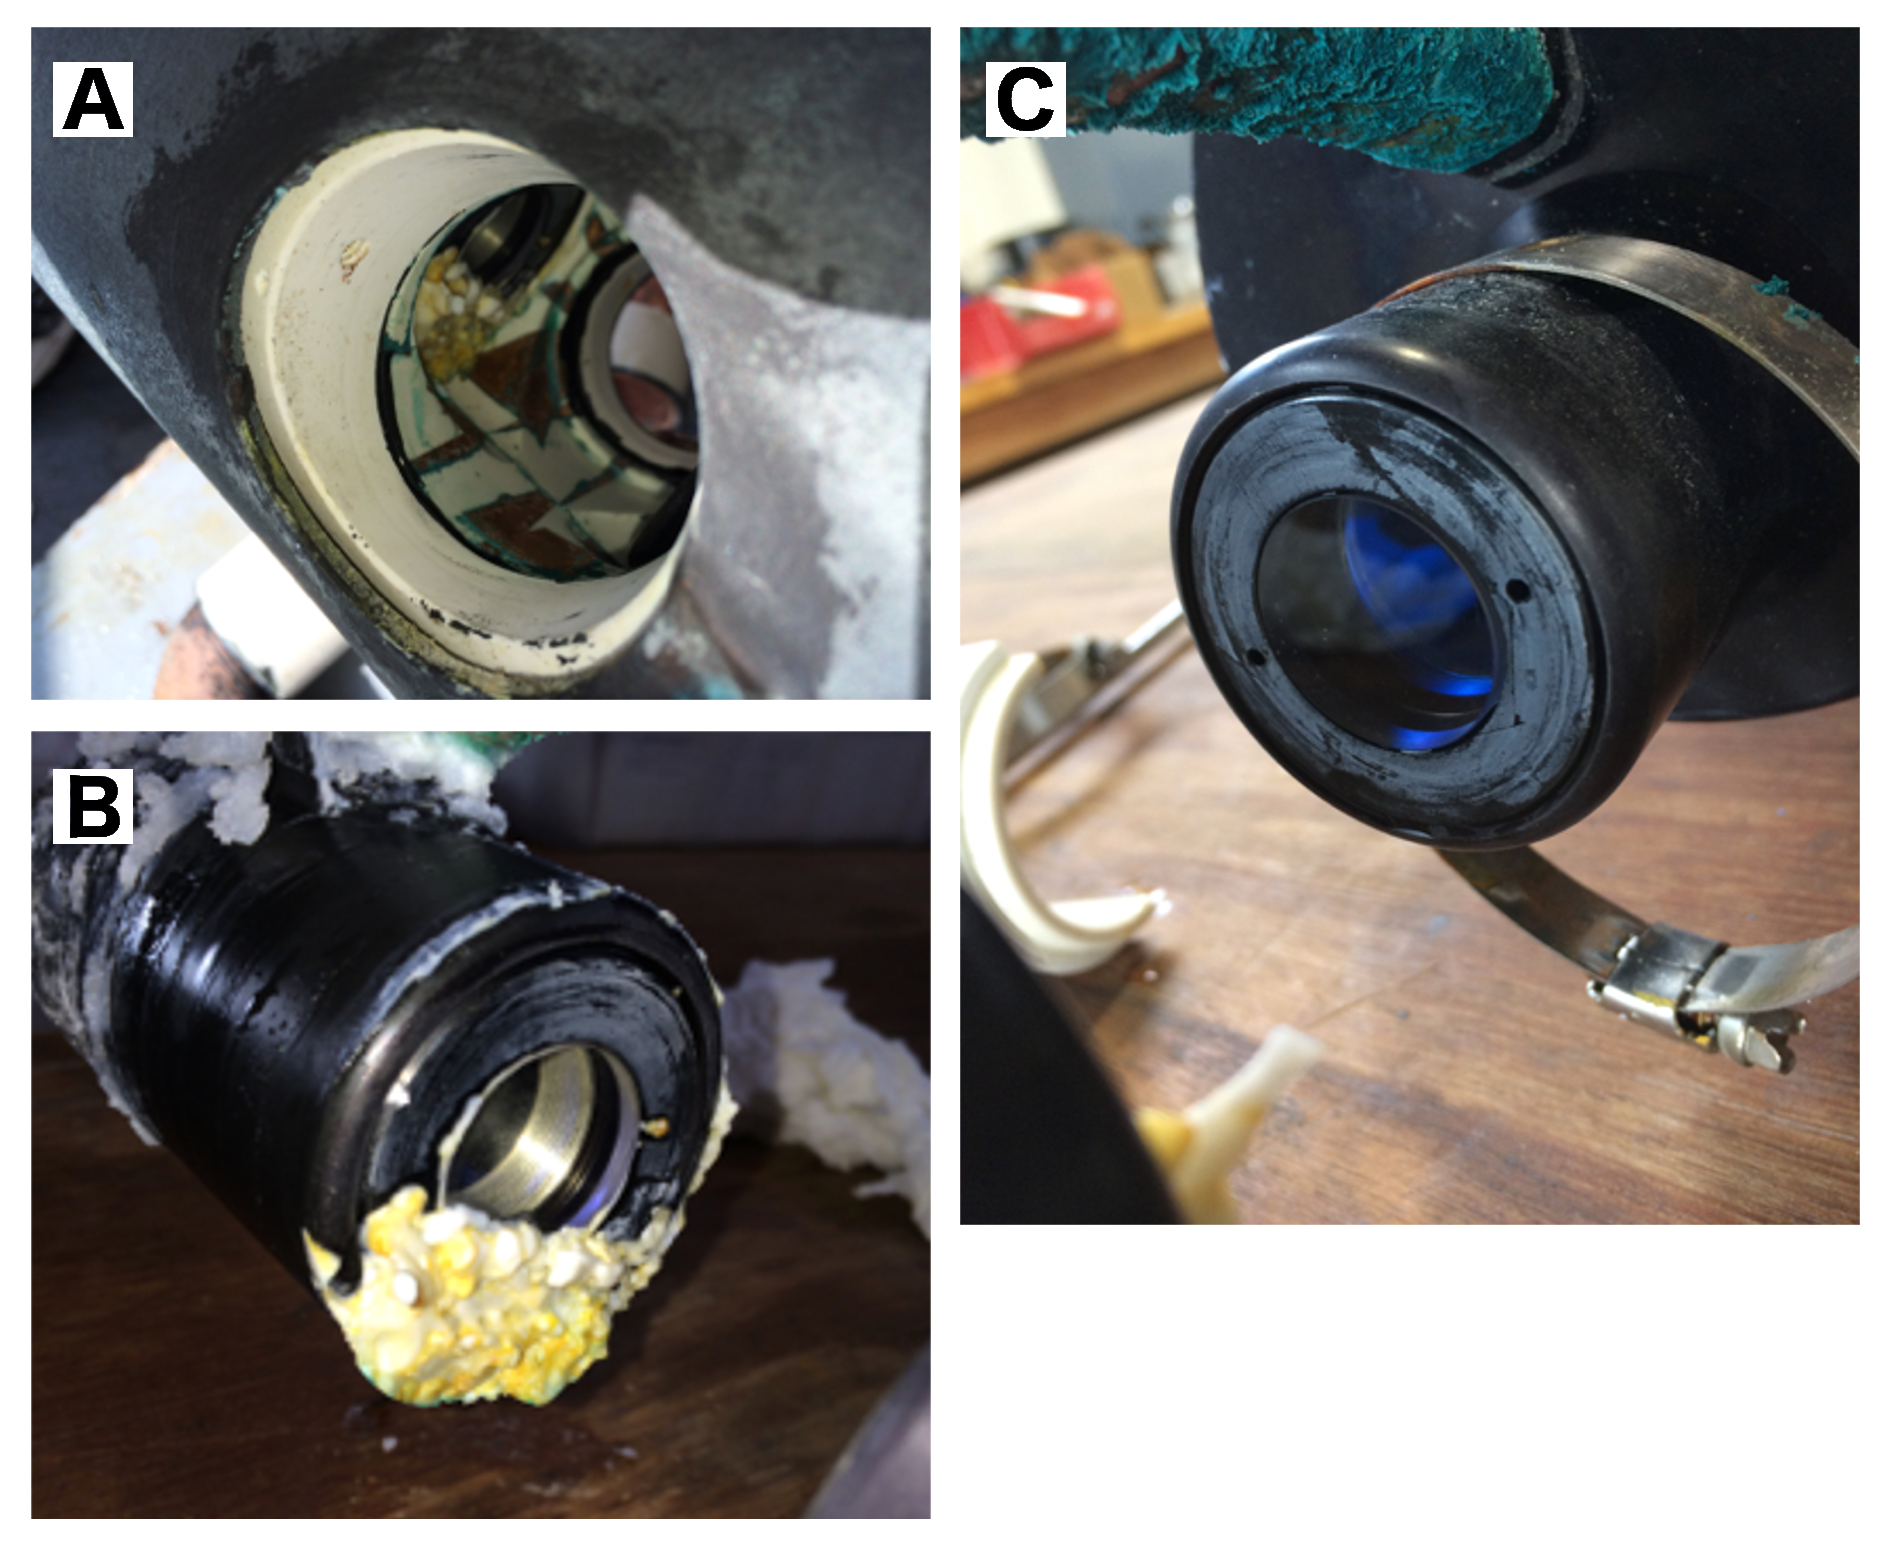
LISST-Holo sampling chamber and camera
(A) Looking into the sampling chamber. Corrosion is evident as a yellow-white material on the lower left of the camera. Note that it does not extend into the active optical sampling area. No macroscopic fouling is evident. (B) close up of corrosion after LISST-Holo was removed from the tow body. (C) Laser optical window noting no corrosion or macroscopic fouling.
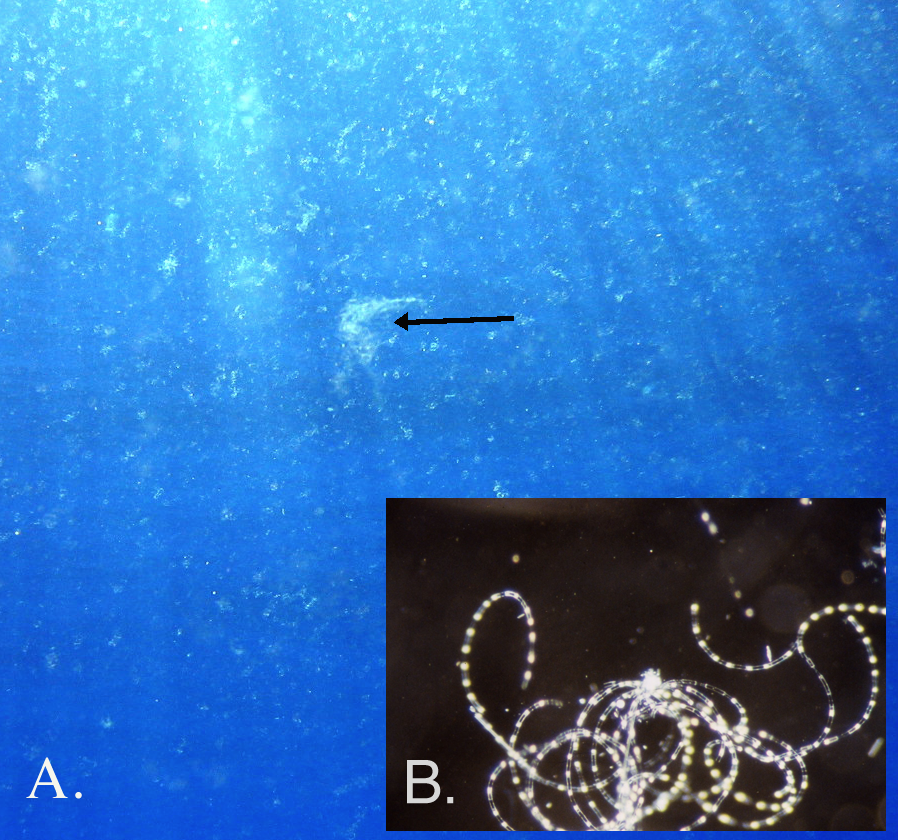
Hemiaulus snowstorm observed by divers on 31 Aug. 2003 in the central N. Pacific gyre
(A) The arrow indicates a Rhizosolenia mat. The remainder of the flocs were Hemiaulus aggregates (B) Stereoscope microgaphy of a Hemiaulus aggregate. Figure from Villareal et al (2011).
PhytoFlash diel rhythms immediately before the PhytoFlash failure in early September
Fv:Fmvalues showed a normal diel rhythm (nocturnal maxima; diurnal minima) up to 1 September 2015. At this time, both the Fmand Fo used to calculated this value began a fatal upward drift that was not reflective of ambient chlorophyll concentrations from the satellite data. The values exceeded previously observed values by a factor of 3-4 until the instrument shut down and could not be restarted. Data after mid-day 1 Sept. is considered compromised and not useable for Fe-index determination. It is indicated on Fig 9b as the asterisked points.