1H Nuclear magnetic resonance-based metabolomic study for Cabernet Sauvignon wines in different vintages
- Published
- Accepted
- Subject Areas
- Agricultural Science, Biochemistry, Food Science and Technology
- Keywords
- Wine, Metabolomics, NMR, Pattern recognition
- Copyright
- © 2016 Hu et al.
- Licence
- This is an open access article distributed under the terms of the Creative Commons Attribution License, which permits unrestricted use, distribution, reproduction and adaptation in any medium and for any purpose provided that it is properly attributed. For attribution, the original author(s), title, publication source (PeerJ Preprints) and either DOI or URL of the article must be cited.
- Cite this article
- 2016. 1H Nuclear magnetic resonance-based metabolomic study for Cabernet Sauvignon wines in different vintages. PeerJ Preprints 4:e2332v1 https://doi.org/10.7287/peerj.preprints.2332v1
Abstract
An 1H NMR-based metabolomic study was used to characterize 2009, 2010, 2011, and 2012 vintages of Cabernet Sauvignon wines from Ningxia that were vinified in the same fermentation technique. The pattern recognition methods of principal component analysis (PCA) and partial least squares discriminant analysis (PLS-DA) clearly distinguished vintages of wine, driven by the following metabolites: valine,2,3-butanediol, ethyl acetate, proline, succinic acid, lactic acid, acetic acid, glycerol, gallic acid and choline. The PLS-DA loading plots also differentiated between the metabolites of different vintages. The highest levels of valine, 2,3-butanediol, gallic acid and proline were found in the 2009 vintage wines. The 2011 vintage wines contained the highest levels of lactic acid, and the highest levels of ethyl acetate, succinic acid, glycerol and choline were detected in the 2012 vintage wines. A total of 8 metabolites were selected from the 1H NMR spectra and quantified according to their peak areas, yielding concentrations in a greement with the PLS-DA results.
Author Comment
This is a submission to PeerJ for review.
Supplemental Information
Raw Date of 1H_Nuclear_magnetic_resonance based_metabolomic_study_for_Cabernet_Sauvignon_Wines_in_Different_Vintages
image of PCA score plot of Cabernet Sauvignon wines of different vintages
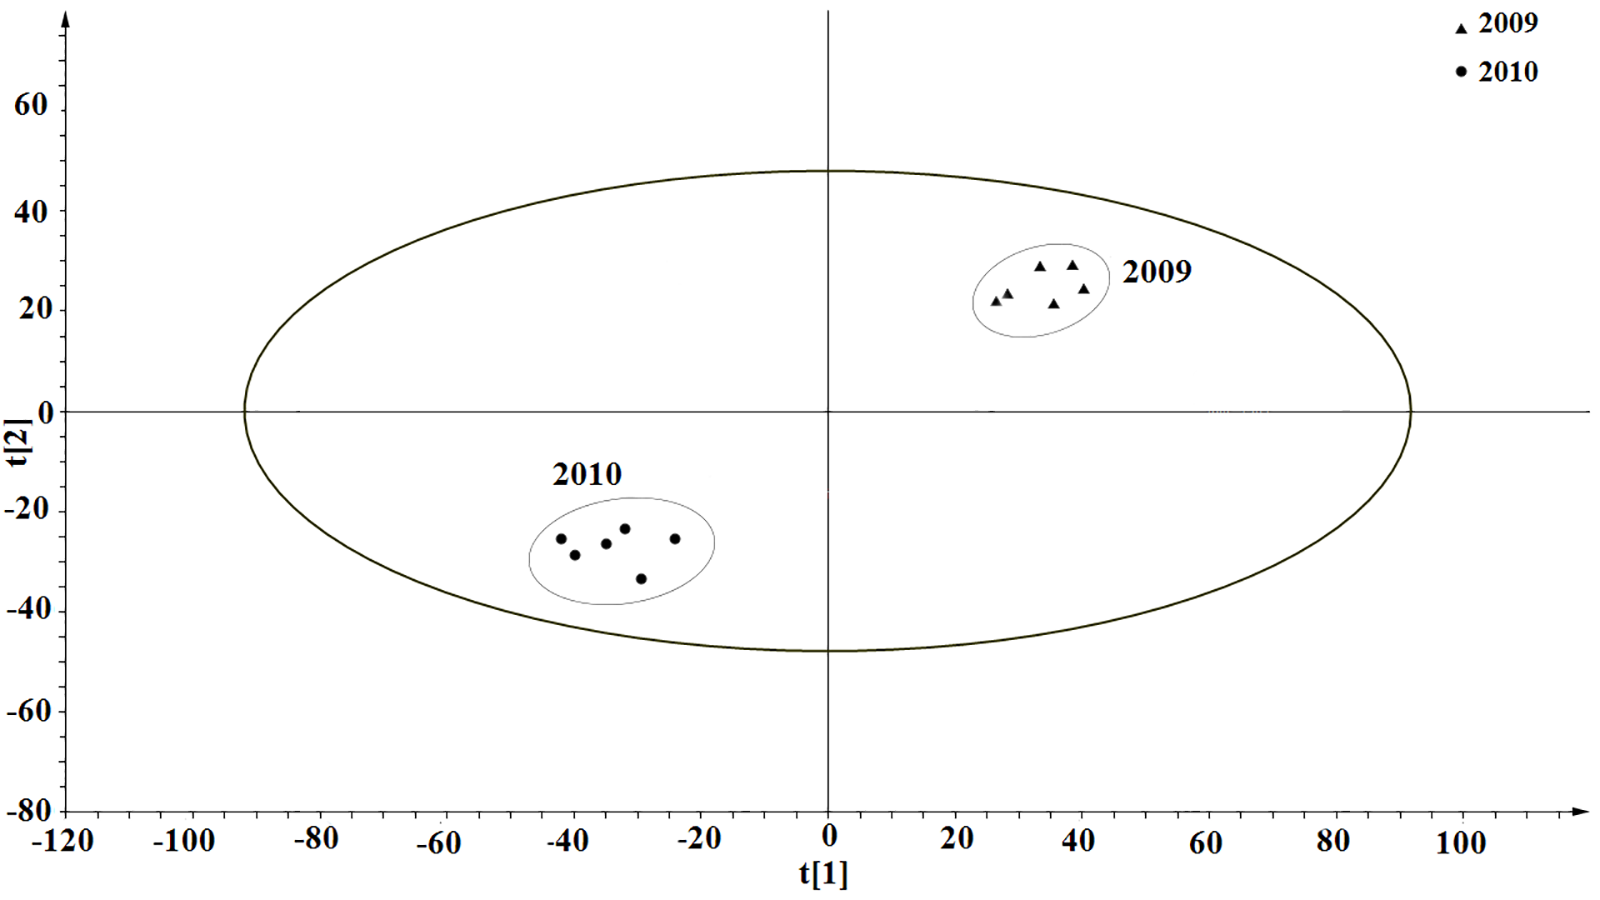
image of PLS-DA score plot derived from the 1HNMR spectra of 2009 and 2010 vintage Cabernet Sauvignon wines
Triangle shows the Cabernet Sauvignon wines vinified in the 2009 vintages
Round shows the Cabernet Sauvignon wines vinified in the 2010 vintages
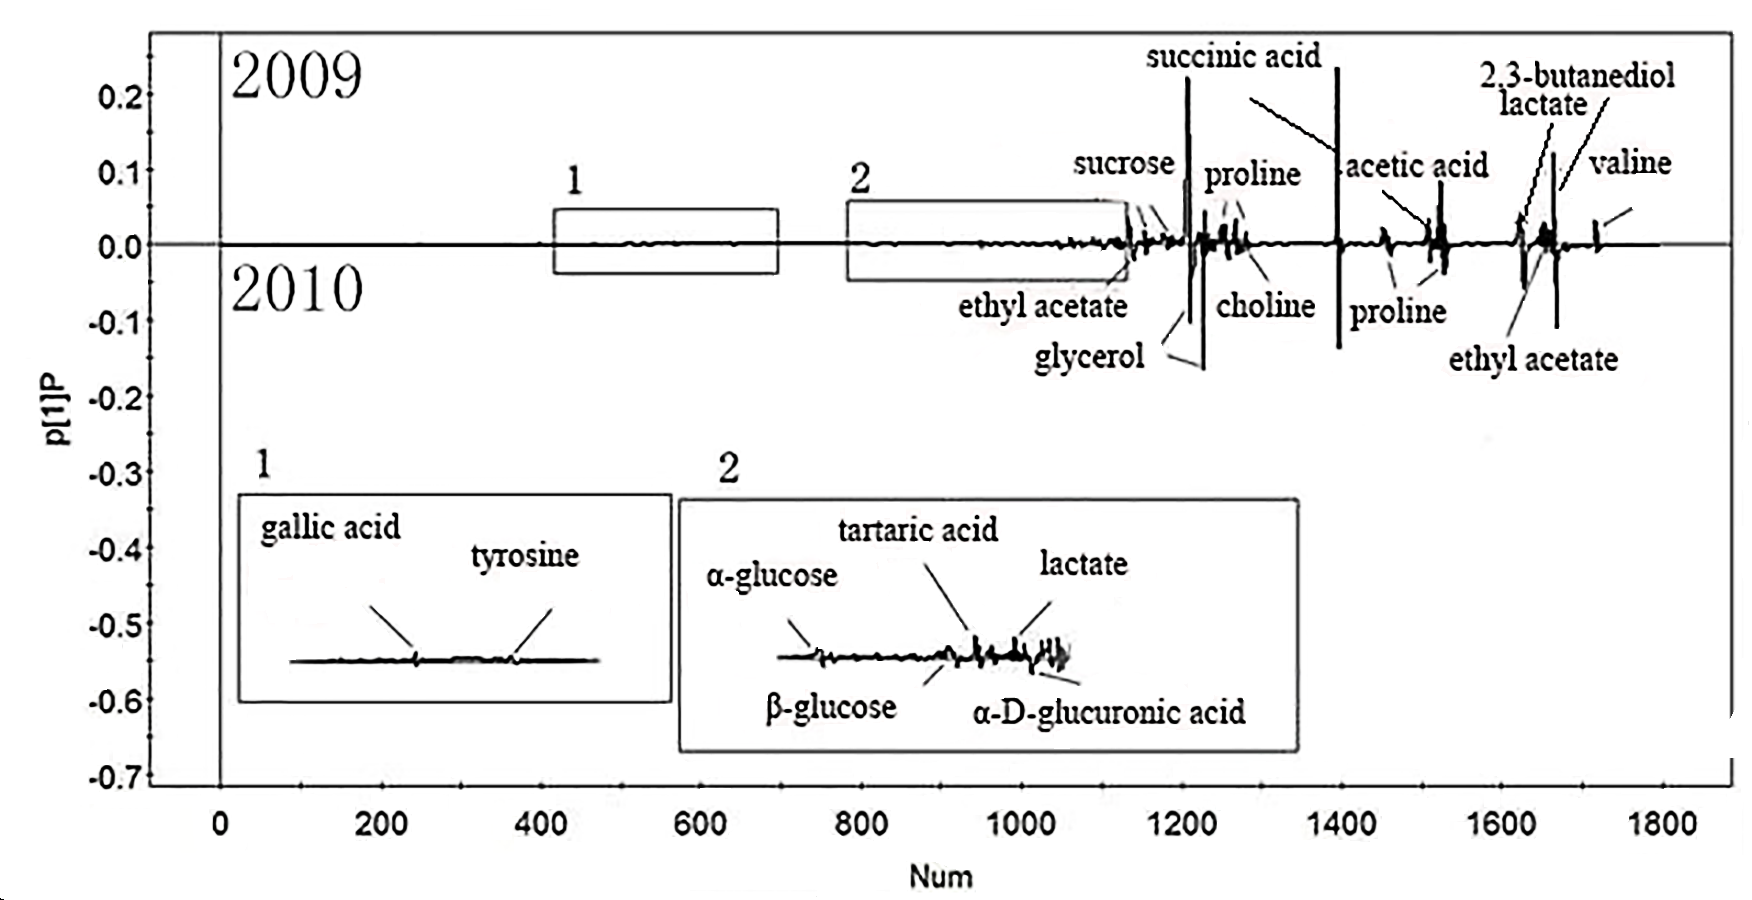
Image of PLS-DA loading plot derived from the 1HNMR spectra of 2009 and 2010 vintage Cabernet Sauvignon wines
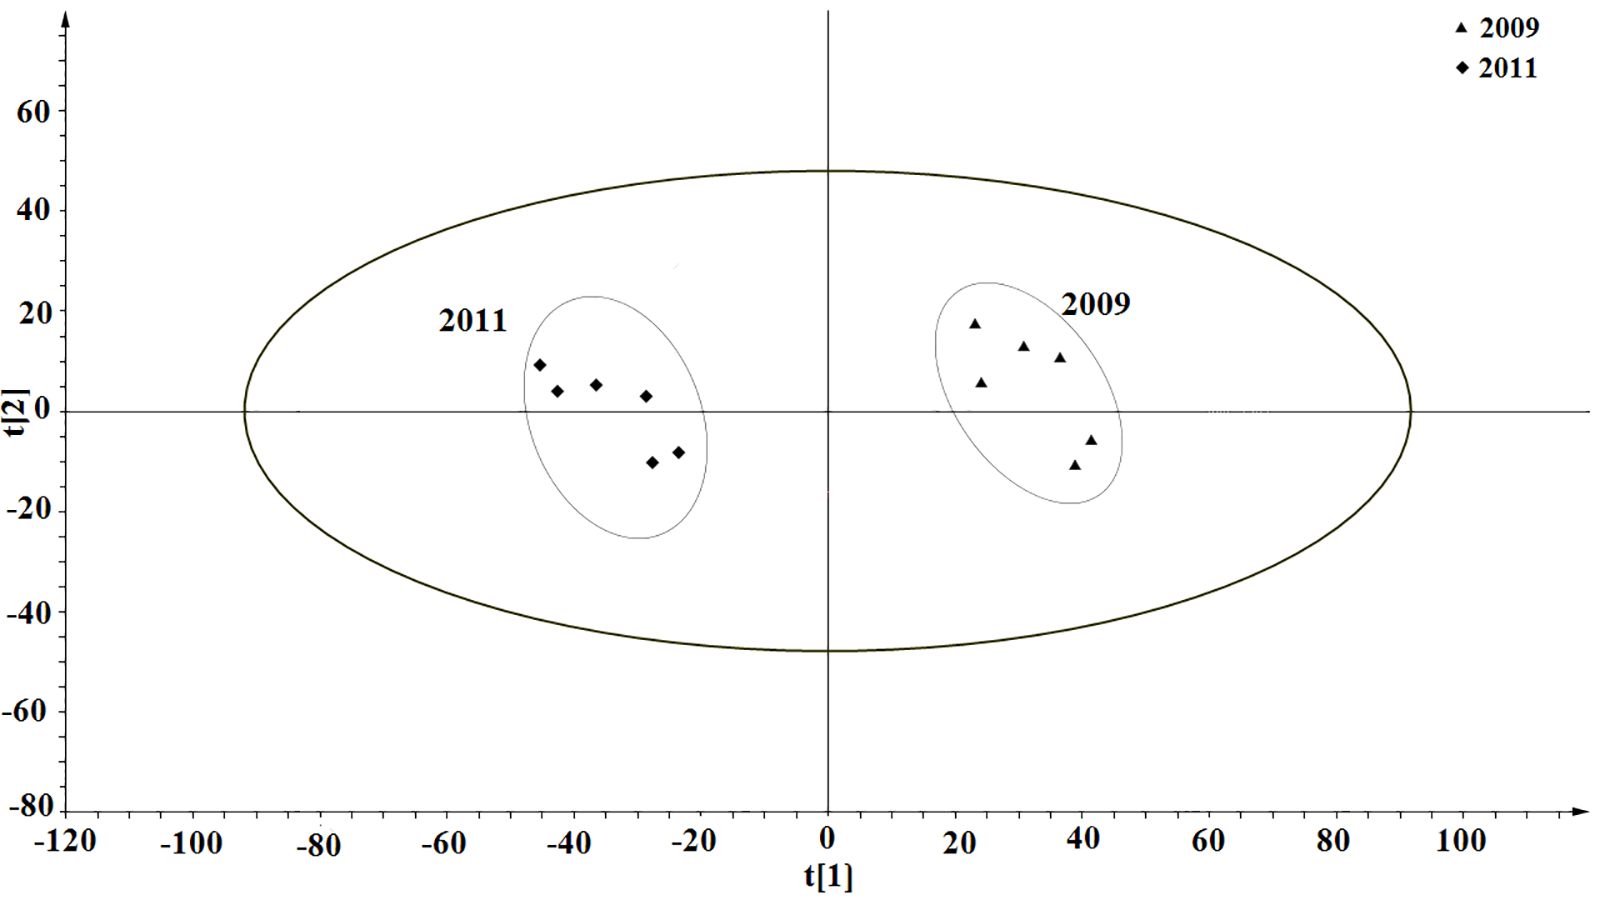
Image of PLS-DA score plot derived from the 1HNMR spectra of 2009 and 2011 vintage Cabernet Sauvignon wines
Triangle shows the Cabernet Sauvignon wines vinified in the 2009 vintages
Rhombus shows the Cabernet Sauvignon wines vinified in the 2011 vintages
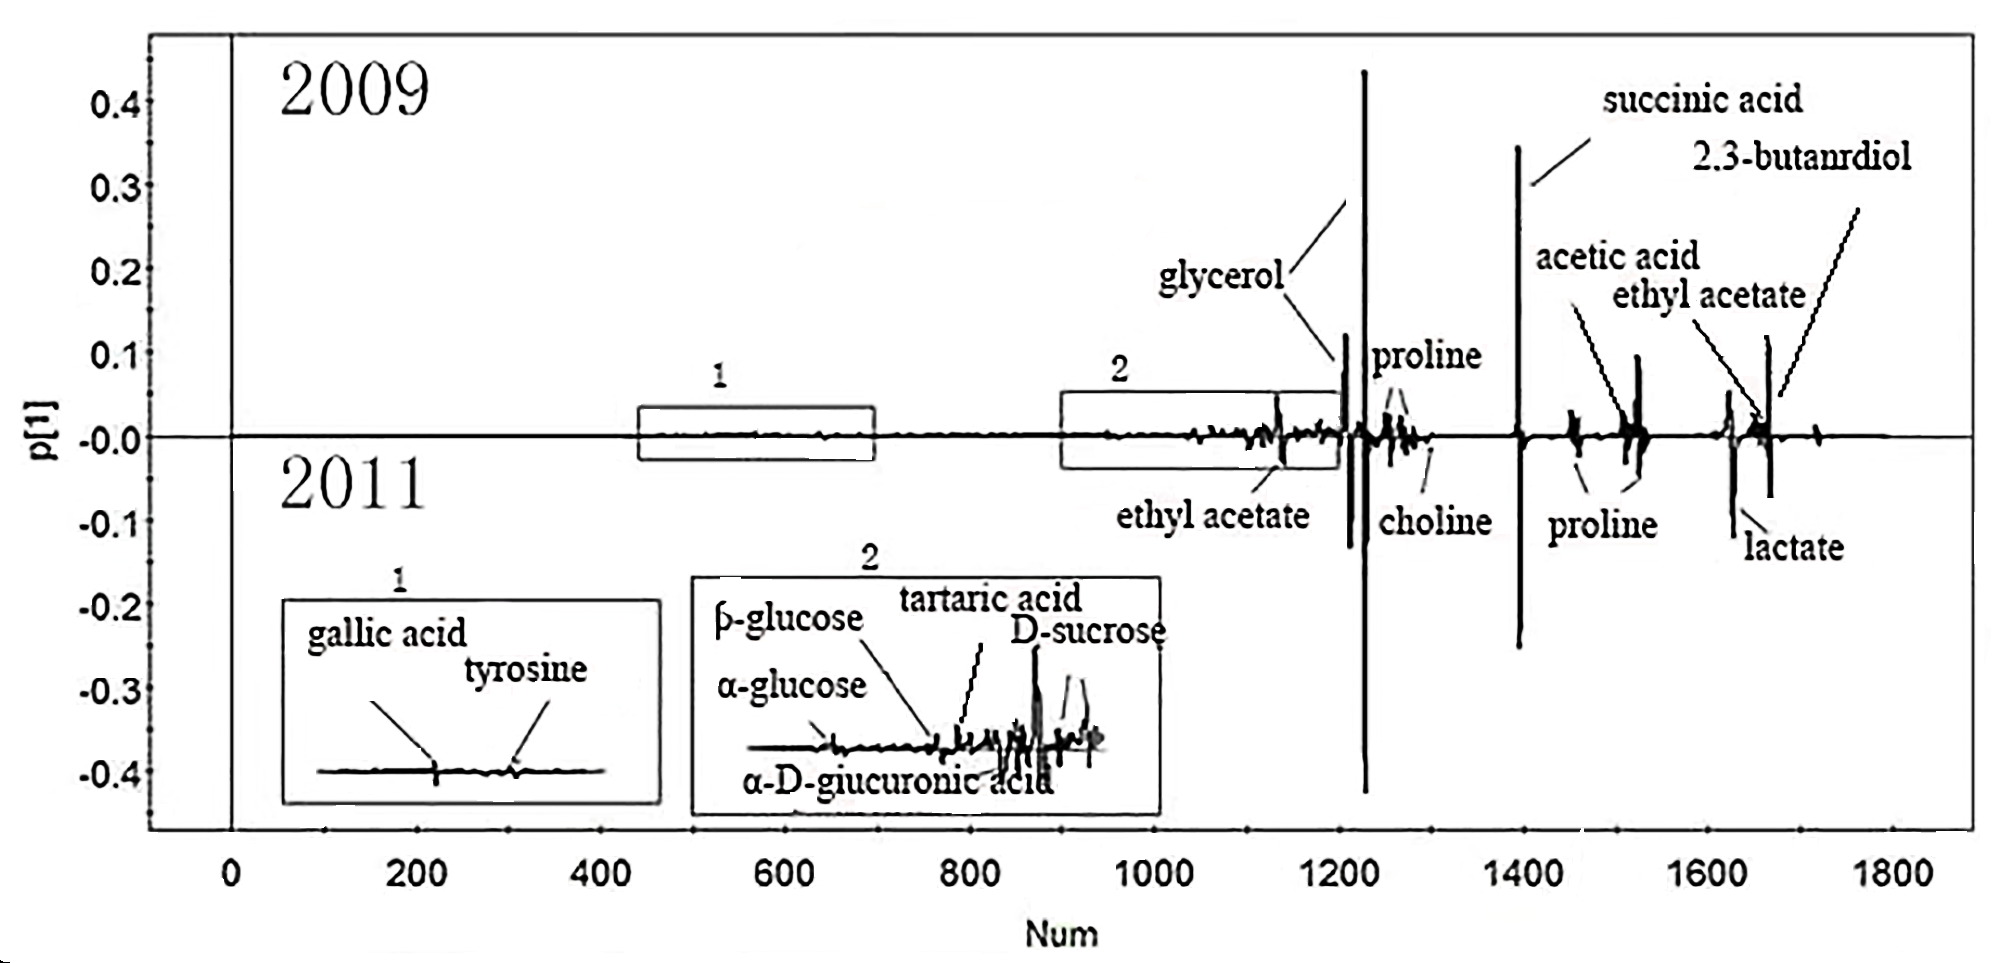
Image of PLS-DA loading plot derived from the 1HNMR spectra of 2009 and 2011 vintage Cabernet Sauvignon wines
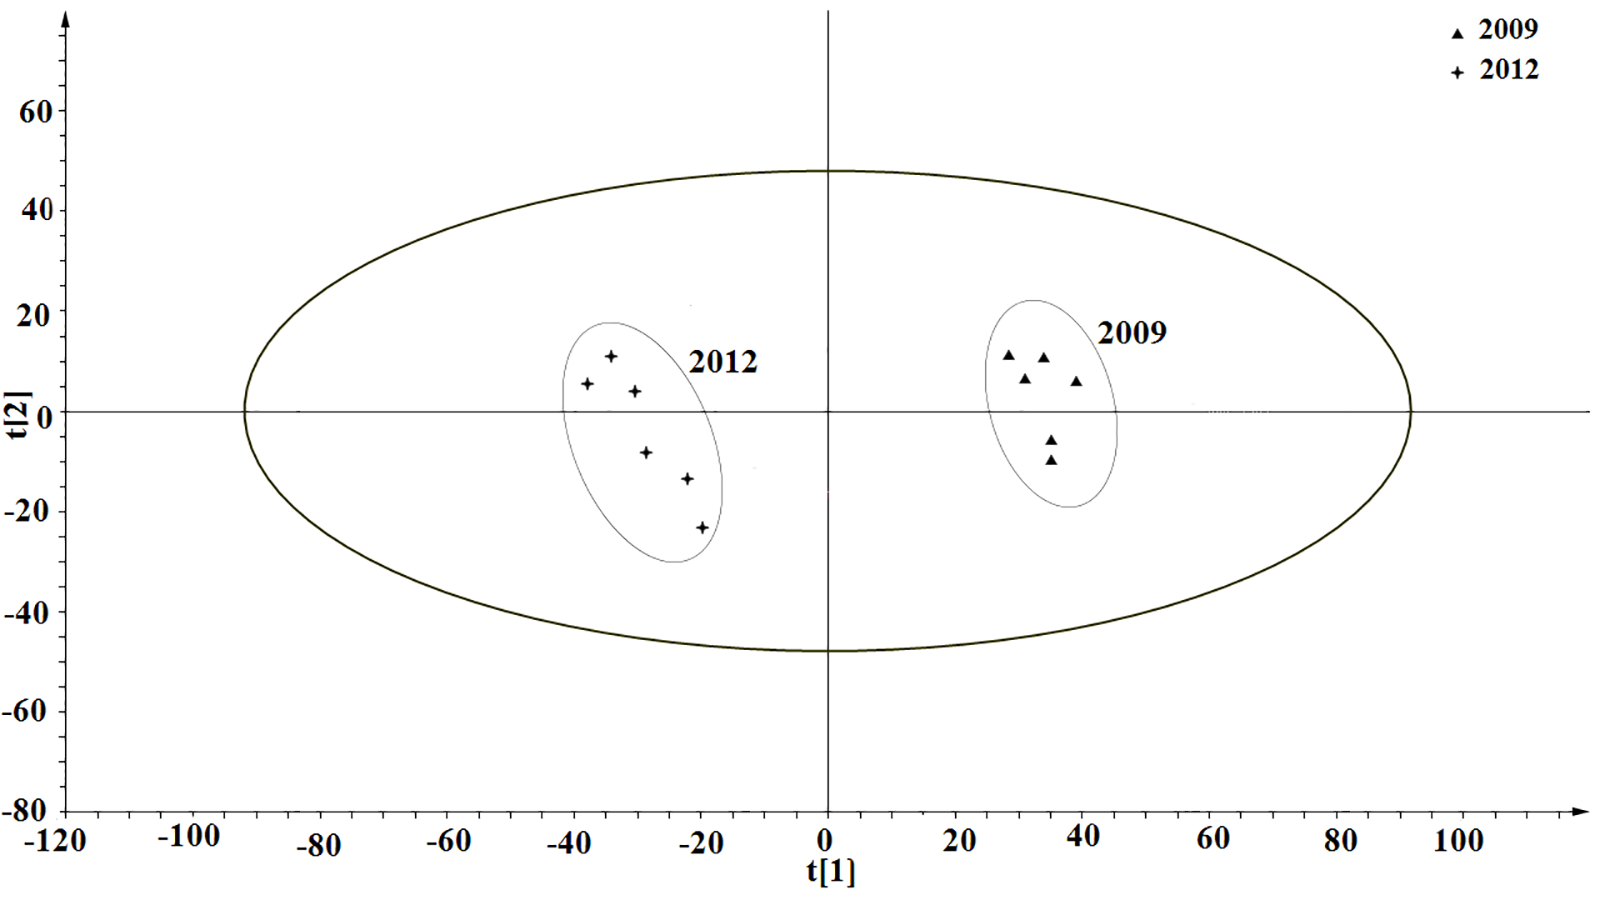
Image of PLS-DA score plot derived from the 1HNMR spectra of 2009 and 2012 vintage Cabernet Sauvignon wines
Triangle shows the Cabernet Sauvignon wines vinified in the 2009 vintages
Star shows the Cabernet Sauvignon wines vinified in the 2012 vintages
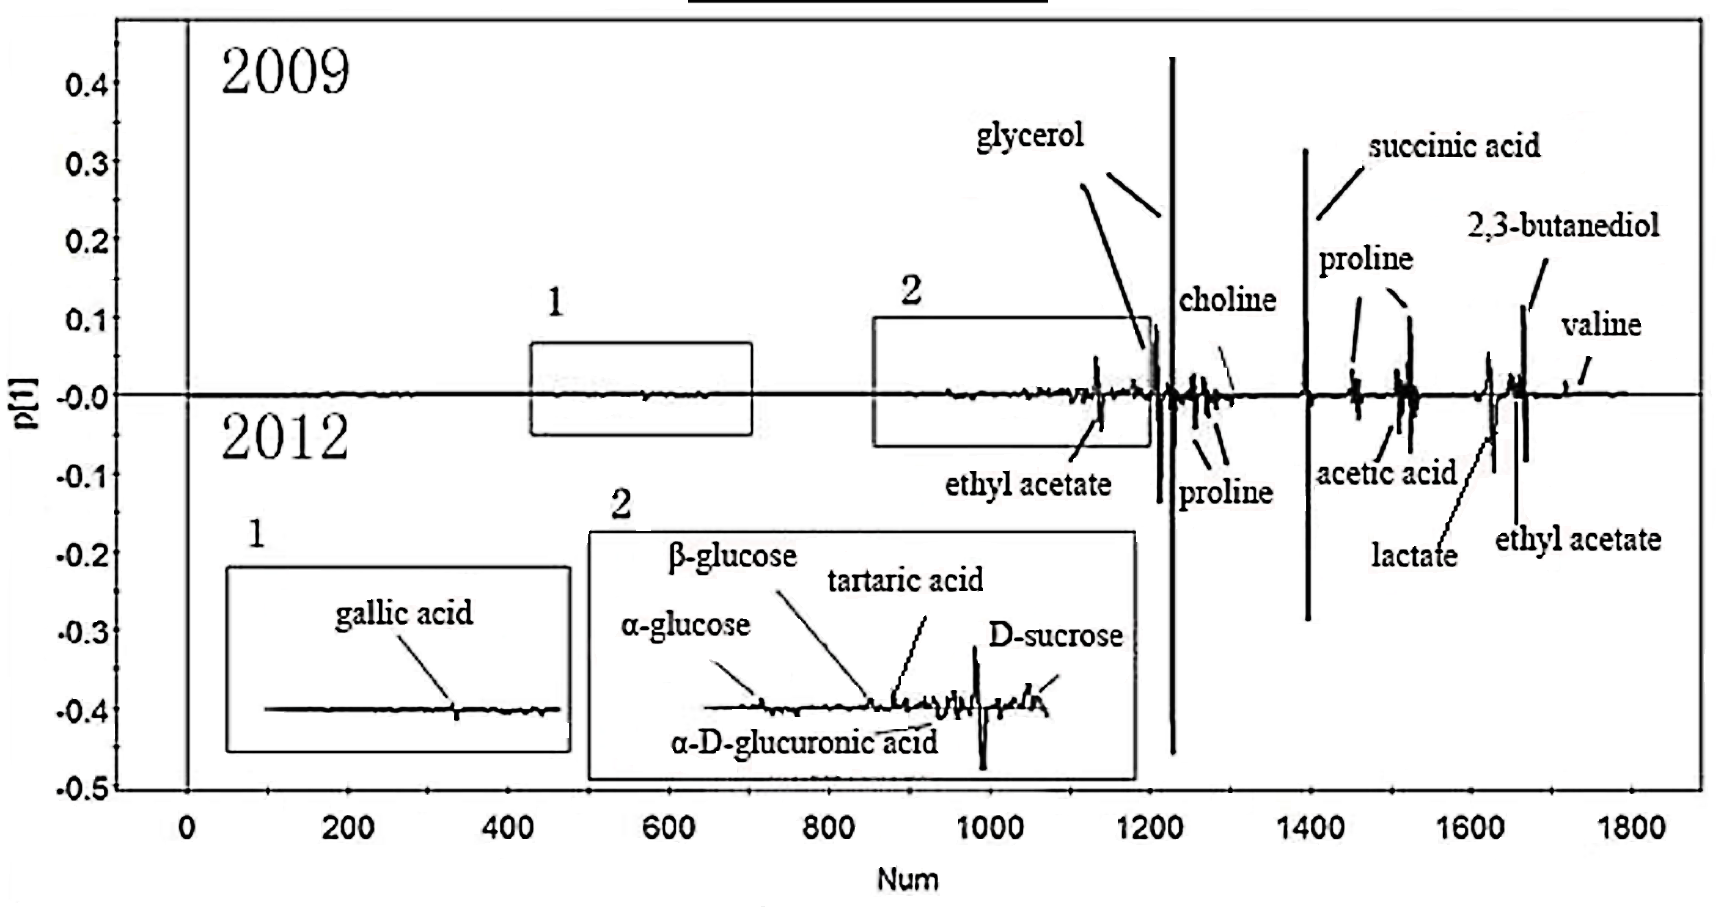
Image of PLS-DA loading plot derived from the 1HNMR spectra of 2009 and 2012 vintage Cabernet Sauvignon wines
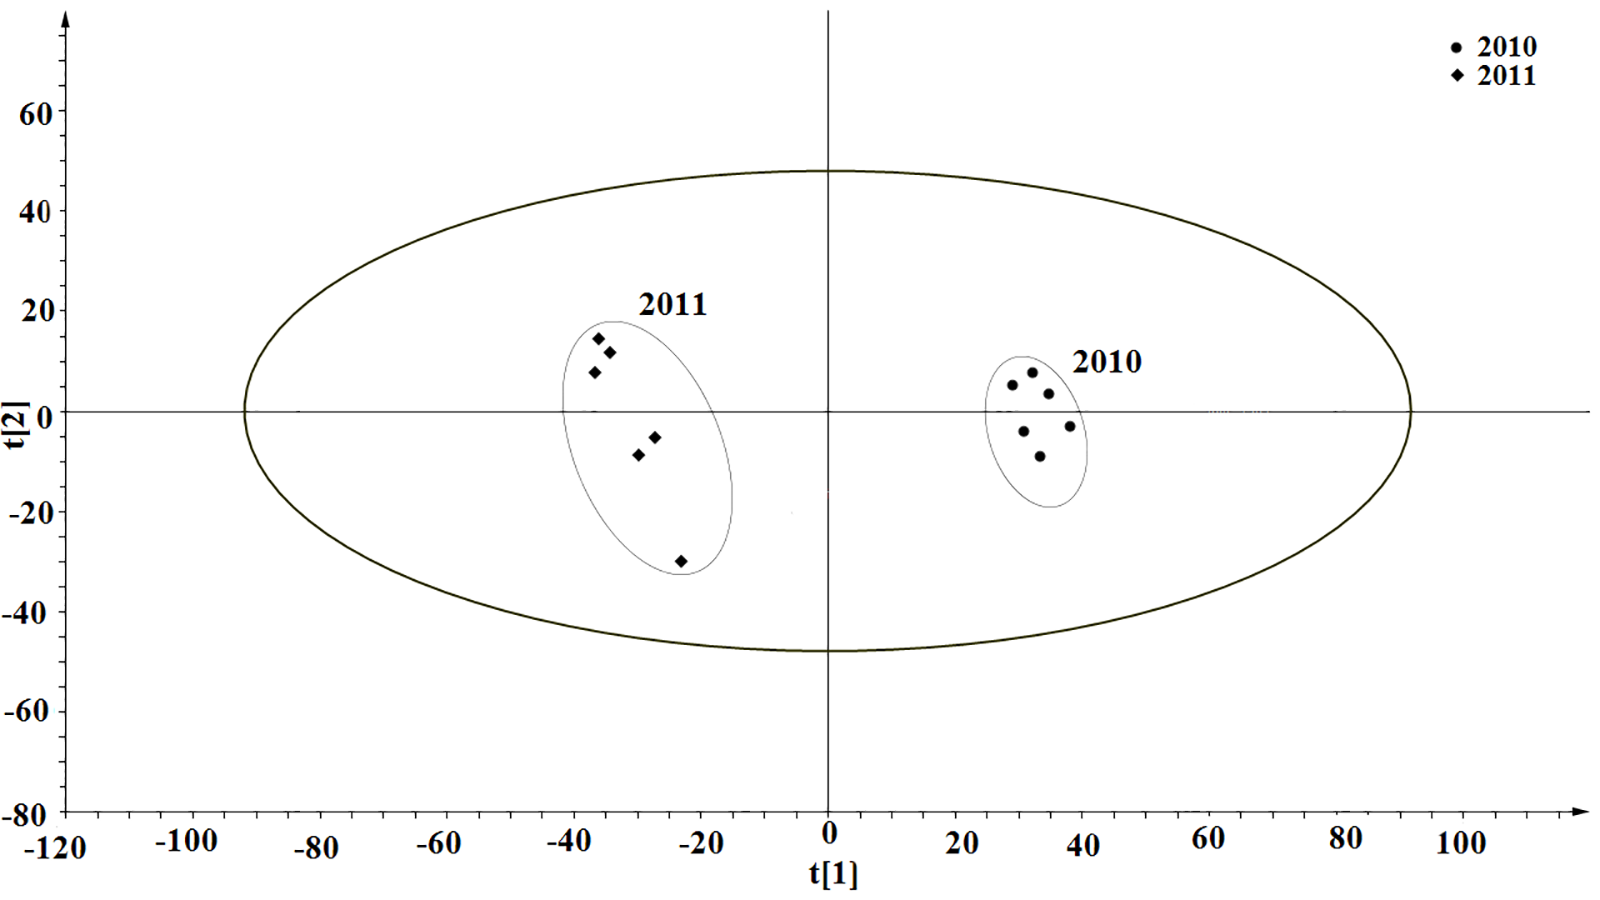
Image of PLS-DA score plot derived from the 1HNMR spectra of 2010 and 2011 vintage Cabernet Sauvignon wines
Round shows the Cabernet Sauvignon wines vinified in the 2010 vintages
Rhombus shows the Cabernet Sauvignon wines vinified in the 2011 vintages
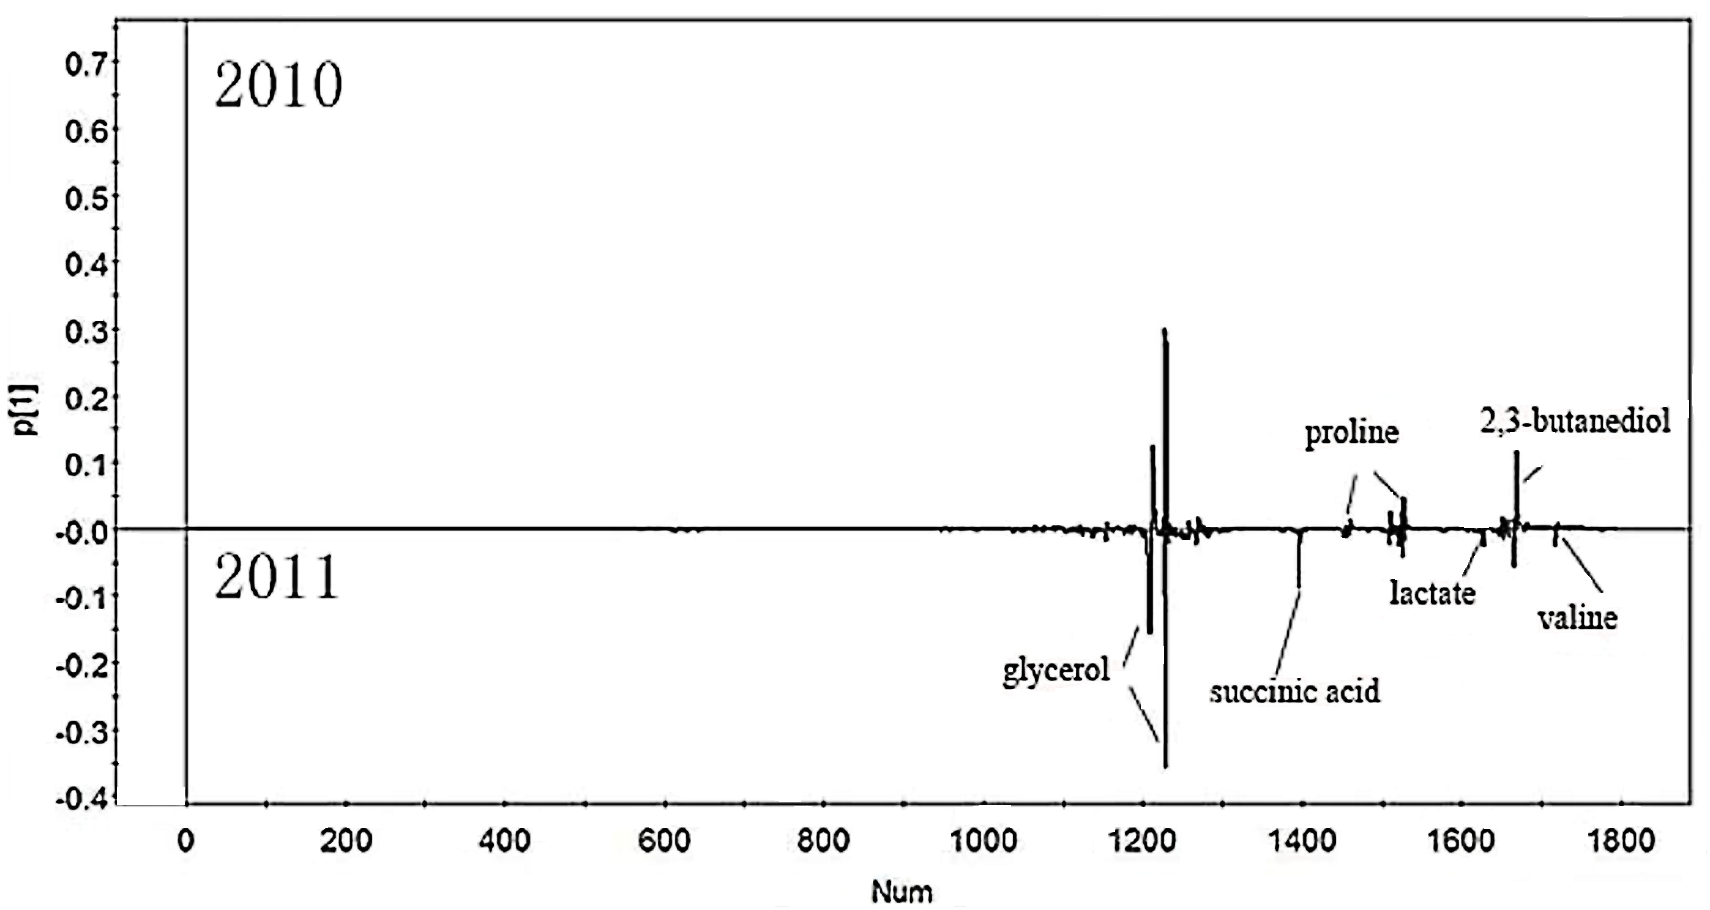
Image of PLS-DA loading plot derived from the 1HNMR spectra of 2010 and 2011 vintage Cabernet Sauvignon wines
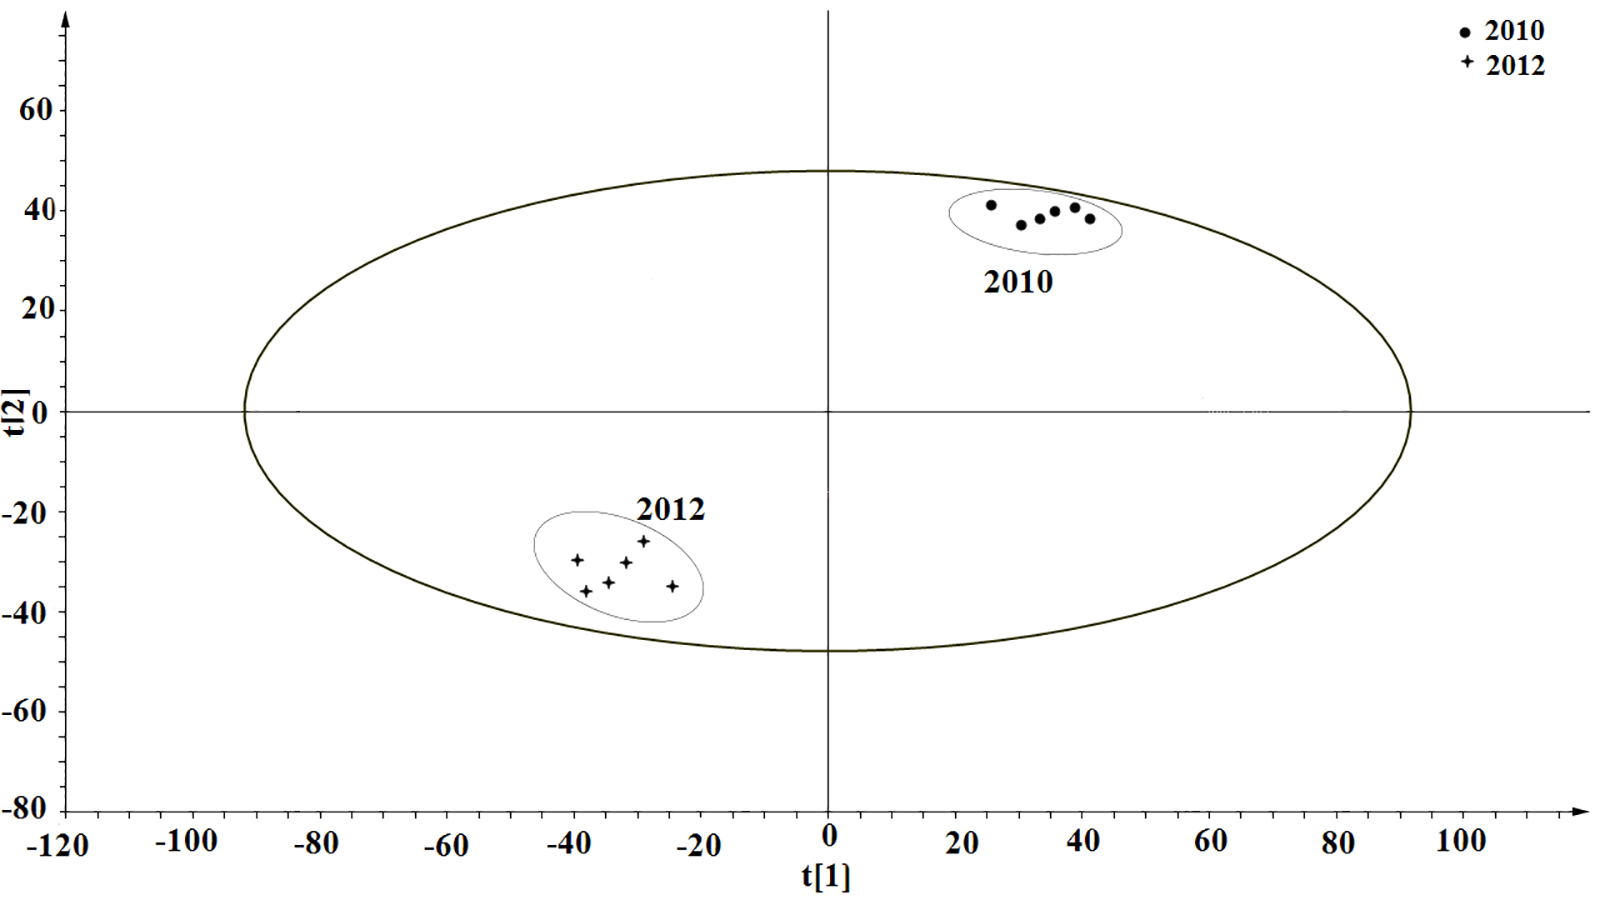
Image of PLS-DA score plot derived from the 1HNMR spectra of 2010 and 2012 vintage Cabernet Sauvignon wines
Round shows the Cabernet Sauvignon wines vinified in the 2010 vintages
Star shows the Cabernet Sauvignon wines vinified in the 2012 vintages
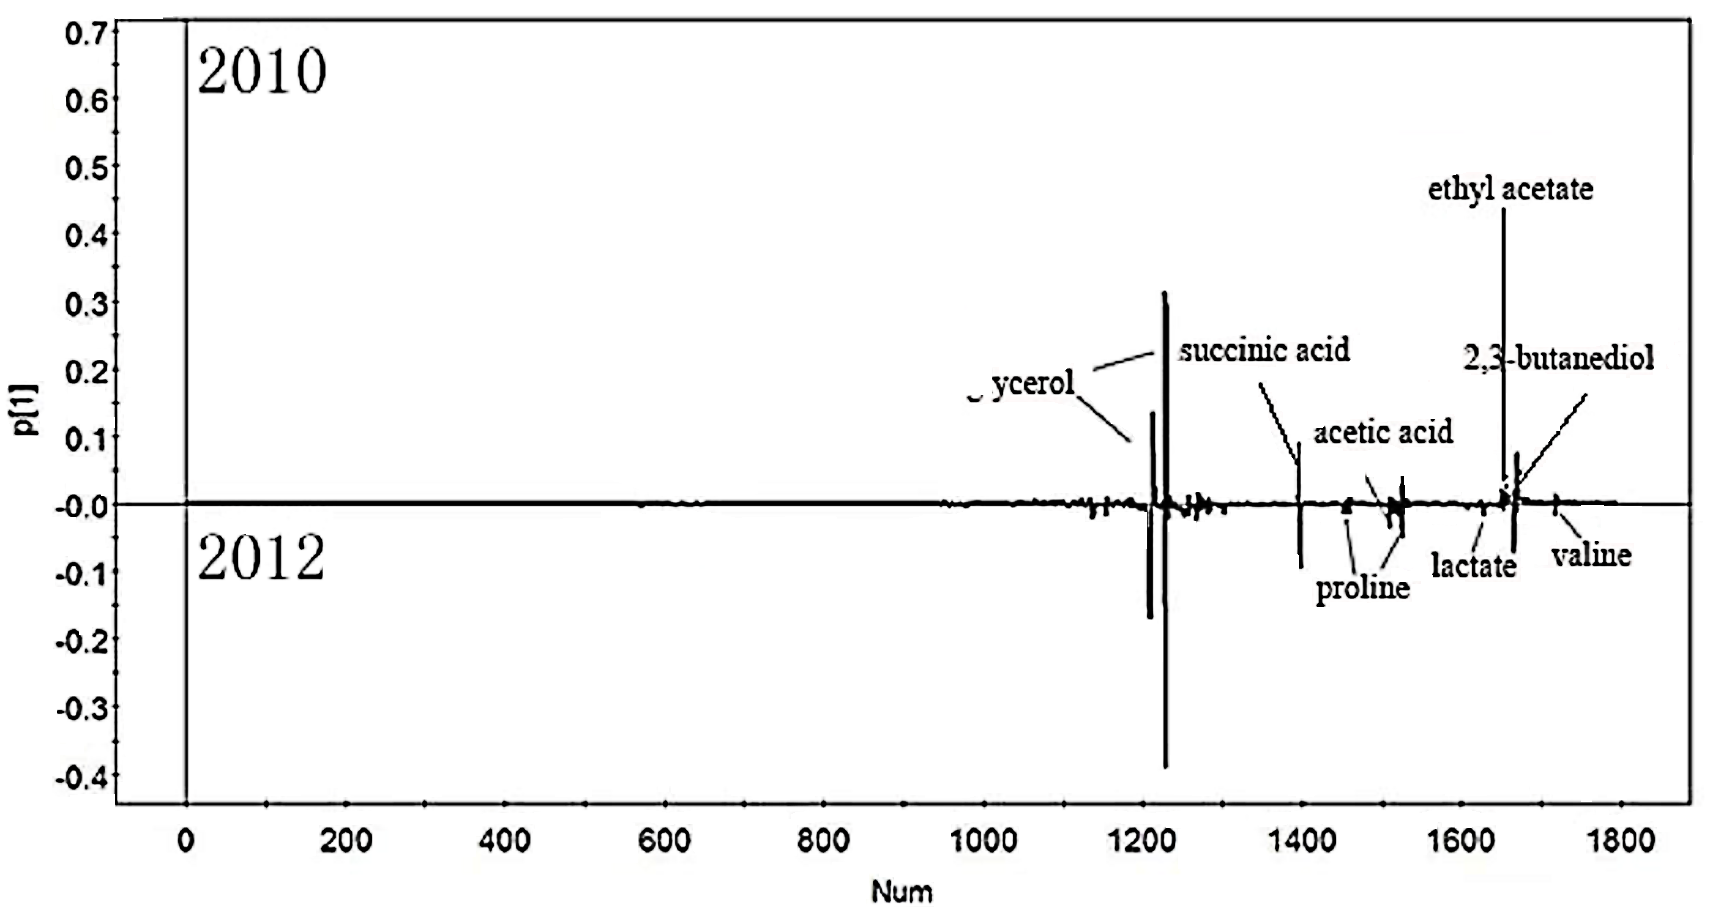
Image of PLS-DA loading plot derived from the 1HNMR spectra of 2010 and 2012 vintage Cabernet Sauvignon wines
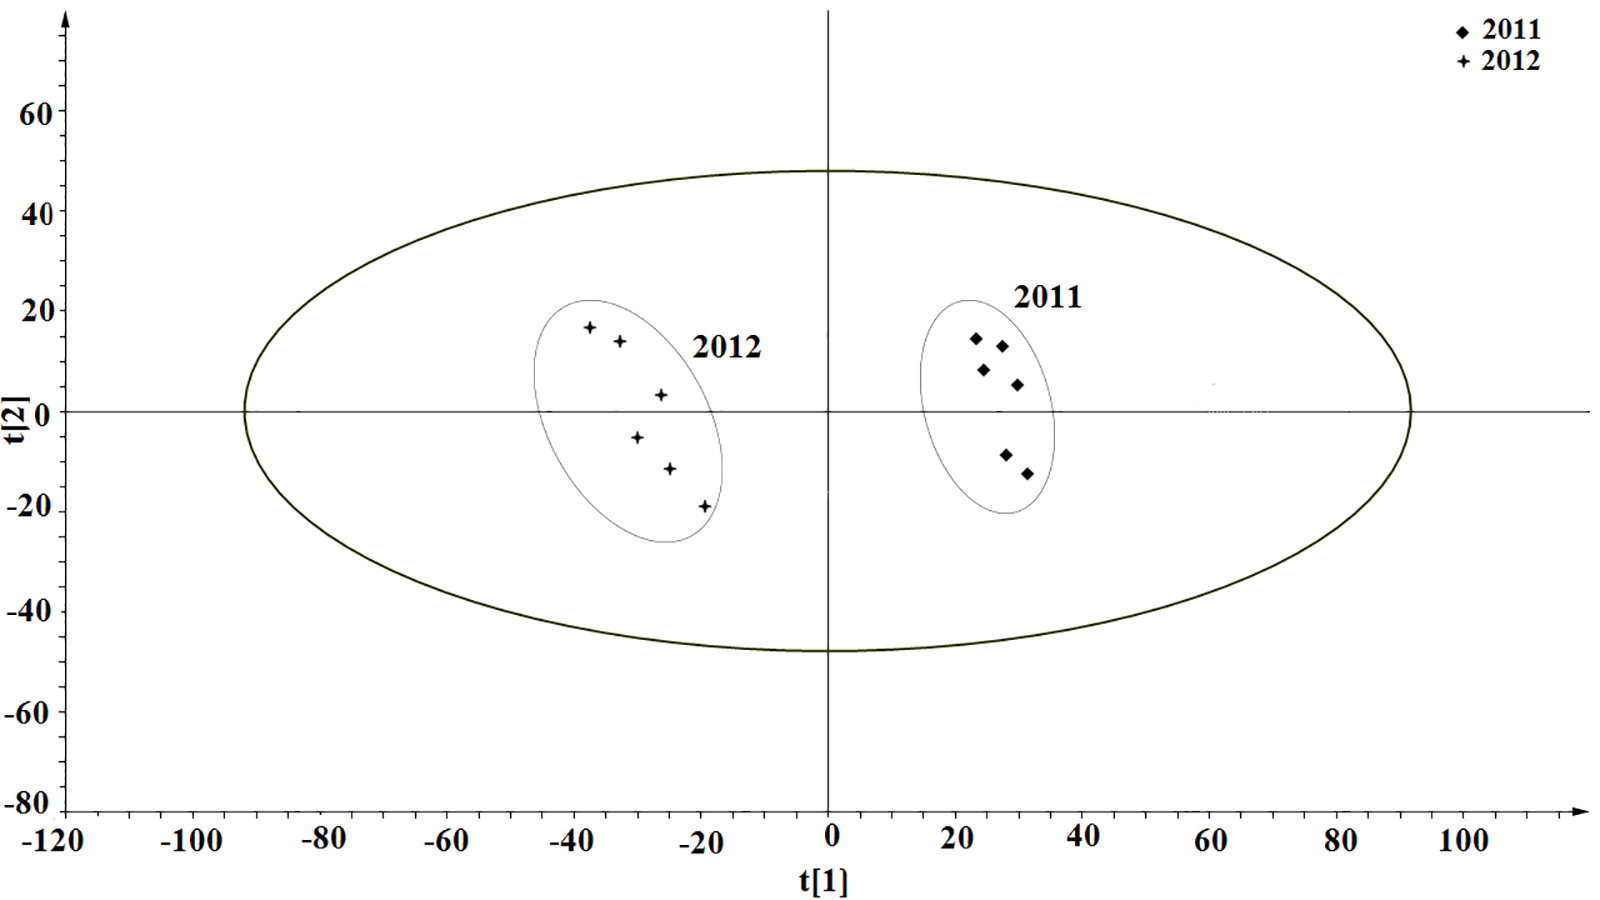
Image of PLS-DA score plot derived from the 1HNMR spectra of 2011 and 2012 vintage Cabernet Sauvignon wines
Rhombus shows the Cabernet Sauvignon wines vinified in the 2011 vintages
Star shows the Cabernet Sauvignon wines vinified in the 2012 vintages
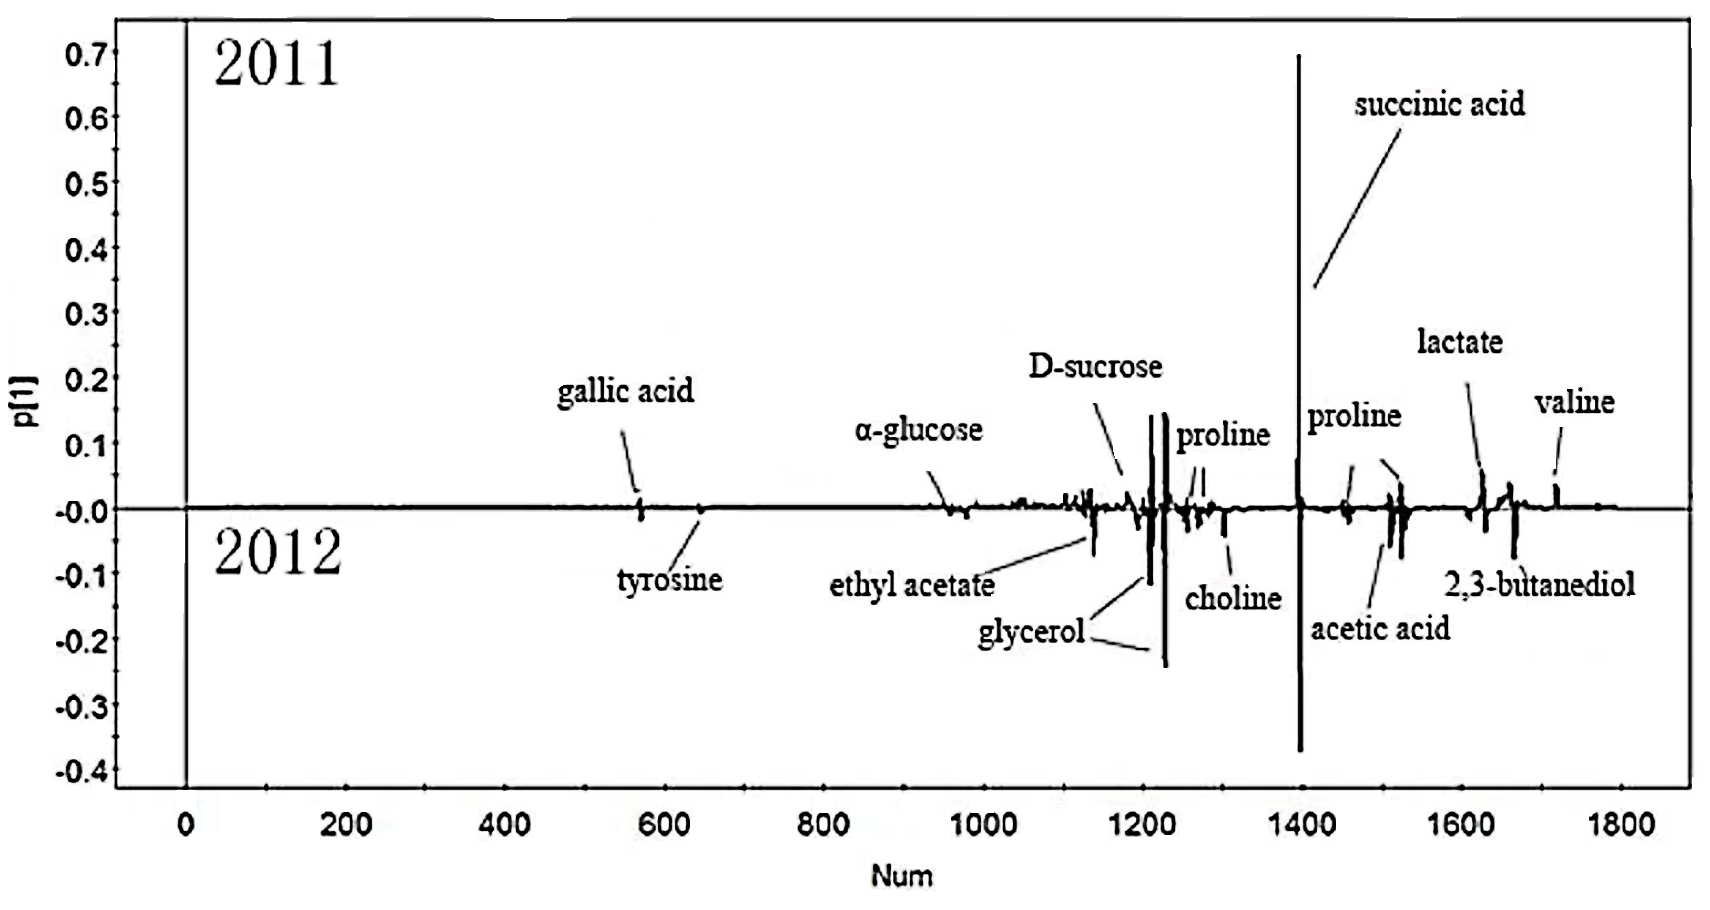
Image of PLS-DA loading plot derived from the 1HNMR spectra of 2011 and 2012 vintage Cabernet Sauvignon wines
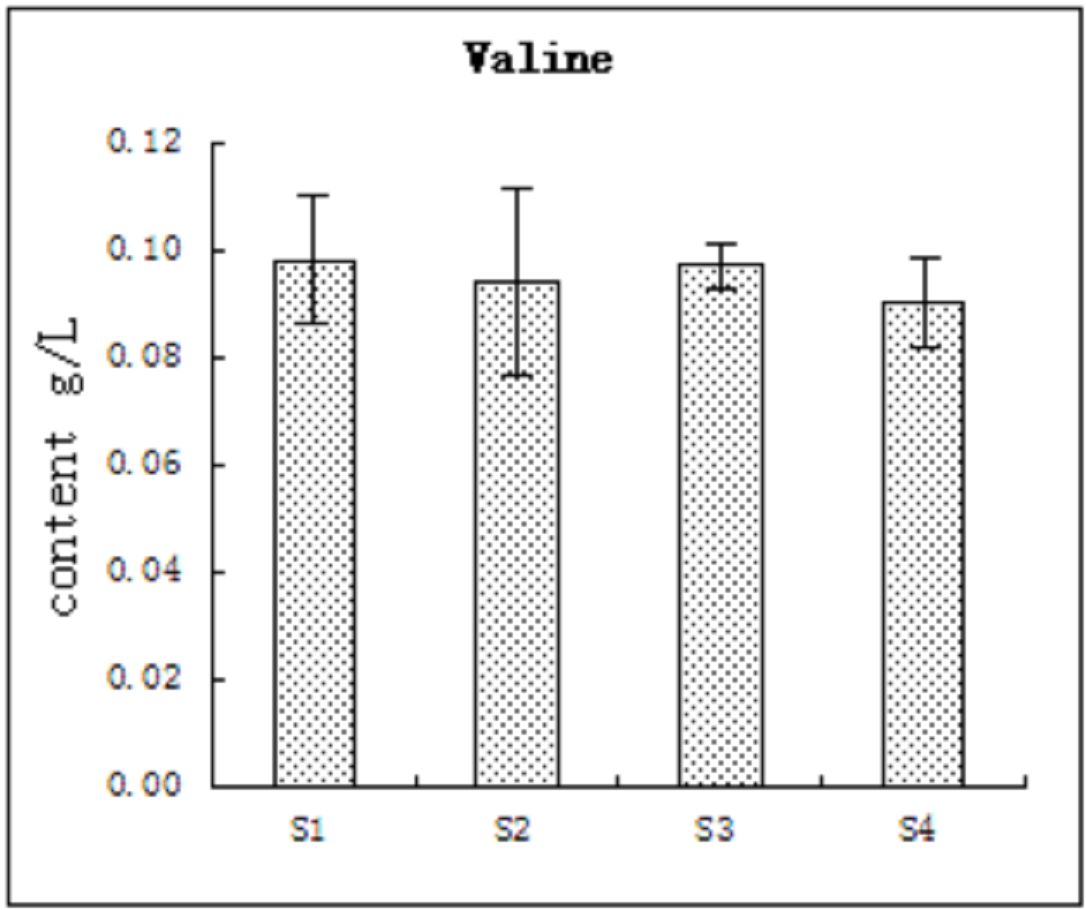
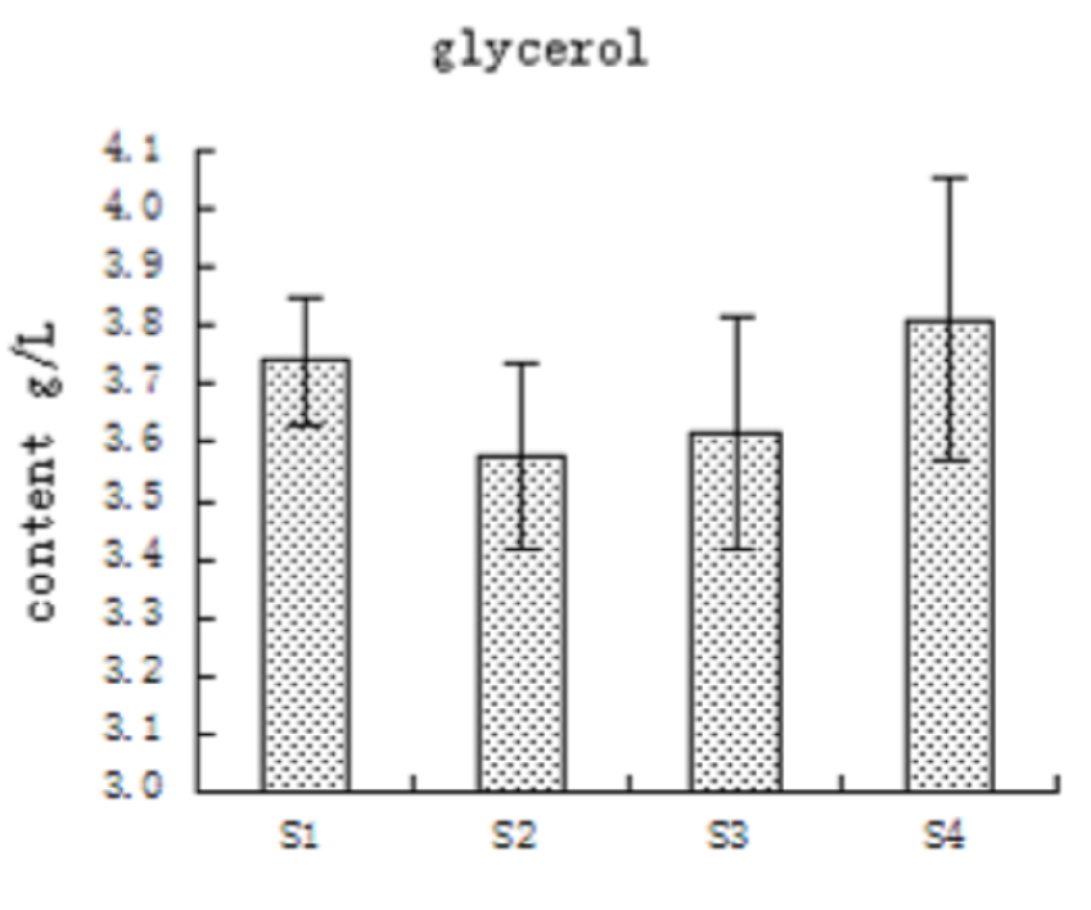
Image of comparison of the main metabolite concentrations in the 2009-2012 vintage wines
S1 represent the Cabernet Sauvignon wines vinified in the 2009 vintages
S2 represent the Cabernet Sauvignon wines vinified in the 2010 vintages
S3 represent the Cabernet Sauvignon wines vinified in the 2011 vintages
S4 represent the Cabernet Sauvignon wines vinified in the 2012 vintages
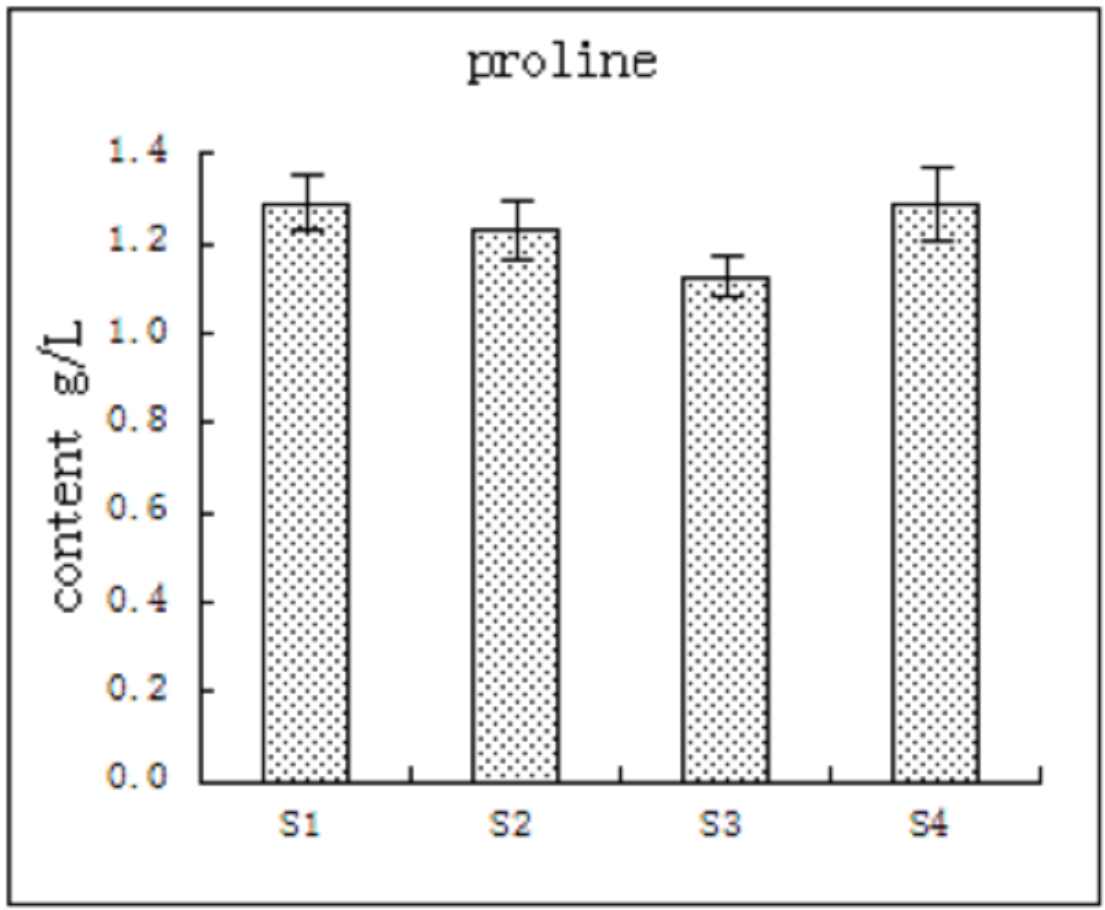
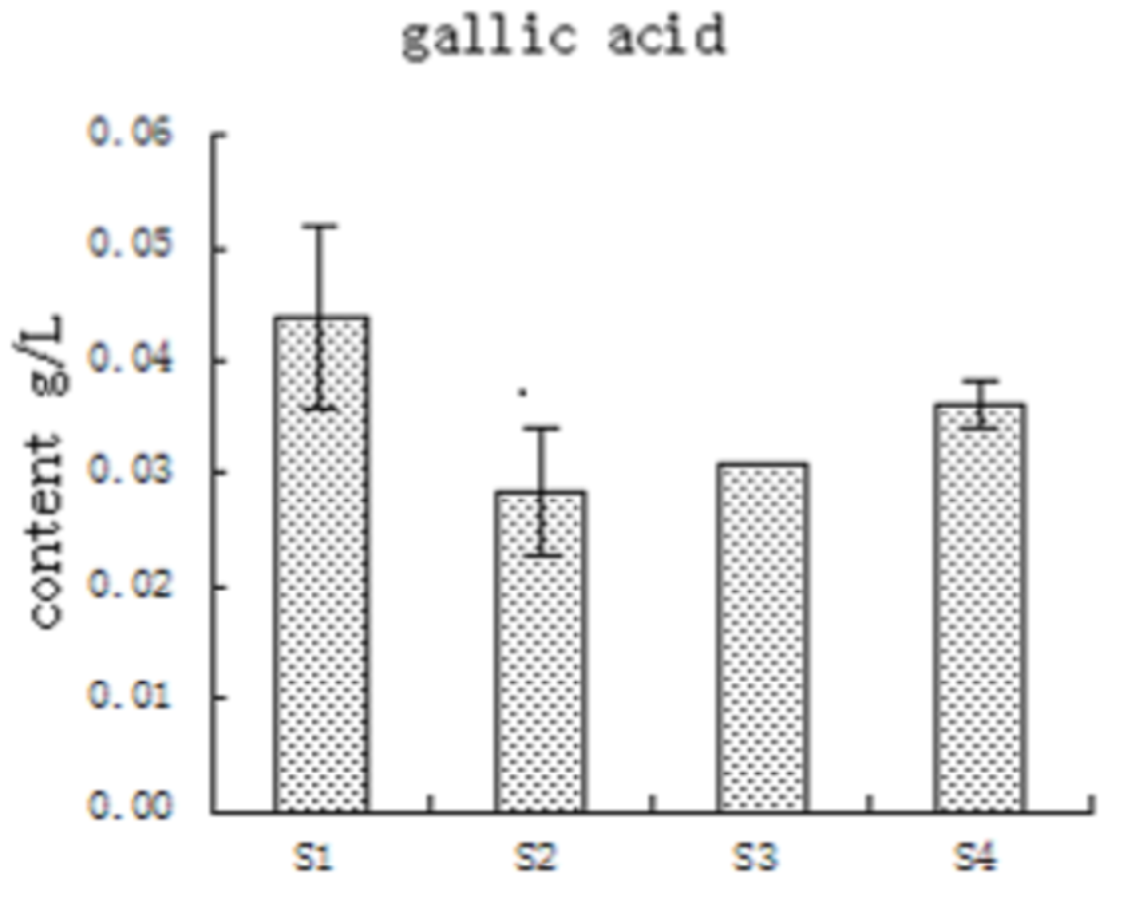
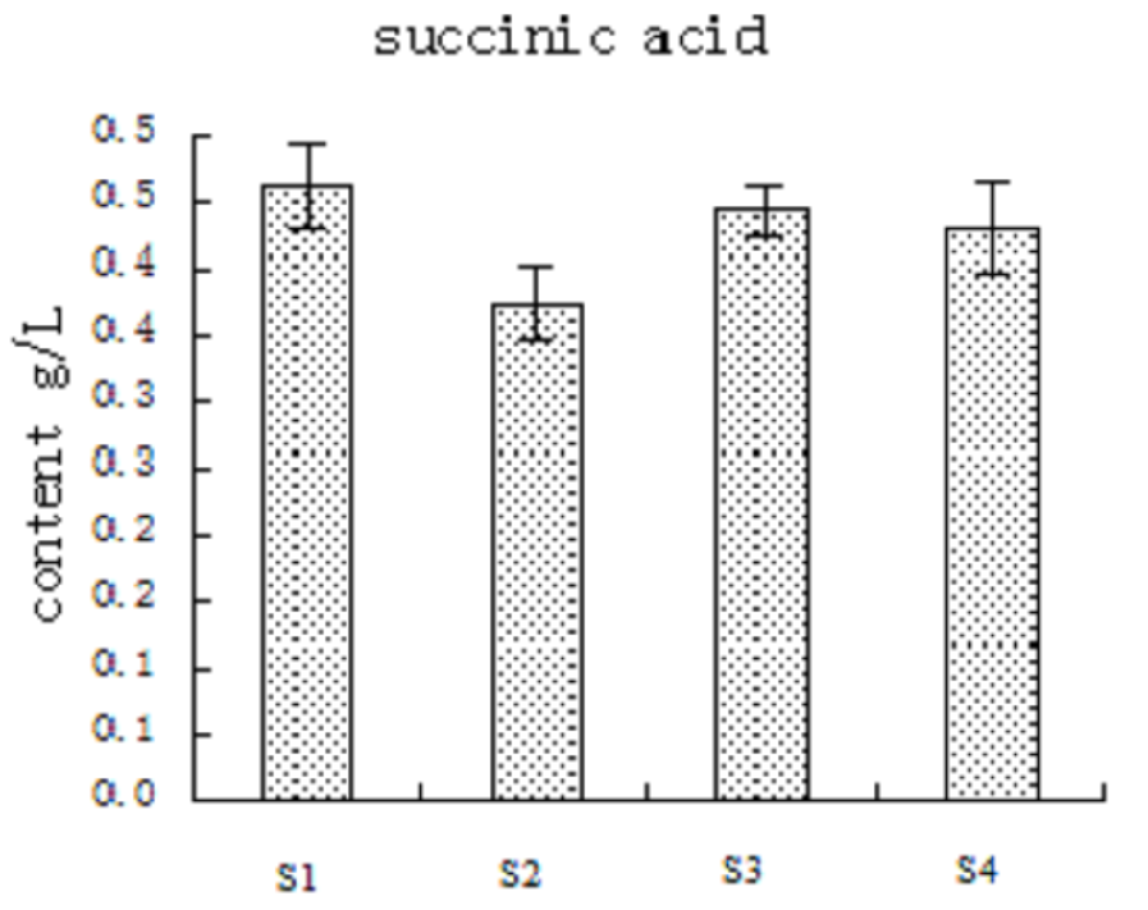
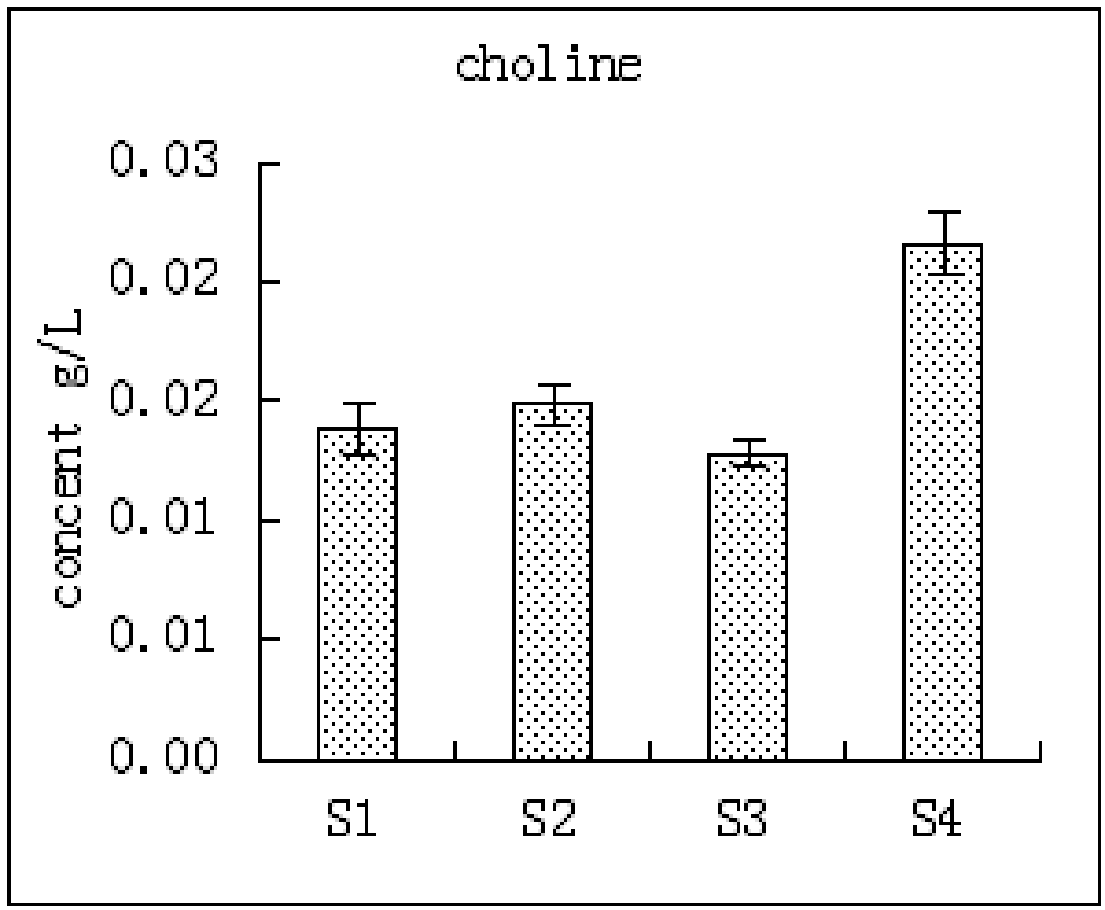