Exploring complex disease gene relationships using simultaneous analysis
- Published
- Accepted
- Subject Areas
- Bioinformatics, Evolutionary Studies, Genomics
- Keywords
- Bioinformatics, phylogenetics, simultaneous analysis, alzheimer disease
- Copyright
- © 2014 Romano et al.
- Licence
- This is an open access article distributed under the terms of the Creative Commons Attribution License, which permits unrestricted use, distribution, reproduction and adaptation in any medium and for any purpose provided that it is properly attributed. For attribution, the original author(s), title, publication source (PeerJ PrePrints) and either DOI or URL of the article must be cited.
- Cite this article
- 2014. Exploring complex disease gene relationships using simultaneous analysis. PeerJ PrePrints 2:e230v1 https://doi.org/10.7287/peerj.preprints.230v1
Abstract
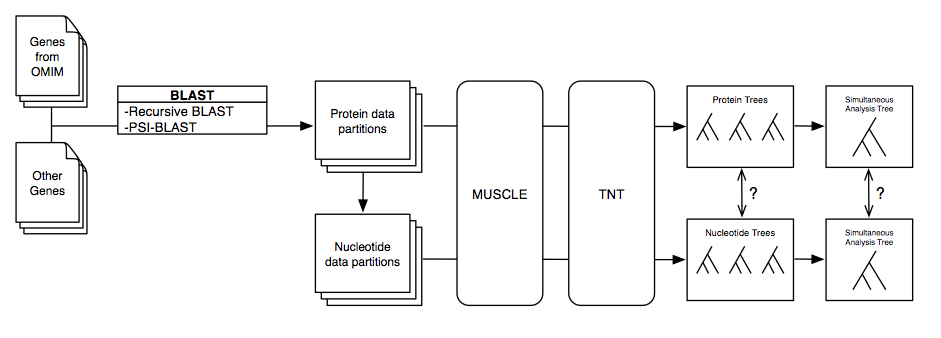
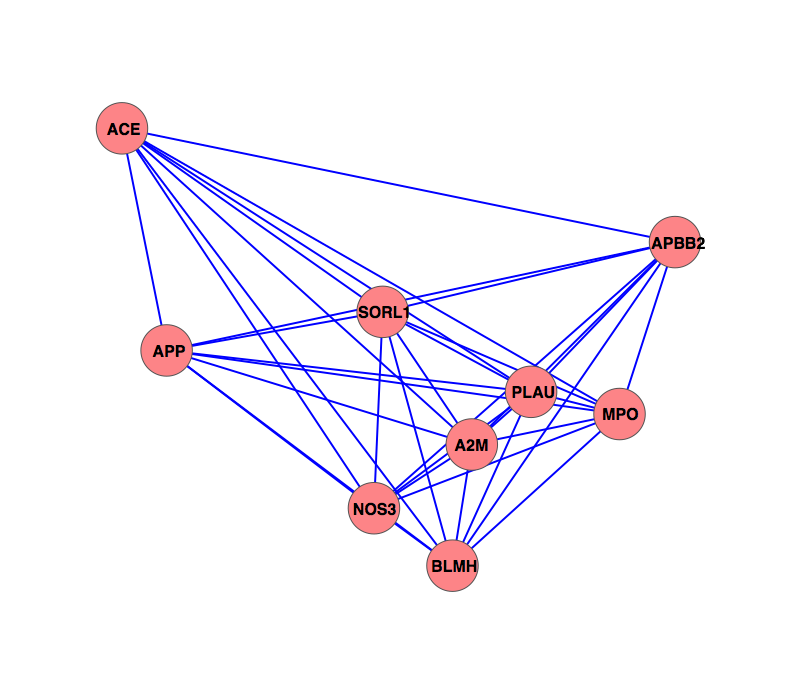
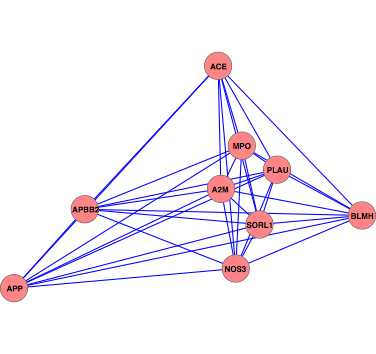
The characterization of complex diseases remains a great challenge for biomedical researchers due to the myriad interactions of genetic and environmental factors. Adaptation of phylogenomic techniques to increasingly available genomic data provides an evolutionary perspective that may elucidate important unknown features of complex diseases. Here an automated method is presented that leverages publicly available genomic data and phylogenomic techniques. The approach is tested with nine genes implicated in the development of Alzheimer Disease, a complex neurodegenerative syndrome. The developed technique, implemented through a suite of Ruby scripts entitled “ASAP2,” first compiles a list of sequence-similarity based orthologues using PSI-BLAST and a recursive NCBI BLAST+ search strategy, then constructs maximum parsimony phylogenetic trees for each set of nucleotide and protein sequences, and calculates phylogenetic metrics (partitioned Bremer support values, combined branch scores, and Robinson-Foulds distance) to provide an empirical assessment of evolutionary conservation within a given genetic network. This study demonstrates the potential for using automated simultaneous phylogenetic analysis to uncover previously unknown relationships among disease-associated genes that may not have been apparent using traditional, single-gene methods. Furthermore, the results provide the first integrated evolutionary history of an Alzheimer Disease gene network and identify potentially important co-evolutionary clustering around components of oxidative stress pathways.