Exploiting freely available imagery to improve land cover characterization and shallow landslide detection
- Published
- Accepted
- Subject Areas
- Data Mining and Machine Learning, Spatial and Geographic Information Systems
- Keywords
- headwater catchment, Maximum Likelihood Estimation, Automatic detection, Bing Maps™, Vegetation patterns, shallow landslides, landslide mapping, high resolution imagery
- Copyright
- © 2016 Crema et al.
- Licence
- This is an open access article distributed under the terms of the Creative Commons Attribution License, which permits unrestricted use, distribution, reproduction and adaptation in any medium and for any purpose provided that it is properly attributed. For attribution, the original author(s), title, publication source (PeerJ Preprints) and either DOI or URL of the article must be cited.
- Cite this article
- 2016. Exploiting freely available imagery to improve land cover characterization and shallow landslide detection. PeerJ Preprints 4:e2269v2 https://doi.org/10.7287/peerj.preprints.2269v2
Abstract
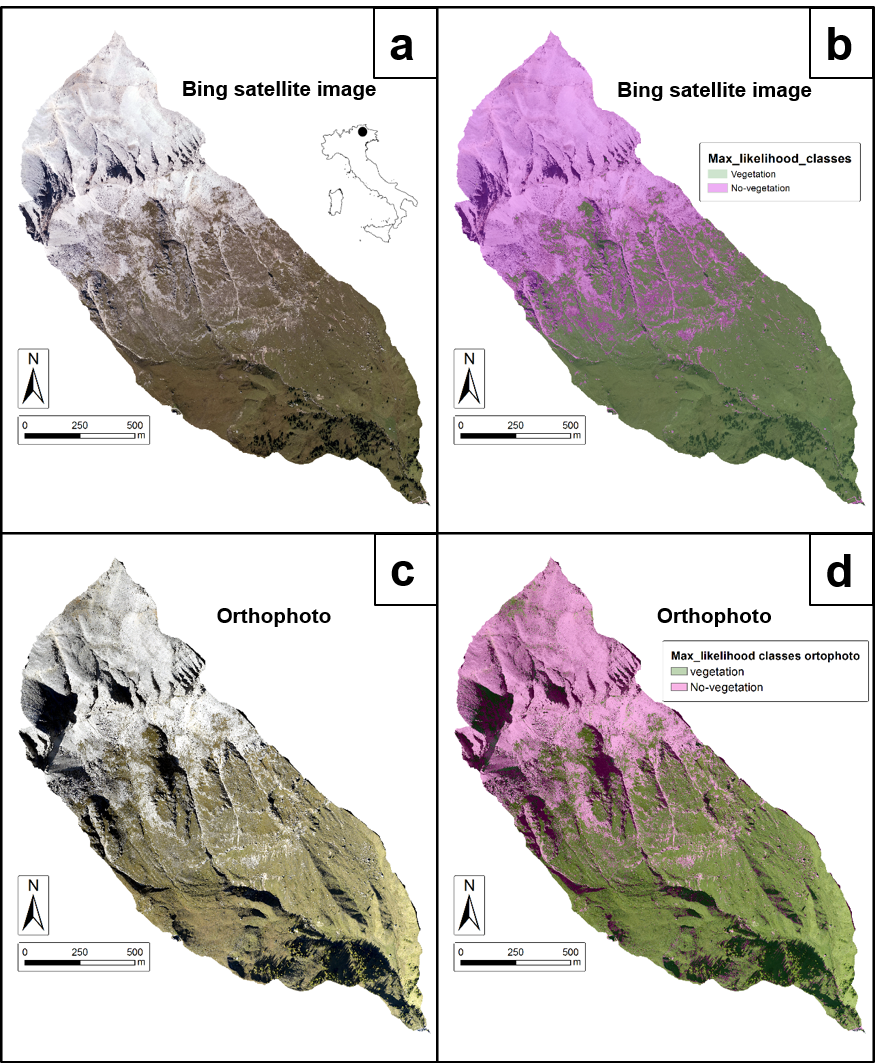
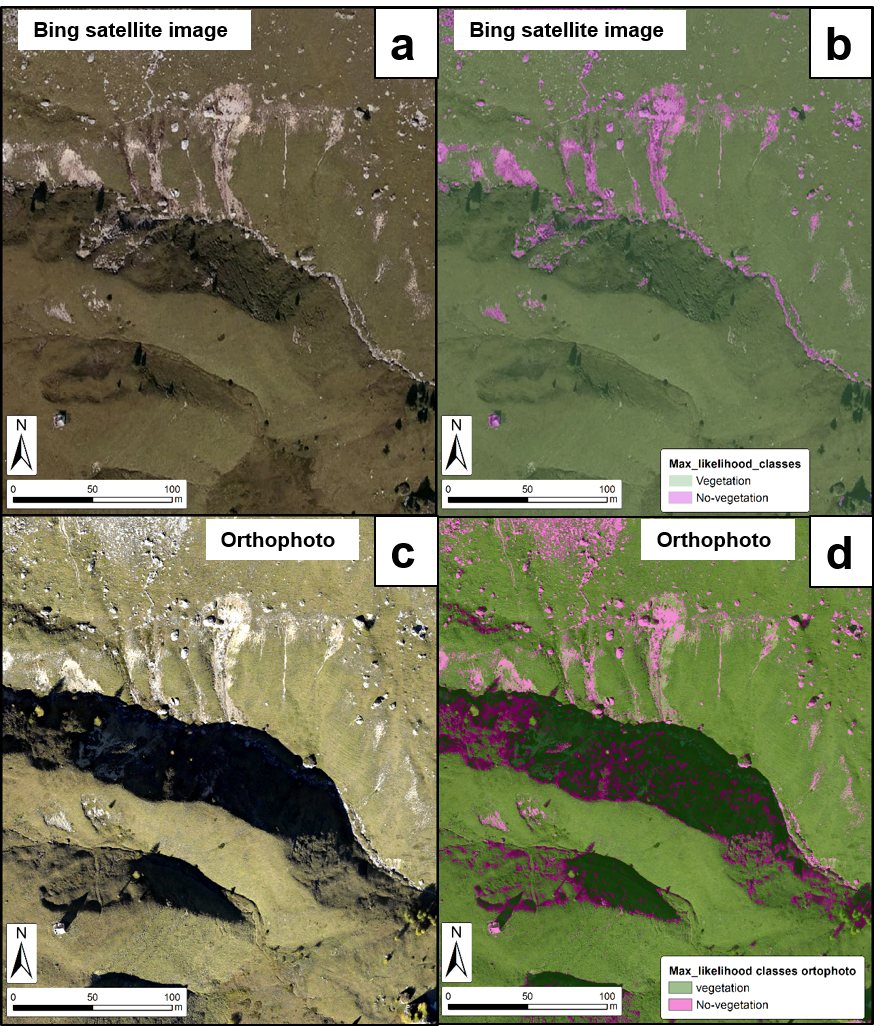
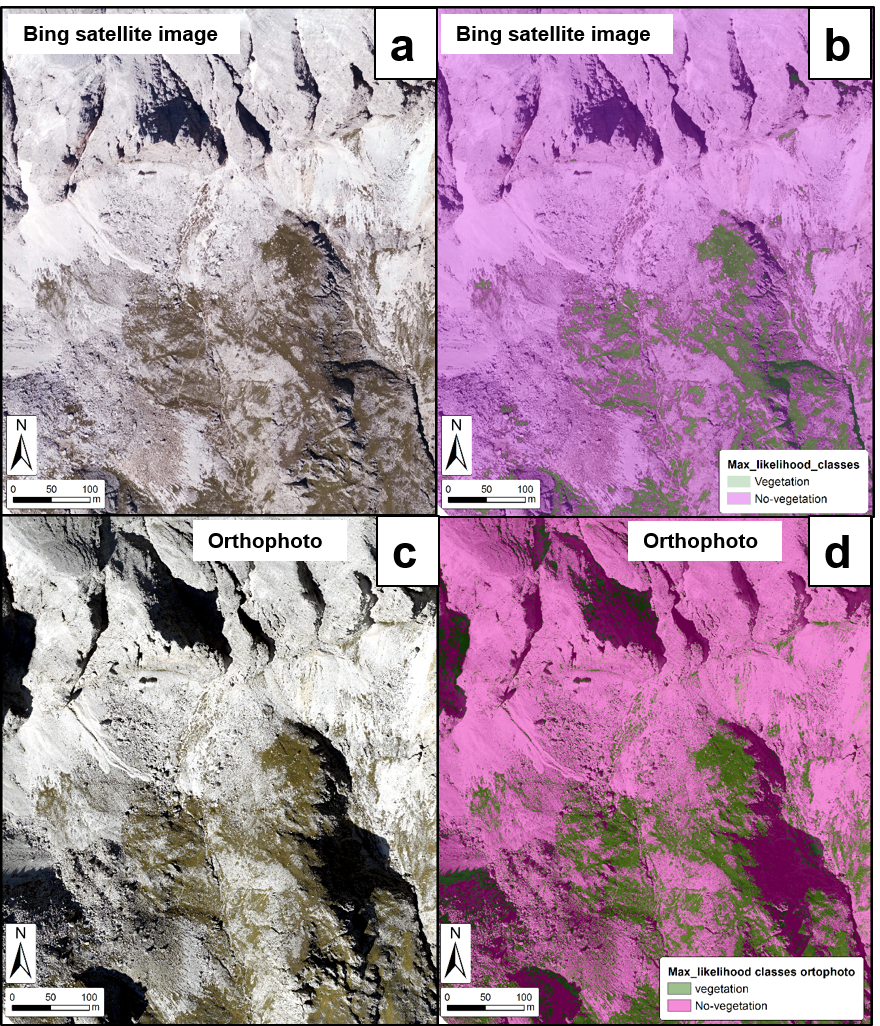
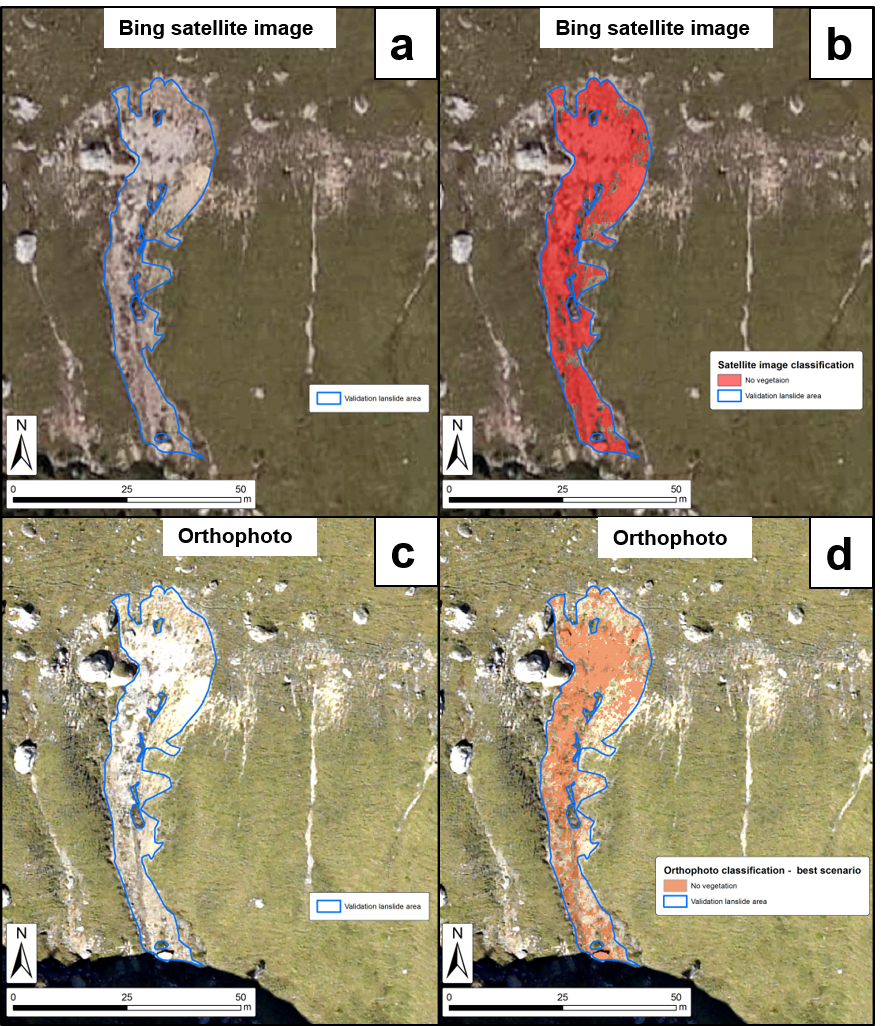
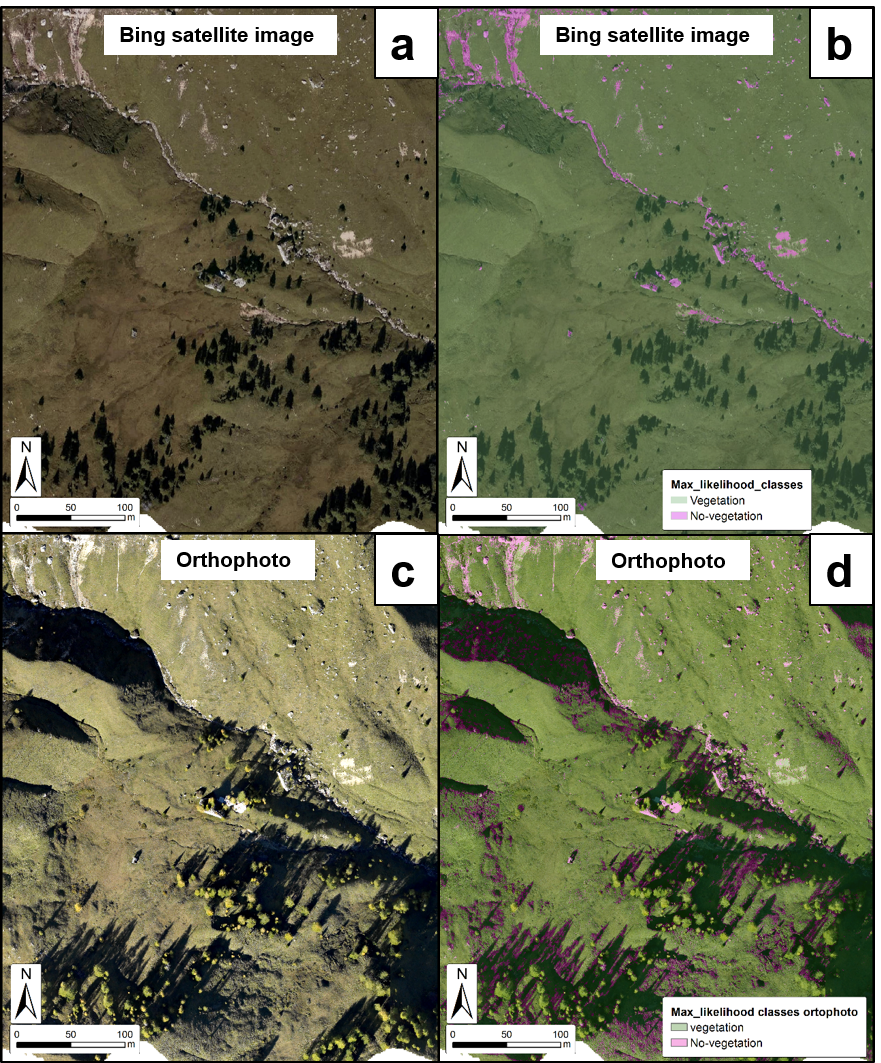
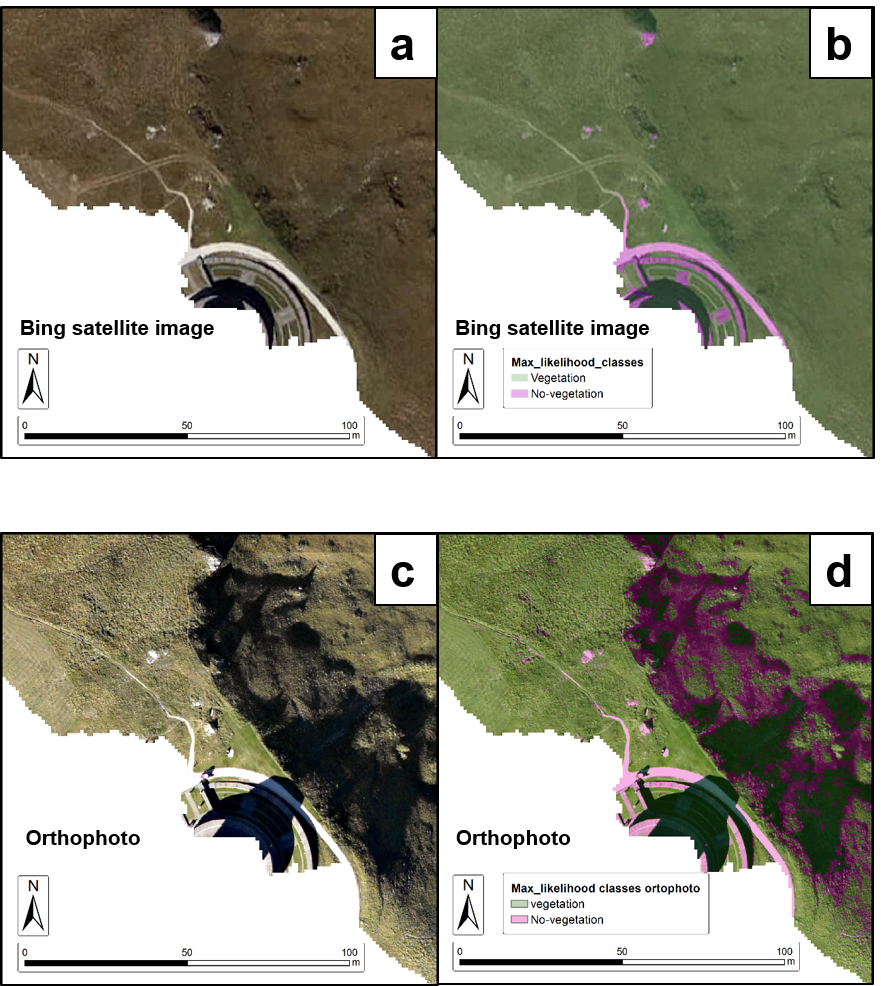
Natural hazards and land management issues can benefit nowadays from the increasing availability of free, high-resolution satellite imagery that opens the way to fine scale detailed investigations. In high elevation catchments the analysis of vegetation dynamics deserves particular attention since little climatic modifications can be amplified in such fragile systems. For the same reasons, the dynamic of instability phenomena as response to an input hydrological forcing, requires a meticulous spatial representation in order to better represent the active processes at catchment scale. The present work focuses on the analysis of high-resolution freely available imagery (Microsoft® Bing Maps™ Platform) that enables the characterization of vegetation cover and the automatic mapping of shallow landslides in an alpine catchment. Semi-automatic detection of vegetation is carried out at the fine scale using both orthophotos and freely available satellite imagery. The analysis based on the satellite imagery showed a better accuracy in respect to the one based on the orthophotos. In particular, satellite imagery analysis showed high sensitivity and high specificity even in low illumination conditions, while, for the same circumstances, orthophotos-based analysis shows a significant wrong detection rate. In the framework of a long term, multi-temporal and high-resolution characterization of vegetation cover and for a rapid mapping of shallow instability phenomena, the effectiveness of the proposed approach can speed up the representation of the local conditions towards an improvement of land management strategies and hazard and risk assessment.
Author Comment
The all work has been revised. An integrative analysis has been added. The influence of the light conditions has been assessed by using different training areas sets for the orthophoto, including or ignoring shadowed areas (both under vegetation and in the upper rocky portion) and quantifying the performance on a 1000 m2 evenly illuminated shallow landslide area. The performance of the satellite based image has revealed always far better than the orthophoto and shadows seem only to play a role on the wrong classification of the vegetated areas, not on the wrong classification of landslide illuminated areas. This behavior can be ascribed probably to the process of creating and sharpening of the satellite image that, within the RGB bands, is maybe carrying some information related to other bands.
In the work the combination of data gathering by using Open Source software and analyses on freely available data is presented as a tool to leverage for multi-temporal analysis and risk assessment on selected areas of interest.