QGIS geoprocessing model to simplify first level seismic microzonation analysis
- Published
- Accepted
- Subject Areas
- Spatial and Geographic Information Systems
- Keywords
- GIS, seismic microzonation, seismic hazard, geoprocessing
- Copyright
- © 2016 Cosentino et al.
- Licence
- This is an open access article distributed under the terms of the Creative Commons Attribution License, which permits unrestricted use, distribution, reproduction and adaptation in any medium and for any purpose provided that it is properly attributed. For attribution, the original author(s), title, publication source (PeerJ Preprints) and either DOI or URL of the article must be cited.
- Cite this article
- 2016. QGIS geoprocessing model to simplify first level seismic microzonation analysis. PeerJ Preprints 4:e2250v2 https://doi.org/10.7287/peerj.preprints.2250v2
Abstract
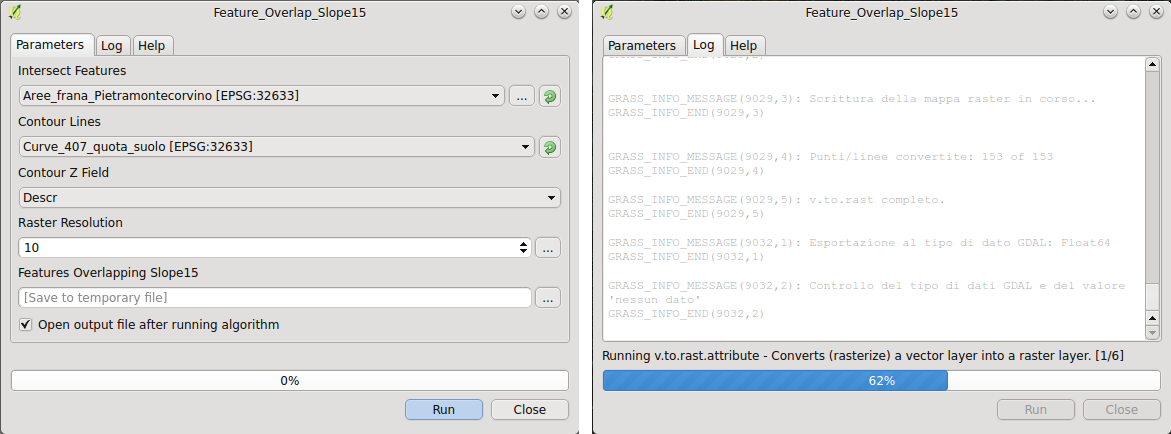
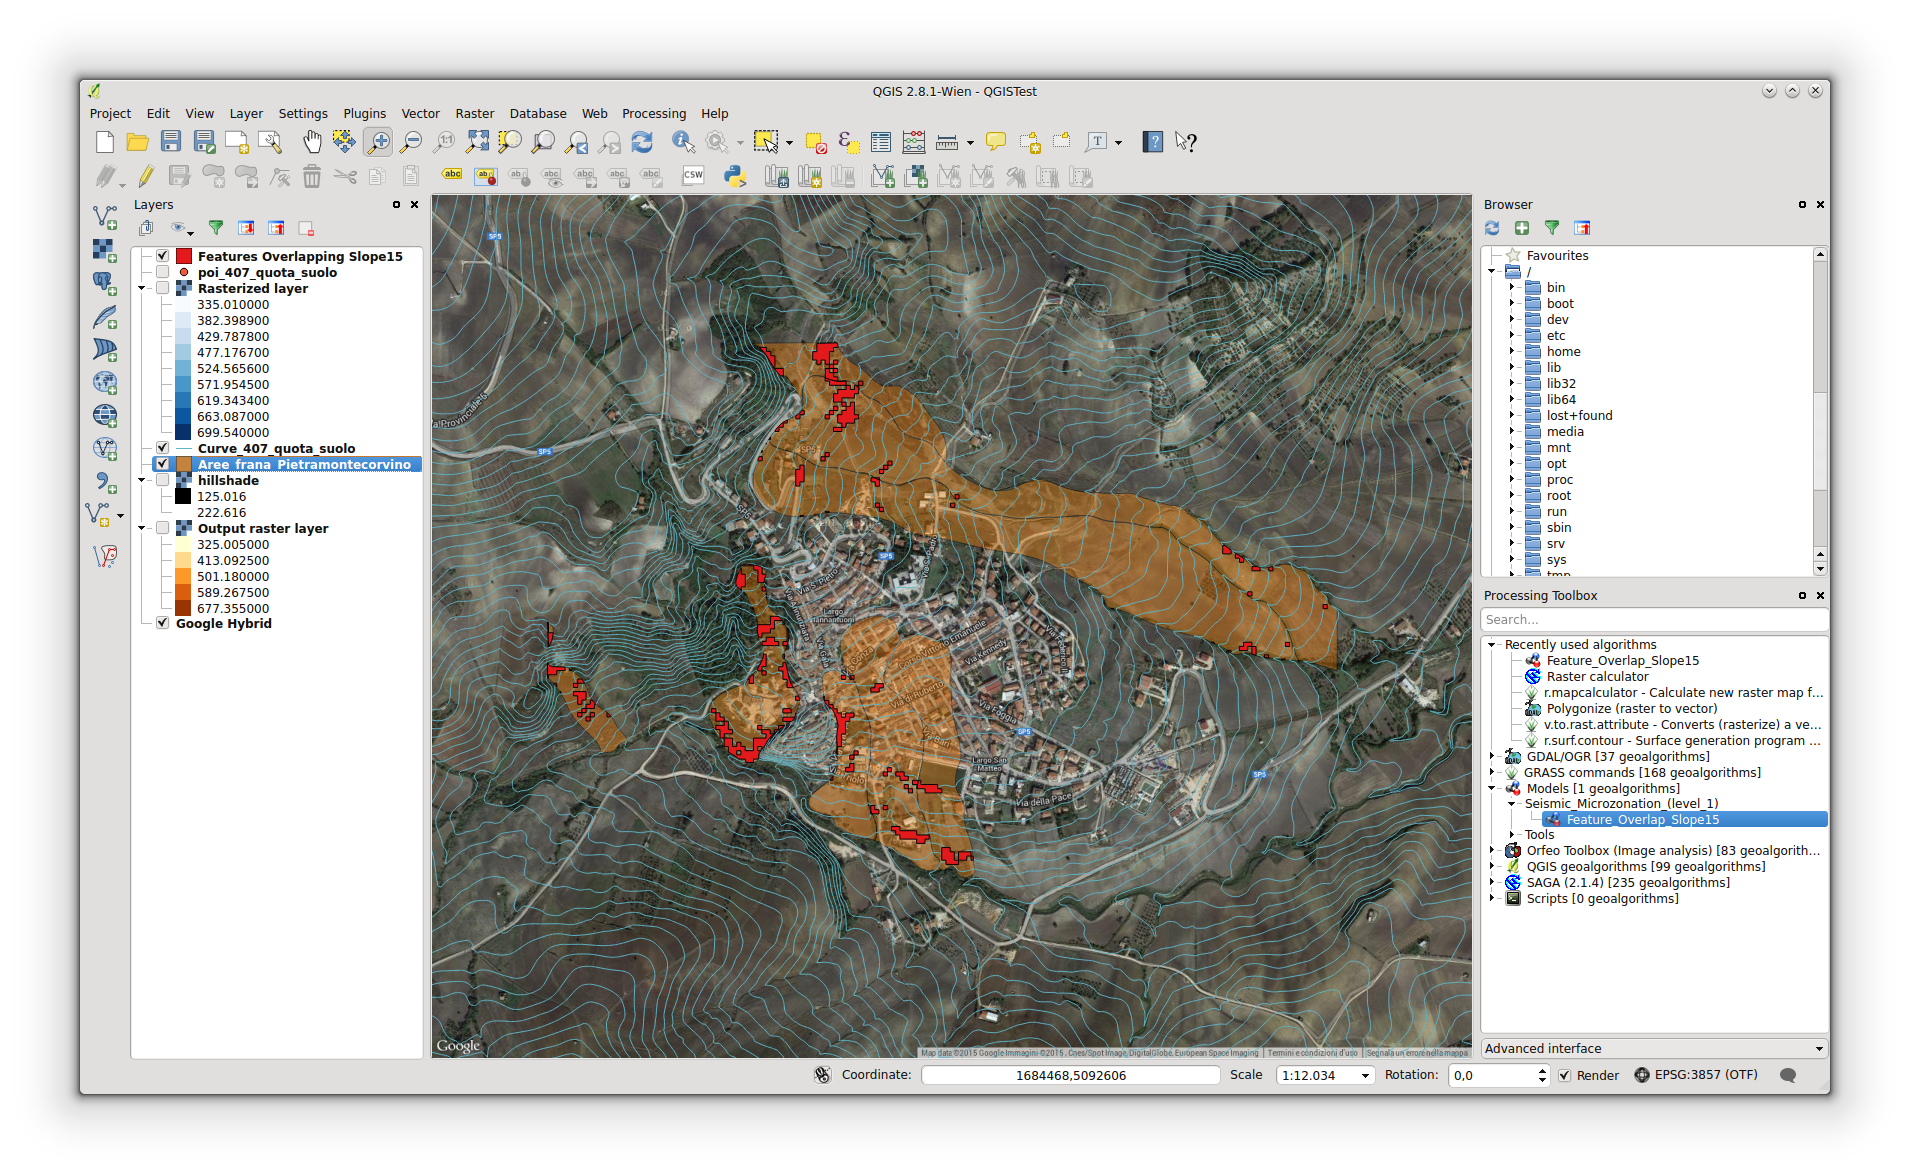
The seismic microzonation evaluate the seismic hazard at the local scale proposing to identify areas of territory characterized by homogeneous seismic behaviors. The first level of seismic microzoning has the purpose of defining the lithological properties and geometry of geological units that characterize these portions of territory (microzones). The scope of this work is to contribute to the creation of a geoprocessing methodology for topographical, geological, geophysical and geo-technical data aimed at level 1 seismic microzonation map drafting. A QGIS geoprocessing tool was designed to automate one of the analysis commonly performed for the creation of level 1 seismic microzonation maps, in particular to identify unstable zones as polygon features. The result is a polygon layer with areas prone to instability due to a slope value greater than 15 degrees.
Author Comment
This version added information on public availability of the tool.