Geometric morphometric analysis of snout shape in extant ruminants (Ungulata, Artiodactyla)
- Published
- Accepted
- Subject Areas
- Animal Behavior, Conservation Biology, Ecology, Paleontology, Zoology
- Keywords
- Snout shape, Geometric morphometrics, Ruminants, Ungulates, Functional morphology, Ecology, Palaeoecology, Mammals
- Copyright
- © 2013 Tennant et al.
- Licence
- This is an open access article distributed under the terms of the Creative Commons Attribution License, which permits unrestricted use, distribution, and reproduction in any medium, provided the original author and source are credited.
- Cite this article
- 2013. Geometric morphometric analysis of snout shape in extant ruminants (Ungulata, Artiodactyla) PeerJ PrePrints 1:e176v1 https://doi.org/10.7287/peerj.preprints.176v1
Abstract
Snout shape is a prominent aspect of herbivore feeding ecology, controlling both forage selectivity and intake rate. Many previous investigations have suggested that ruminant feeding classes can be discriminated via snout shape, with grazing and browsing species attributed ‘blunt’ and ‘pointed’ snouts respectively, with an intermediate sub-grouping. This aspect of functional ecology is analysed for the first time using a statistically rigorous geometry-based framework to compare the two-dimensional profiles of the premaxilla in ventral aspect for a large sample of ruminant species. Our results suggest that, when a sample of browsing and grazing ruminants are classified ecologically based on a range of independent indicators of their feeding strategy, they cannot be fully discriminated on the basis of their premaxilla profile shape. Instead, our sample forms a shape variation continuum with overlap between groupings, but with a 78 percent chance of successful categorisation. Moreover, previously used terminology such as ‘pointed’ and ‘blunt’ are largely inadequate for delimiting snout shape varieties, insofar as these terms lack the descriptive power to define the morphological disparity demonstrated. These results suggest that previous attempts to use snout shape as a proxy for feeding style in ruminants may have been biased due to under-sampling of this highly diverse group and to lack of geometric rigour in the assessment of shape data. Alternatively, conflicting or inadequate evidence in defining ‘browsers’ and ‘grazers’ could have caused incorrect assignment to ecological groups, distorting our analyses. The relation between snout shape and body mass are also documented.
Supplemental Information
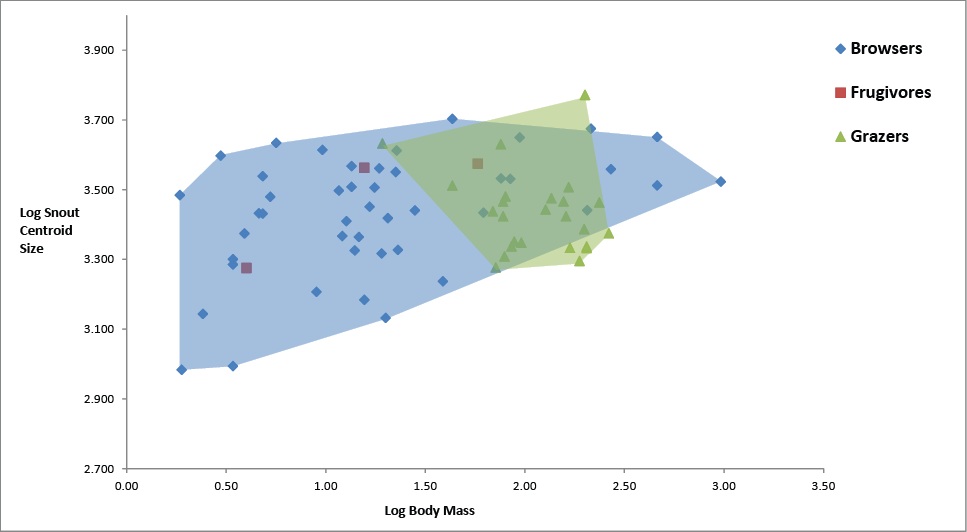
Figure 1.
Figure 1. PCA score plot for ruminants classified according to feeding strategy. Ecological classifications are given in S1. The convex hulls represent a morphospace constrained by the extreme data points within the range envelope. Scores for the species used to define this space are in the PCA scores tab of S1.
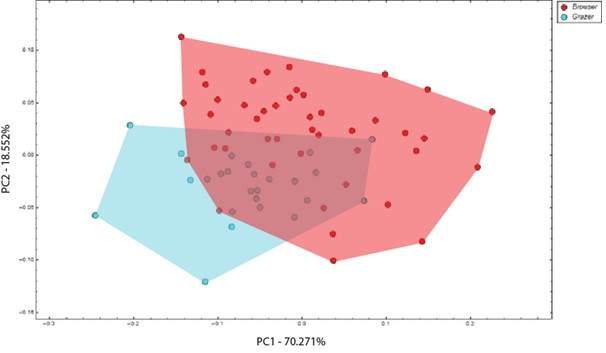
Figure 2.
Figure 2. PCA score plot for ruminants classified according to their feeding strategy, with ‘intermediates’ projected into the space.
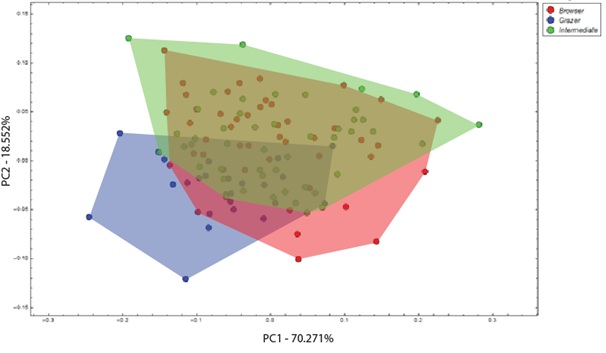
Figure 3.
Figure 3. Browsers and grazers in canonical variates space. The occupation of distinct discriminant spaces is clear, although not absolute.
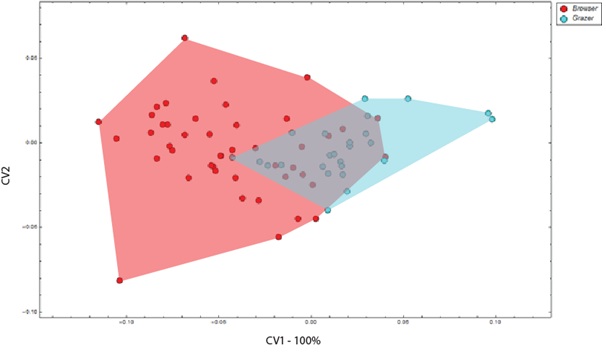
Figure 4
Figure 4. CVA score plot for ruminants classified according to their feeding strategy, with ‘intermediates’ projected into the space.
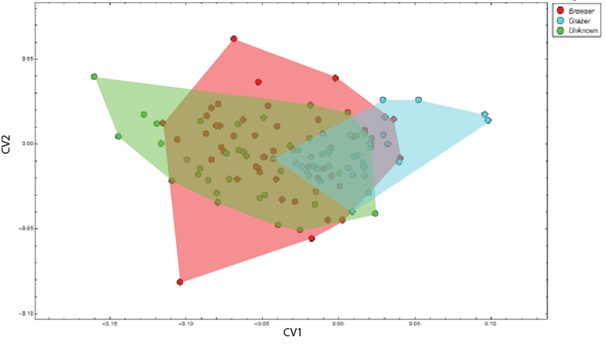
Figure 5.
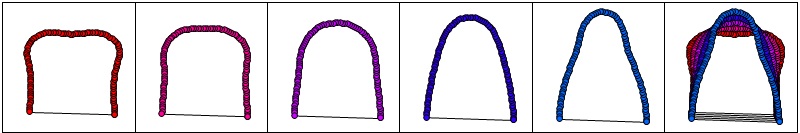
Figure 5. Strobe plots of the CV model axes in PC space for browsers and grazers. The right-hand column is an overlay plot, showing the progressive geometric deformation between model points on each axis.
Figure 6.
Figure 6. Relationship between log-transformed centroid size and body mass in browsing and grazing ruminants.
Table S1
Categorical ecology data, PCA eigenvalues, and PCA scores
Table S2
Includes CVA scores, a distance matrix, original and jackknifed confusion matrices
Table S3
Includes body mass and centroid size data