Spider phylogenomics: untangling the Spider Tree of Life
- Published
- Accepted
- Subject Areas
- Evolutionary Studies, Taxonomy, Zoology
- Keywords
- Arachnida, Molecular Systematics, Araneae, Spider phylogeny, Web evolution
- Copyright
- © 2015 Garrison et al.
- Licence
- This is an open access article distributed under the terms of the Creative Commons Attribution License, which permits unrestricted use, distribution, reproduction and adaptation in any medium and for any purpose provided that it is properly attributed. For attribution, the original author(s), title, publication source (PeerJ PrePrints) and either DOI or URL of the article must be cited.
- Cite this article
- 2015. Spider phylogenomics: untangling the Spider Tree of Life. PeerJ PrePrints 3:e1482v1 https://doi.org/10.7287/peerj.preprints.1482v1
Abstract
Spiders (Order Araneae) are massively abundant generalist arthropod predators that are found in nearly every ecosystem on the planet and have persisted for over 380 million years. Spiders have long served as evolutionary models for studying complex mating and web spinning behaviors, key innovation and adaptive radiation hypotheses, and have been inspiration for important theories like sexual selection by female choice. Unfortunately, past major attempts to reconstruct spider phylogeny typically employing the “usual suspect” genes have been unable to produce a well-supported phylogenetic framework for the entire order. To further resolve spider evolutionary relationships we have assembled a transcriptome-based data set comprising 70 ingroup spider taxa. Using maximum likelihood and shortcut coalescence-based approaches, we analyze eight data sets, the largest of which contains 3,398 gene regions and 696,652 amino acid sites forming the largest phylogenomic analysis of spider relationships produced to date. Contrary to long held beliefs that the orb web is the crowning achievement of spider evolution, ancestral state reconstructions of web type support a phylogenetically ancient origin of the orb web and diversification analyses show that the mostly ground-dwelling, web-less RTA clade diversified faster than orb weavers. Consistent with molecular dating estimates we report herein, this may reflect a major increase in biomass of non-flying insects during the Cretaceous Tertiary Revolution 125-90 million years ago favoring diversification of spiders that feed on cursorial rather than flying prey. Our results also have major implications for our understanding of spider systematics. Phylogenomic analyses corroborate several well-accepted high level groupings: Opisthothele, Mygalomorphae, Atypoidina, Aviculariodea, Theraphosidina, Araneomorphae, Entelygynae, Araneoidea, the RTA – clade, Dionycha and the Lycosoidea. Alternatively, our results challenge the monophyly of Eresoidea, Orbiculariae, and Deinopoidea. The composition of the major Paleocribellate and Neocribellate clades, the basal divisions of Araneomorphae, appear to be falsified. Traditional Haplogynae, and even the new concept of Synspermiata, need revision after the departure of Filistatidae and Leptonetidae from the haplogyne clade. The sister pairing of filistatids with hypochilids, implies that some peculiar features of each family may in fact be synapomorphic for the pair. Leptonetids now are seen as a possible sister group to the Entelegynae, illustrating possible intermediates in the evolution of the more complex entelegyne genitalic condition, spinning organs and respiratory organs.
Author Comment
This is a submisison to PeerJ for review.
Supplemental Information
Clustering/heatmap analysis depicting degree of shared data between each species pair; missing data reduction (matrix 3, Table 2)
Degree of positive data overlap indicated by a color-coded heatmap (yellow = low, red = high); species order from right to left in the same order as listed from top to bottom on right side of figure. Lack of phylogenetic clustering indicates bias from shared data does not explain relationships seen in phylogenomic analyses.
Clustering/heatmap analysis depicting degree of shared data between each species pair; missing data reduction (matrix 2, Table 2)
Degree of positive data overlap indicated by a color-coded heatmap (yellow = low, red = high); species order from right to left in the same order as listed from top to bottom on right side of figure. Lack of phylogenetic clustering indicates bias from shared data does not explain relationships seen in phylogenomic analyses.
Clustering/heatmap analysis depicting degree of shared data between each species pair; BaCoCa reduced matrix (matrix 4, Table 2)
Degree of positive data overlap indicated by a color-coded heatmap (yellow = low, red = high); species order from right to left in the same order as listed from top to bottom on right side of figure. Lack of phylogenetic clustering indicates bias from shared data does not explain relationships seen in phylogenomic analyses. 40
Clustering/heatmap analysis depicting degree of shared data between each species pair; arthropod core ortholog matrix (matrix 5, Table 2)
Degree of positive data overlap indicated by a color-coded heatmap (yellow = low, red = high); species order from right to left in the same order as listed from top to bottom on right side of figure. Lack of phylogenetic clustering indicates bias from shared data does not explain relationships seen in phylogenomic analyses.
Clustering/heatmap analysis depicting degree of shared data between each species pair; full spider ortholog matrix (matrix 1, Table 2)
Degree of positive data overlap indicated by a color-coded heatmap (yellow = low, red = high); species order from right to left in the same order as listed from top to bottom on right side of figure. Lack of phylogenetic clustering indicates bias from shared data does not explain relationships seen in phylogenomic analyses. 42
Clustering/heatmap analysis depicting degree of shared data between each species pair; MARE matrix (matrix 7, Table 2)
Degree of positive data overlap indicated by a color-coded heatmap (yellow = low, red = high); species order from right to left in the same order as listed from top to bottom on right side of figure. Lack of phylogenetic clustering indicates bias from shared data does not explain relationships seen in phylogenomic analyses.
Gene occupancy of matrix 1 (see Table 2)
Colored squares represent partitions present in matrix for each OTU (x-axis, in descending order of OTU representation from left to right) and each partition or gene (y-axis, in ascending order of partition representation).
Gene occupancy of matrix 2 (see Table 2)
Colored squares represent partitions present in matrix for each OTU (x-axis, in descending order of OTU representation from left to right) and each partition or gene (y-axis, in ascending order of partition representation).
Gene occupancy of matrix 3 (see Table 2)
Colored squares represent partitions present in matrix for each OTU (y-axis, in descending order of OTU representation from bottom to top) and each partition or gene (x-axis, in descending order of partition representation from left to right).
Gene occupancy of matrix 4 (see Table 2)
Colored squares represent partitions present in matrix for each OTU (y-axis, in descending order of OTU representation from bottom to top) and each partition or gene (x-axis, in descending order of partition representation from left to right). Figure
Gene occupancy of matrix 7 (see Table 2)
Colored squares represent partitions present in matrix for each OTU (y-axis, in descending order of OTU representation from bottom to top) and each partition or gene (x-axis, in descending order of partition representation from left to right).
Gene occupancy of matrix 5 (see Table 2)
Colored squares represent partitions present in matrix for each OTU (y-axis, in descending order of OTU representation from bottom to top) and each partition or gene (x-axis, in descending order of partition representation from left to right).
Gene Ontology molecular functions, levels 2 for OGs shared by Arthropod and Spider Core sets
Figures generated by Blast2GO analysis.
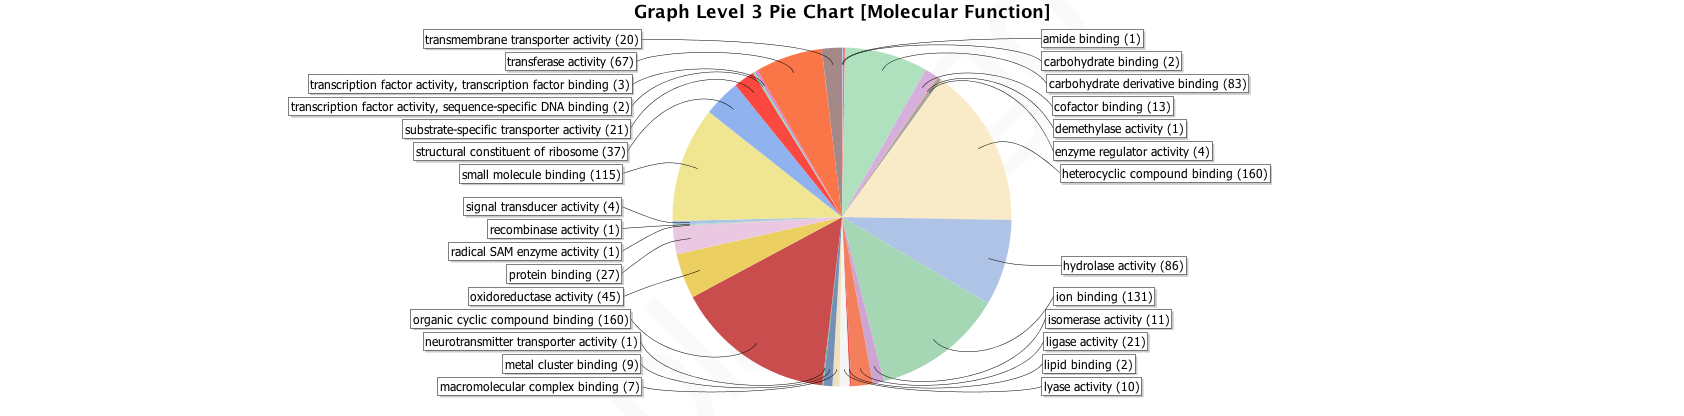
Gene Ontology molecular functions, level 3 for OGs shared by Arthropod and Spider Core sets
Figures generated by Blast2GO analysis.