
Unveiling causal relationship between non-covalent interactions and evaluated Young’s modulus within oligolignols-cellulose complexes
- Published
- Accepted
- Received
- Academic Editor
- Hans Senn
- Subject Areas
- Nanomaterials and Nanochemistry, Theoretical and Computational Chemistry, Physical Organic Chemistry, Surfaces and Interfaces
- Keywords
- Non-covalent lignin-cellulose interactions, Adhesives, Depolymerized lignin, Young’s modulus, Oligolignols
- Copyright
- © 2024 Lopez Albarran et al.
- Licence
- This is an open access article distributed under the terms of the Creative Commons Attribution License, which permits unrestricted use, distribution, reproduction and adaptation in any medium and for any purpose provided that it is properly attributed. For attribution, the original author(s), title, publication source (PeerJ Physical Chemistry) and either DOI or URL of the article must be cited.
- Cite this article
- 2024. Unveiling causal relationship between non-covalent interactions and evaluated Young’s modulus within oligolignols-cellulose complexes. PeerJ Physical Chemistry 6:e33 https://doi.org/10.7717/peerj-pchem.33
Abstract
Linear correlation coefficients were calculated between the reported Young’s modulus (YM) values and non-covalent interactions within cellulose-oligolignol complexes, considering the composition of an efficient adhesive formulation previously reported. A paradigmatic relationship was observed. Molecular complexes of oligolignols with cellulose Iβ were modeled using hybrid quantum mechanics/molecular mechanics (QM/MM) computations to obtain wavefunctions at the interaction region. Subsequently, a study of non-covalent interactions (NCI) based on the atoms in molecules (AIM) theory was implemented, utilizing graphics processing units (GPUs) for calculations. Our findings indicate that non-covalent interactions control the forces associated to adhesive-cellulose contacts, primarily through X-H···O hydrogen bonds, which promote the adhesion of oligolignols on cellulose Iβ. Results indicate that the adhesion strength projected from larger YM values cannot be described solely by the number of stronger hydrogen bonds nor by the number of the weak interactions but by the entire contributions of specific interactions. Thus, significant linear correlations were observed between reported values of Young’s modulus and the molecular interactions observed, rendering the influence of oligolignol structure on the adhesion phenomenon in our cellulose Iβ crystallite model. These observations promote the NCI and AIM analysis in a new framework to design adhesive formulations.
Introduction
The demand for environmentally friendly wood adhesives has driven extensive research into adhesives derived from natural and non-toxic materials (Antov, Savov & Neykov, 2020; Pizzi, 2006, 2013). Several studies have explored this topic, with lignin emerging as a promising raw material at the forefront of these investigations (Desai, Patel & Sinha, 2003; Imam et al., 2001; Li et al., 2004; Nimz, 1983; Pizzi, 1994). In this context, the oligolignol composition and Young’s modulus (YM) experimental values of lignin-based adhesives were postulated and identified by MALDI-TOF (matrix assisted laser desorption ionization time-of-flight) mass spectroscopy (Sedano-Mendoza, Lopez-Albarran & Pizzi, 2010). In that study, a computational molecular docking analysis was employed to establish a correlation between the interaction energy of the proposed adhesives and a cellulose Iβ crystallite model. These interaction energies were directly associated with the experimental YM values obtained through thermomechanical analysis (Martinez et al., 2010). While the reported correlations were generally acceptable, some adhesive mixtures exhibited low correlation factors despite their YM values indicating effective adhesion. The utilization of a molecular docking methodology serves as an initial approach to understand the interactions involved in the oligolignol-cellulose contact.
Recently, we developed Reactive Force Field (ReaxFF) (Chenoweth, Van Duin & Goddard, 2008) molecular dynamics simulations to elucidate the contribution of individual oligolignol molecular structures to the adhesive properties of lignin mixtures (López-Albarrán et al., 2017). In that work, the interaction of each oligolignol with a cellulose Iβ crystallite model was simulated. Notably, the coupling energies obtained from these simulations exhibited a strong correlation with experimentally determined YM values of the lignin mixtures. However, an ab-initio study is required to elucidate which molecular interactions are involved in the oligolignols-cellulose complexes, to determine which interactions address the adhesion effect beyond the energetic description.
The intermolecular contacts between cellulose and adhesives constitute an important research area due to their potential in designing non-toxic glues for the wood industry (Chenoweth, Van Duin & Goddard, 2008; Desai, Patel & Sinha, 2003; Fengel & Wegener, 1983; Houtman & Atalla, 1995; Imam et al., 2001). Hydrogen bonding is undoubtedly a crucial topic for experimental and theoretical researchers (Ishikawa et al., 2015; Nishiyama, Langan & Chanzy, 2002), as this interaction plays a key role in stabilizing the cellulose network (Djahedi et al., 2016; Moon et al., 2011). However, several authors (Cintrón, Johnson & French, 2011; Huang et al., 2021) have emphasized the need for careful consideration of both strong and weak hydrogen bonds, as these interactions offer insights into the design of materials with desired mechanical properties. Unfortunately, ab-initio studies demand extensive computational time due to the large size of the systems involved.
In the composition of lignocellulosic biomass, lignin is a major component of wood, second only to cellulose, and acts as a cementing agent among wood cells (Fengel & Wegener, 1983). Extensive research from the scientific and engineering perspectives has been conducted to investigate the interaction between cellulose and lignin, aiming to design and develop novel wood adhesive formulations (Pizzi, 1994; Pizzi & Mittal, 2011). The inclusion of lignin in these formulations has shown adhesive properties similar to those of phenol-formaldehyde resins (Jin, Cheng & Zheng, 2010; Pizzi, 2013), which find widespread application in industries involved in particleboard, plywood, fiberboard, and laminated wood (Mansouri et al., 2011; Navarrete et al., 2010).
Empirical studies have conducted on lignin-based adhesives (Knop & Scheib, 1979; Nimz, 1983). However, these studies have overlooked the molecular mechanism and the atomistic interactions within the cross-linked structure of lignin, specifically 4-hydroxyphenylpropanoids. Consequently, the driving forces behind the adhesion phenomenon remain unclear. Moreover, classical molecular dynamics simulations have been performed to investigate the absorption of lignin onto various cellulose surfaces (Besombes & Mazeau, 2005). Although the energy of interactions between lignin and cellulose has been reported, specific interactions relevant to adhesiveness, Young’s modulus, or mechanical properties have not been addressed.
The lignin structure is primarily composed of simple units of 4-hydroxyphenylpropane, specifically three hydroxycinnamyl alcohols: p-coumarol, coniferol, and sinapol (Fig. 1). These units are commonly referred to as monolignols (Fengel & Wegener, 1983).
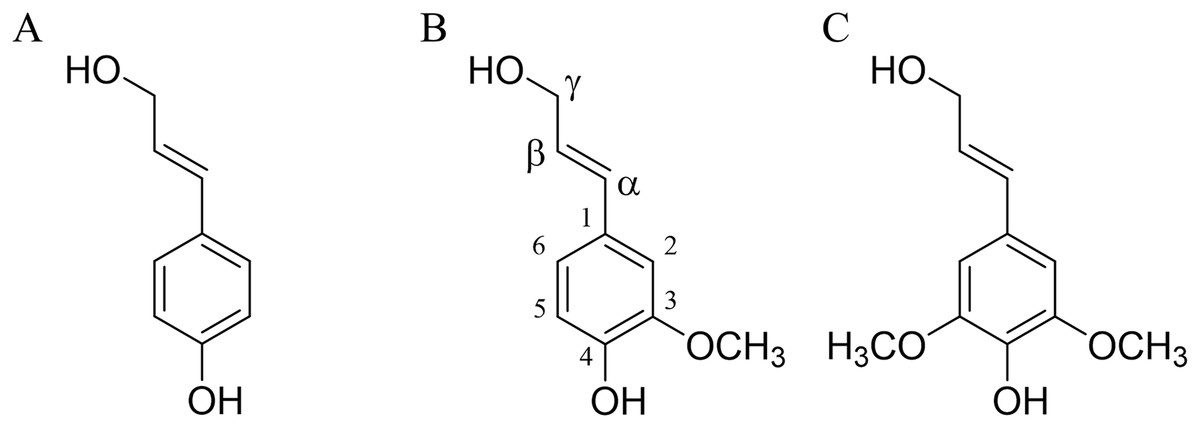
Figure 1: Lignin precursors.
(A) p-coumarol, (B) coniferol, and (C) sinapol, all of them showed in their predominant (E) monolignol configuration. Carbon numbering is shown on the coniferol structure.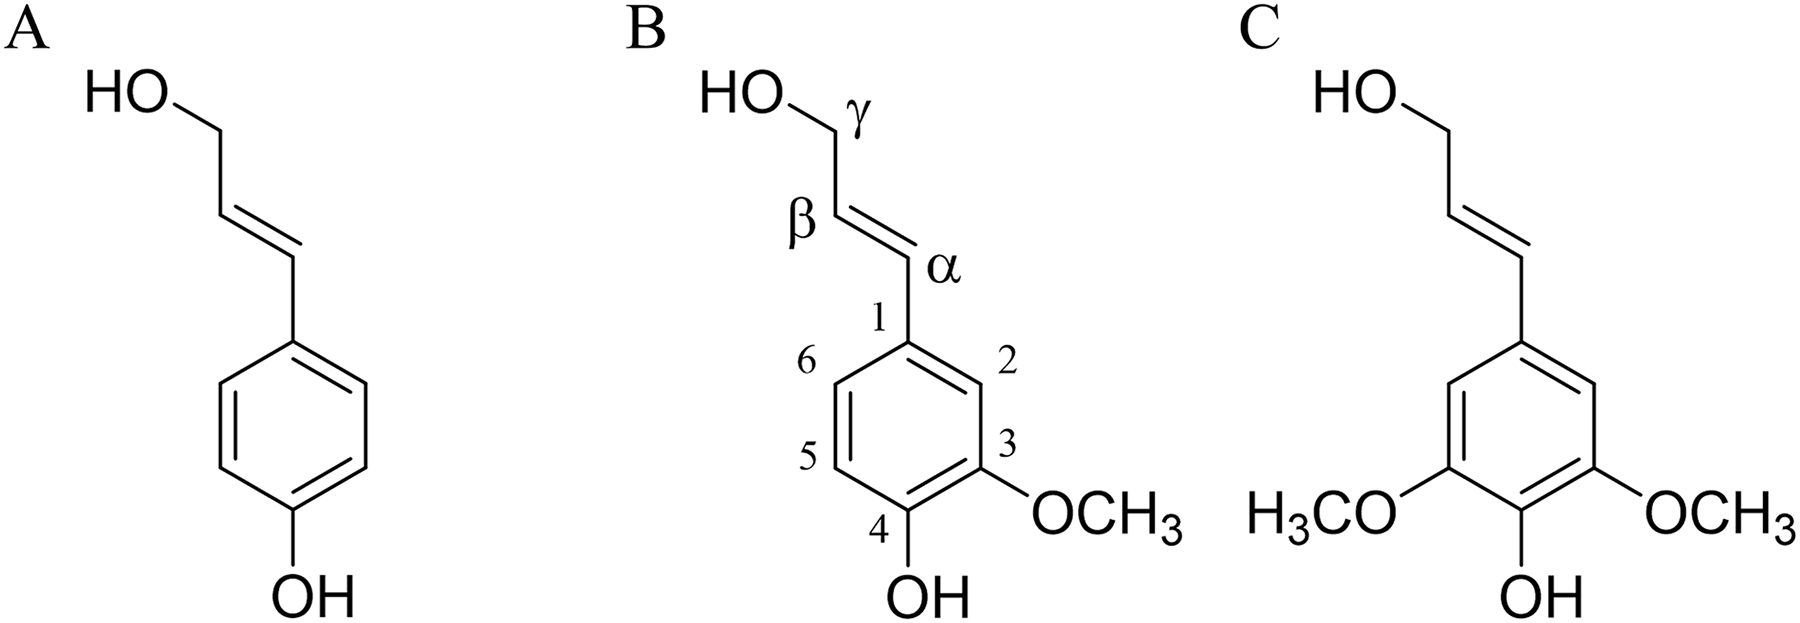
Coniferol units are generally more abundant in softwood compared to hardwood, where coniferyl and sinapyl units are present in comparable proportions (Shimada & Higuchi, 1983). Due to the extraction process, the composition of lignin in solution differs from that of the native lignin (protolignin) within the wood cell wall (Terashima, Nakashima & Takabe, 1998). Despite these variations, the most prevalent interunit linkages observed between lignin units are β-O-4’ (designated as βO4), β-5’ (β5) and β-β’ (ββ) (Sjöström, 1998).
In this study, we propose an atomistic analysis to investigate the role of four prevalent oligolignol molecular structures within lignin-based formulations in their adhesion properties, as determined by Young’s modulus. These structures were previously characterized using the MALDI-TOF technique (Sedano-Mendoza, Lopez-Albarran & Pizzi, 2010). ReaxFF molecular dynamics simulations are employed to model the absorption behavior of oligolignols onto a cellulose Iβ crystallite surface. Subsequently, a hybrid quantum mechanics/molecular mechanics (QM/MM) approach (Vreven & Morokuma, 2006) is used to refine the obtained geometries of the oligolignol-cellulose complexes derived from the molecular dynamics simulations. Then, each complex is used to calculate its electron density ( ) through density functional theory (DFT) (Kohn, Becke & Parr, 1996). The structures are subsequently analyzed using two tools developed within the quantum chemistry: 1) The non-covalent interaction index (NCI) (Johnson et al., 2010), which explores regions where possible non-covalent interactions are present, and 2) the atoms in molecules (AIM) theory (Bader & Nguyen-Dang, 1981) which is a useful approach based on the electronic density ( ) distribution in order to describe possible inter and intra non-covalent bonds within molecules. The NCI provides information on regions of non-covalent interactions, such as hydrogen bonds, weak interactions, and steric clashes, by evaluating the reduced gradient of the electron density (Boto et al., 2016), which is defined as: (1)
Therefore, the determination of electron density and its derivatives are essential for the NCI assessment. Furthermore, the identification of critical points in the electron density, , plays a crucial role in the AIM approach. Accordingly, identifying that satisfy the Laplacian is important for the analysis of the electron density, as these points indicate bond paths and bond critical points. Thus, these quantum chemistry tools serve to describe and elucidate both short- and long-range interactions involved in the adhesion of oligolignols to the cellulose Iβ surface. Evidently, the aim of this work is to stablish a foundation for designing and developing adhesive formulations for lignocellulosic materials by gaining insight into their fundamental molecular interactions with a cellulose Iβ surface, rather than in an energetic description. As far as we know, no previous theoretical reports have employing reactive molecular dynamics in conjunction with NCI-AIM methodologies to elucidate the interaction between oligolignols and cellulose. This research represents a key step towards the development of new and eco-friendly adhesive formulations for wood. Portions of this text were previously published as part of a preprint (Lopez-Albarran et al., 2022).
Naturally, performing NCI-AIM evaluations along with their corresponding derivatives can be a challenge when dealing with considerable systems sizes. To address this issue, we employ the GPUAM code, a QM program specifically designed to handle large systems and optimized for graphics processing units (GPUs) (Hernández-Esparza et al., 2014). GPUAM has demonstrated its capability to deliver reliable results in less computing time compared to software developed for x86 multicore CPUs (Hernández-Esparza et al., 2014).
We believe that this type of study provides a framework for elucidating oligolignols or lignin substructures within lignin-adhesive formulations that enhance cellulose adhesion. Besides, the present study can contribute to delineating the interactions between lignin components and cellulose.
Materials and Methods
Considering that the most prevalent form of the cellulose in higher plants is cellulose Iβ (Nishiyama, Langan & Chanzy, 2002), the cellulose model used in this work was constructed based on crystalline structures characterized through X-ray and neutron fiber diffraction measurements (Nishiyama, Langan & Chanzy, 2002; Nishiyama et al., 2003).
Our cellulose Iβ crystallite model comprises three layers in the direction and six glucan chains in the direction. Each chain consists of 12 glucose units (equivalent to six cellobioses) in the direction, as illustrated in Fig. 2 (Lopez-Albarran et al., 2022).
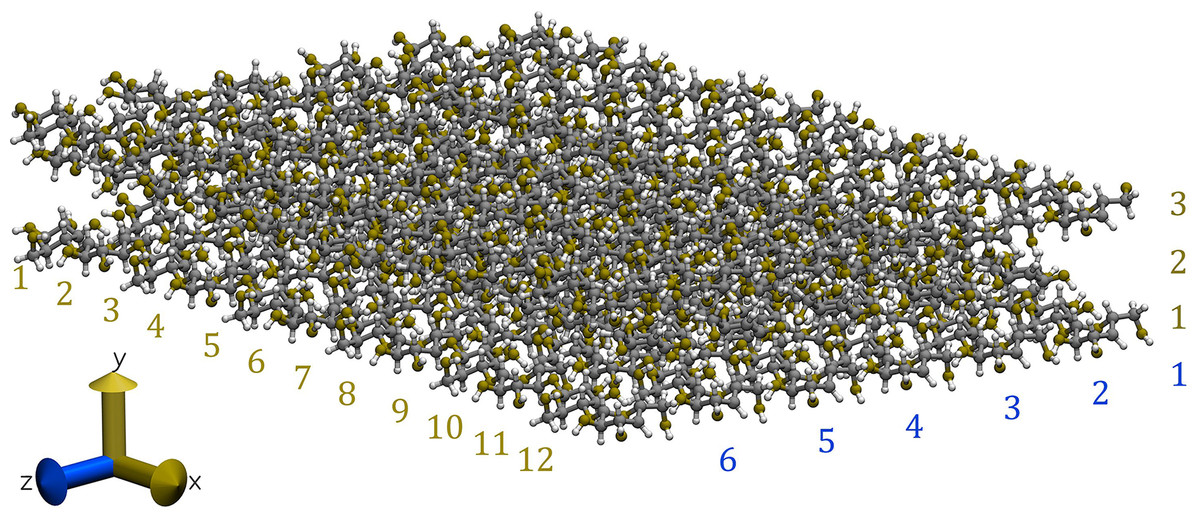
Figure 2: Snapshot of the cellulose Iβ model used to form the complexes with the oligolignols.
The model was built using the Cellulose-Builder toolkit, Gomes & Skaf (2012) and visualized by the Vesta molecular viewer. Momma & Izumi (2008) Color key: carbons atoms are in dark-gray, oxygen atoms in red, and hydrogen atoms in white.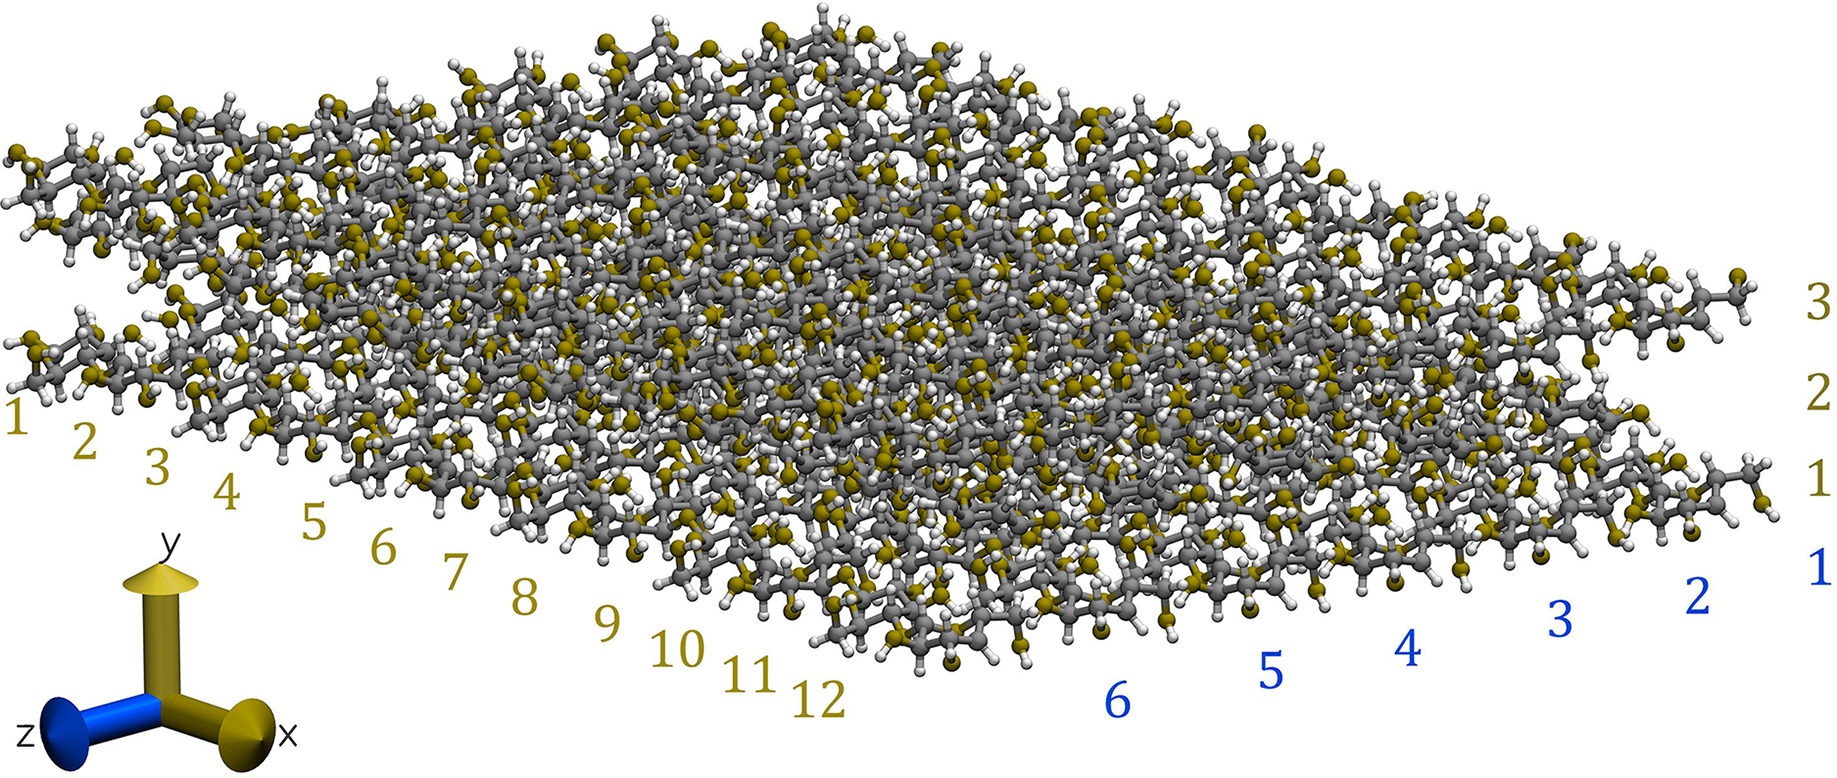
The molecular structures of four prevalent oligolignol molecular structures within lignin-based formulations elucidated by our MALDI-TOF experimental results, were constructed using the ChemBioOffice Ultra software version 11.0.1 (Ultra, 2007). These oligolignols were assumed to interact with the cellulose Iβ crystallite model. The set of oligolignols examined in this study (see Fig. 3) was characterized from the experimental adhesive formulation with the best performance (highest value for Young’s modulus) (Pizzi et al., 2011). As observed, the modeled oligolignols are constituted solely by coniferyl (Fig. 1B) and sinapyl (Fig. 1C) units. The p-coumaryl unit (Fig. 1A) did not occur in the experimental results for the four prevalent oligolignol molecular structures; however, it is also present within the lignin structure (Amthor, 2003). We employed the following nomenclature for oligolignols: A_m_B_n_C where A, B or C indicates a coniferyl (CA) or sinapyl (SA) alcohol linked by one m or n linkage (for instance, βO4, ββ, and β5). Therefore, we constructed the following four oligolignols CA_βO4_SA_β5_CA (Fig. 3A), CA_βO4_SA_ββ_SA (Fig. 3B), SA_βO4_SA_ββ_SA (Fig. 3C), and CA_ββ_CA (Fig. 3D).
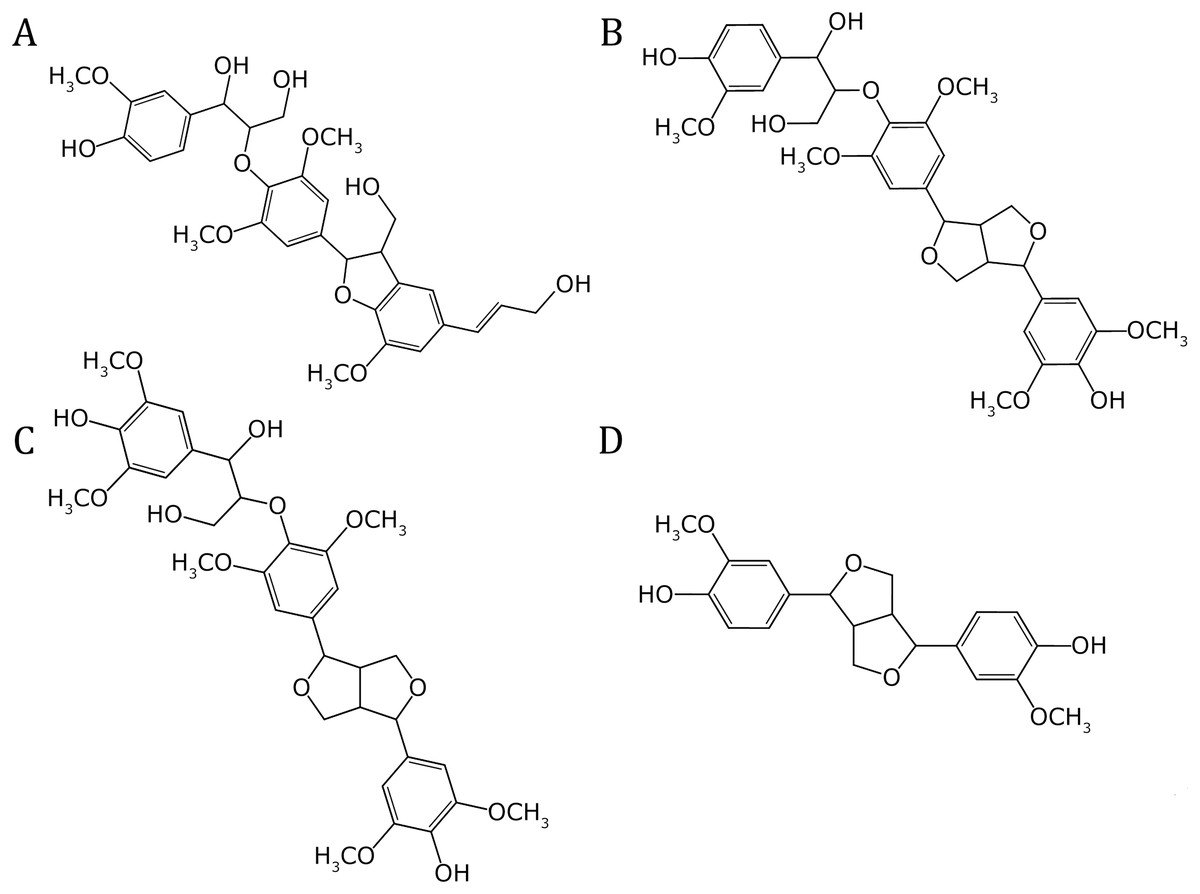
Figure 3: Molecular structures of the oligolignols in the reported efficient adhesive formulation.
(A) CA_βO4_SA_β5_CA, (B) CA_βO4_SA_ββ_SA, (C) SA_βO4_SA_ββ_SA, and (D) CA_ββ_CA.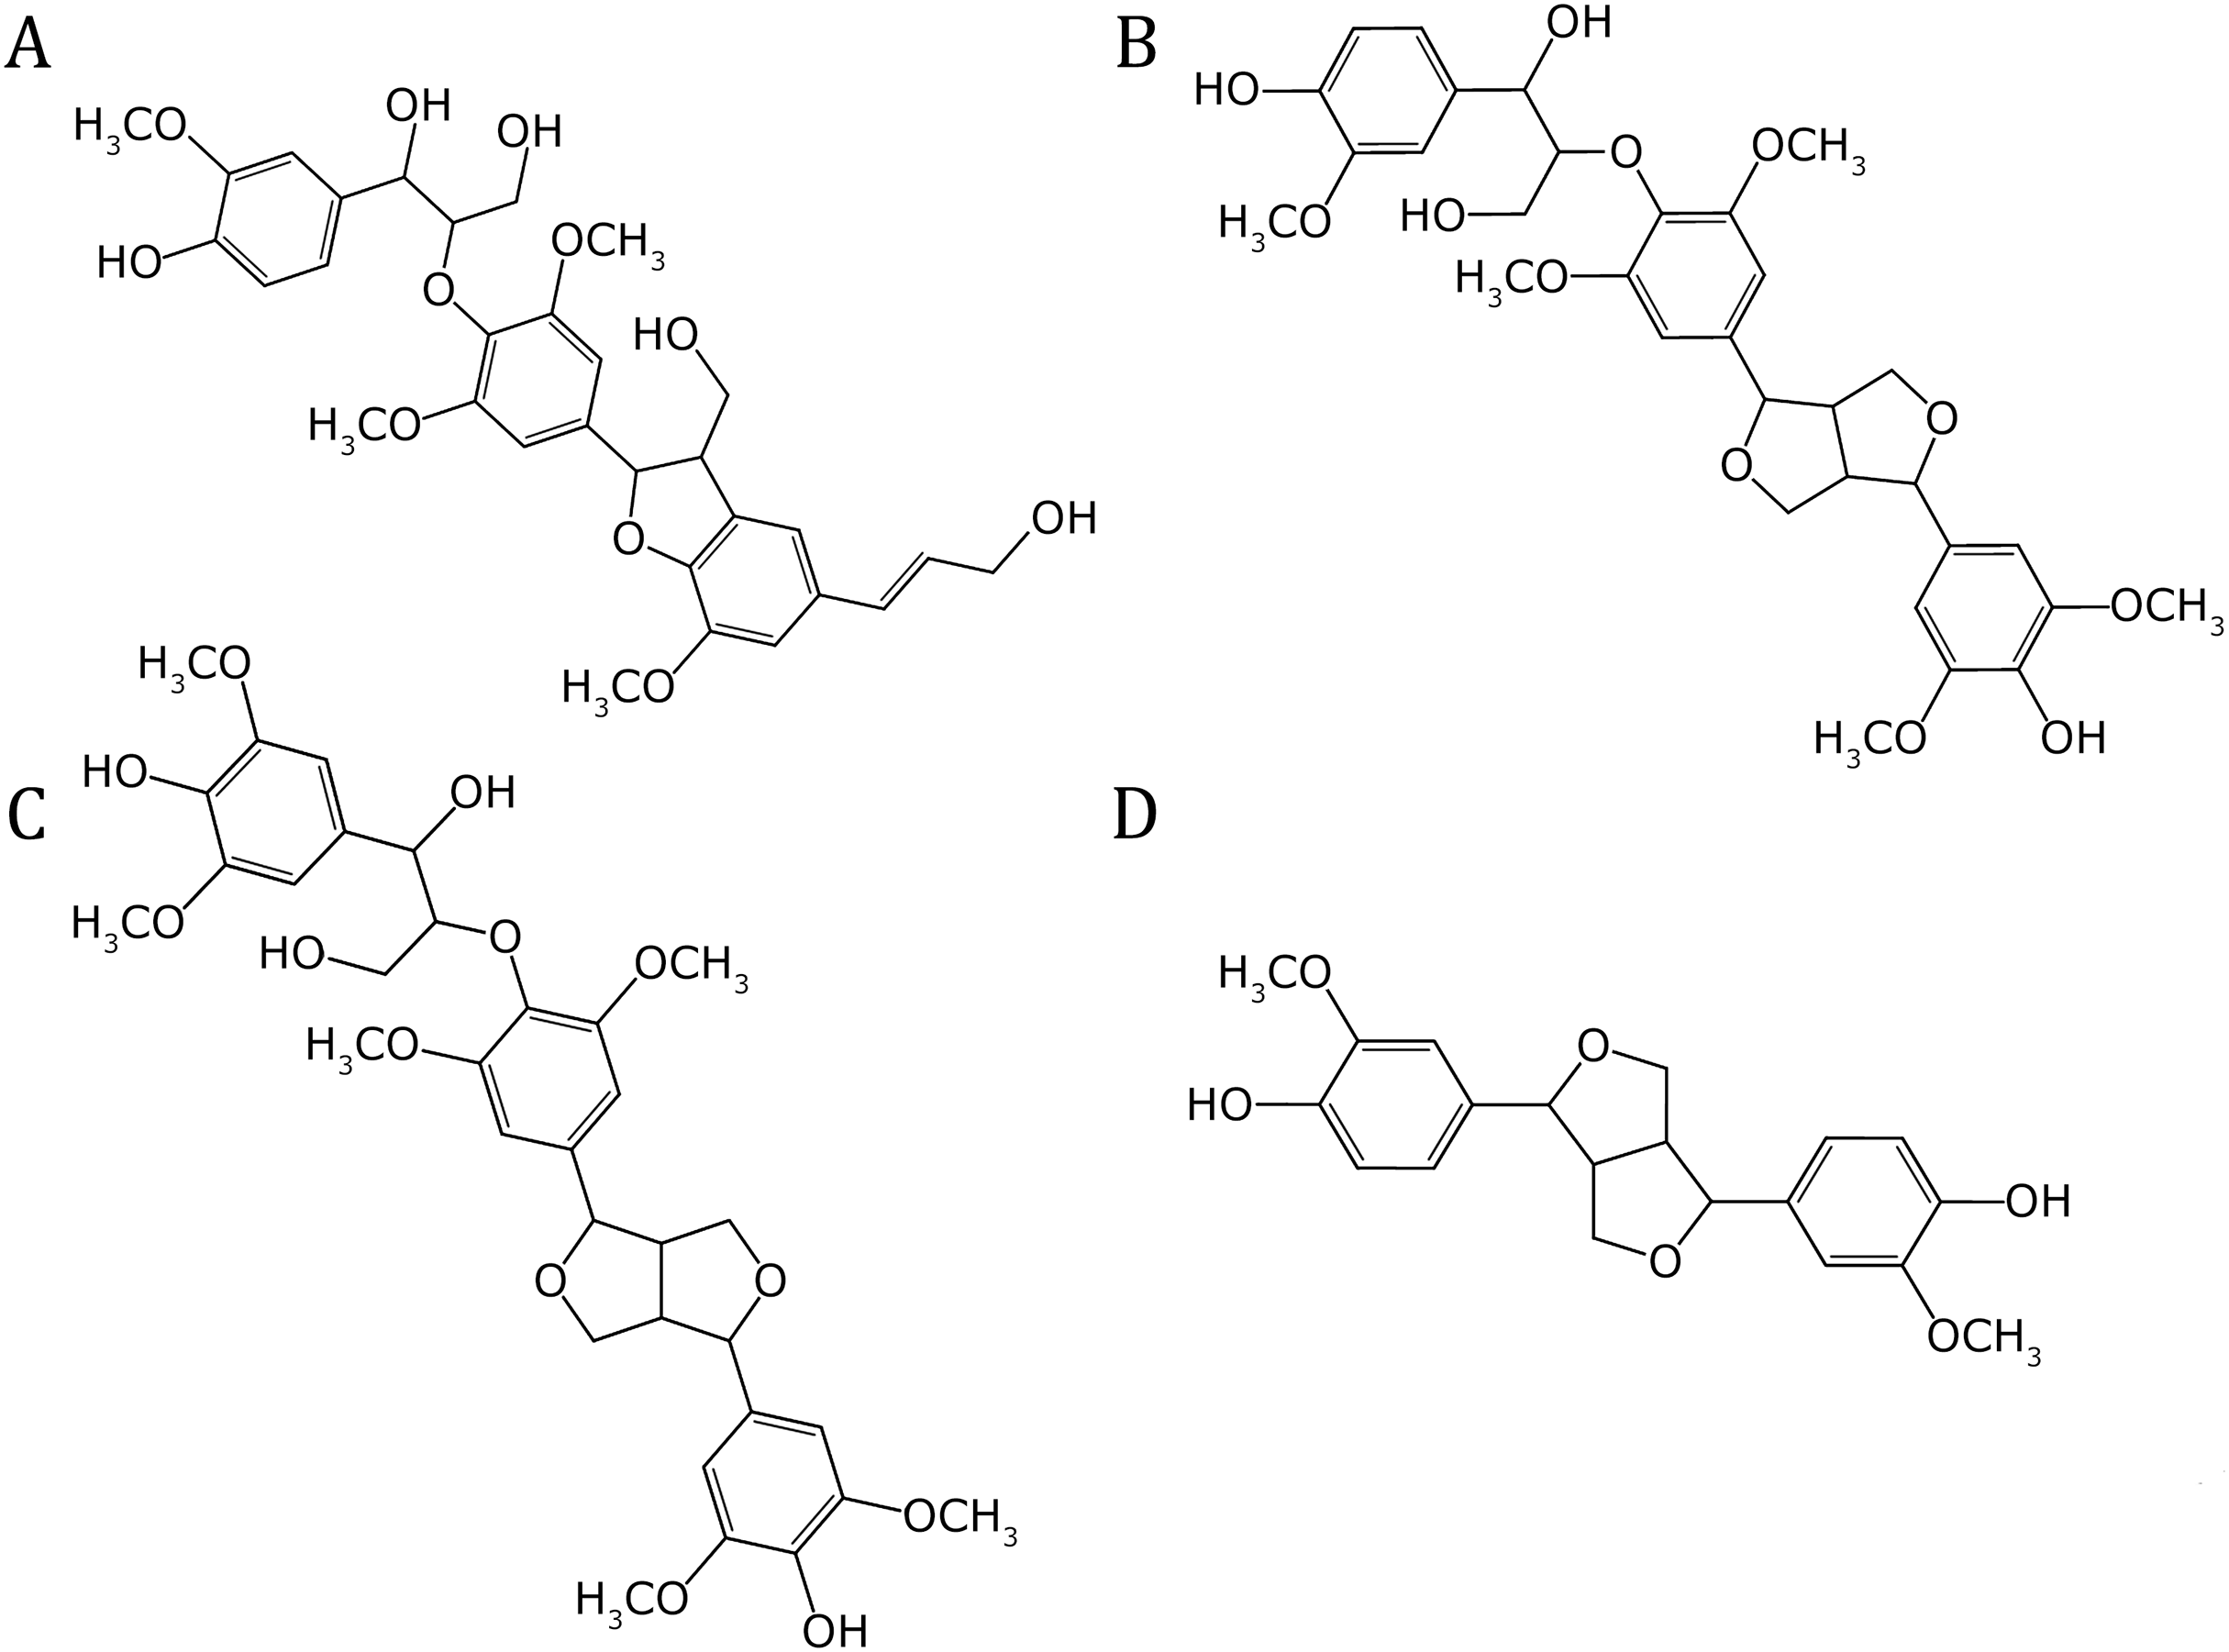
The present QM/MM study utilized the four oligolignol-cellulose complexes identified in a previously reported effective adhesive oligolignol-mixture (López-Albarrán et al., 2017; Sedano-Mendoza, Lopez-Albarran & Pizzi, 2010). The ONIOM method (Dapprich et al., 1999), implemented in the Gaussian 16 suite (Frisch et al., 2016), was utilized to analyze the primary interactions using an ab-initio approach. In our proposed approach, the QM region comprised the oligolignol and a cellulose Iβ surface fragment, while the remainder of the cellulose model was designated as the MM region (Lopez-Albarran et al., 2022). The four energetically optimal oligolignol-cellulose complexes achieved in our previous ReaxFF simulations were optimized using the ONIOM method. This method defines two or three layers (molecular or atomic) within the structure that are evaluated at different levels of molecular modeling. Geometry optimization for each complex was performed with inclusion of long-range interactions by employing the CAM-B3LYP (Yanai, Tew & Handy, 2004) method and the cc-pVDZ Dunning basis set (Kendall, Dunning & Harrison, 1992). The MM contribution was calculated applying the universal force field (UFF) (Rappé et al., 1992) implemented in the Gaussian16 suite. The output coordinates obtained from the QM/MM minimization process were employed to compute the electronic wavefunction through a single point energy calculation for the QM region (oligolignol and part of the cellulose crystallite). These calculations were carried out considering that the QM region requires an ab-initio method or methods developed to describe van der Waals (vdW) interactions. In this work, the M06-2X functional (Zhao & Truhlar, 2008), including dispersion interactions proposed by Grimme (2004) in the commonly used form named “D3”, was used for vdW corrections. The resulting wavefunction was then analyzed to evaluate the NCI interactions associated with the AIM approach for each system. The evaluation of NCI index and the bond critical points related to AIM theory, were obtained by using a grid-based method. This grid-based method was developed and implemented by Hernández-Esparza et al. (2014) on graphics processing units (GPUs), which is quite convenient to reduce considerably the computation efforts, particularly in large systems such as the oligolignol-cellulose complexes studied in this manuscript. Subsequently, the observed interactions were classified into adhOH···OCell, adhO···HOCell, adhCH···OCell, adhO···HCCell, adhCπH···OCell, adhCπ···HCCell, and adhC-HCCell based on their electron density and the Laplacian of the electron density (which must be positive for all cases). Among them, weak interactions were considered as all of interactions with electron density value less or equal than 0.005 a.u. (Johnson et al., 2010). Finally, a series of correlations between the observed interactions and the previously reported experimental values for the Young’s modulus were determined.
To enhance the reliability of this analysis, an additional set of seven conformations for each oligolignol-cellulose complex was extracted from the ReaxFF trajectory. Consequently, each complex is represented by eight conformers: one corresponding to the energetic minimum identified in the ReaxFF simulations and seven additional conformations from the vicinity of this minimum. This approach yields a total of 32 conformations (four complexes times eight conformers per complex) to be analyzed using the NCI and AIM methods, classifying them into the observed interplays mentioned above.
Results
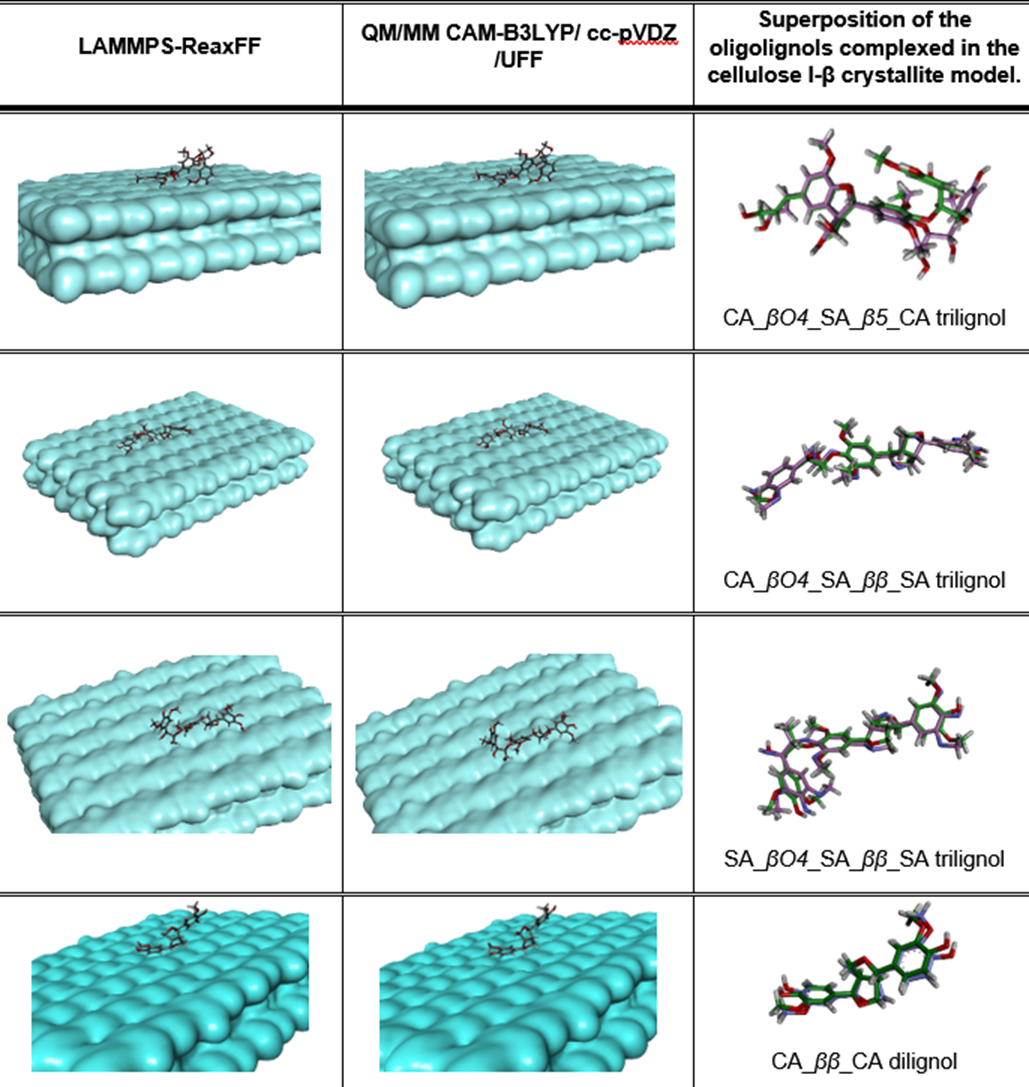
Initially, from each set of eight conformations, the lowest energy conformation observed in the ReaxFF simulations was analyzed. The optimized molecular structures of the oligolignol-cellulose complexes at the interaction region, obtained through QM/MM-ONIOM studies, closely resemble the conformations observed in our previous LAMMPS-ReaxFF-MD simulations (López-Albarrán et al., 2017). Figure 4 depicts the superposition of the oligolignols conformations from this QM/MM study with those reported from the LAMMPS-ReaxFF-MD simulations. For clarity, the cellulose model is omitted, but the complete system is displayed in Fig. S1. The QM and MM regions for each minimized oligolignol-cellulose complex are displayed in Fig. S2 (Supplemental Information).
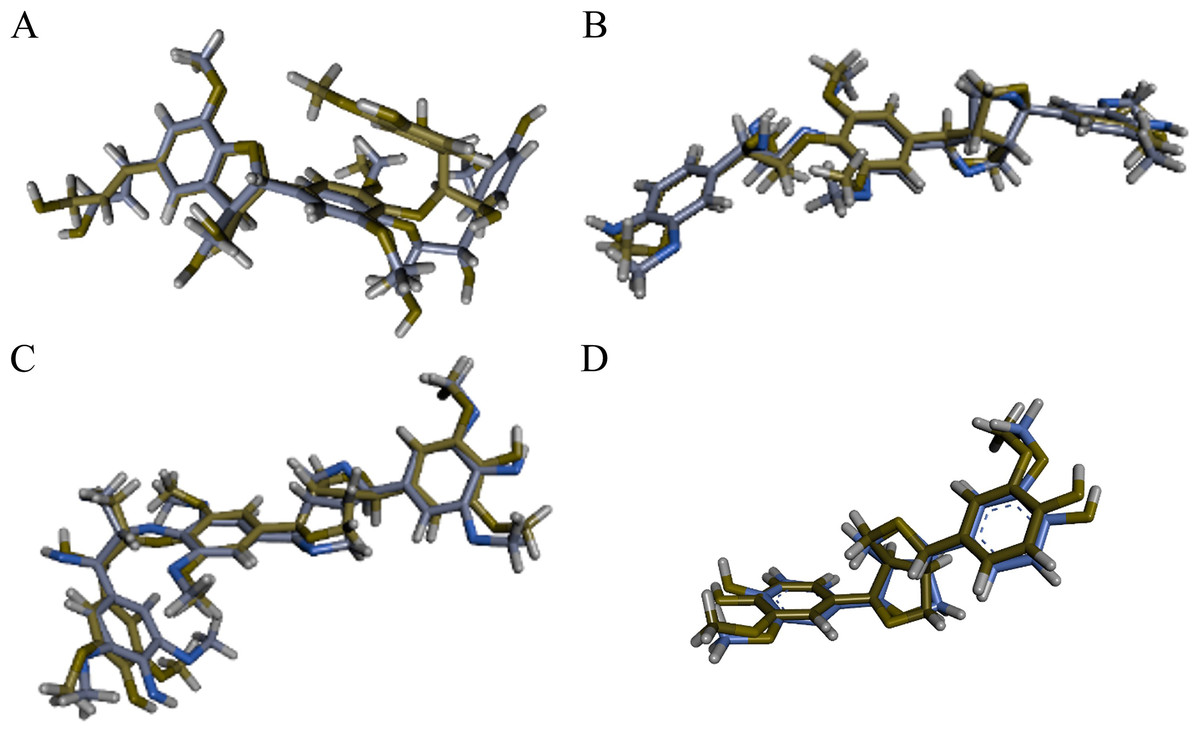
Figure 4: Superposition of the four oligolignols complexed over the cellulose Iβ crystallite model.
For convenience the cellulose Iβ surface is not present in this figure; however, this part of the system was considered in the QM/MM optimization process. The complex conformations obtained from the LAMMPS-ReaxFF-MD are in green carbon-skeleton, and the QM/MM-CAM-B3LYP/cc-pVDZ/Universal Force Field (UFF) are in purple carbon-skeleton. (A) CA_βO4_SA_β5_CA trilignol, (B) CA_βO4_SA_ββ_SA trilignol, (C) SA_βO4_SA_ββ_SA trilignol, and (D) CA_ββ_CA dilignol.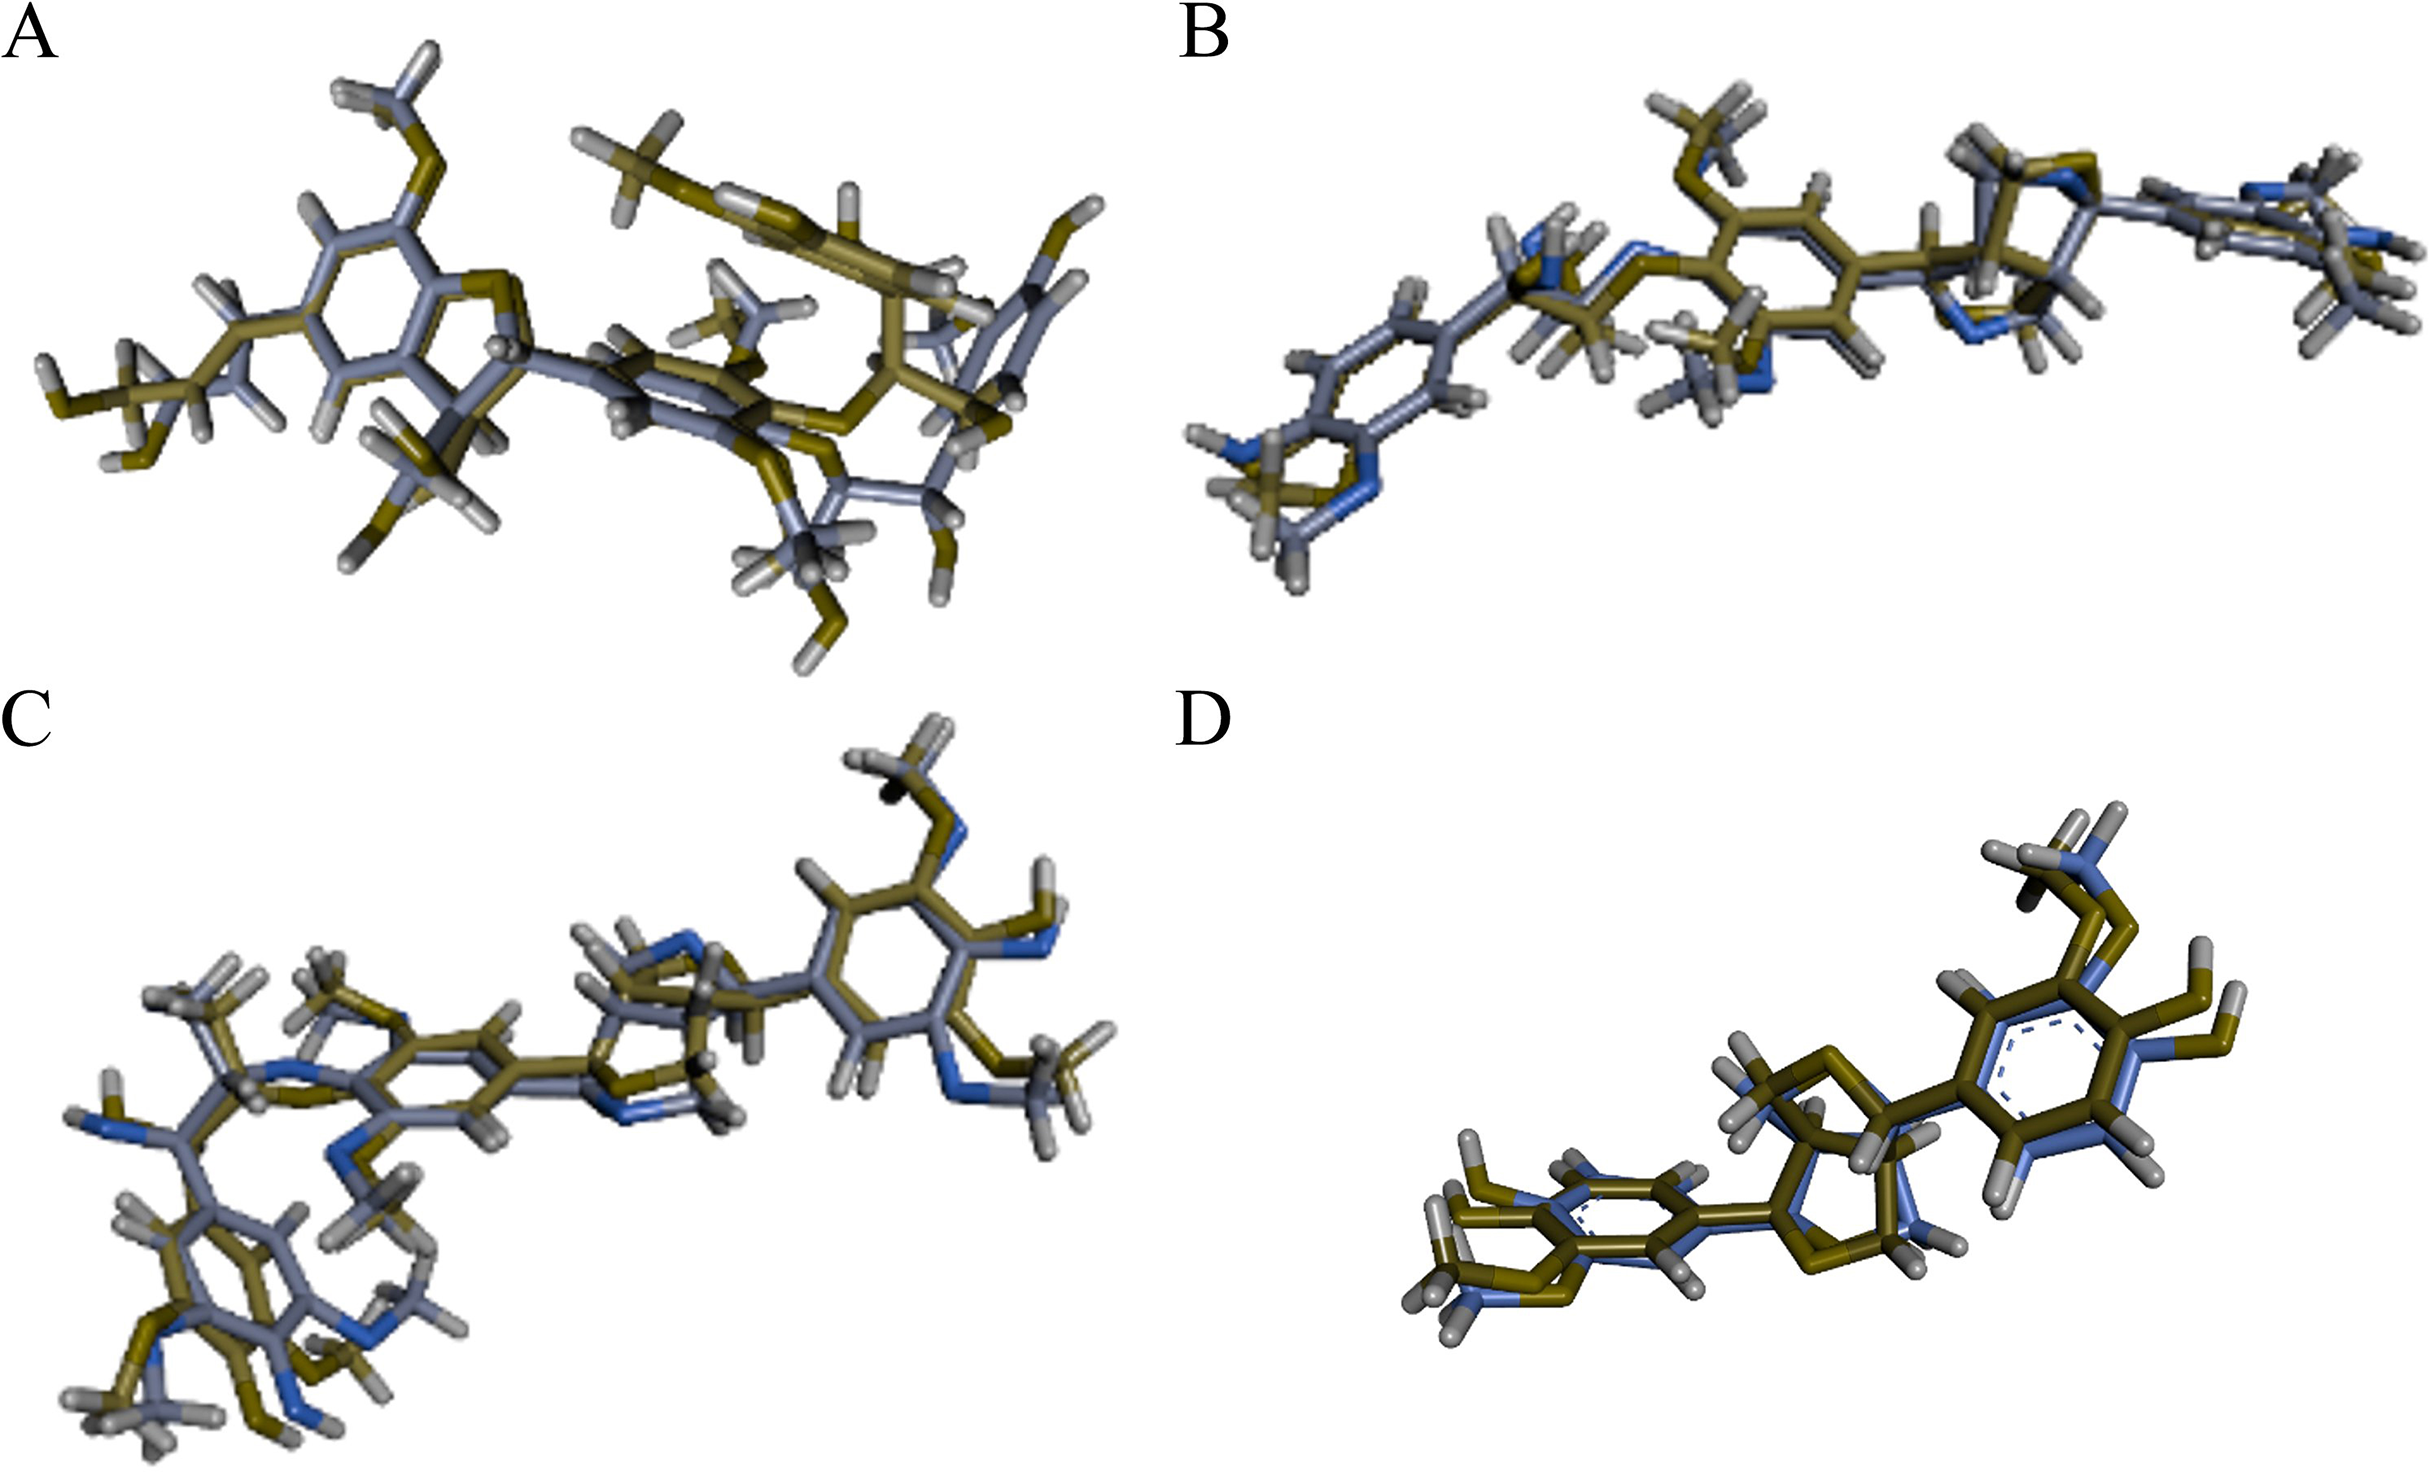
The molecular interactions arising from the adhesion between the cellulose Iβ crystallite model and each energy minimized oligolignol were analyzed using NCI-AIM surfaces to establish relationships between these interactions and the Young’s modulus. The intermolecular interactions are presented in Fig. 5, with only QM regions displayed. The localization of the NCIs through the surfaces was related to the reduced gradient density (RGD) plot regions, similar to the approach by Ponnuchamy, Sandak & Sandak (2020). Due to the absence of steric clashes (red isosurfaces), adhesion is promoted by attractive non-covalent interactions (green and blue isosurfaces).
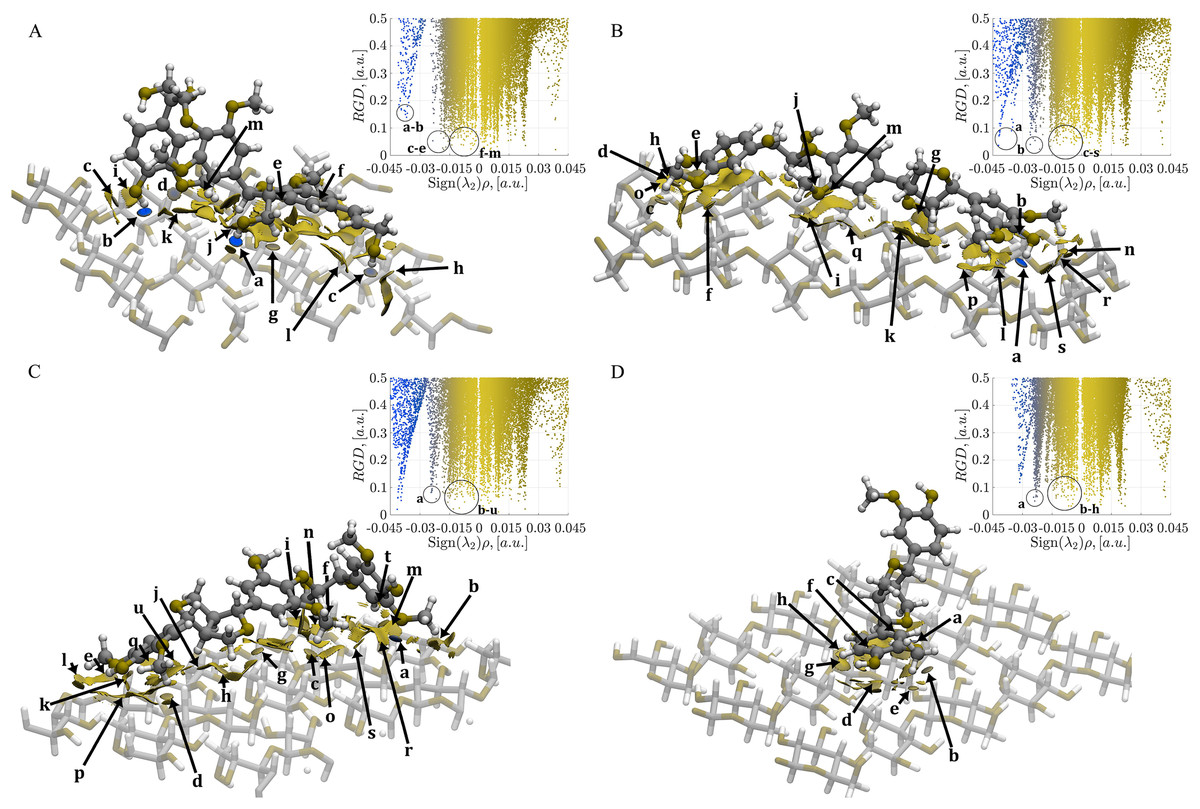
Figure 5: Mapping of the NCI-AIM surfaces and plot of reduced electron density gradient (RDG) against Sign(λ2)ρ.
(A) Complex 1, CA_βO4_SA_β5_CA– cellulose Iβ; (B) Complex 2, CA_βO4_SA_ββ_SA–cellulose Iβ; (C) Complex 3, SA_βO4_SA_ββ_SA–cellulose Iβ; (D) Complex 4, CA_ββ_CA–cellulose Iβ. Blue regions are for hydrogen bonds, green regions for van der Waals. The gradient isosurfaces correspond to a cutoff of 0.5 a.u. Color scale ranging from −0.4 < ρ < 0.4 a.u. The interactions labeled as a–u (if exist) corresponded to the interactions indicated in Tables S1–S4.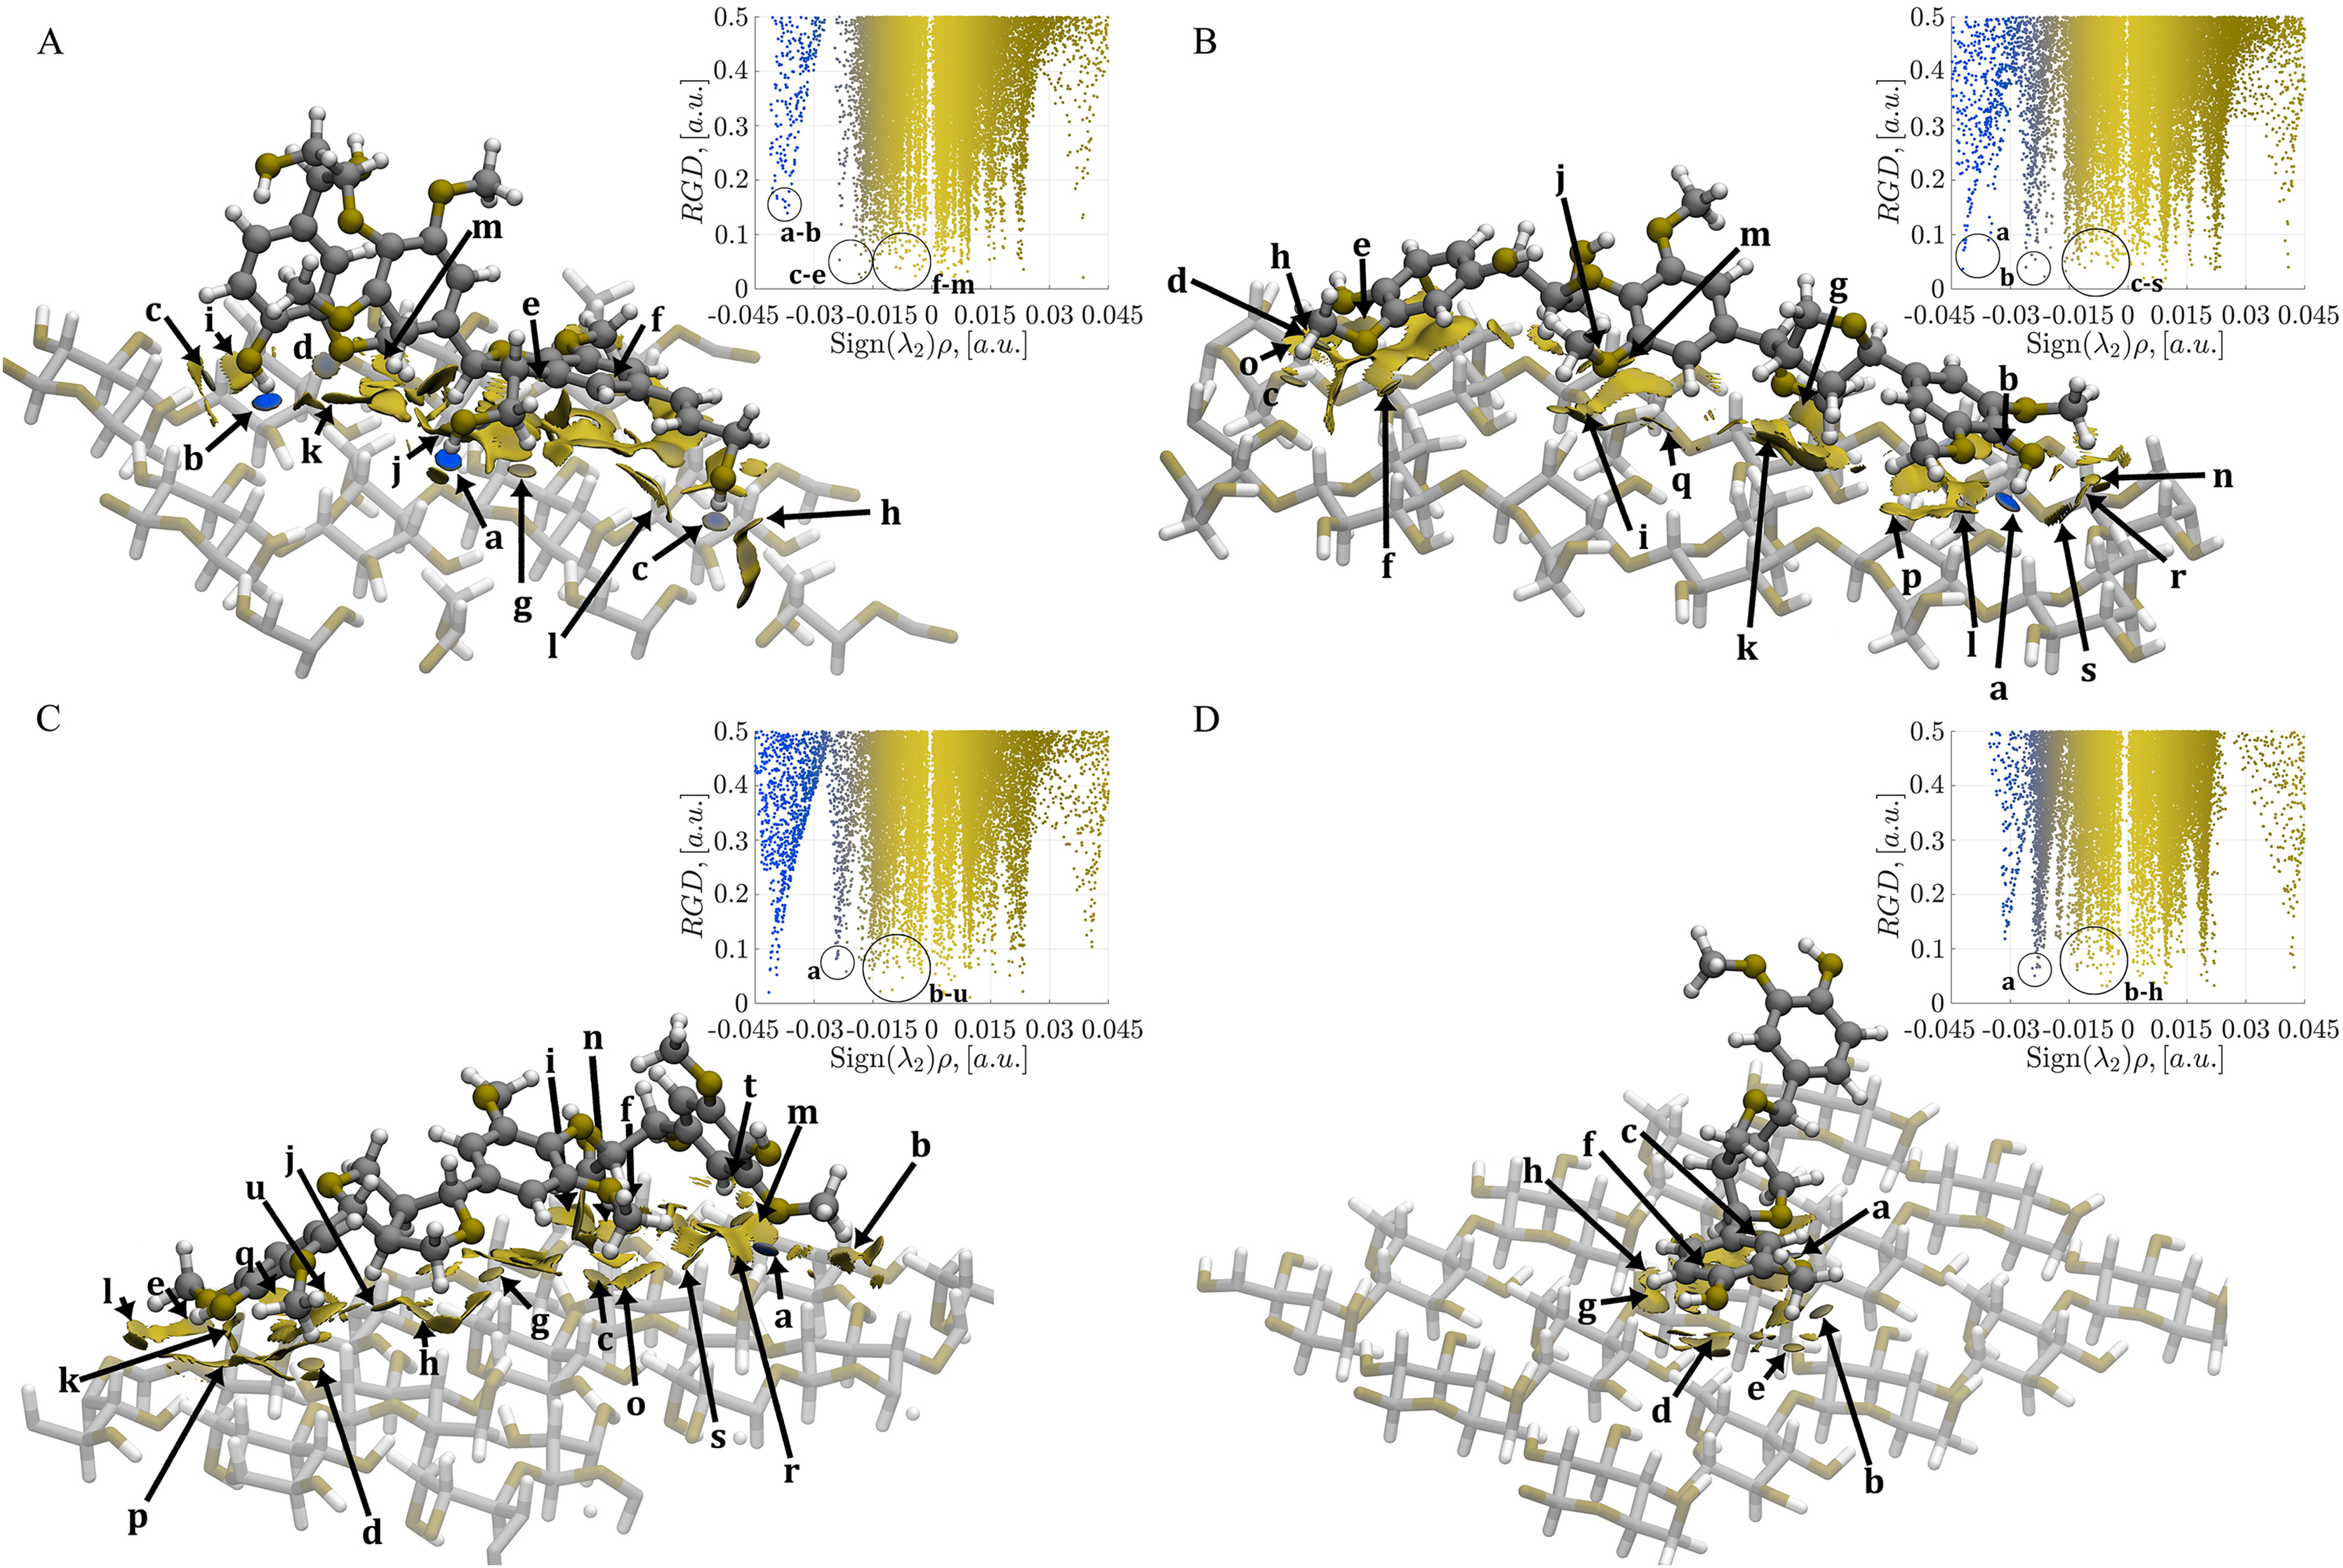
In Fig. 5A, the CA_βO4_SA_β5_CA-cellulose Iβ complex shows strong interactions (blue isosurfaces) labeled as a–d. The system also displays relatively weak interactions with electron density values around 0.011 a.u. (labels e–j). Additionally, there are large green isosurfaces with small electron density values (<0.002 a.u., labeled as l and m). Strong hydrogen bonds labeled as a and b are found in the CA_βO4_SA_ββ_SA-cellulose Iβ complex (Fig. 5B). Moreover, localized contacts (small green isosurfaces related to two atoms) are indicated with c–f, j, m, n and q–s labels. These interactions span a range from ~0.001 to ~0.015 a.u.
In the case of SA_βO4_SA_ββ_SA-cellulose Iβ complex in Fig. 5C, a strong hydrogen bond is noticeable, as indicated by the a label. Localized contacts are indicated with b–d, f, g, k, q, s, t, and u labels in the range of ~0.001 to 0.012 a.u. Interestingly, this number of interactions is similar but weaker than those found in Complex 2. Finally, for the CA_ββ_CA-cellulose Iβ (Fig. 5D), despite the lower number of interactions compared to the previous systems, the localized b, c, and e contacts extend over a narrower but stronger 0.003 a.u. to 0.012 a.u. range compared to the remaining complexes.
Additionally, the AIM approach was used to determine possible (localized) contacts between atoms from oligolignols and atoms from the cellulose surface through bond paths (Lopez-Albarran et al., 2022). These bond paths are displayed in Fig. 6 for each minimized oligolignol-cellulose complex. By analyzing bond paths, a series of hydrogen bonds including O-H···O, C-H···O and Cπ-H···O were found. These hydrogen bonds presented electronic density values between 0.006 and 0.040 a.u., accordingly to the electronic density criterion from Johnson et al. (2010). A detailed analysis of these contacts, including weak interactions, is presented in Tables S1 to S4 in the Supplemental Information.
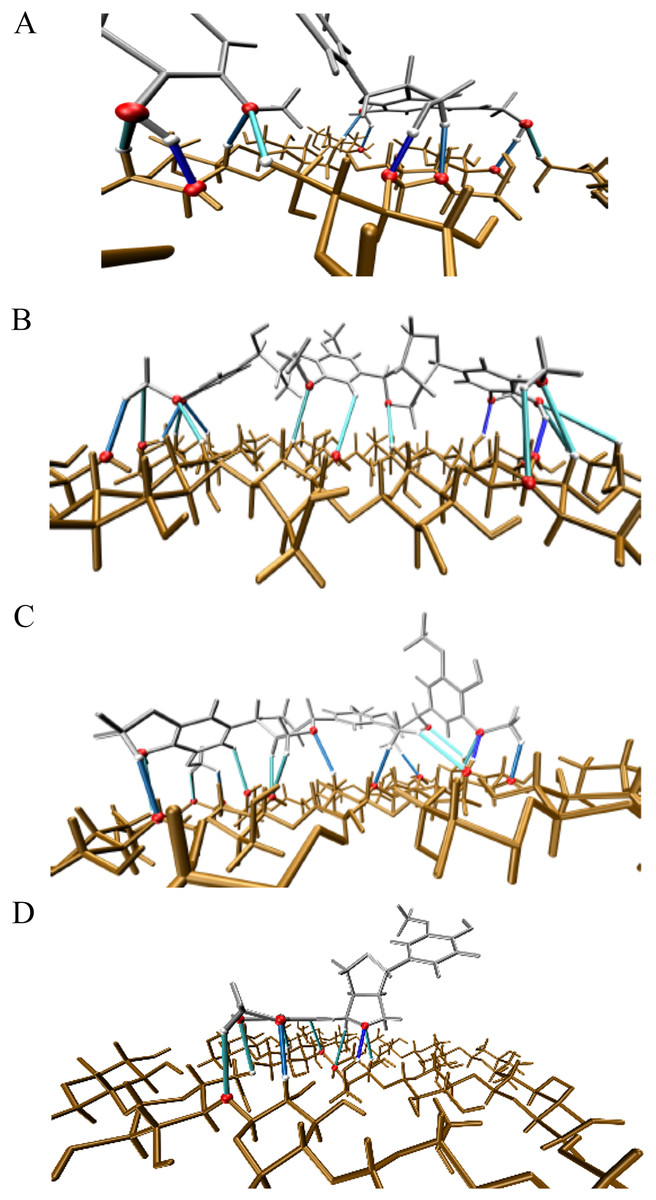
Figure 6: Illustration of the main hydrogen bond based on electronic density isovalues.
ρ(r) ≥ 0.02 in dark blue, 0.01 ≤ ρ(r) < 0.02 in blue and ρ(r) < 0.01 in cyan. Atoms involved in hydrogen bond are highlighted in magenta. (A) Complex 1, CA_βO4_SA_β5_CA – cellulose Iβ; (B) Complex 2, CA_βO4_SA_ββ_SA – cellulose Iβ; (C) Complex 3, SA_βO4_SA_ββ_SA – cellulose Iβ; (D) Complex 4, CA_ββ_CA – cellulose Iβ.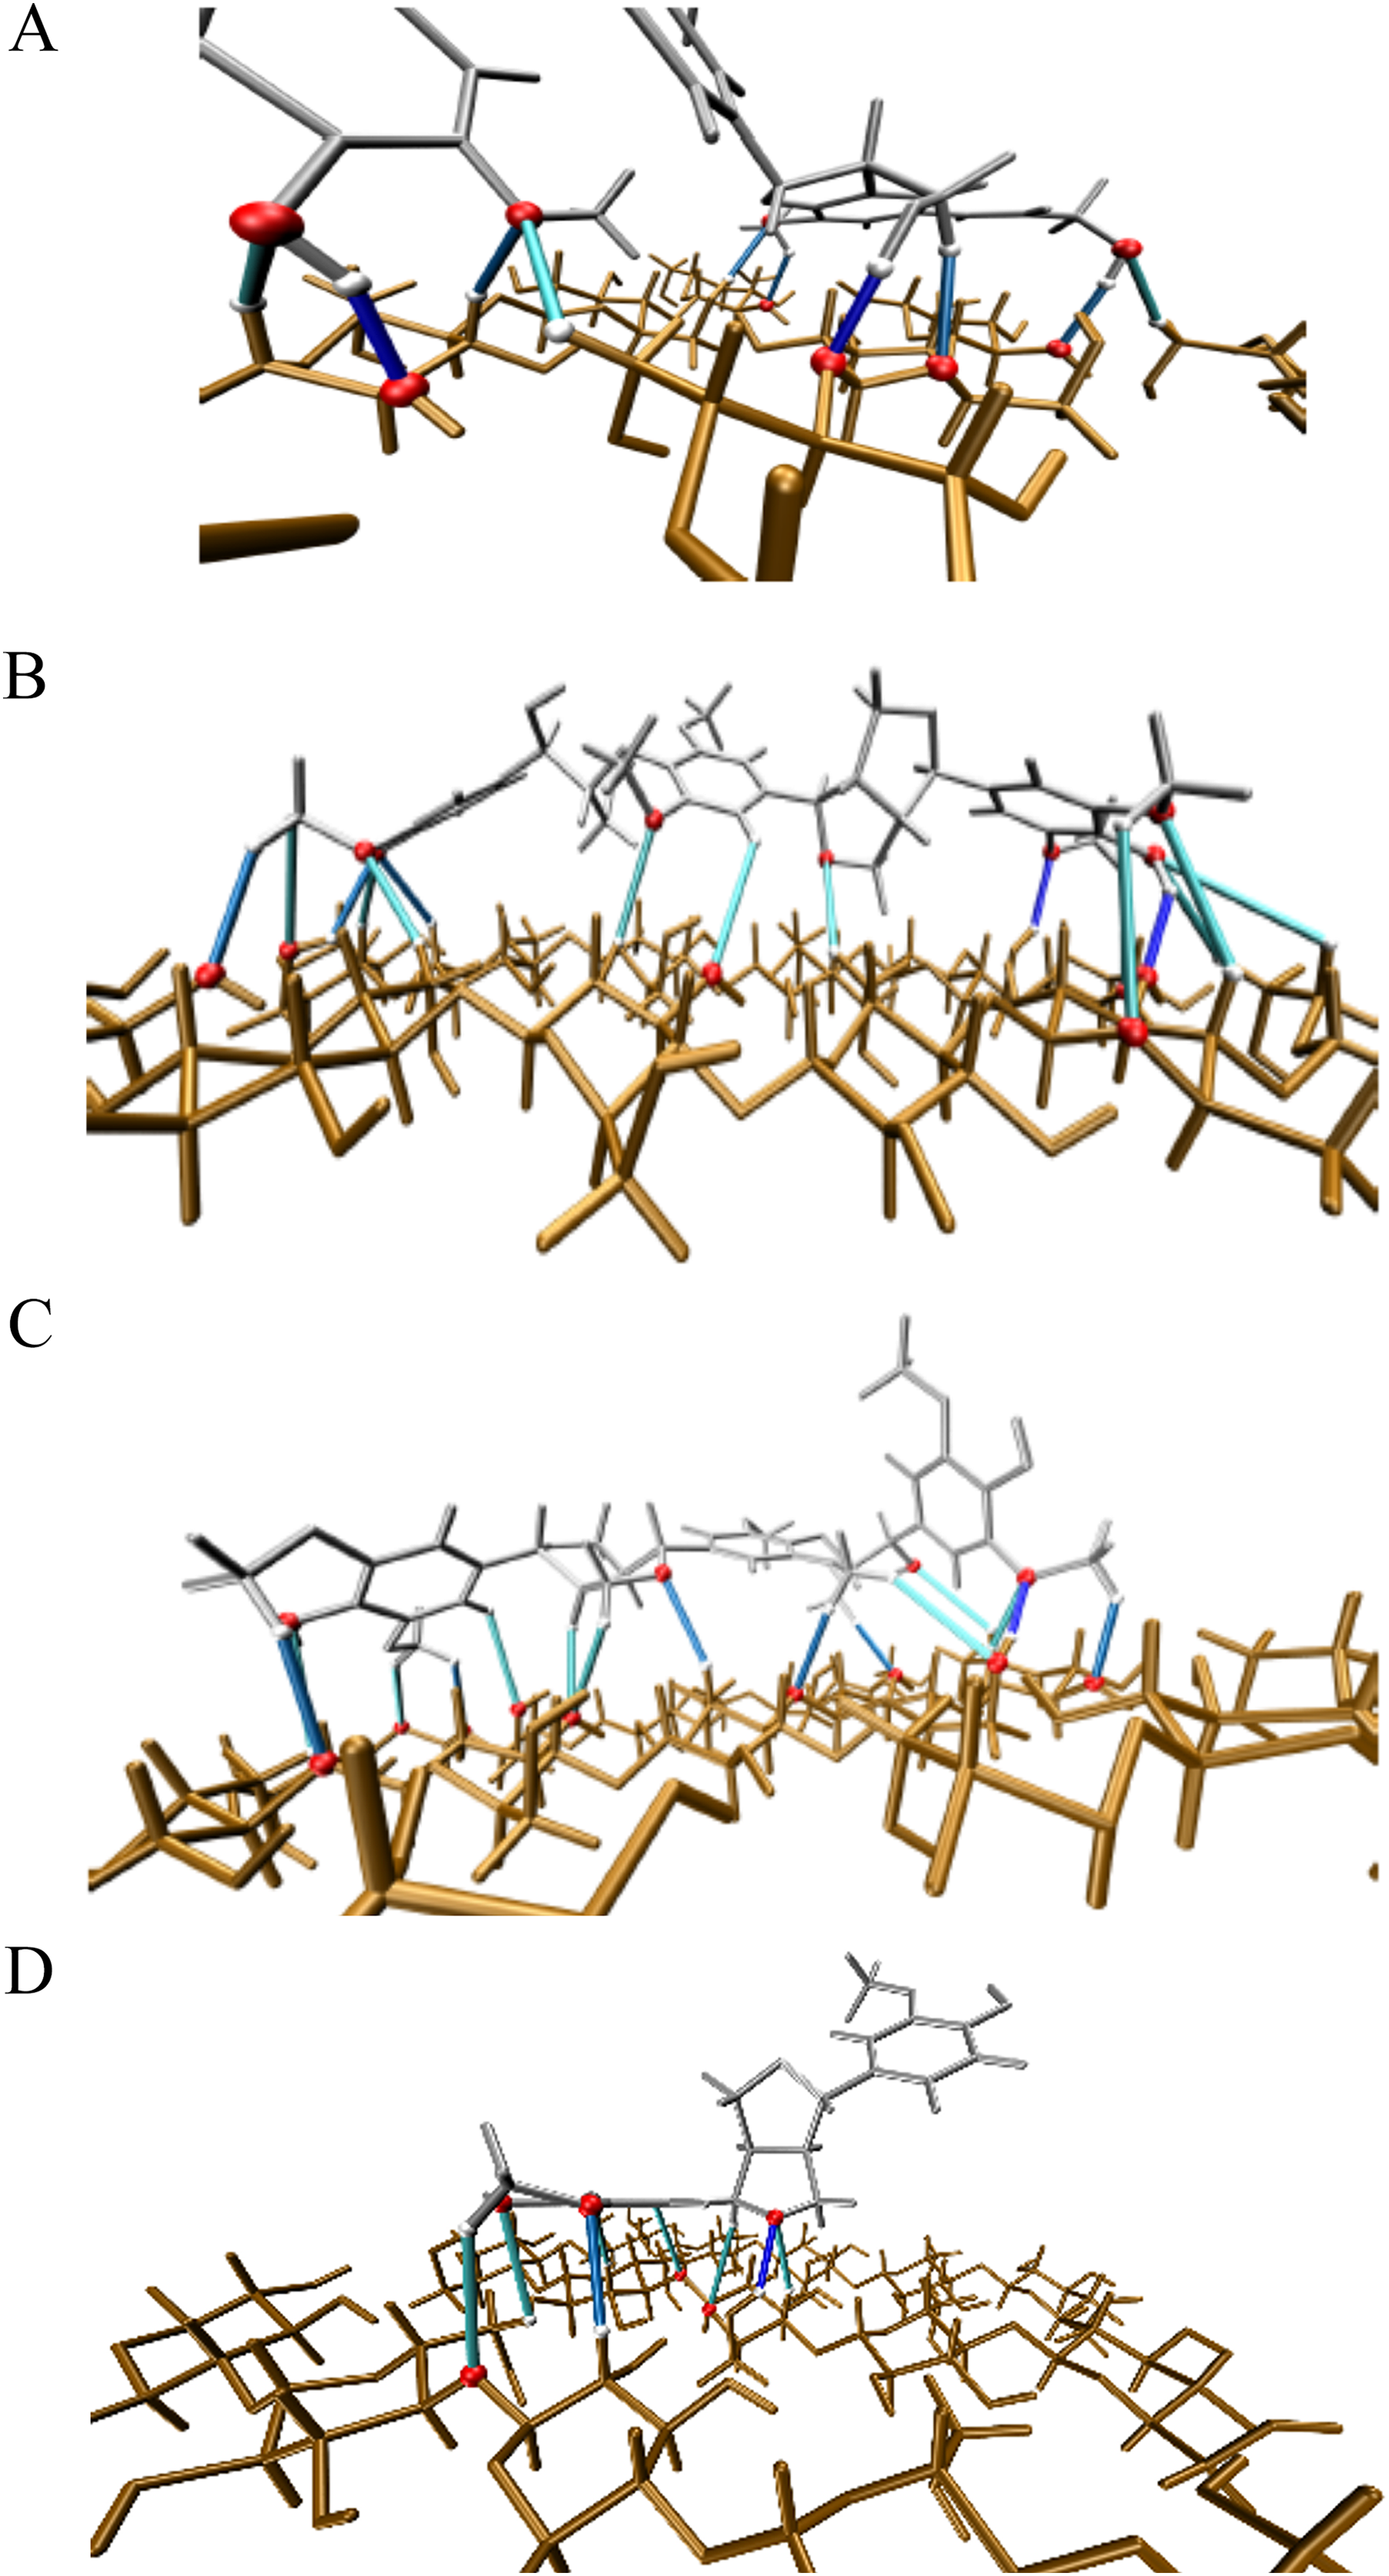
After analyzing the minimum energy conformation, seven additional conformations for each oligolignol-cellulose complex that can be adsorbed onto the cellulose crystallite were studied. These conformations were subjected to molecular interaction analysis based solely on NCI studies to explore the occurrence of such interactions.
Discussion
The adhesion process within each of the four energetically minimized complexes is driven by non-covalent interactions. This is supported by the predominance green zones (indicative of hydrogen bonds) over blue zones (typically labeled as a–d in Fig. 5), between the oligolignol and cellulose fragments. While the strength of these interactions resembles covalent bonding, as observed in previous reports on hydrogen bond stabilizations of DNA base pairs (Jurečka et al., 2006), they are fundamentally non-covalent in nature.
The correlation between values and hydrogen bond binding energies, is well-established (Koch & Popelier, 1995; Navarrete-López, Garza & Vargas, 2007). However, quantifying the individual contribution of each contact to the overall binding energy remains challenging. Additionally, the complexity of the lignin-cellulose interaction, a many-body problem, exceeds the scope of this study and is not fully captured by the QM/MM model. Consequently, direct comparison between QM and ReaxFF-MD binding energies is not feasible.
Notwithstanding these limitations, the non-covalent interaction (NCI) analysis (Fig. 5) and bond paths (Fig. 6) provide valuable insights into the adhesion mechanism. These analyses may reveal correlations between the macroscopic Young’s modulus (YM) values and the specific interactions arising upon cellulose-oligolignol contact. This study endeavors to identify the atomistic interactions of their interconnections that govern the adhesion phenomenon, as measured by YM. Such knowledge will be instrumental in validating the influence of oligolignol composition and guide the development of effective adhesive formulations.
The reported YM values among the four oligolignols from the best tested depolymerized lignin, shown the following order for the optimal adhesion between oligolignols and cellulose Iβ: CA_βO4_SA_ββ_SA (0.3011 MPa) > CA_ββ_CA(0.2988 MPa) > SA_βO4_SA_ββ_SA (0.2093 MPa) > CA_βO4_SA_β5_CA (0.1346 MPa) (Sedano-Mendoza, Lopez-Albarran & Pizzi, 2010). The trilignol with the lowest YM value (CA_βO4_SA_β5_CA), exhibited inefficient adhesion, as elucidated by our NCI-AIM study. This trilignol did not achieved optimal coupling over the cellulose Iβ crystallite model, yielding complexes that do not promote adhesion. One reason may be that the trilignol exhibits folding (see Fig. 5A), reducing localized intermolecular non-covalent interactions. This conformation produces large green isosurfaces related to non-localized contacts. Interestingly, this oligolignol present the strongest hydrogen bonds (a and b interactions located at electron density values of 0.04 and 0.038 a.u., respectively) but also the lowest YM value (0.1346 MPa). In contrast, the CA_βO4_SA_ββ_SA trilignol shows optimal coupling on the cellulose Iβ crystallite, reducing the large isosurfaces and increasing the localized non-covalent interactions (a–s), as shown in Fig. 5B. This combined effect promotes oligolignol adhesion due to the occurrence of several hydrogen bonds and weak interactions towards the cellulose crystallite, see Table S2. It is noteworthy that, despite producing the largest YM value, the CA_βO4_SA_ββ_SA trilignol has weaker hydrogen bonds and a large number of weak interactions compared to those found in Complex 1. Similar coupling is observed for the SA_βO4_SA_ββ_SA–cellulose Iβ complex, shown in Fig. 5C. However, it presents weaker hydrogen bonds and a small number of weak interactions (see Table S3).
Finally, the CA_ββ_CA dilignol achieves efficient adhesion due to its large YM value (Sedano-Mendoza, Lopez-Albarran & Pizzi, 2010). From the NCI-AIM analysis, it was found that this dilignol displays a relatively low number of weak non-covalent interactions; however, they are concentrated in a narrow range, as can be seen from Table S4. Moreover, the dilignol did not show strong hydrogen bonds, as the plot of reduced electron density gradient (RDG) against Sign(λ2)ρ suggests, shown in Fig. 5D. Conversely, experimental and theoretical results from the literature support that the CA_ββ_CA oligolignol is the second-best lignin substructure contributing to the adhesion (Mansouri et al., 2011), as it was the unique substructure capable to coupling more dilignols over the cellulose surface.
The previous analysis suggests that both weak non-covalent interactions and hydrogen bonds likely play a complementary role in mechanical properties such as Young’s modulus. To explore this effect further, a series of interactions were studied from seven additional conformations for each oligolignol-cellulose Iβ, and their respective electron density values were further analyzed, as indicated in the methodology section.
The number and type of molecular interactions between the cellulose Iβ crystallite and each of the 32 oligolignol-cellulose complexes, were reported through the histogram shown in Fig. 7, under the following descriptions: blue columns correspond to the CA_βO4_SA_β5_CA trilignol (Complex 1), green columns represents the CA_βO4_SA_ββ_SA trilignol (Complex 2), yellow columns indicate the SA_βO4_SA_ββ_SA trilignol (Complex 3), and red columns denote the CA_ββ_CA dilignol (Complex 4). The non-covalent interactions found in each complex were classified as indicated above, i.e., adhOH···OCell, adhO···HOCell, adhCH···OCell, adhO···HCCell, adhCπ···HCCell (or adhCπH···OCell), and adhC-HCCell.
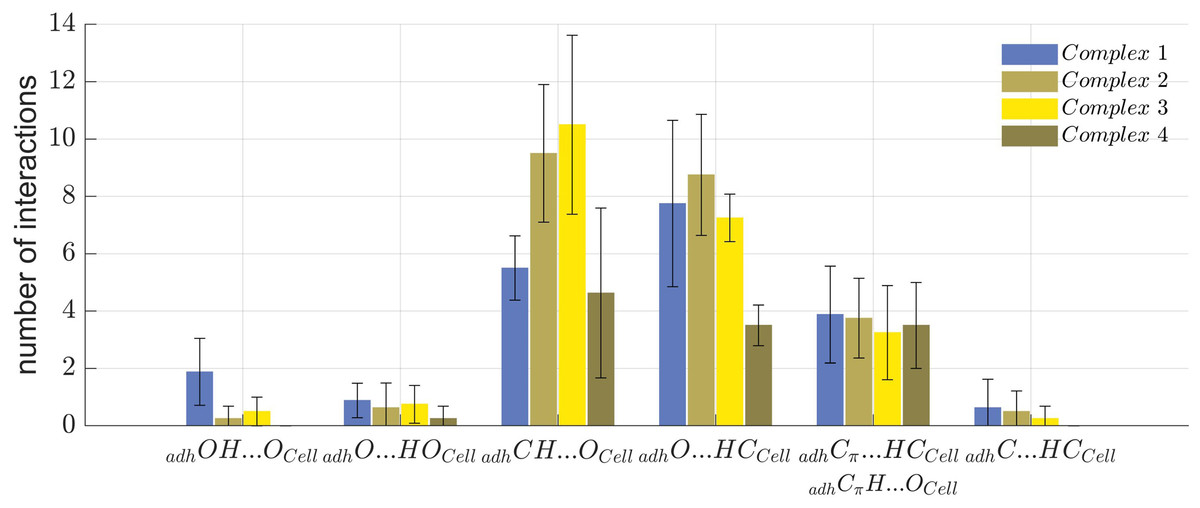
Figure 7: Summary of non-covalent interactions.
Summary of non-covalent interactions found in the four oligolignol-cellulose complexes.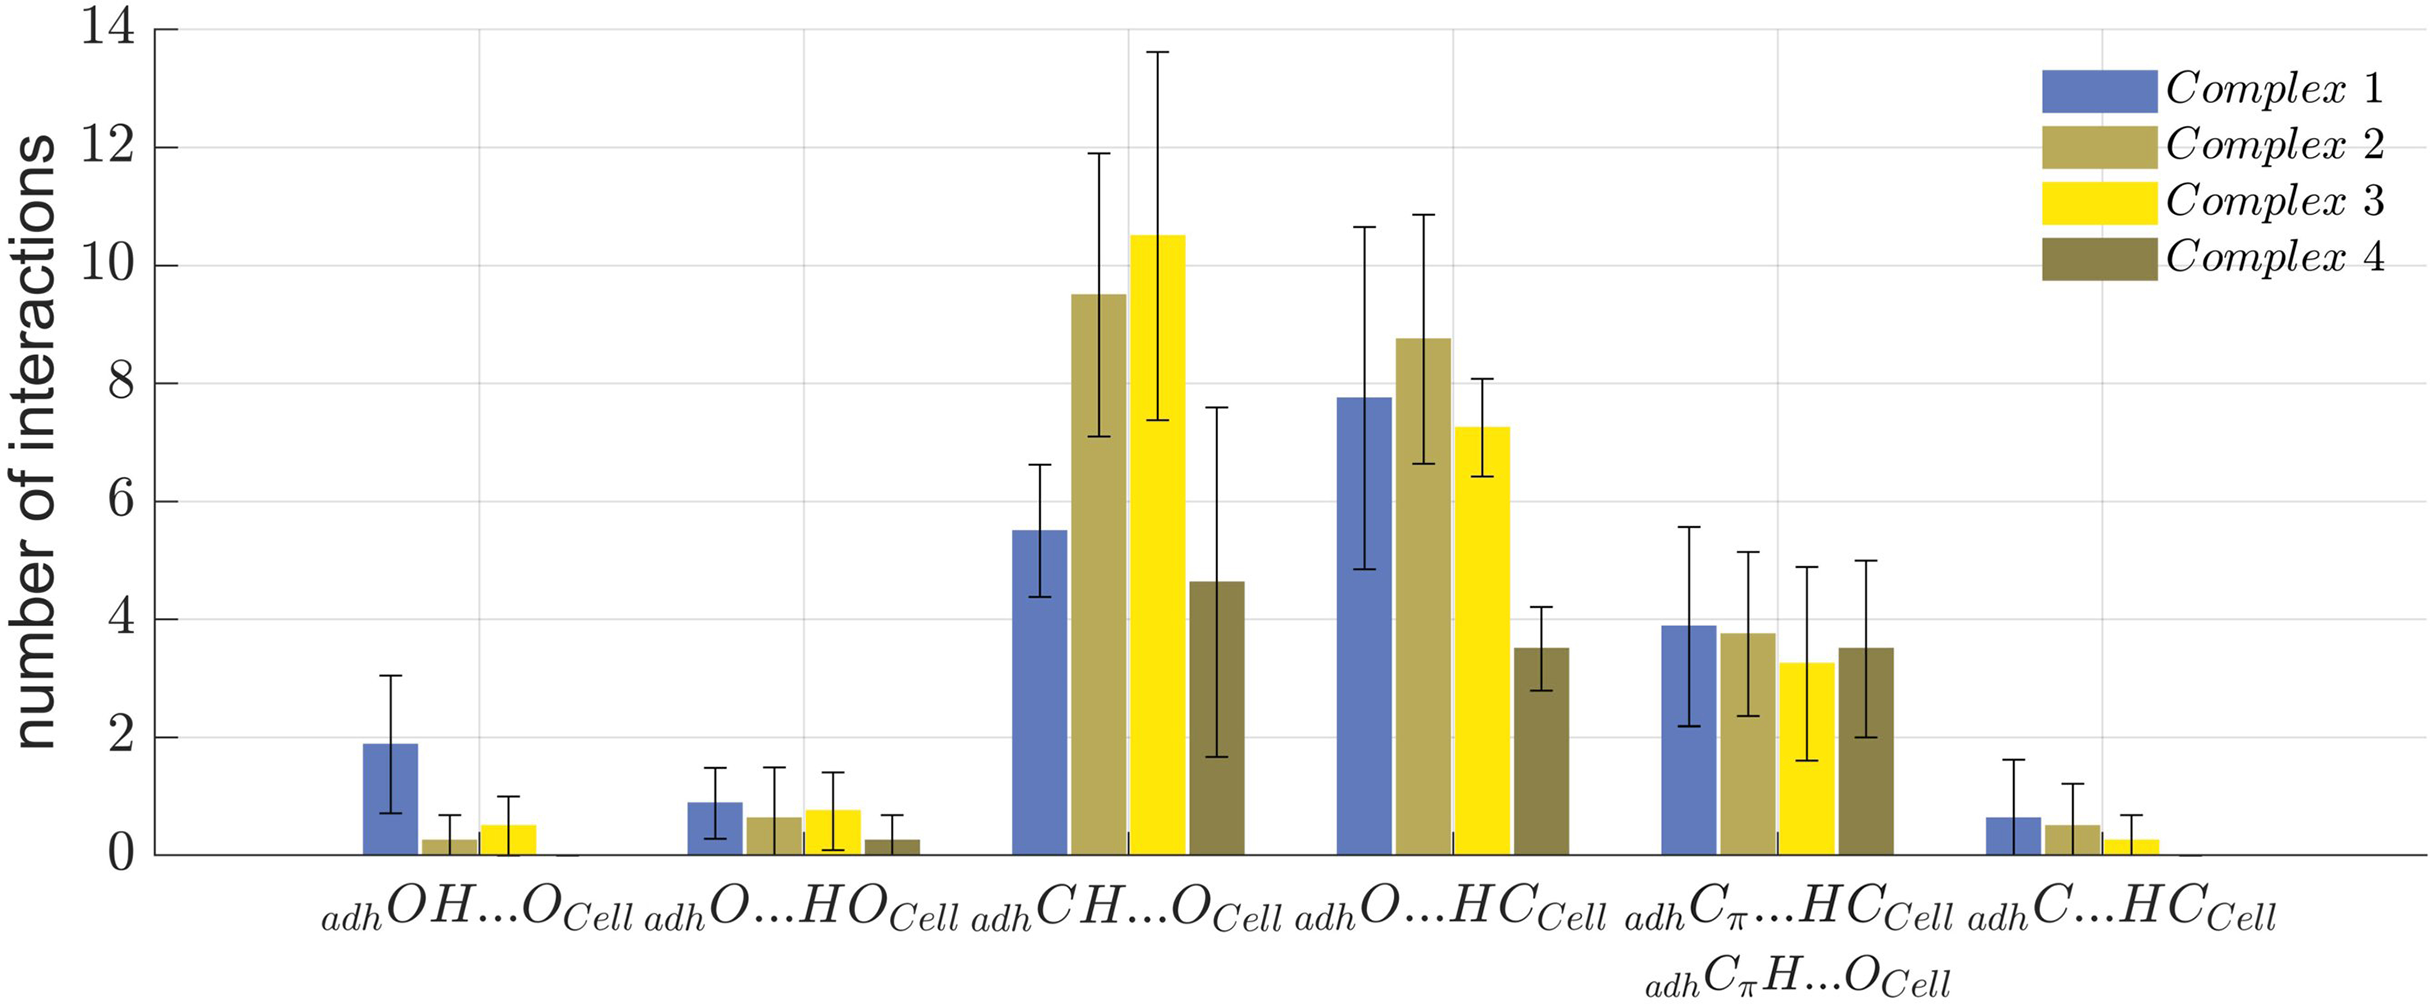
Complexes 2 and 3 exhibited the highest number of interactions. In Complex 3, the predominant interactions were adhCH···OCell hydrogen bonds, whereas Complex 2 showed a prevalence of adhO···HCCell hydrogen bonds. Although Complex 2 (CA_βO4_SA_ββ_SA-cellulose Iβ) averaged only one adhO···HOCell interaction, it also exhibited a higher number of adhCH···OCell interactions, potentially correlating with the largest YM value reported previously (Sedano-Mendoza, Lopez-Albarran & Pizzi, 2010). Non-covalent interactions were more dispersed in Complex 2 compared to Complex 3, which primarily featured methyl hydrogen bonds. Complex 1 shows the highest number of adhOH···OCell interactions, which might be related to its lower YM, as these interactions may impede other weak interactions such as adhCH···OCell that could stabilize the oligolignol on cellulose.
These findings suggest that either a predominance of strong interactions or an overabundance of a particular interaction type can negatively affect the adhesion of oligolignol to cellulose. This effect is less pronounced in Complex 2 and 4, which either lack strong adhOH···OCell and adhO···HOCell interactions or exhibit a balanced distribution of adhCH···OCell, adhO···HCCell, and Cπ interactions. This molecular-level description elucidates which oligolignol promotes adhesion to cellulose, revealing the atomistic interactions within the oligolignol-cellulose complex based on the NCI-AIM study.
Thus, weak interactions such as the adhCH···OCell contact, hold significant relevance in binding oligolignols with cellulose, a phenomenon previously noted in analogous systems (Salazar-Cano et al., 2016; Vargas et al., 2000b, 2000a). This aligns with the findings of several authors (Cintrón, Johnson & French, 2011; Huang et al., 2021), who suggest the important role of weak interactions over strong hydrogen bonds.
As previously established, a direct correlation between either stronger HBs or the quantity of weak interactions and experimental YM values is either relatively weak or not observed, see also Supplemental Information. This suggests a complex interplay between these interactions at the oligolignol-cellulose interface. For instance, the predominance of strong HBs in Complex 1 may promote regions with delocalized interactions, whereas the abundance of localized, predominantly weak interactions in Complex 3, could contribute to a less stable support structure for oligolignols.
To further investigate the impact of individual NCIs on oligolignol adhesion to cellulose, we established causal relationships with experimental YM values. Specifically, we plotted the average electronic density arising from the adhXH···OCell hydrogen bonding interaction (where X represents C, Cπ and O atoms from oligolignols) against the corresponding experimental YM values. This analysis yielded a strong correlation coefficient of determination ( of 0.93 (Fig. 8).
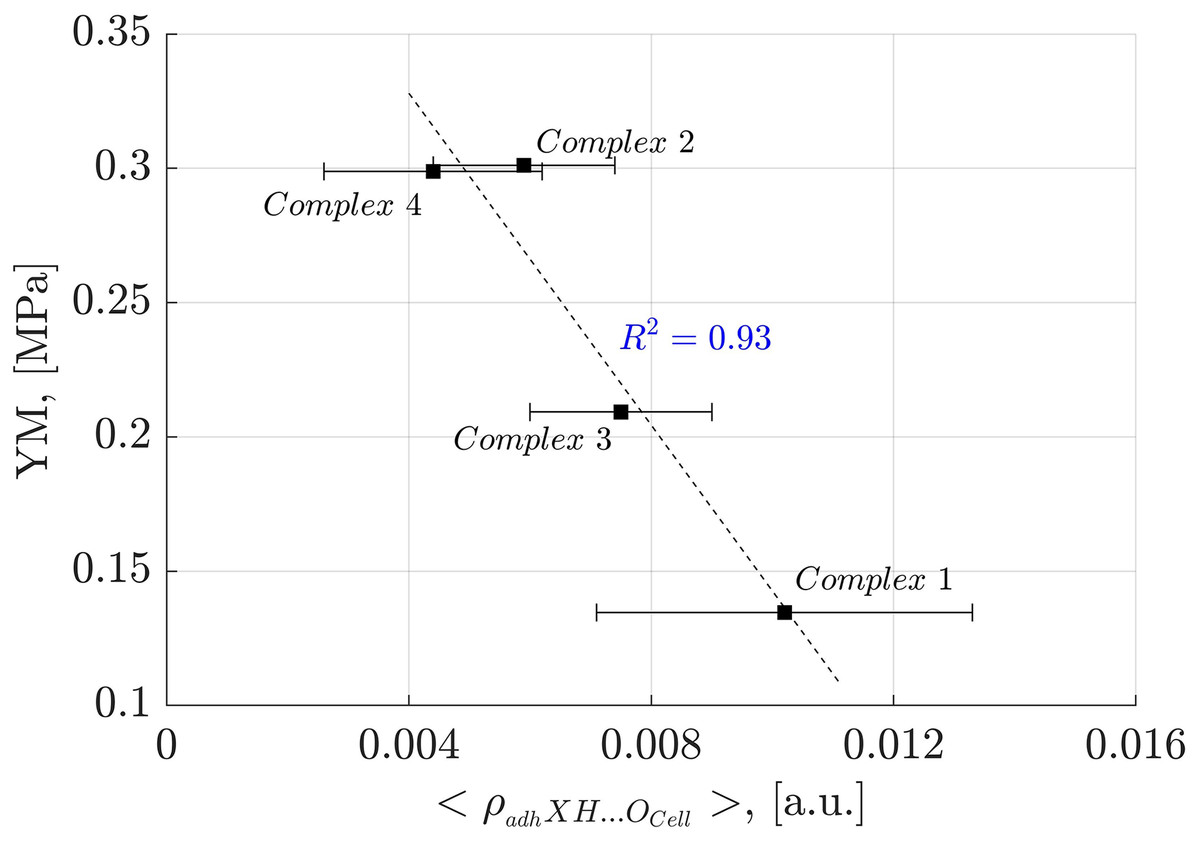
Figure 8: Linear correlation between adhXH···OCell interactions and Young’s modulus.
Correlation between the average electron density of the adhXH···OCell interactions and Young’s modulus for the evaluated complexes. “X” refers to either carbon or oxygen atoms.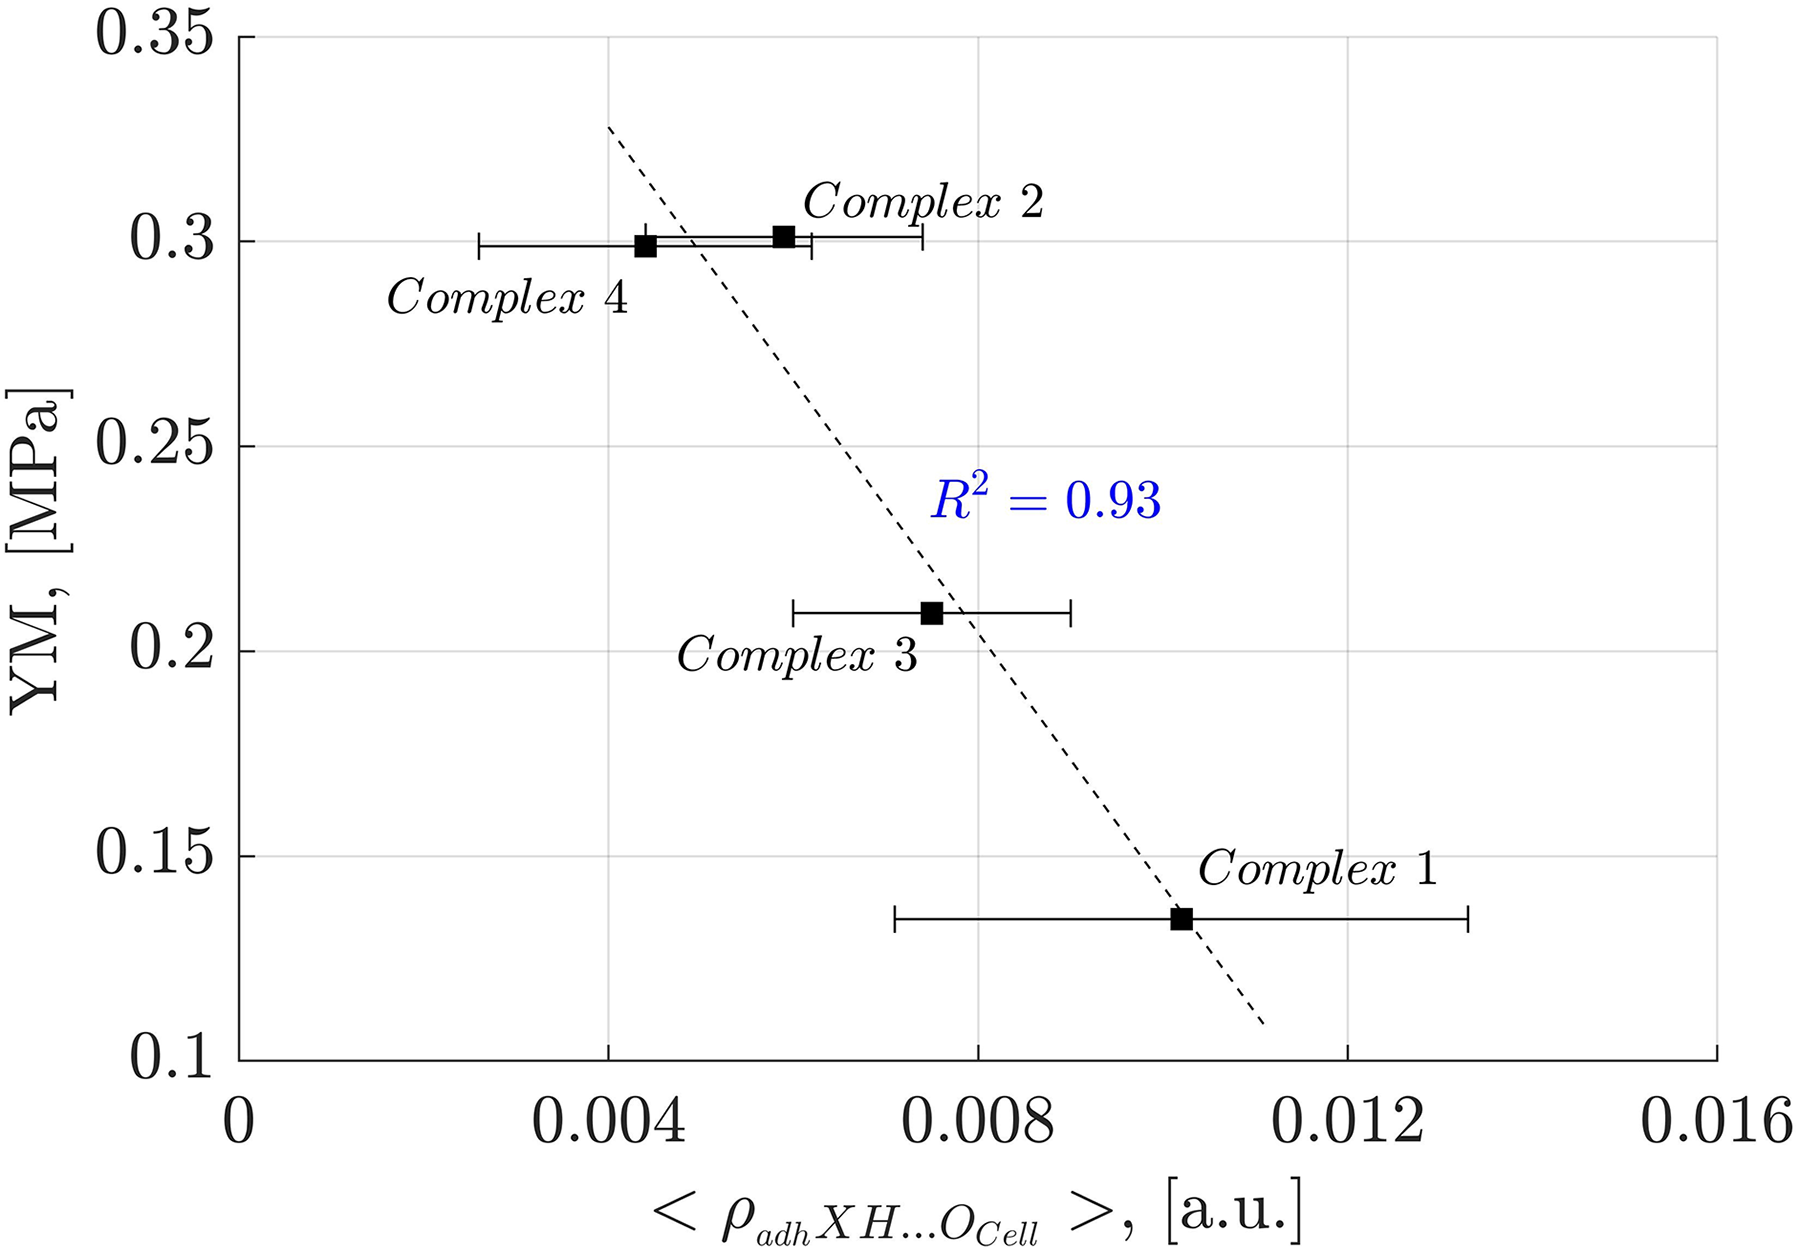
In Fig. 8, it is evident that the larger the average electron density of the adhXH···OCell, the lower the Young’s modulus. Interestingly, the adhXH···OCell interactions observed in Complex 1 and Complex 3 result in larger values of the α angle (Tables S1 and S3). Consequently, the adhesive components must adjust their positions to establish these particular adhXH···OCell interactions, potentially promoting the formation of other crucial interactions. The slope of the observed linear correlation was negative, indicating that these interactions limit the stretchability of the adhesive, resulting in a more rigid state, as suggested by Huang et al. (2021) in their evaluation of mechanical properties of polymers.
The larger electron density associated with the adhXH···OCell interactions, indicating stronger HBs, also inversely correlates with the Young’s modulus ( ), as shown in Supplemental Files. This finding aligns with the observations of Huang et al. (2021) who indicated that the macroscopic YM is directly correlated to the HBs of moderate binding energies, as stronger HBs negatively affects adhesion properties. This inverse relationship between strong HBs and YM is also supported by the earlier discussion related to the CA_βO4_SA_β5_CA trilignol.
Analysis of weak interactions provides valuable insights into their role in the YM of diverse materials. In Fig. 9, a correlation is observed between the fraction of the electron density associated with weak interactions (ρ(r) ≤ 0.005 a.u.) and the total electron density in each oligolinol, . While a positive slope is observed, significant deviations in Complex 4 necessitate cautious interpretation. Interestingly, by following the trend of the weak interactions reported in Fig. 9, which suggests that the weak interaction can stabilize the YM due to the positive correlation, an important dependency of the YM was found for the weak/adhXH···OCell ratio, as shown in Fig. 10 ( ). The positive slope of this correlation signifies that increasing this ratio leads to enhanced stability of oligolignol–cellulose Iβ complexes. As weak interactions alone do not correlate with the YM, but the weak/adhXH···OCell ratio does, there must be a balance between these interactions, making the dependency on the weak/adhXH···OCell ratio significant. Interestingly, this particular HB-weak interaction balance was discussed earlier in the previous discussion related to the CA_βO4_SA_ββ_SA trilignol. Overall, these linear correlations represent the first report highlighting the effect of non-covalent interactions on the mechanical parameter YM.
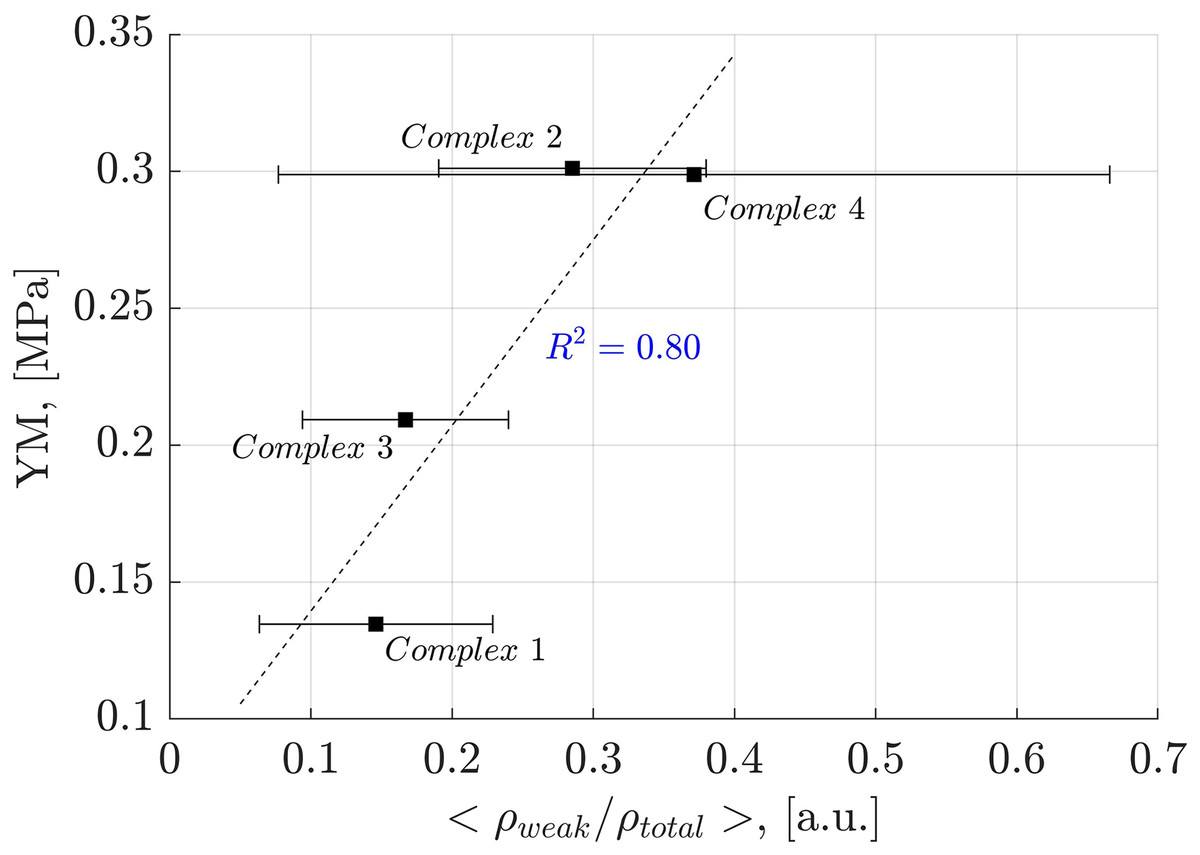
Figure 9: Linear correlation between electron density of the weak interactions-total electron density ratio and Young’s modulus.
Correlation obtained between the electron density of the weak interactions-total electron density ratio and Young’s modulus for the evaluated complexes.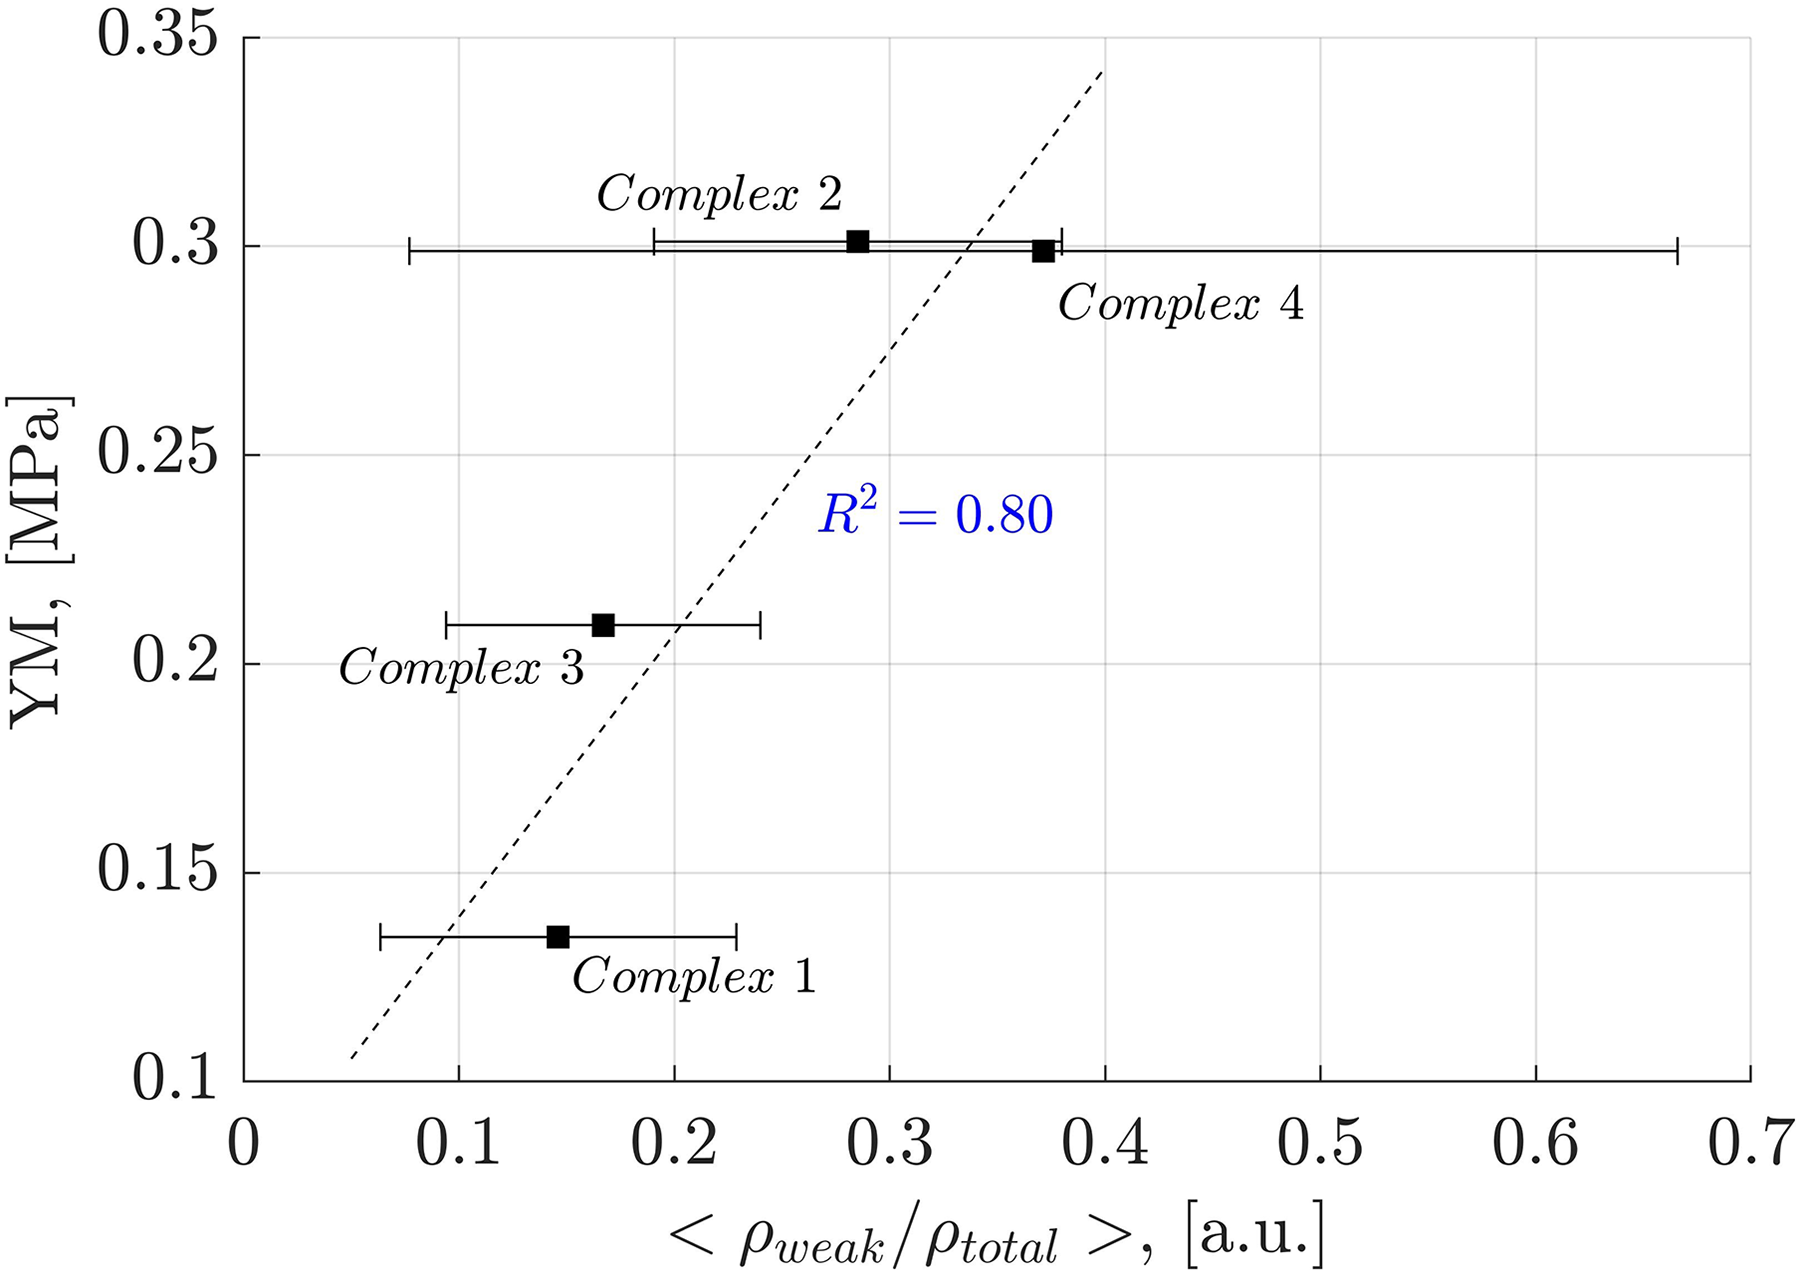
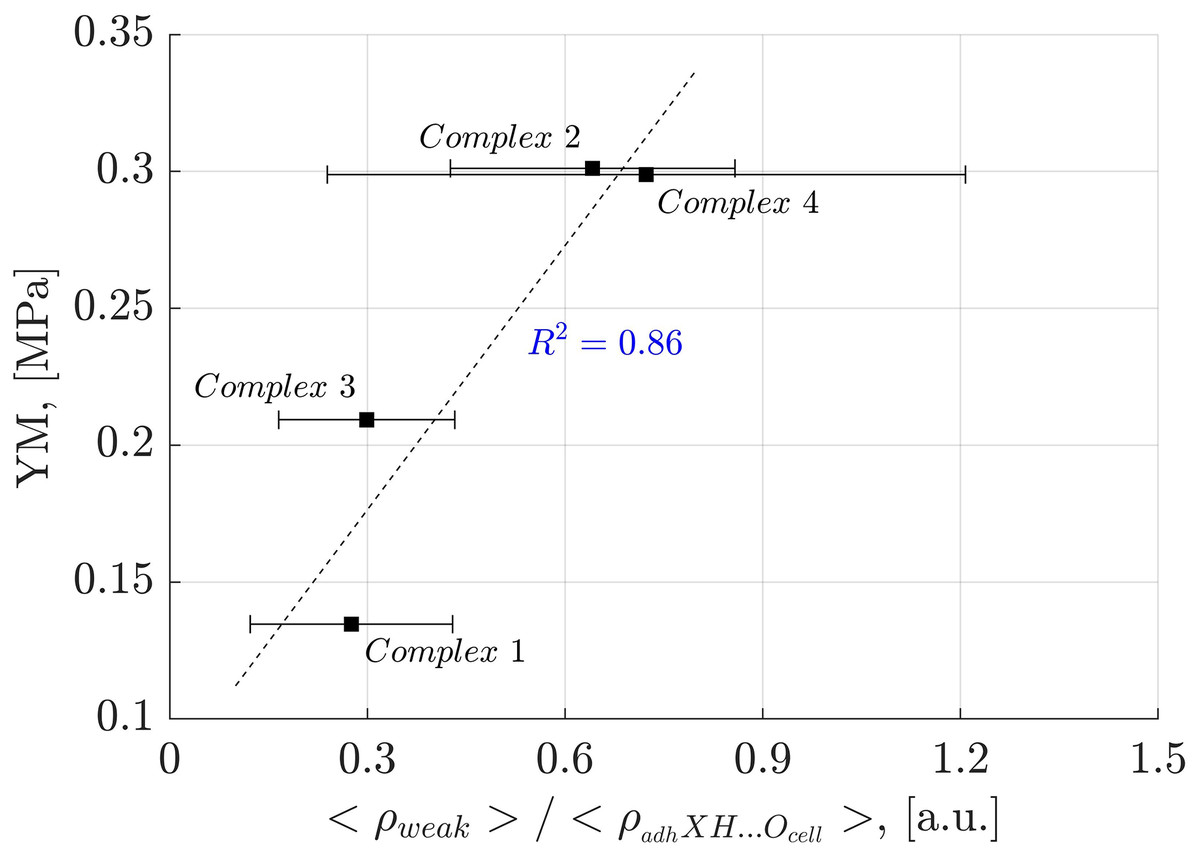
Figure 10: Linear correlation between the electron density of the weak interactions related to the adhXH···OCell interactions and Young’s modulus.
Correlation between the electron density of the weak interactions related to the adhXH···OCell interactions and Young’s modulus for the evaluated complexes.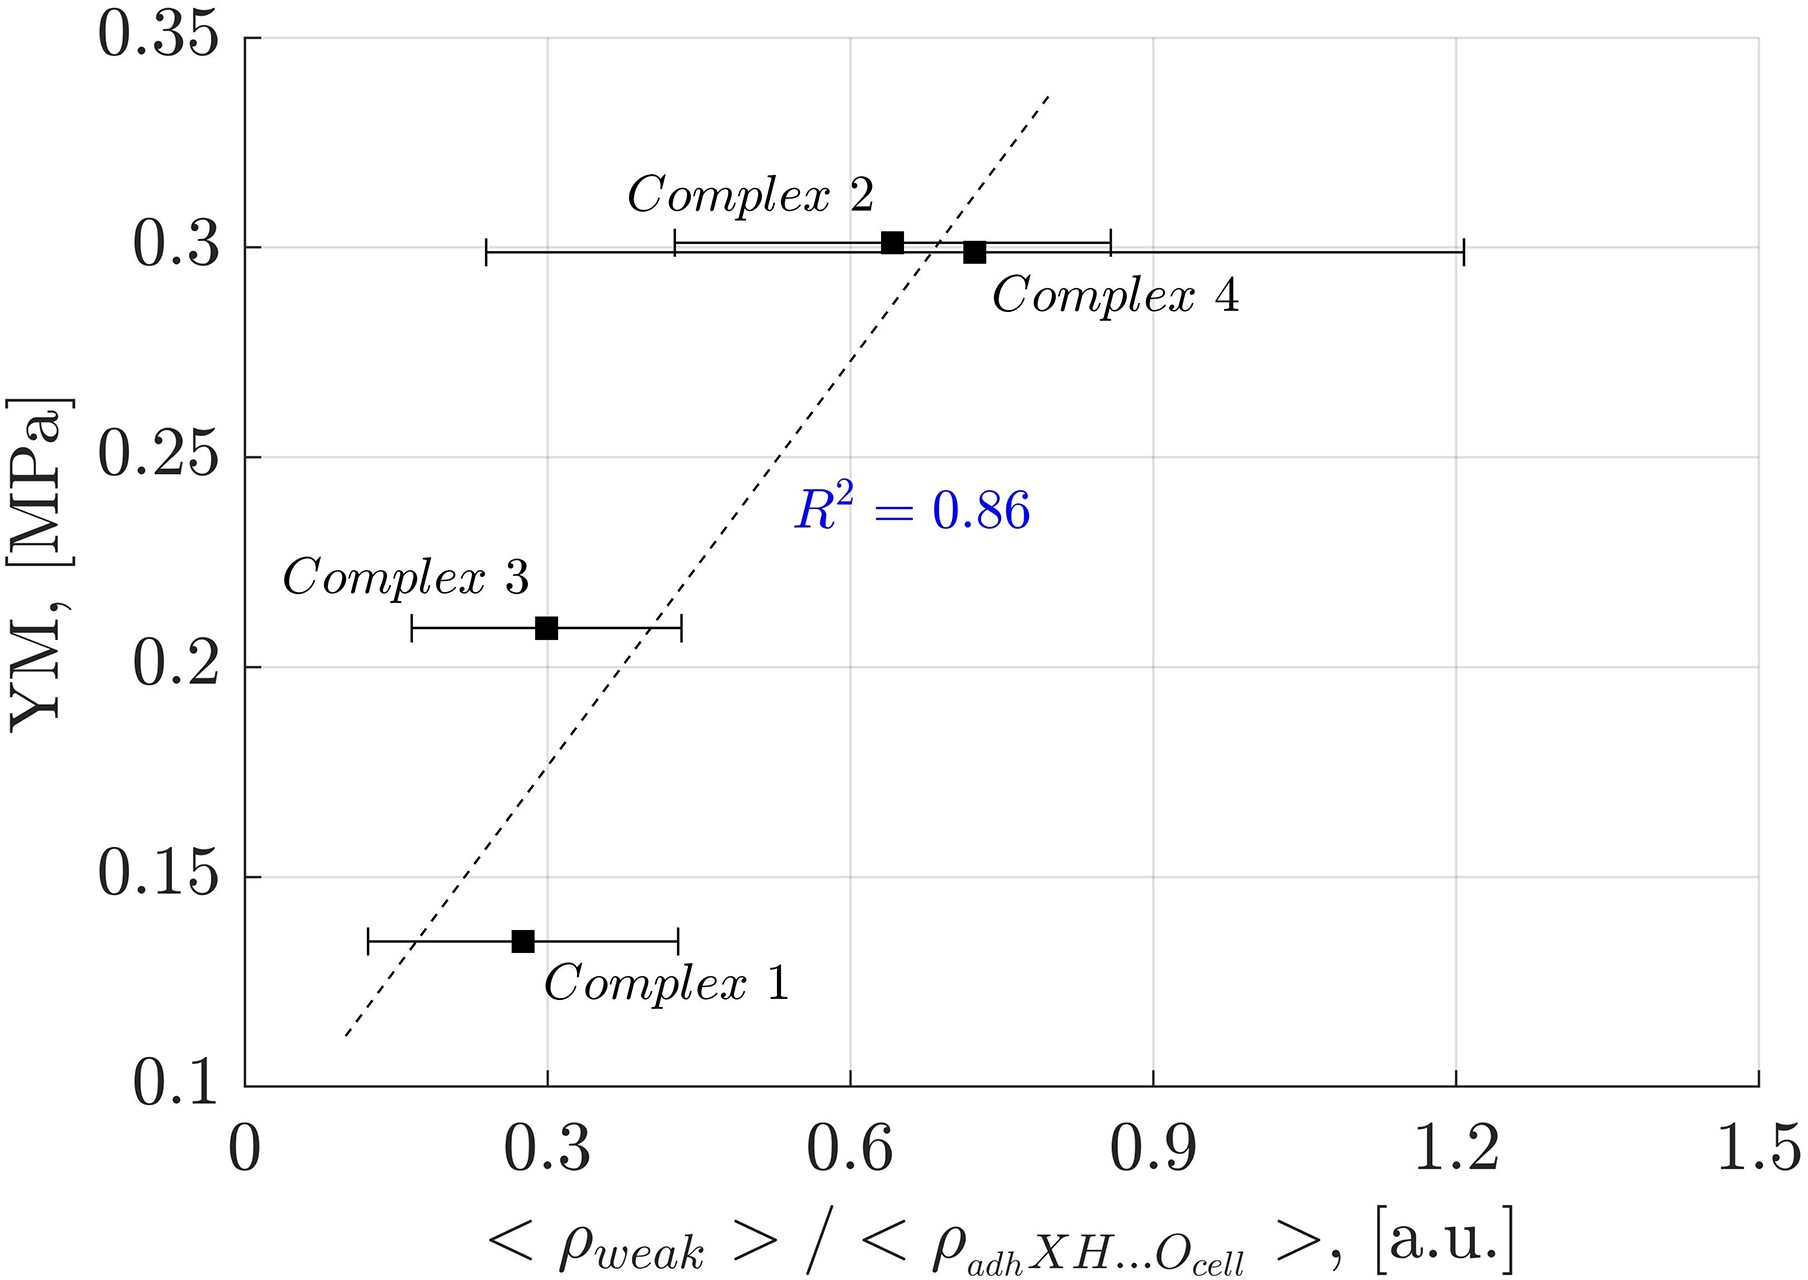
Complex 4 consistently exhibits a larger deviation, as shown in Figs. 9 and 10. This may be attributed the CA_ββ_CA dilignol interacting with cellulose crystallite through one aromatic ring during the minimization step, whereas other selected conformations display both folded and unfolded configurations. This effect is not observed in the other complexes. Interestingly, despite this effect, linear correlations persist, suggesting that HBs and weak interactions must play a complementary role in synthesizing better and environmentally friendly lignin-based adhesives.
It is noteworthy that the adhesion between cellulose and the best depolymerized lignin adhesive-formulation can be elucidate through molecular modeling studies, considering an atomistic point of view, rather than an energetic description, where only one molecule of oligolignol interacts with the cellulose model. However, the experimental data were considered in assays where the solvents (mainly water) were removed by heating until the lignin adhesive formulations reached their Young’s modulus.
Conclusions
Based on the established correlation between molecular dynamic interaction energy and Young’s modulus (López-Albarrán et al., 2017), the trilignol CA_βO4_SA_ββ_SA and the dilignol CA_ββ_CA were identified as the lignin substructures contributing to the adhesion. These oligolignols exhibited favorable non-covalent interactions in this NCI-AIM study. Consequently, the adhesion between lignin-based adhesives and cellulose can be screened from specific non-covalent interactions between oligolignols and the cellulose model.
The coupling of oligolignols such as CA_βO4_SA_β5_CA on the cellulose Iβ surface induces the folding of the trilignol, resulting in extensive green (weak) isosurfaces associated with non-localized interactions. This contrasts with the CA_ββ_CA-cellulose Iβ complex.
Deciphering the precise contribution of each non-covalent interaction to the binding energy is challenging. Nevertheless, to provide insights into this aspect, the roles of various oligolignol-cellulose interactions were described. Notably, CH···O contacts were prevalent, with oligolignols serving as hydrogen atom donors in some instances and cellulose acting as the donor in others. Furthermore, weak interactions such as the CH···O contact played a significant role in binding oligolignols with cellulose. Examining the electron density of the HBs adhXH···OCell and weak interactions revealed their complementary roles in fully describing the adhesive phenomenon. A paradigmatic relationship was observed, the linear correlations established in this study represent the first report demonstrating the influence of non-covalent interactions on the measurable mechanical parameter YM. Our findings indicate that non-covalent interactions control the forces associated to adhesive-cellulose contacts, primarily through CH···O hydrogen bonds, which promote the adhesion of oligolignols on cellulose Iβ. Results indicate that the adhesion strength projected from larger YM values cannot be describe solely by the number of stronger hydrogen bonds nor by the number of the weak interactions but by the entire contributions of specific interactions.
Supplemental Information
Superposition of the complex conformations.
Graphical comparisons between the complex conformations obtained from our ReaxFF-MD study, and the QM/MM study after the geometry optimization.
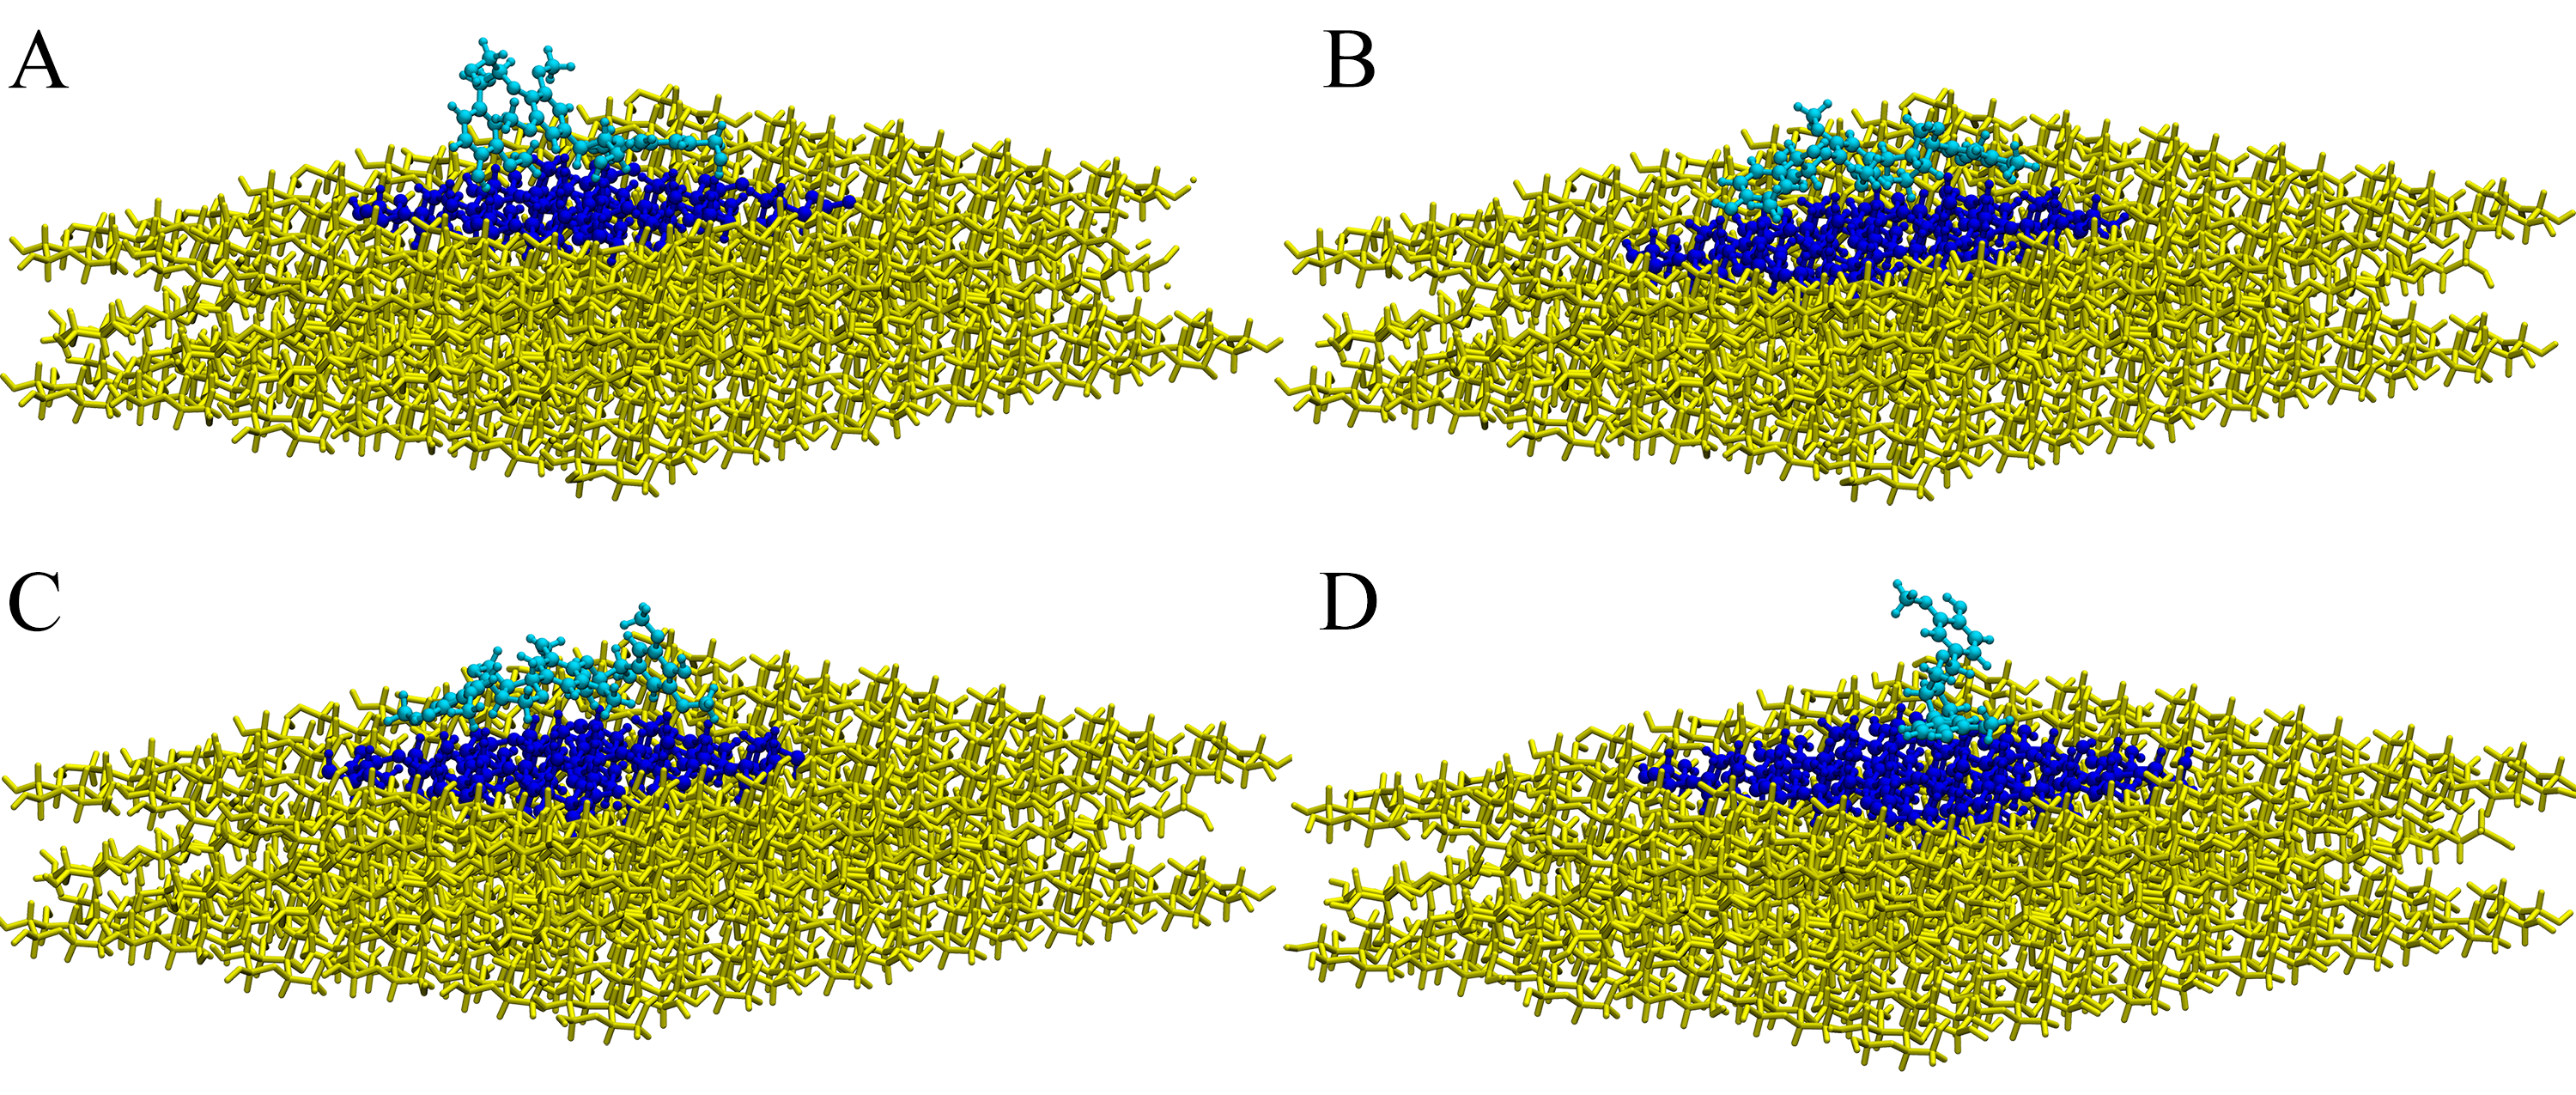
Visualization of the selected QM region.
The complexes structures obtained through the QM/MM ONIOM optimization. Visualization of the selected QM region (blue colors: oligolignol in cyan and cellulose in dark blue) and the MM region (in yellow).
NCI analysis for Complex 1.
Geometric parameters and electronic density values regarding the non-covalent interactions found in the minimized Complex 1 (CA_βO4_SA_β5_CA – cellulose Iβ).
NCI analysis for Complex 2.
Geometric parameters and electronic density values regarding the non-covalent interactions found in the minimized Complex 2 (CA_βO4_SA_ββ_SA – cellulose Iβ)
NCI analysis for Complex 3.
Geometric parameters and electronic density values regarding the non-covalent interactions found in the minimized Complex 3 (SA_βO4_SA_ββ_SA – cellulose Iβ).
NCI analysis for Complex 4.
Geometric parameters and electronic density values regarding the non-covalent interactions found in the minimized Complex 4 (CA_ββ_CA – cellulose Iβ).
Worksheet for the achieved dataset.
Complete dataset for the causal causal relationships