Smart Brix—a continuous evolution framework for container application deployments
- Published
- Accepted
- Received
- Academic Editor
- Elisabetta Di Nitto
- Subject Areas
- Adaptive and Self-Organizing Systems, Distributed and Parallel Computing, Software Engineering
- Keywords
- Containers, Container evolution, Container adaptation, DevOps, Infrastructure as Code
- Copyright
- © 2016 Schleicher et al.
- Licence
- This is an open access article distributed under the terms of the Creative Commons Attribution License, which permits unrestricted use, distribution, reproduction and adaptation in any medium and for any purpose provided that it is properly attributed. For attribution, the original author(s), title, publication source (PeerJ Computer Science) and either DOI or URL of the article must be cited.
- Cite this article
- 2016. Smart Brix—a continuous evolution framework for container application deployments. PeerJ Computer Science 2:e66 https://doi.org/10.7717/peerj-cs.66
Abstract
Container-based application deployments have received significant attention in recent years. Operating system virtualization based on containers as a mechanism to deploy and manage complex, large-scale software systems has become a popular mechanism for application deployment and operation. Packaging application components into self-contained artifacts has brought substantial flexibility to developers and operation teams alike. However, this flexibility comes at a price. Practitioners need to respect numerous constraints ranging from security and compliance requirements, to specific regulatory conditions. Fulfilling these requirements is especially challenging in specialized domains with large numbers of stakeholders. Moreover, the rapidly growing number of container images to be managed due to the introduction of new or updated applications and respective components, leads to significant challenges for container management and adaptation. In this paper, we introduce Smart Brix, a framework for continuous evolution of container application deployments that tackles these challenges. Smart Brix integrates and unifies concepts of continuous integration, runtime monitoring, and operational analytics. Furthermore, it allows practitioners to define generic analytics and compensation pipelines composed of self-assembling processing components to autonomously validate and verify containers to be deployed. We illustrate the feasibility of our approach by evaluating our framework using a case study from the smart city domain. We show that Smart Brix is horizontally scalable and runtime of the implemented analysis and compensation pipelines scales linearly with the number of container application packages.
Introduction
In recent years, we have seen widespread uptake of operating system virtualization based on containers (Soltesz et al., 2007) as a mechanism to deploy and manage complex, large-scale software systems. Using containers, developers create self-contained images of application components along with all dependencies that are then executed in isolation on top of a container runtime (e.g., Docker: https://www.docker.com/, rkt: https://github.com/coreos/rkt, or Triton: https://www.joyent.com/). By packaging application components into self-contained artifacts, developers can ensure that the same artifact is consistently used throughout the complete software release process, from initial testing to the final production deployment. This mechanism for application deployment has become especially popular with practitioners executing projects following DevOps (Hüttermann, 2012) principles. Based on the convergence of development and operations, DevOps advocates a high degree of automation throughout the software development lifecycle (e.g., to implement continuous delivery (Humble & Farley, 2010)), along with an associated focus on deterministic creation, verification, and deployment of application artifacts using Infrastructure as Code (IaC) (Nelson-Smith, 2013) techniques, such as Dockerfiles (https://docs.docker.com/engine/reference/builder/) for containerized applications.
These properties allow for straightforward implementation of immutable infrastructure deployments, as advocated by IaC approaches. Application container images are usually created using a layered structure so that common base functionality can be reused by multiple container images. Application-specific artifacts are layered on top of a base file system so that for subsequent updates only the modified layers need to be transferred among different deployment environments. Container engine vendors such as Docker and CoreOS provide public repositories where practitioners can share and consume container images, both base images for common Linux distributions (e.g., Ubuntu, CoreOS, CentOS, or Alpine) to subsequently add custom functionality, as well as prepared application images that can be directly used in a container deployment. Once uploaded to a repository, a container image is assigned a unique, immutable identifier that can subsequently be used to deterministically deploy the exact same application artifact throughout multiple deployment stages. By deploying each application component in its own container (https://docs.docker.com/engine/articles/dockerfile_best-practices/), practitioners can reliably execute multiple component versions on the same machine without introducing conflicts, as each component is executed in an isolated container.
However, since each container image must contain every runtime dependency of the packaged application component, each of these dependency sets must be maintained separately. This leads to several challenges for practitioners. Over time, the number of active container images grows due to the introduction of new applications, new application components, and updates to existing applications and their components. This growing number of container images inherently leads to a fragmentation of deployed runtime dependencies, making it difficult for operators to ensure that every deployed container continues to adhere to all relevant security, compliance, and regulatory requirements. Whenever, for instance, a severe vulnerability is found in a common runtime dependency, practitioners either have to manually determine if any active container images are affected, or initiate a costly rebuild of all active containers, irrespective of the actual occurrence of the vulnerability. We argue that practitioners need a largely automated way to perform arbitrary analyses on all container images in their deployment infrastructure. Furthermore, a mechanism is required that allows for the enactment of customizable corrective actions on containers that fail to pass the performed analyses. Finally, in order to allow practitioners to deal with the possibly large number of container images, the overall approach should be able to adapt it's deployment to scale out horizontally.
In this paper, we present Smart Brix, a framework for continuous evolution of container applications. Smart Brix integrates and unifies concepts of continuous integration, runtime monitoring, and operational analytics systems. Practitioners are able to define generic analytics and compensation pipelines composed of self-assembling processing components to autonomously validate and verify containers to be deployed. The framework supports both, traditional mechanisms such as integration tests, as well as custom, business-relevant processes, e.g., to implement security or compliance checks. Smart Brix not only manages the initial deployment of application containers, but is also designed to continuously monitor the complete application deployment topology to allow for timely reactions to changes (e.g., in regulatory frameworks or discovered application vulnerabilities). To enact such reactions to changes in the application environment, developers define analytics and compensation pipelines that will autonomously mitigate problems if possible, but are designed with an escalation mechanism that will eventually request human intervention if automated implementation of a change is not possible. To illustrate the feasibility of our approach we evaluate the Smart Brix framework using a case study from the smart city domain. We show that the runtime of the implemented analysis and compensation pipelines scales linearly with the number of analyzed application packages, and that it adds little overhead compared to container acquisition times.
The remainder of this paper is structured as follows. In ‘Motivation’ we present a motivating scenario and relevant design goals for our framework. We present the Smart Brix framework in ‘The Smart Brix Framework,’ along with a detailed discussion of the framework components. In ‘Evaluation’ we evaluate our approach using a case study from the smart city domain. Related work is discussed in ‘Related Work,’ followed by a conclusion and outlook for further research in ‘Conclusion.’

Figure 1: Smart City Loop.
Motivation
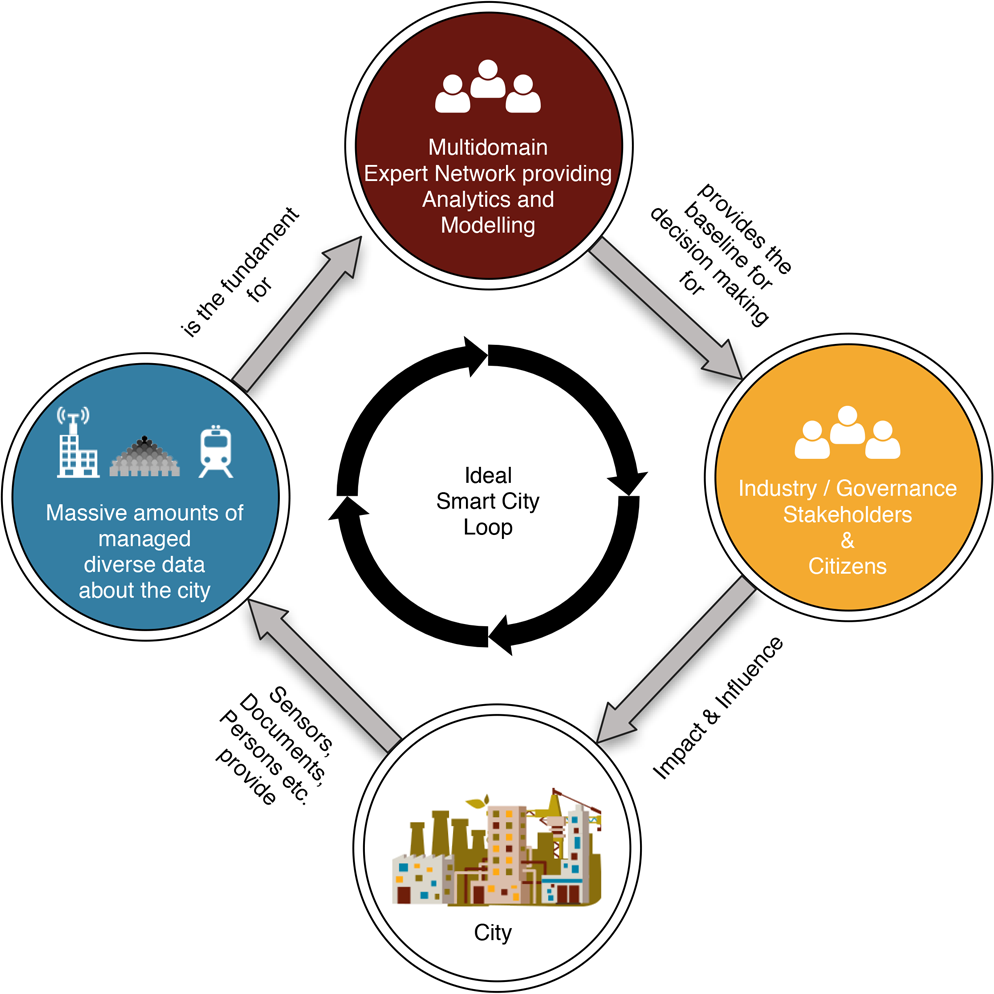
In this paper, we base our discussion on a scenario containing a multi-domain expert network as created within URBEM (http://urbem.tuwien.ac.at), a research initiative of the city of Vienna and TU Wien. To tackle the emerging complexities that arise in the smart city domain, we introduced a novel Smart City Loop (Schleicher et al., 2015b), which is depicted in Fig. 1. This loop outlines a reactive system that enables stakeholders to make informed decisions based on the models and analyses of interdisciplinary domain experts who in turn can access the large amounts of data provided by smart cities. In URBEM, a network consists of experts in the domains of energy, mobility, mathematics, building physics, sociology, as well as urban and regional planning. URBEM aims to provide decision support for industry stakeholders to plan for the future of the city of Vienna and represents a Distributed Analytical Environment (DAE) (Schleicher et al., 2015c).
The experts in this scenario rely on a multitude of different models and analytical approaches to make informed decisions based on the massive amounts of data that are available about the city. In turn, these models rely on a plethora of different tools and environments that lead to complex requirements in terms of providing the right runtime environment for them to operate. The used tools range from modern systems for data analytics and stream processing like Cassandra and Spark, to proprietary tools developed by companies and research institutes with a large variance in specific versions and requirements to run them. Additionally, these domains have to deal with a broad range of different stakeholders and their specific security and compliance requirements. Models sometimes need to tailor their runtime environment to specific technology stacks to ensure compliance or to be able to access the data they need. Managing and satisfying all these requirements is a non-trivial task and a significant factor hindering broader adoption. Therefore, this environment offers an optimal case for the advantages that come with the use of container-based approaches. Operations teams that need to integrate these models no longer need to be concerned with runtime specifics. Experts simply build containers that can be deployed in the heterogenous infrastructures of participating stakeholders.
However, several challenges remain. In URBEM the team of experts with their plethora of different models created over 250 different images that serve as the foundation for running containers. The models in these containers are fueled by data from several different stakeholders in the scenario, ranging from research institutions in the City of Vienna to industry stakeholders in the energy and mobility domain. Each of them mandates a very distinct set of security and compliance requirements that need to be met in order to run them. These requirements in turn are subject to frequent changes and the containers need to be able to evolve along with them. Additionally, even though the container approach provides isolation from the host system it is still vital to ensure that the containers themselves are not compromised. This calls for means to check the systems running inside the container for known vulnerabilities, an issue that is subject to heavy and fast-paced change, again requiring according evolution. A recent study (http://www.banyanops.com/blog/analyzing-docker-hub/) shows that in the case of Docker, depending on the version of the images, more than 70% of the images show potential vulnerabilities, with over 25% of them being severe. This also begs the question of who is responsible for checking and fixing these vulnerabilities, the operations team or the experts who created them? Despite these security and compliance constraints, the ever-changing smart city domain itself makes it necessary for experts to stay on top of the novel toolsets that emerge in order to handle requirements stemming from topics like Big Data or IoT. This leads to a rapid creation and adaptation of models and their according containers, which in turn need be checked against these constraints again. Last but not least, these containers need to comply to certain non-functional requirements that arise from the specific situations they are applied in. This calls for the ability to constantly check containers against certain runtime metrics that need to be met in order to ensure that these systems are able to deliver their excepted results within stakeholder-specific time and resource constraints.
All these factors lead to a complex environment that calls for an ability to easily adapt and evolve containers to their ever-changing requirements. Specifically, we identify the following requirements in the context of our domain:
The ability to check a large amount of heterogenous containers against an open set of evolving requirements. These requirements can be vulnerabilities, compliance constraints, functional tests, or any other metric of interest for the domain.
The ability to mitigate issues and evolve these containers based on the results from the previously mentioned checks.
An approach that is applicable in the context of operations management, while still enabling the participation of experts both for checking as well as evolution.
An approach that can be applied to existing deployments as well as utilized to test new ones.
The Smart Brix Framework
In this section, we introduce the Smart Brix framework for continuos evolution of container-based deployments, which addresses the previously introduced requirements. We start with a framework overview, followed by a detailed description of all framework elements, and conclude with a comprehensive description of our proof of concept implementation including possible deployment variants.
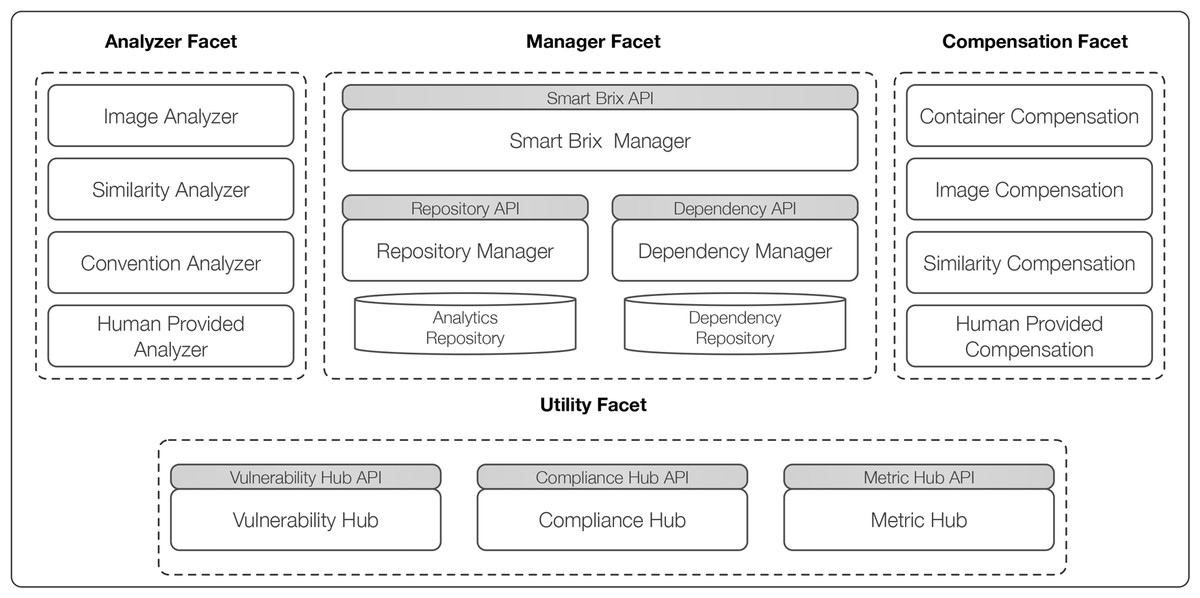
Figure 2: Smart Brix framework overview.
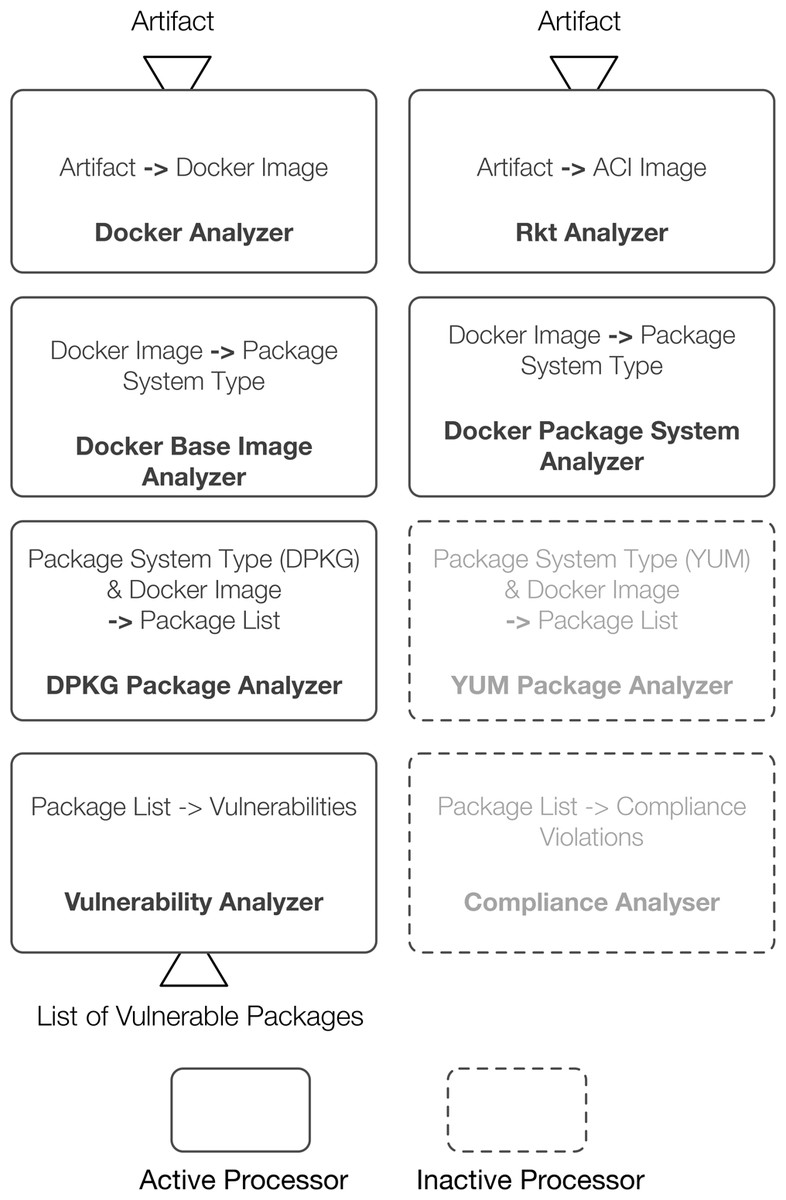
Figure 3: Example of auto assembling processors within the analyzer facet.
Framework rationales
The Smart Brix framework follows the microservice (Newman, 2015) architecture paradigm and an overview of the main framework components is shown in Fig. 2. The framework is logically organized into four main facets, which group areas of responsibility. Each of these facets is composed of multiple components where each of these components represents a microservice. The components in the Analyzer and Compensation Facet are managed as self-assembling omponents (http://techblog.netflix.com/2014/06/building-netflix-playback-with-self.html), an approach we already successfully applied in previous work (Schleicher et al., 2015a). Each of these components follows the Command Pattern (Gamma et al., 1995) and consists of multiple processors that are able to accept multiple inputs and produce exactly one output. This functional approach enables a clean separation of concerns and allows us to decompose complex problems into manageable units.
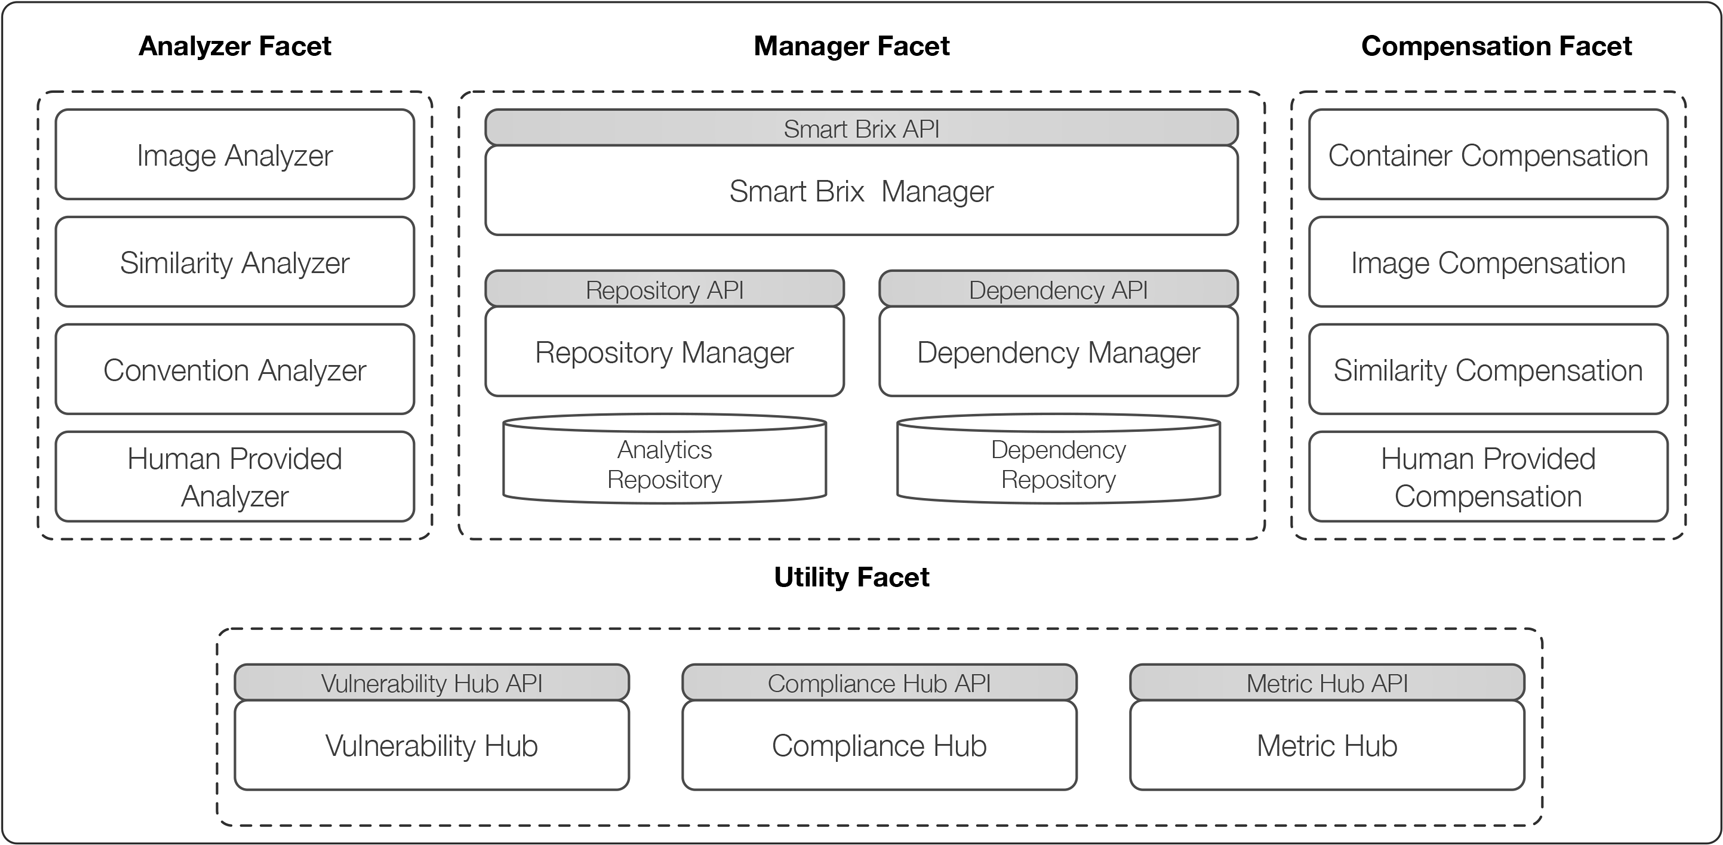
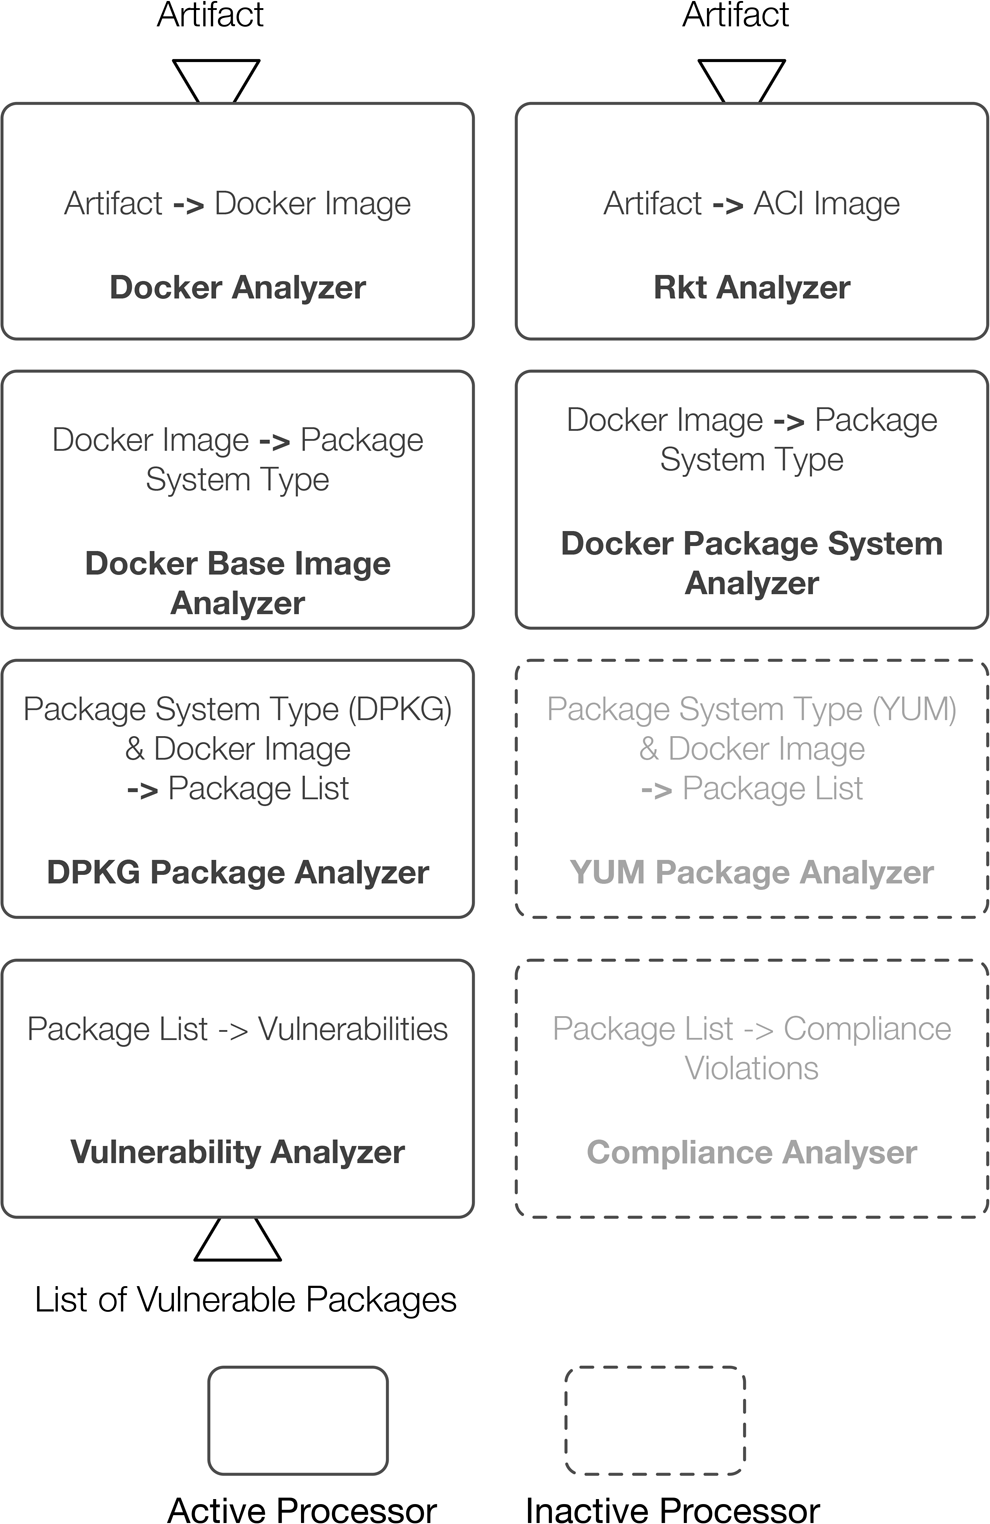
Figure 3 illustrates an example of auto-assembly within the Analyzer facet. We see a set of processors, where each processor is waiting for a specific type of input and clearly specifies the output it produces. The processors use a message-oriented approach to exchange input and output data, where each output and input is persistently available in the message queue and accessible by any processor. In this example we perform an analysis of a custom-built Debian-based container that hosts the Apache HTTPD server. There are two potential processors for the input Artifact, each of them able to handle a different container format. Since in our example the Artifact is a Docker Container, only the Docker Analyzer reacts and produces as output a Docker Image. In the next step there are two active processors, the Docker Base Image Analyzer and the Docker Package System Analyzer, both taking Docker Images as input. Since the Docker Base Image Analyzer cannot determine a base image for the given Docker Image, it produces no output. However, the Docker Package System Analyzer is able to determine that the image uses a DPKG-based package system and produces the according output. Now the DPKG Package Analyzer reacts by taking two inputs, the original Artifact as well as the DPKG output and inspects the Artifact via the DPKG command to produce a Package List. In the last step of this auto-assembly example the Vulnerability Analyzer listens for a Package List and produces a List of Vulnerabilities. This enables a straightforward auto-assembly approach, where connecting previous outputs to desired inputs leads to an automatically assembled complex system consisting of simple manageable processors. A processor itself can be anything and is not bound to any specific functionality, so it can be created completely flexibel depending on the task at hand. This approach further eliminates the necessity of complex composition and organization mechanisms, enabling dynamic and elastic compositions of desired functionality, where processors can be added on demand at runtime. This enables the previously mentioned creation of open and flexible analytics and compensation pipelines based on this principle.
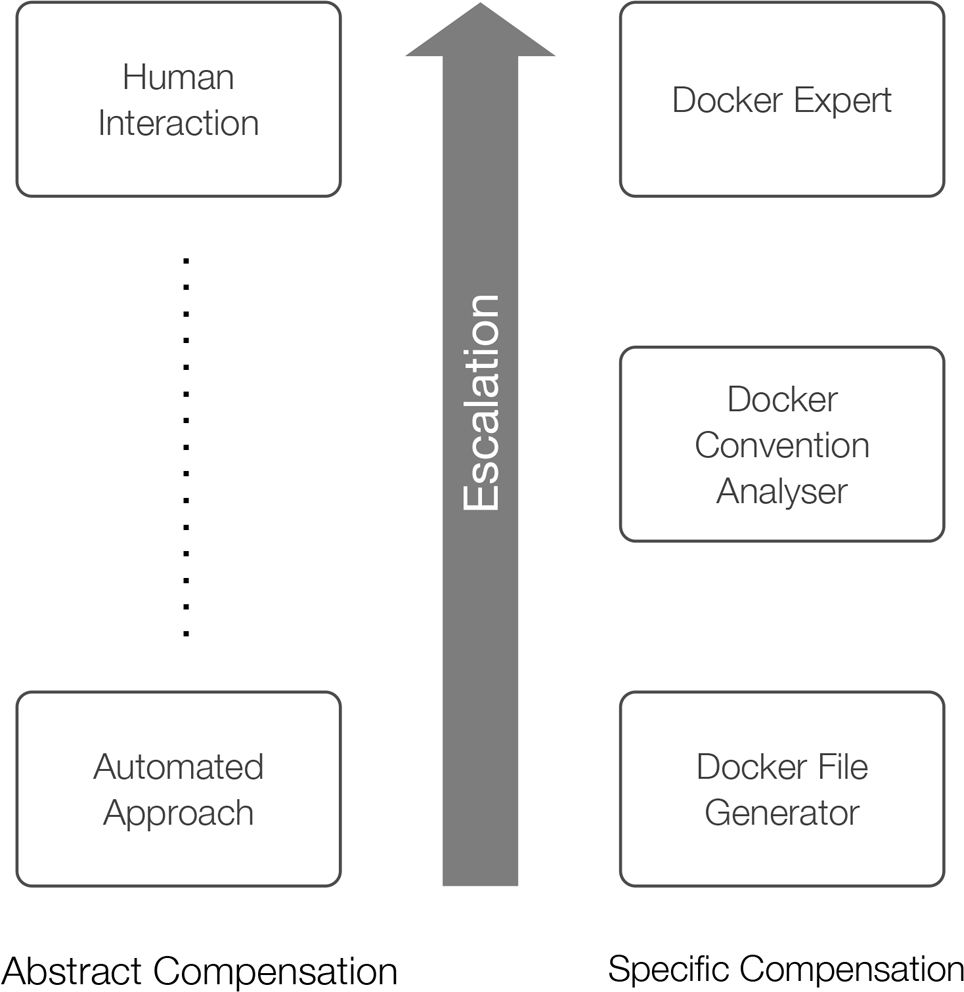
Additionally, the components in the analyzer and compensation facets follow the principle of Confidence Elasticity, which means that a component or processor produces a result that is augmented with a confidence value (), with 0 representing no certainty and 1 representing absolute certainty about the produced result. This allows for the specification of acceptable confidence intervals for the framework, which augment the auto-assembly mechanism. The confidence intervals are provided as optional configuration elements for the framework. In case the provided confidence thresholds are not met, the framework follows an escalation model to find the next component or processor that is able to provide results with higher confidence until it reaches the point where human interaction is necessary to produce a satisfactory result (illustrated in Fig. 4). Each processor (pi) from the set of active processors (Pa) provides a confidence value ci. We define the overall confidence value of all active processors (ca) as . The compensation stops when ca meets the specified confidence interval of the framework or a processor represents a human interaction which has a confidence value of (ci = 1).
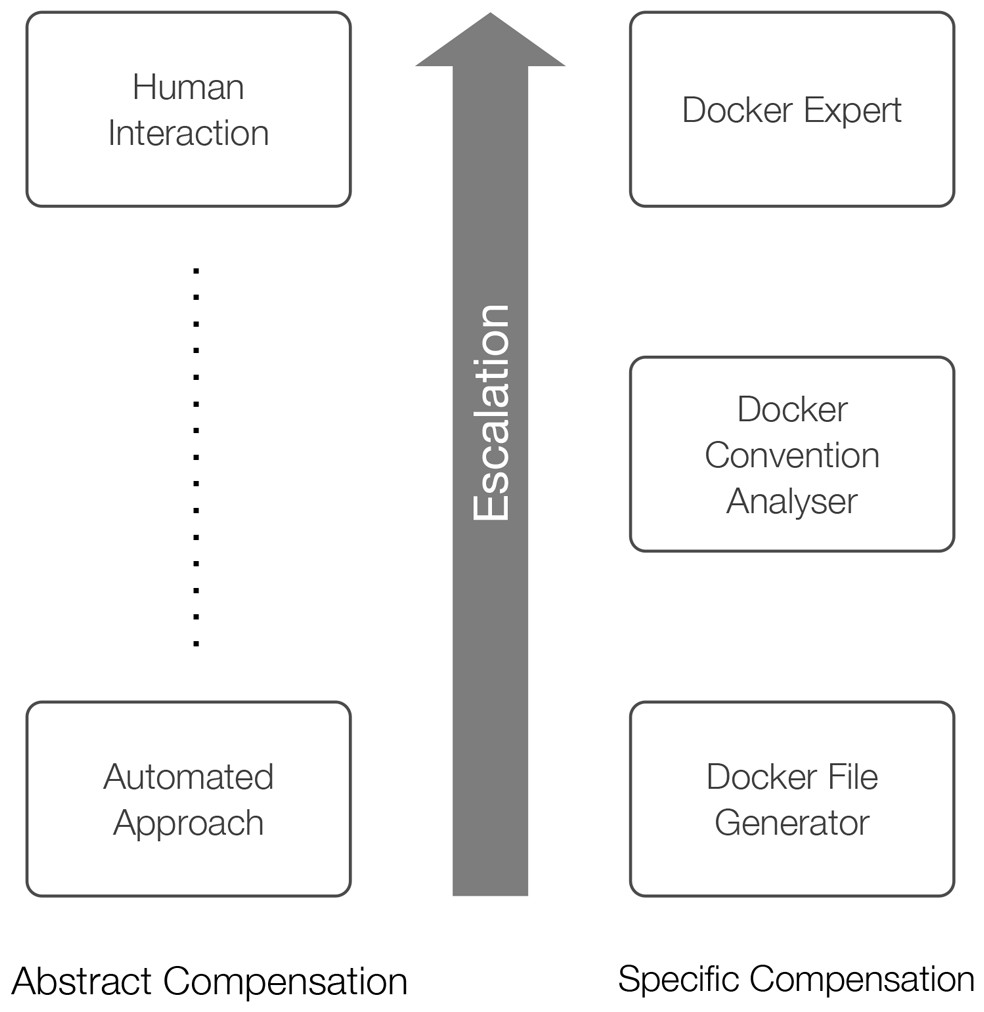
Figure 4: Confidence adaptation model escalation.
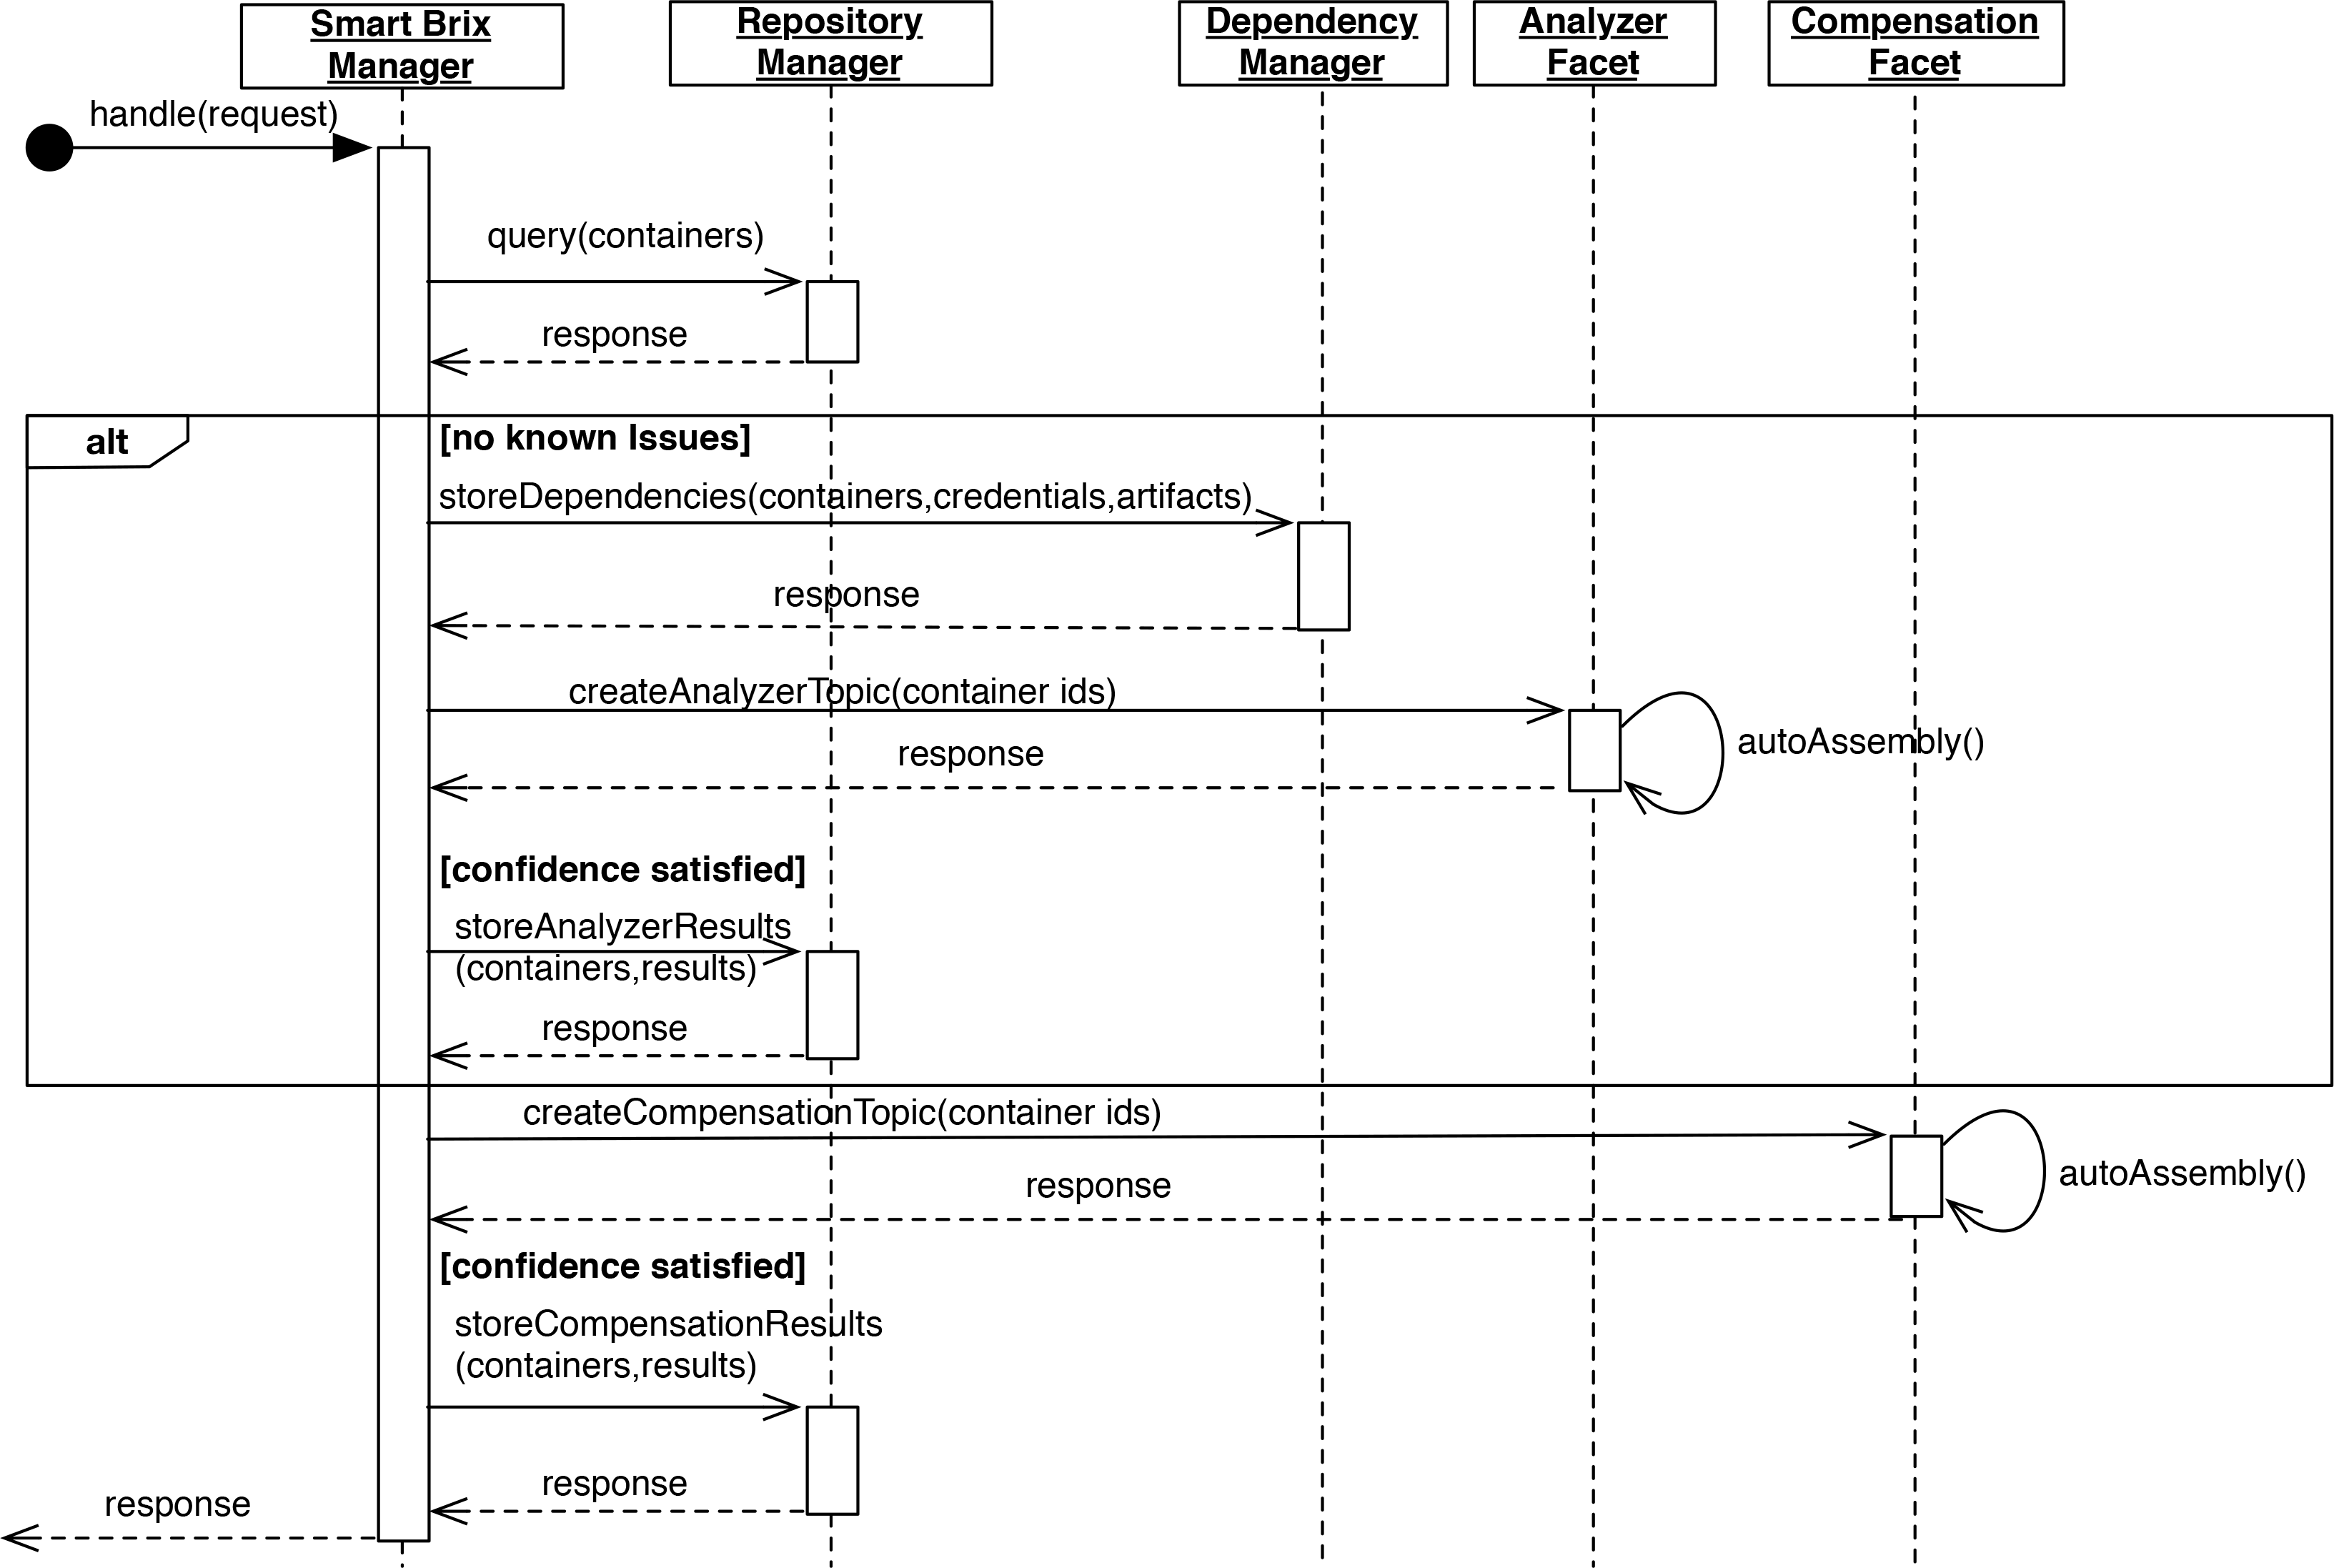
Smart Brix Manager
In order to initiate a container evolution, the Smart Brix Manager is invoked via the Smart Brix API with the following parameters: (i) a set of Containers to be inspected with (ii) the necessary Credentials to analyze and evolve them, as well as an optional (iii) set of Artifacts necessary to compensate or analyze the containers. In a first step the Smart Brix Manager queries the Repository Manager to see if there are already known issues for the supplied containers. If any known issues are found, the Smart Brix Manager creates a corresponding compensation topic via the messaging infrastructure by publishing the container identifiers as well as the found issues. This represents an input that will subsequently be consumed by the corresponding Compensation Handlers and starts the previously described auto-assembly process in the Compensation Facet.
If no issues were found, the Smart Brix Manager hands off the supplied Containers, Credentials and Artifacts to the Dependency Manager that is responsible for storing them in the Dependency Repository. As a next step, the Smart Brix Manager creates a corresponding analyzer topic via the messaging infrastructure and publishes the container identifiers to it. This generates an input that will be consumed by the corresponding Analyzers and starts another auto-assembly process in the Analyzer Facet. The Smart Brix Manager then listens to the created topic and waits for a response from the Analyzer Facet. If any analyzer responds, the manager checks the confidence value of the provided results against the configured confidence interval of the framework. If the results satisfy the interval it uses the Repository API to store them in the Analytics Repository. If the confidence intervals are not satisfied, it waits for a configured timeout for additional results to emerge. If this fails the framework escalates according to the principle of Confidence Elasticity and marks the containers as required for human interaction. If the confidence interval was met, the Smart Brix Manager initiates the previously mentioned auto-assembly process in the Compensation Facet. The Smart Brix Manager then listens to the created topic and waits for a response from any compensation handler. In case of a response, it checks the confidence values by applying the same approach as for the Analyzer Facet, and stores them as compensations into the Analytics Repository. A corresponding sequence diagram illustrating this is shown in Fig. 5.
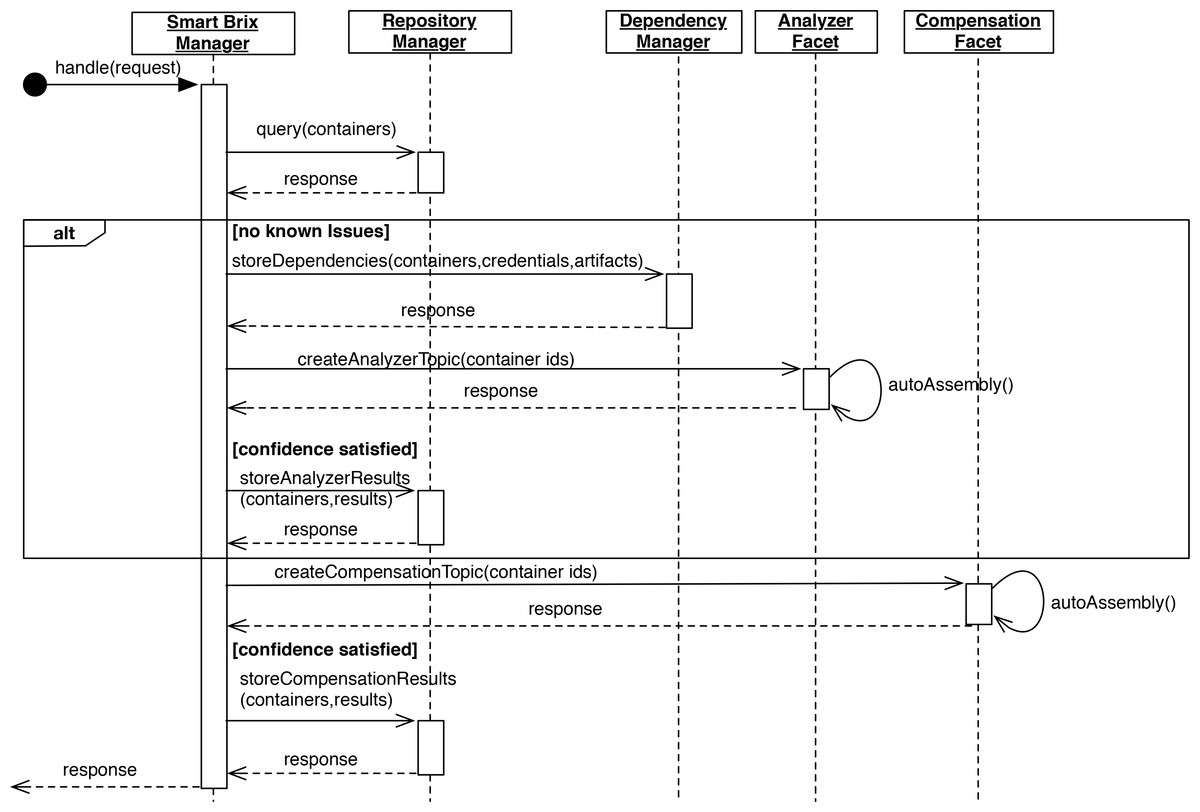
Figure 5: Smart Brix Manager sequence diagram.
Furthermore, the Smart Brix Manager provides API endpoints to query the results of analytics and compensation processes, as well as the current status via container identifiers.
Repository Manager
The Repository Manager provides a repository for storing analytics results of all analyzed containers as well as their corresponding compensations. The Analytics Repository itself is a distributed key value store that enables Analyzers as well as Compensation Handlers to store information without being bound to a fixed schema. In addition, this enables the previously mentioned open extensibility of our auto-assembly approach by allowing every component to choose the required storage format. Finally, the Repository Manager provides a service interface to store and retrieve analytics and compensation information as well as an interface for querying information based on container identifiers or other attributes.
Dependency Manager
The Dependency Manager handles necessary credentials and artifacts that are needed for processing containers. The Dependency Manager provides a service interface that allows the Smart Brix Manager to store artifacts and credentials associated with specific containers. Additionally, it provides a mechanism for components in the Analyzer and Compensation Facets to retrieve the necessary credentials and artifacts for the corresponding container IDs. Finally, it acts as service registry for components in the Utility Facet and exposes them to the Compensation and Analyzer Facet. The Dependency Manager uses a distributed key value store for its Dependency Repository in order to store the necessary information.
Utility Facet
The general role of the Utility Facet is to provide supporting services for Analyzers, Compensation Handlers, and Managers of the framework. Components in the Utility Facet register their offered services via the Dependency Manager. This provides an open and extensible approach that allows to incorporate novel elements in order to address changing requirements of container evolution. In our current architecture, the Utility Facet contains three components. First, a Vulnerability Hub, which represents a service interface that allows Analyzers as well as Compensation Handlers to check artifacts for vulnerabilities. The Vulnerability Hub can either utilize public repositories (e.g., the National Vulnerability Database: https://nvd.nist.gov/), or any other open or proprietary vulnerability repository. The second component is a Compliance Hub that allows to check for any compliance violations in the same way the Vulnerability Hub does. This is an important element in heterogenous multi-stakeholder environments, where compliance to all specified criteria must be ensured at all times. The last element is a Metric Hub, which allows to check artifacts for certain relevant metrics in order to ensure relevant Quality of Service constraints for containers.
Analyzers
The task of the components within the Analyzer Facet is to test containers for potential vulnerabilities, compliance violations or any other metrics. The facet is invoked by the Smart Brix Manager, which triggers an auto-assembly process for the given containers that should be analyzed. The Analyzer Facet can contain components for the most prominent container formats like Docker or Rkt, but due to the fact that we utilize the auto-assembly approach, we are able to integrate new container formats as they emerge. For analyzing a container an analyzer follows three basic steps: (i) Determine the base layer of the container in order to know how to access the package list; (ii) Determine the list of installed packages including their current version; (iii) Match the list of installed packages against a set of vulnerabilities, issues, or compliance constraints in order to determine the set of problems.
Every step can follow a different set of strategies to analyze a container represented as different processors, each of them with a specific confidence value. Possible processors for these steps are: (i) Base Image Processors, which try to determine the base layer of a container by matching their history against known base image IDs; (ii) Similarity Processors that try to select a base layer based on similarities in the history of the container with known containers by performing actions like collaborative filtering and text mining; (iii) Convention Processors that try to determine the base layer by trying common commands and checking their results; (iv) Human Provided Processors, which are human experts that manually analyze a container.
In order to access the containers and to perform analytics, the components within the Analyzer Facet interact with the Dependency Manager. The manager provides them with the necessary credentials for processing containers. Once the analyzers have processed a container, they publish the results, which are augmented with the confidence value, to the corresponding topic where the Smart Brix Manager carries on as previously described.
Compensation Handlers
The components in the Compensation Facet generate potential compensations for containers that have been previously identified by the Analyzers. Like the Analyzers, the Compensation Handlers are invoked by the Smart Brix Manager, which starts an auto-assembly process for the containers with problems that should be compensated. We provide components for the most prominent container formats, with the ability to extend the list as new formats emerge. The compensation handlers follow three basic steps: (i) Apply a compensation strategy for the container and the identified problem; (ii) Verify if the compensation strategy could be applied by rebuilding or restarting the container; (iii) Verify that the problems could be eliminated or reduced.
Again, every step can utilize a set of different processors, each of them with a specific confidence value, which represent different strategies. Possible processors are: (i) Container Processors, which try to use the base image's package manager to upgrade packages with identified vulnerabilities. (ii) Image Processors that try to build a new image without the vulnerabilities; (iii) Similarity Processor that try to compensate via applying steps from similar containers that do not show these vulnerabilities; (iv) Human Provided Processors, which are human experts that manually compensate a container.
The Compensation Handlers interact with the Dependency Manager in a similar way like the Analyzers to retrieve the necessary credentials to operate. As Image Processors and Similarity Processors build new images in order to compensate, they can request the necessary artifacts associated with an image to be able build them.
Implementation
We created a proof of concept prototype of our framework based on a set of RESTful microservices implemented in Ruby. Each component that exposes a service interface relies on the Sinatra (http://www.sinatrarb.com/) web framework. The Repository Manager and the Dependency Manager utilize MongoDB (https://www.mongodb.org/) as their storage backend, which enables the previously described distributed, open, and extendable key value store for their repositories. We implemented a Vulnerability Hub that uses a SQLite (https://www.sqlite.org/) storage backend to persist vulnerabilities in a structured format. It holds the recent data from the National Vulnerability Database (NVD; https://nvd.nist.gov/), specifically the listed Common Vulnerabilities and Exposures (CVEs). This CVE Hub allows to import the CVEs posted on NVD, stores them in its repository, and allows to search for CVEs by vulnerable software name as well as version via its Sinatra-based REST interface.
To enable the auto-assembly mechanism for each processor within each component in the Analyzer and Compensation Facet, we use a message-oriented middleware. Specifically, we utilize RabbitMQ's (https://www.rabbitmq.com/) topic and RPC concepts, by publishing each output and listening for its potential inputs on dedicated topics. We implemented a Docker Analyzer component with a Base Image Processor and a Convention Processor-based strategy. The Docker Analyzer first tries to determine the operating system distribution of the container by analyzing its history. Specifically, it uses the Docker API to generate the history for the container and selects the first layer's ID, which represents the base layer. It then matches this layer against a set of known layer IDs, which matches corresponding operating system distributions to determine which command to use for extracting the package list. If a match is found, it uses the corresponding commands to determine the package list. If the determined operating system is Ubuntu or Debian, it will use dpkg to determine the package list. If it was CentOS, yum is used, and if it was Alpine, apk. After parsing the package command output into a processable list of packages, it checks each package name and version by using the CVE Hub via its REST interface. When this step is finished the Analyzer publishes the list of possible vulnerabilities, including analyzed packages along with several runtime metrics. In case the base image strategy fails, the Docker Analyzer tries to determine the base layer including the corresponding operating system via a convention processor. Specifically, it test if the image contains any of the known package managers. Based on the results the analyzer determines the distribution flavor and continues as described above.
We further implemented a Docker Compensation Handler with a Container Processor and an Image Processor based compensation strategy. The Container Processor tries to upgrade the container using the operating system distribution's package manager. After this operation succeeds, it checks if the number of vulnerabilities are reduced, by comparing the new version of packages against the CVE Hub. If this was the case it augments the results with a confidence value based on the percentage of fixed vulnerabilities and publishes the results. The Image Processor tries to fix the container by generating a new container manifest (e.g., Dockerfile). More precisely, it uses the Docker API to generate the image history and then derives a Dockerfile from this history. After this step, the Image Processor exchanges the first layer of the Dockerfile with the newest version of its base image. In cases where it cannot uniquely identify the correct Linux flavor, it generates multiple Dockerfiles, for example one for Ubuntu and one for Debian. It then checks the Dockerfiles' structure for potential external artifacts. Specifically, it searches for any COPY or ADD commands that are present in the Dockerfile. If this is the case, it contacts the Dependency Manager and attempts to retrieve the missing artifacts. Once this is finished the Image Processor tries to rebuild the image based on the generated Dockerfile. After this step is finished, the Image Processor again checks the new list of packages against the CVE Hub, and if it could improve the state of the image it publishes the results with the corresponding confidence value. The prototype implementation is available online and can be found at https://bitbucket.org/jomis/smartbrix/.
Deployment modes
The Smart Brix Framework provides a container for each facet and therefore supports deployment on heterogeneous infrastructures. The framework enables wiring of components and aspects via setting the container's environment variables, enabling dynamic setups. We distinguish between two fundamental deployment modes, Inspection Mode and Introspection Mode.
Inspection Mode
The Inspection Mode allows the framework to run in a dedicated inspection and compensation setting. In this mode the framework ideally runs exclusively without any other containers and utilizes the full potential of the host systems. This means that the Smart Brix Managers wait until they receive an explicit request to analyze and compensate an artifact.
Introspection Mode
The Introspection Mode allows the framework to run in an active container setup. In this mode the framework constantly watches deployed containers via the Smart Brix Manager. The Manager can be provided with a list of containers to watch via a configuration setting. This provided list of containers is then analyzed and compensated. If no container lists are supplied, the Manager watches all running containers on the platform. In this case it initiates a check whenever new images are added, an image of a running container changes, or new vulnerabilities are listed in the CVE Hub.
Evaluation
Setup
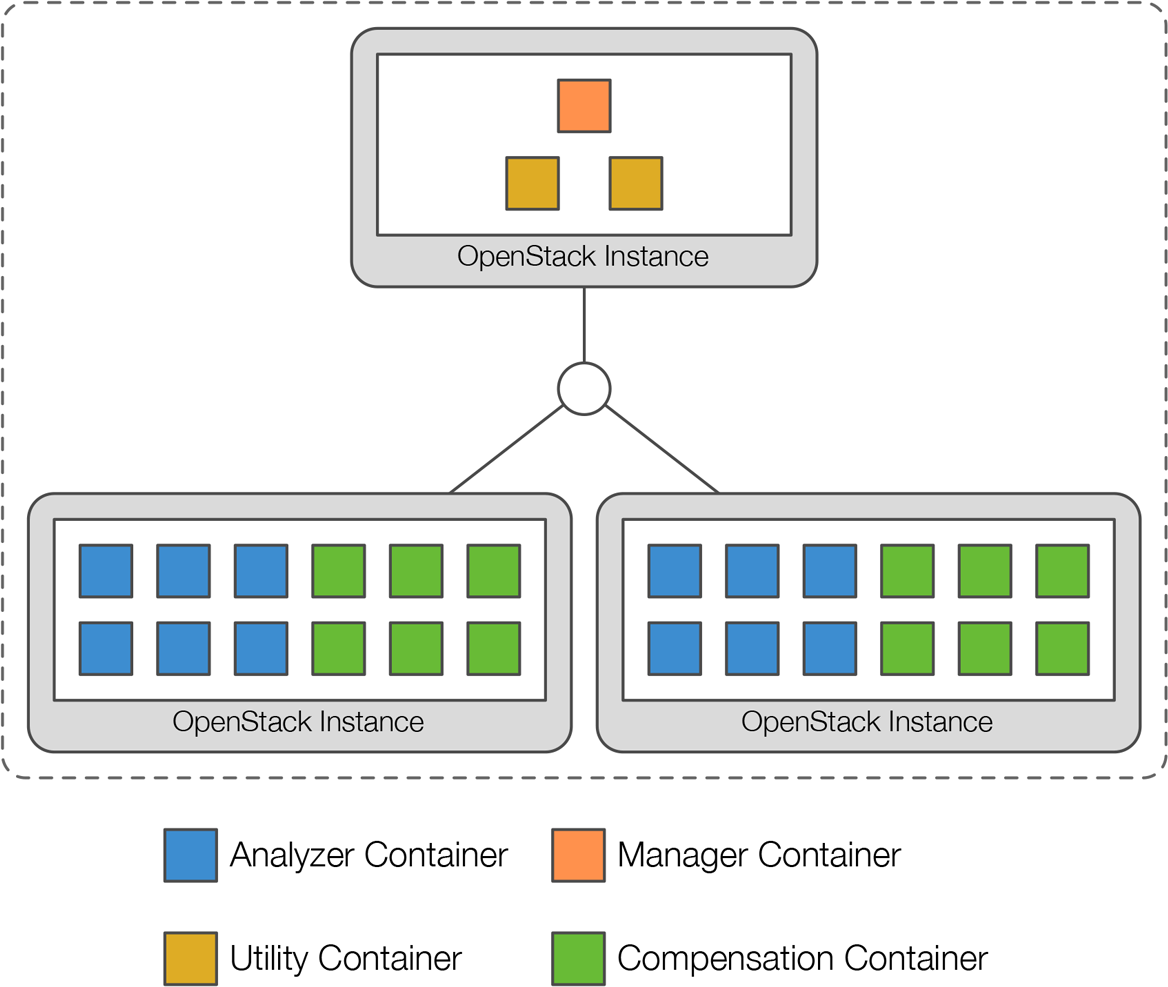
For our evaluation we used the following setup. We provisioned three instances in our private OpenStack cloud, each with 7.5 GB of RAM and 4 virtual CPUs. Each of these instances was running Ubuntu 14.04 LTS with Docker staged via docker-machine (https://docs.docker.com/machine/install-machine/). For our evaluation we choose the inspection deployment variant of our framework in order to stress-test the system without other interfering containers. We deployed one manager container representing the Management Facet, as well as two utility containers containing the CVE Hub and the Messaging Infrastructure on one instance. We then distributed 12 analyzer containers with 12 compensation containers over the remaining two instances. Additionally, we deployed a cAdvisor (https://github.com/google/cadvisor) container on every instance to monitor the resource usage and performance characteristics of the running containers. Figure 6 shows an overview of the deployed evaluation setup.
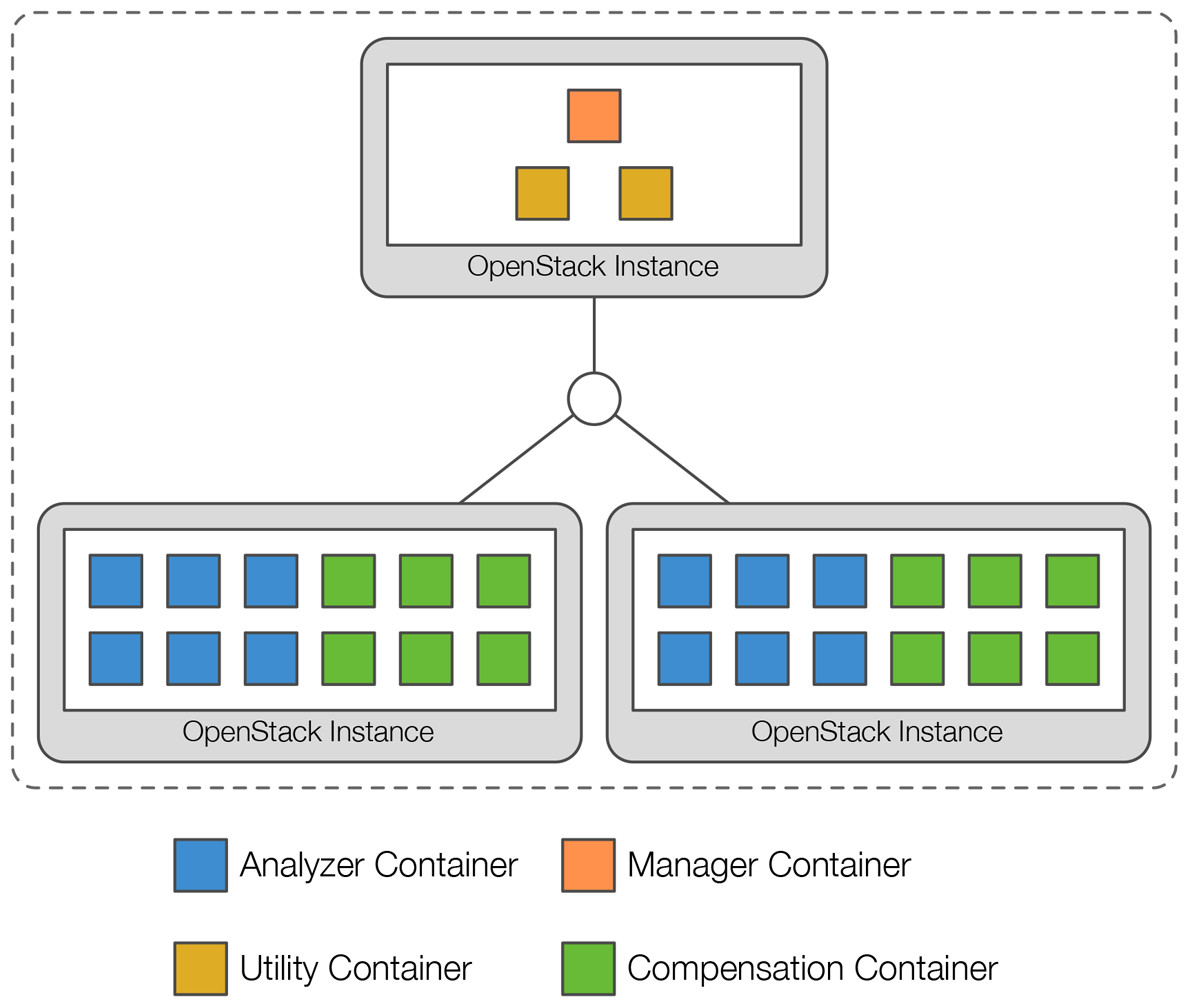
Figure 6: Evaluation Setup of Smart Brix running in inspection mode.
Experiments
Since we currently only have around 250 images in our URBEM setting, we extended the number of images to be evaluated. In order to get a representative set of heterogenous images we implemented a small service to crawl Docker Hub (https://hub.docker.com/). The Docker Hub is a public repository of Docker container images of different flavors. These images range from base images, like Ubuntu and CentOS etc., to more complex images like Cassandra and Apache Spark. We utilized the search function of the Hub to collect a set of 4,000 images ordered by their popularity (number of pulls and number of stars), which ensures that we focus on a set with a certain impact. We then extracted the name and the corresponding pull commands along with the latest tag to form the URI of the image. This set of 4,000 URIs represented the source for our experiments, which was then split into 3 sets containing 250, 500, and 1,000 images to be tested.
Analyzer experiments
We started our experiments with a focus on the Analyzer Facet of the framework. First, we started the analyzer containers on one instance and started our tests with the 250 image set. After the run finished we repeated it with the 500 and 1,000 image set. After the tests with one instance, we repeated the experiments with two instances where each run was repeated three times. During the tests we constantly monitored cAdvisor to ensure that the instances were not fully utilized in order to ensure this would not skew results. The focus of our experiments were not the performance characteristics of our framework, in terms of cpu, memory or disk usage, which is why we used cAdvisor only as a monitor to rule out overloading our infrastructure. We also did not utilize any storage backend for cAdvisor since this has shown to be a significant overhead which in turn would have skewed our results.
After the runs had finished we evaluated the vulnerability results. The analyzers logged the analyzed images, their base image flavor (e.g., Ubuntu, Debian etc.), processing time to analyze the image, pull time to get the image from the DockerHub as well as the overall runtime, number of packages, size of the image, and number of vulnerabilities.
Over all our experiments the analyzers showed that around 93% of the analyzed images have vulnerabilities. This mainly stems from the fact that our implemented analyzers have a very high sensitivity and check for any potentially vulnerable software with any potentially vulnerable configuration. However, this does not necessarily mean that the specific combination of software and configuration in place shows the detected vulnerability. If we only take a look at the images with a high severity according to their CVSS (https://nvd.nist.gov/cvss.cfm) score, around 40% show to be affected which is conclusive with recent findings (http://www.banyanops.com/blog/analyzing-docker-hub/). These results underline the importance to implement the measures proposed by our framework. However, the focus of our work and the aim of our experiments was not to demonstrate the accuracy of the implemented vulnerability detection, but the overall characteristics of our framework, which we discuss in the remainder of this section.
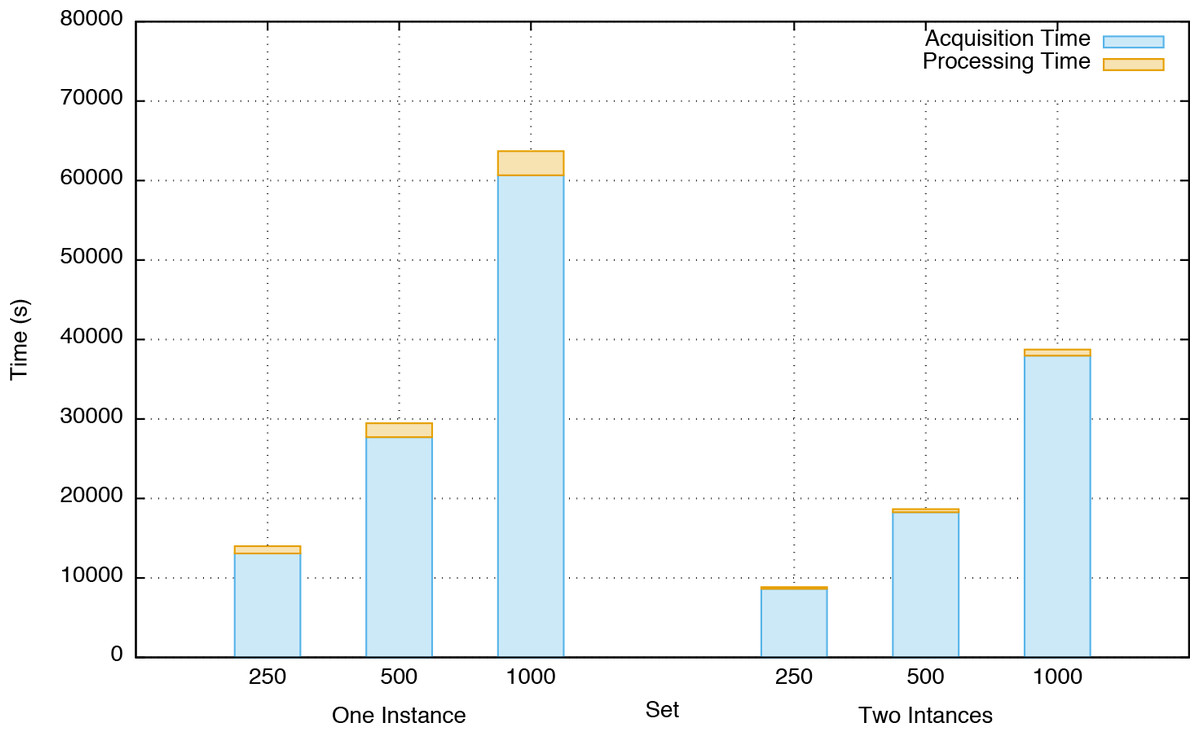
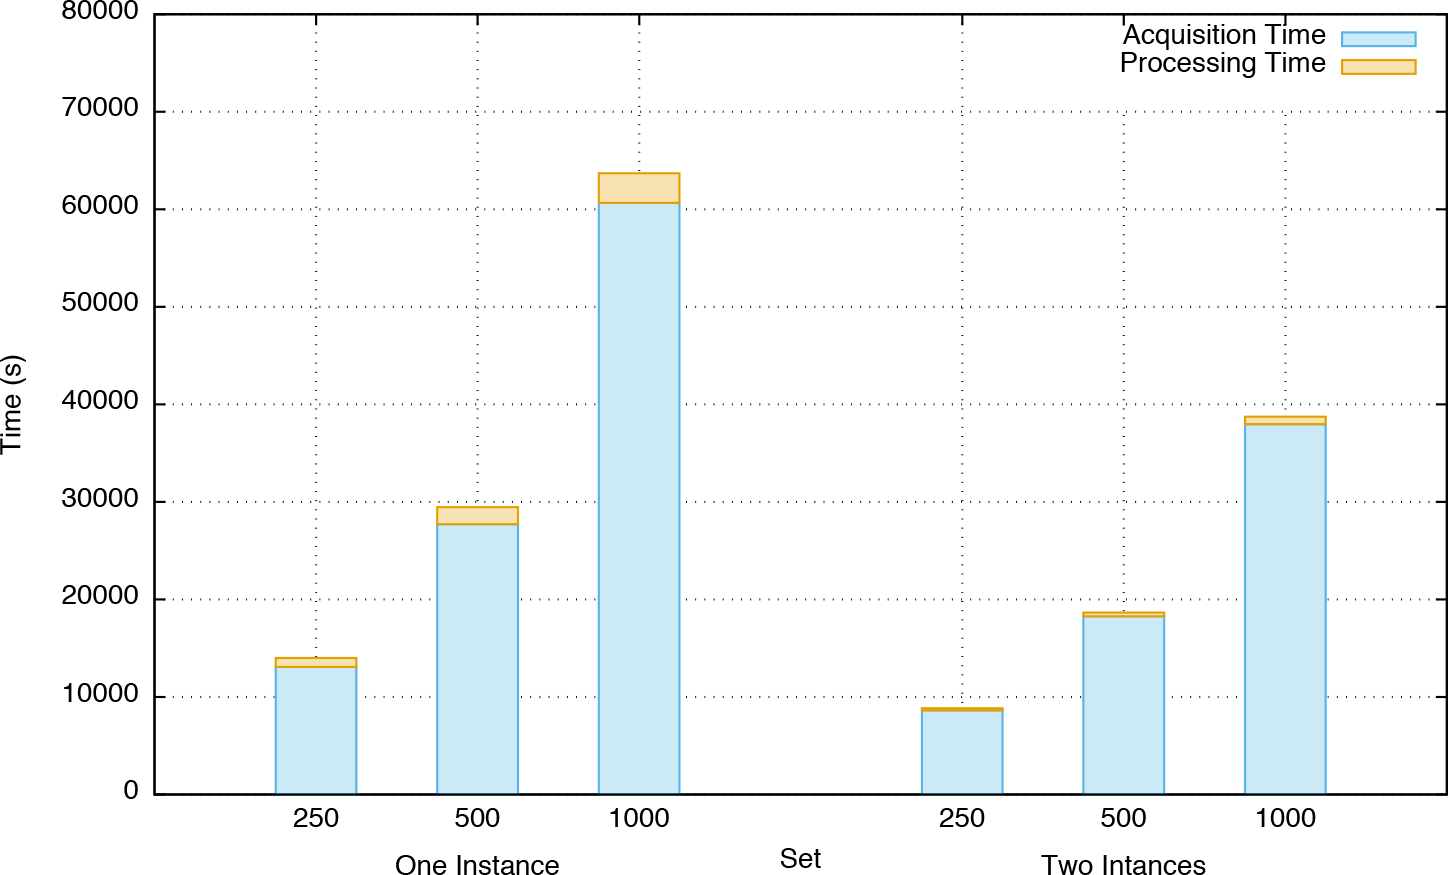
Figure 7: Comparison of runtime for analytics between one instance and two instances.
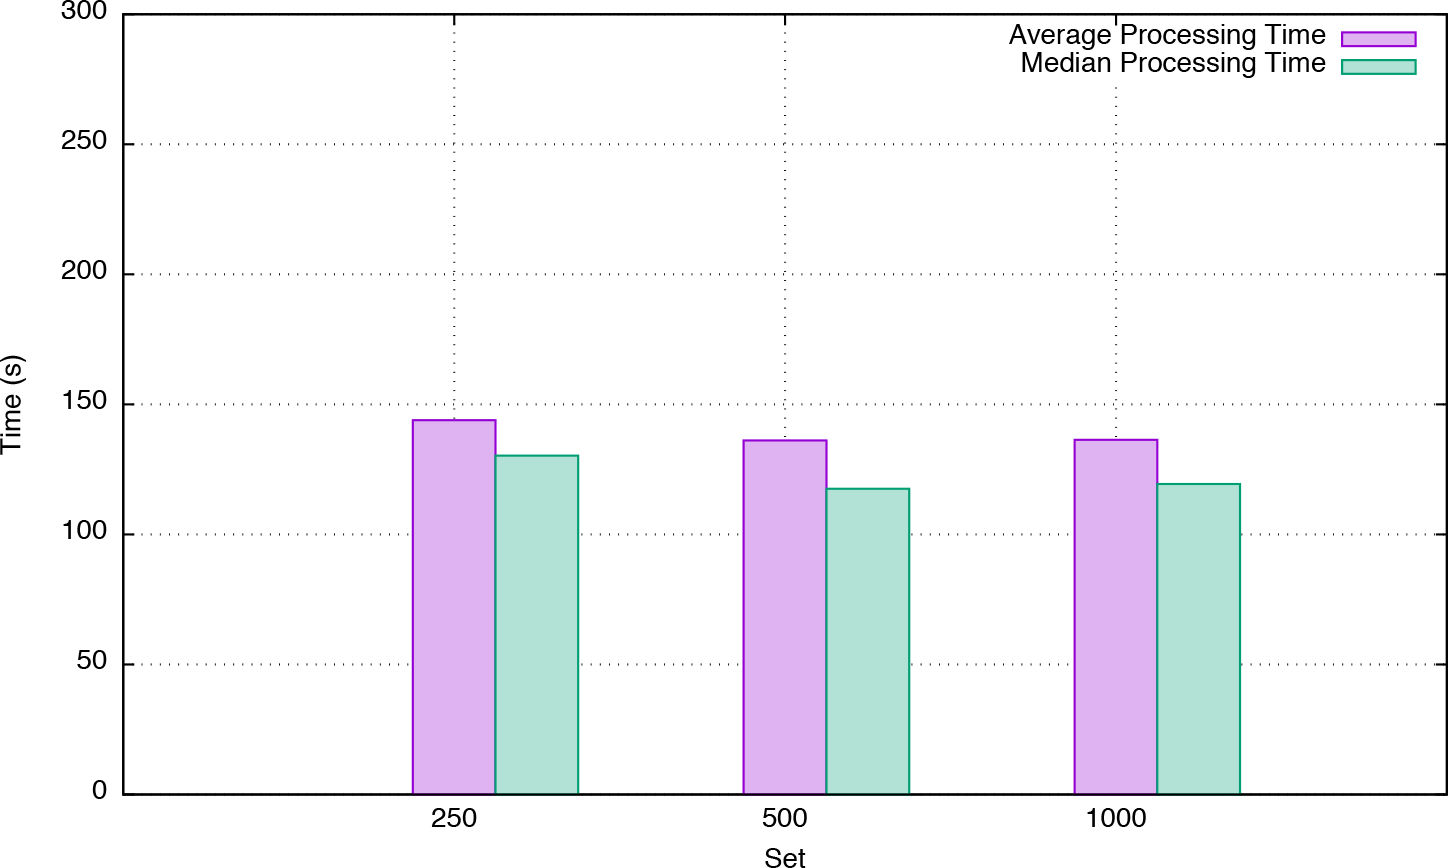
We first compared the overall runtime of our analyzers, specifically the difference for one instance vs two instance deployments, the results are shown in Fig. 7. Based on the results we see that our approach can be horizontally scaled over two nodes leading to a performance improvement of around 40%. The fact that in our current evaluation setting we were not able to halve the overall runtime using two instances stems from several factors. On the one hand, we have a certain overhead in terms of management and coordination including the fact that we only deployed one manager and storage asset. On the other hand, a lot of the runtime is caused by the acquisition time, which is clearly bound by network and bandwidth. Since our infrastructure is equipped with just one 100 Mbit uplink that is shared by all cloud resources, this is a clear bottleneck. We also see that the majority of wall clock time is spent for acquisition and that the actual processing time only amounts to approximately 3% of the overall runtime. The fact that the acquisition time for the 1,000 image set does not grow linearly like the runs with the 250 and 500 image set, stems from Docker's image layer cache. In this case the overall acquisition time grows slower, because a lot of images in the 1,000 set share several layers, which, if already pulled by another analyzer in a previous run, do not need to be pulled again, hence reducing the acquisition time. Finally, we demonstrate that the average processing time of our framework is stable, which is shown in Fig. 8. We further notice a small increase in average processing time for the 250 image set, which is caused by the fact that this set contains more images with larger package numbers compared to the overall amount of images tested, resulting in a slightly higher average processing time. As illustrated in Table 1, per-package processing times remain stable throughout the performed experiments, with a median of 0.558 s and a standard deviation of 0.257 s.
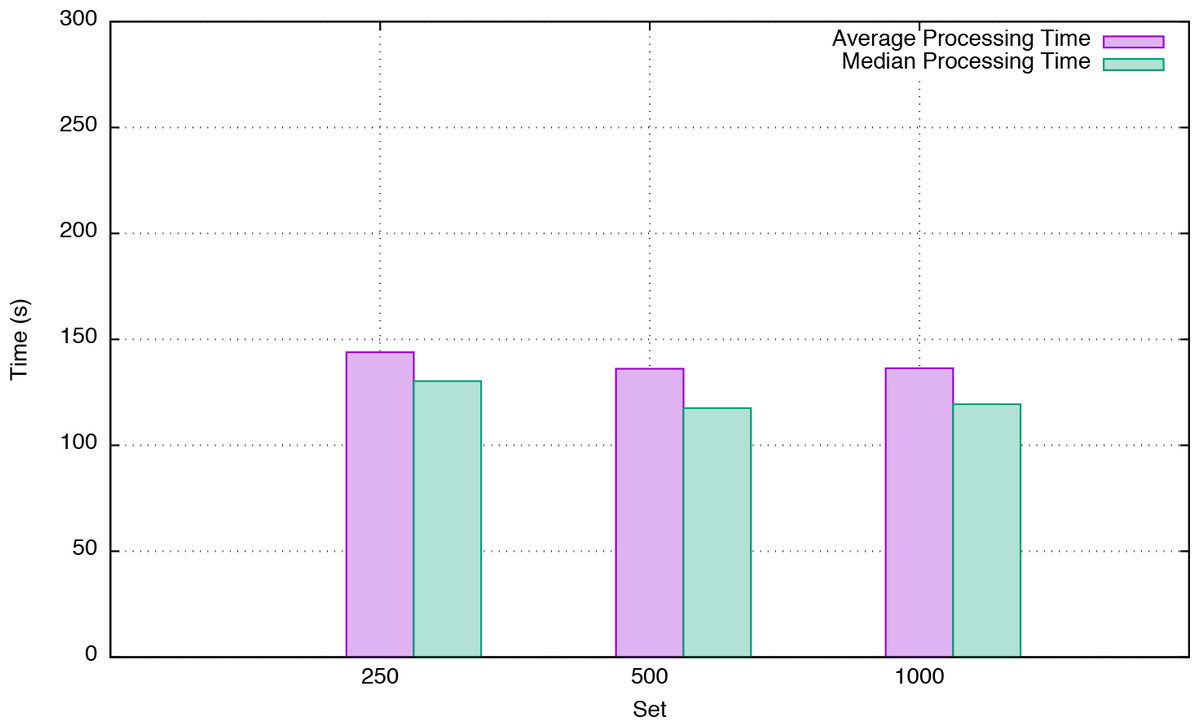
Figure 8: Comparison of processing time for analytics with two instances.
| Set | Median processing time | Standard deviation processing time | No. of packages |
|---|---|---|---|
| 250 | 0.620 s | 0.255 s | 153,275 |
| 500 | 0.564 s | 0.263 s | 303,483 |
| 1,000 | 0.537 s | 0.252 s | 606,721 |
| Overall | 0.558 s | 0.257 s | 1,063,479 |
Compensation experiments
In the the next part of our experiments we focused on the Compensation Facet of our framework. In order to test the ability to automatically handle compensations of vulnerable images, we tested the implemented Container Processor strategy. This strategy compensates found vulnerabilities via automatic upgrades of existing images. It takes no human intervention, has a very high confidence, keeps all artifacts within the images and is therefore optimal to test the auto-compensation ability of our framework. In the process of compensation the Container Processor generates a new image with the upgraded packages. In order to test this image for improvement we have to store it. This means that for every tested image we have to hold the original image as well as its compensated version. Specifically, we choose to test the most vulnerable images (images with the most vulnerable packages) out of the 1,000 image set we tested that are also the most prominent images in our URBEM scenario. This left us with 150 images, which we split in three sets with 50, 100, and 150 images and started our compensation tests. We then repeated each run to demonstrate repeatability and to balance our results. Since the Compensation Facet follows the same principle as the Analyzer Facet we omitted testing it on one instance and immediately started with two instances. After the tests finished, we compared the newly created images to the original ones and checked if the number of vulnerabilities could be reduced.
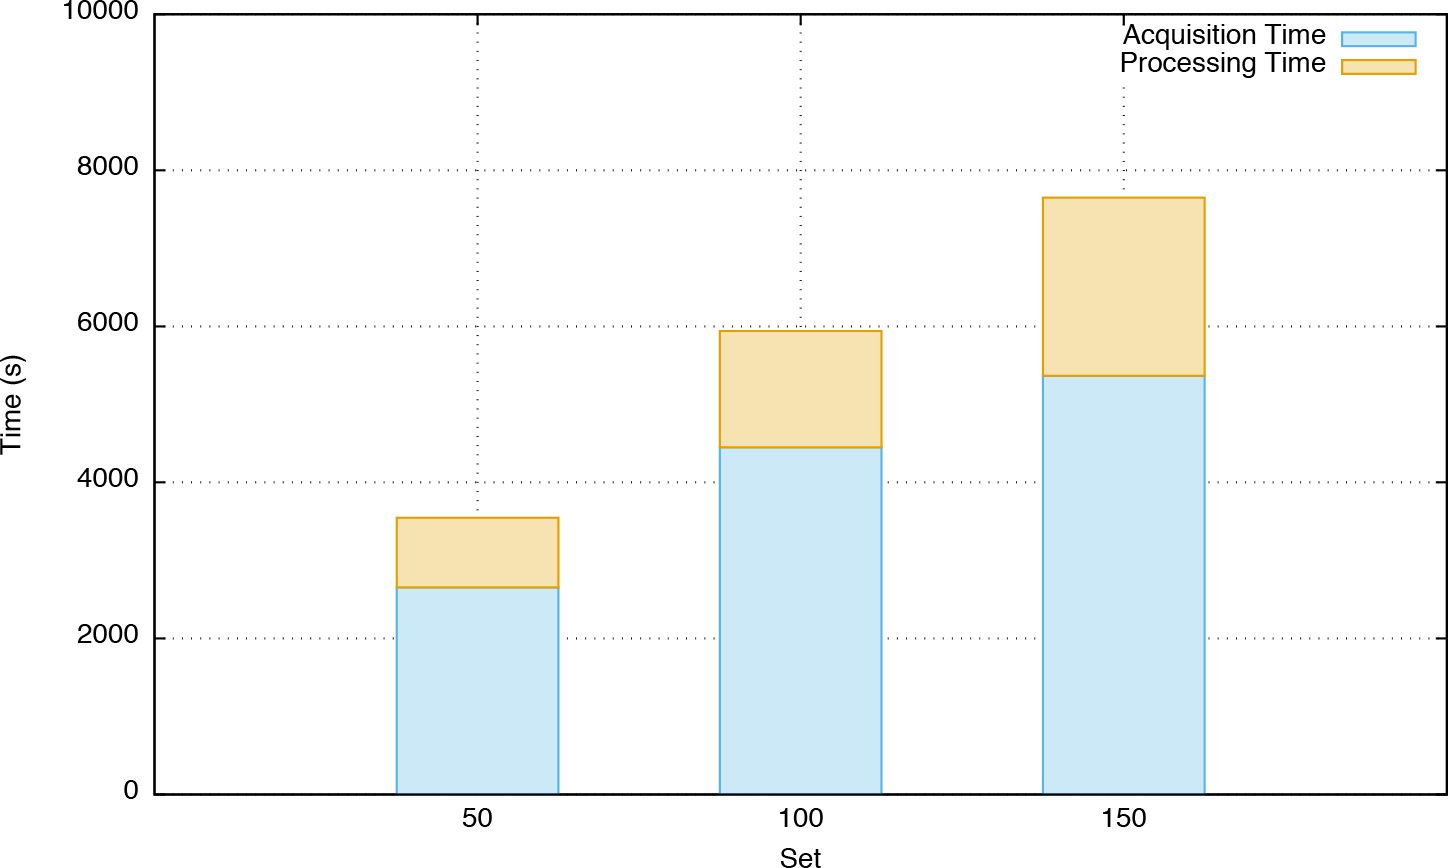
Overall our experiments showed that from the 150 images we were able to auto-compensate 34 images by reducing the number of vulnerabilities. This illustrates that even a rather simple strategy leads to a significant improvement of around 22.6%, which makes this a very promising approach. In a next step, we compared the overall runtime of our compensation handlers for the three tested sets, and the results are shown in Fig. 9. We again can clearly see that the major amount of time is spent for acquisition, in this case pulling the images that need to be compensated. The compensation itself only takes between 24% and 28% of the overall runtime and shows linear characteristics correlating with the number of images to be compensated. The comparatively low increase in acquisition time for the 150 image set again can be explained with the specific characteristics we see in Docker's layer handling.
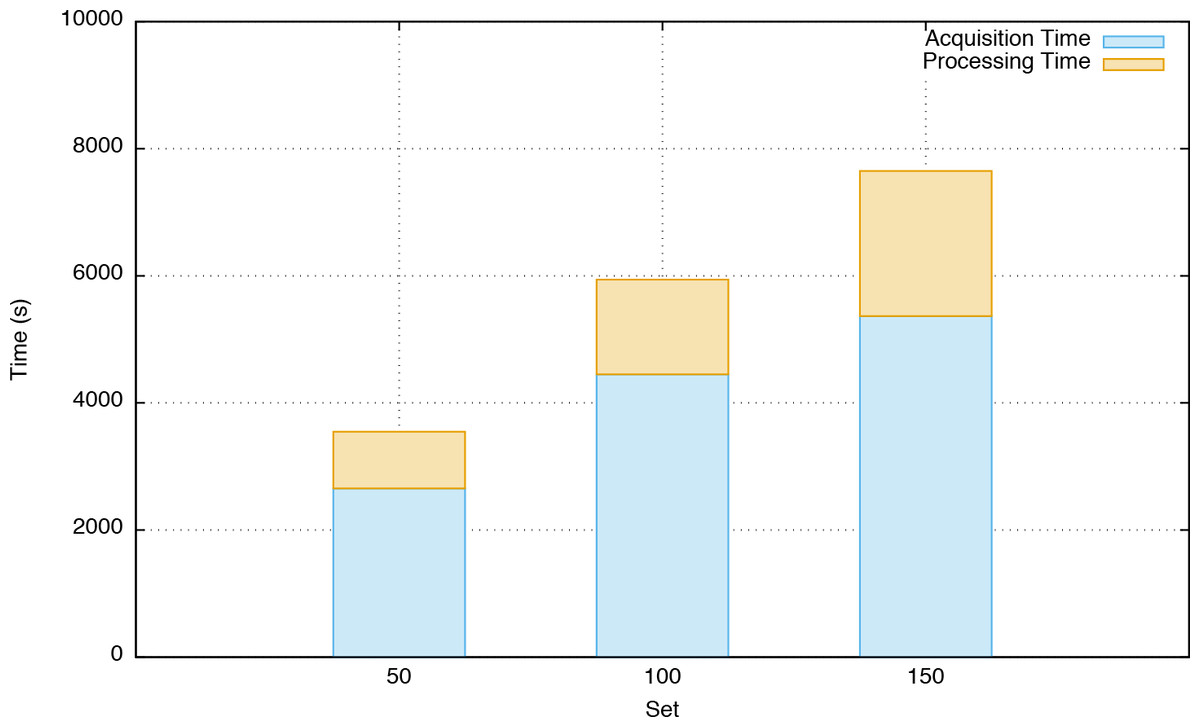
Figure 9: Comparison of pulltime and processing time for compensation with two instances.
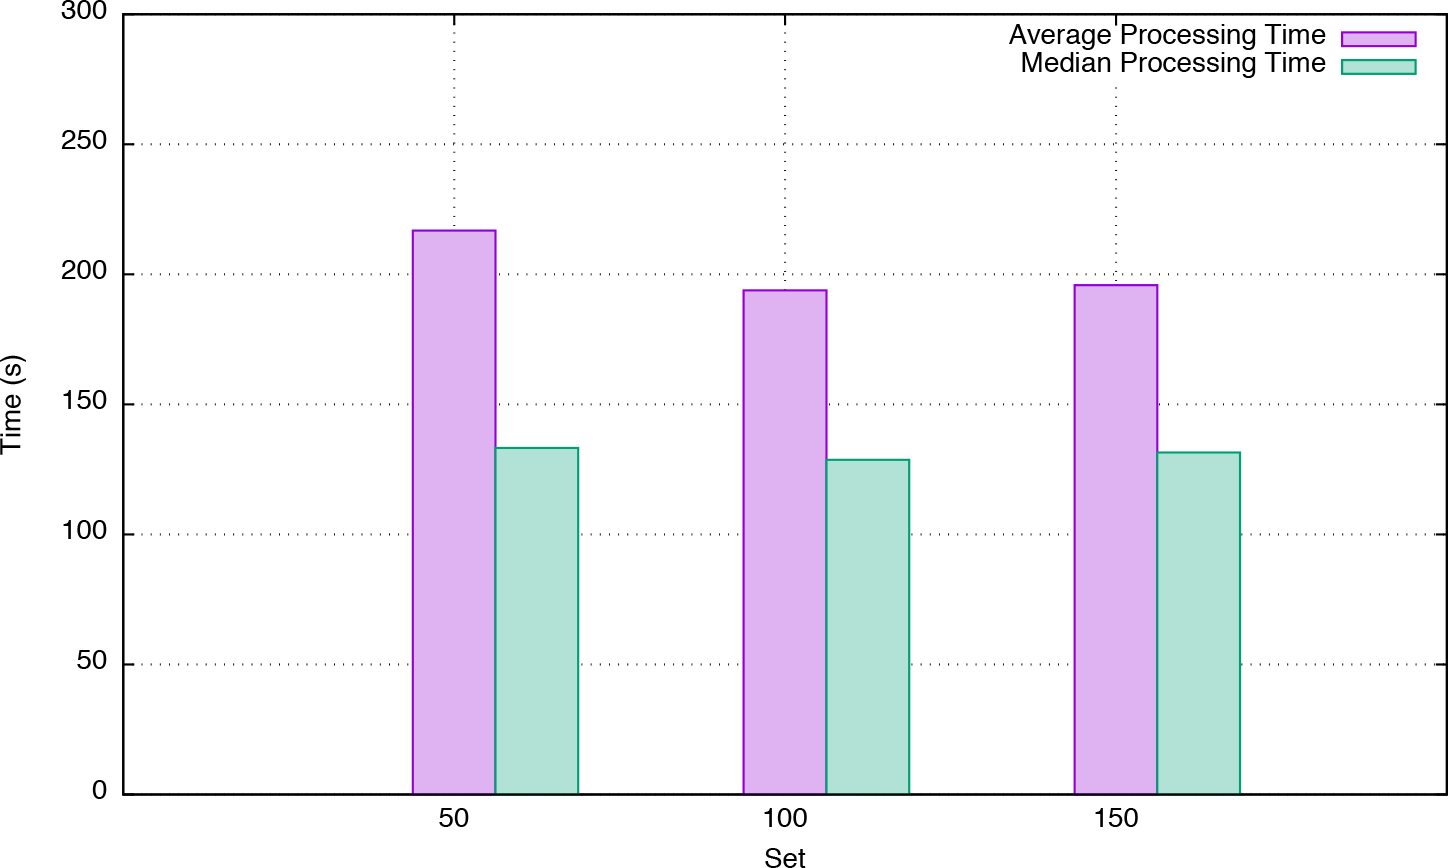
In a next step, we compared the average processing time for each set, and the results are shown in Fig. 10. We again notice similar characteristics as we saw with our analyzers. The average processing time as well as the median processing time are stable. The small increase for the 50 image set is explained with a larger number of images that contain more packages. This fact leads to relatively longer compensation times when upgrading them.
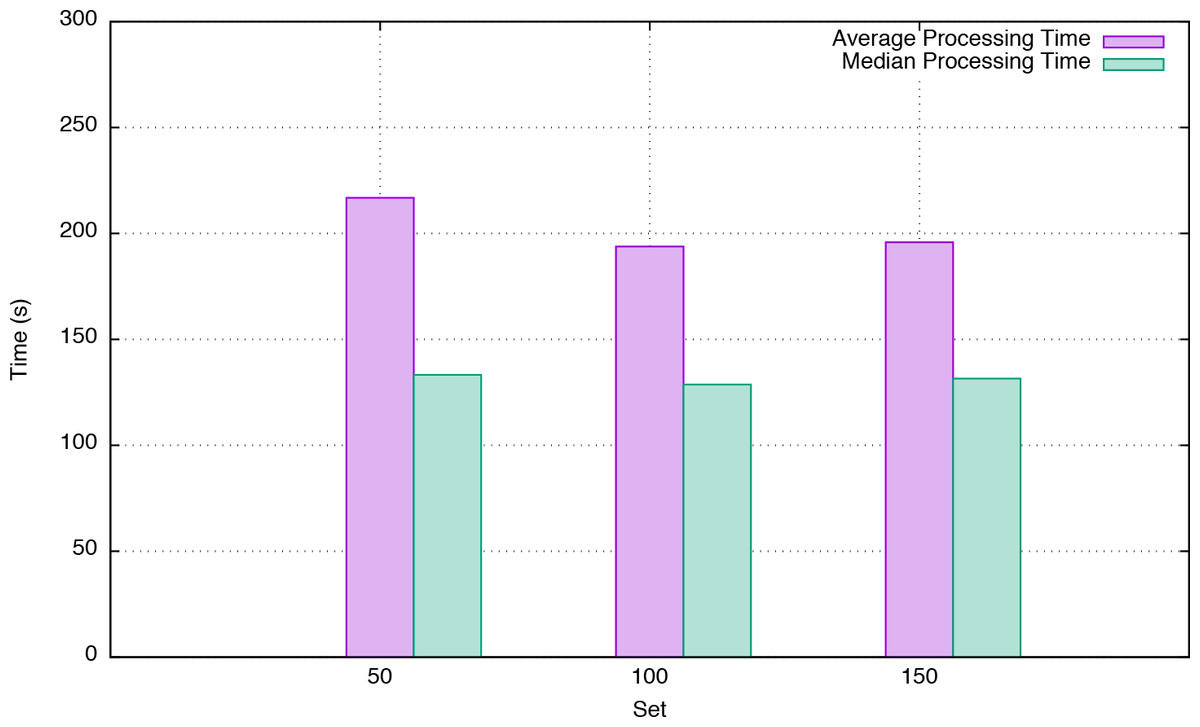
Figure 10: Comparison of processing time for compensation with two instances.
Discussion
Our experiments showed that our framework is able to scale horizontally. We further demonstrated that the majority of the runtime, both when analyzing and compensating images is caused by the image acquisition, which is bandwidth bound. Given the fact that in most application scenarios of our framework the images will not necessarily reside on Docker Hub, but instead in a local registry, this factor greatly relativizes. The processing time itself scales linearly with the number of analyzed packages, and the same was shown for the compensation approach. Furthermore, the processing time in our current evaluation setup is mostly constrained by the prototypical vulnerability checking mechanism and the chosen storage system, which both are not the focus of our contribution. The implementation of different vulnerability checkers, along with more efficient storage and caching of vulnerability data could lead to further reduction in processing time and will be tackled in future work. An additional aspect we did not specifically address in this paper is the fine-grained scale-out of components in all Smart Brix facets.
Threats to applicability
While the presented framework fulfills the requirements set forth in the previously introduced URBEM project, certain threats to the general applicability of Smart Brix remain.
Currently, the auto-assembly mechanism introduced in `Framework rationales' attempts to eagerly construct analysis and compensation pipelines that are loosely structured along the level of specificity of the performed analysis. Hence, the number of created pipelines can grow exponentially with the number of candidate components in the worst case. If all components for a given level of specificity accept all inputs produced in the previous level, and all subsequent components accept all produced outputs in turn, the number of created pipelines would grow exponentially with the number of components per level of specificity. This problem can be mitigated by introducing a transparent consolidation mechanism that delays the propagation of produced outputs of a certain type for a specified amount of time, orders them by the reported confidence values, and only submits one (or a few) of the produced output values with the highest confidence values for further consumption by other components. Due to the relatively small number of processing components required for the URBEM use case, we left the implementation of this consolidation mechanism for future work.
Related Work
The rapid adoption of container-based execution environments for modern applications enables increased flexibility and fast-paced evolution. Next to this fast-paced evolution of containers, new containers are deployed whenever functionality has to be added, which leads to massive amounts of containers that need to be maintained. While the container provides an abstraction on top of the operating system, it is still vital that the underlying system complies to policies or regulations to avoid vulnerabilities. However, checking the plethora of available environments and adapting them accordingly, is not a trivial task.
Among several approaches stemming from the area of SOA like the works of Lowis & Accorsi (2009), Yu, Aravind & Supthaweesuk (2006) which deal with classic service vulnerabilities as well as the work of Li et al. (2010), Lowis & Accorsi (2011) propose a novel method for analyzing cloud-based services for certain types of vulnerabilities. Next to general models and methods for classifying and analyzing applications, several approaches emerged that allow vulnerability testing. They range from service oriented approaches for penetration and automated black box testing introduced by Bau et al. (2010) and Li et al. (2015) to model based vulnerability testing like the work of Lebeau et al. (2013) as well as automated vulnerability and infrastructure testing methods (e.g., Shahriar & Zulkernine, 2009; Hummer et al., 2013). Antunes & Vieira (2013) introduce SOA-Scanner, an extensible tool for testing service-based environments for vulnerabilities. Based on an iterative approach the tool discovers and monitors existing resources, and automatically applies specific testing approaches. Also, more recently, large scale distributed vulnerability testing approaches have been introduced (e.g., Evans, Benameur & Elder, 2014; Zhang et al., 2014). In contrast to our approach, the aforementioned tools solely concentrate on testing and identifying possible security threats, but do not provide means for adapting the observed application or its environment accordingly.
More recently, container-based approaches are applied in the literature to ease development and operation of applications. Tosatto, Ruiu & Attanasio (2015) analyze different cloud orchestration approaches based on containers, discuss ongoing research efforts as well as existing solutions. Furthermore, the authors present a broad variety of challenges and issues that emerge in this context. Wettinger, Breitenbücher & Leymann (2014) present an approach that facilitates container virtualization in order to provide an alternative deployment automation mechanism to convergent approaches that are based on idempotent scripts. By applying action-level compensations, implemented as fine-grained snapshots in the form of containers, the authors showed that this approach is more efficient, more robust, and easier to implement as convergent approaches. However, compared to our approach, the authors do not provide a framework for analyzing container application deployments, which based on identified issues triggers according compensation mechanisms. Gerlach et al. (2014) introduce Skyport, a container-based execution environment for multi-cloud scientific workflows. By employing Docker containers, Skyport is able to address software deployment challenges and deficiencies in resource utilization, which are inherent to existing platforms for executing scientific workflows. In order to show the feasibility of their approach, the authors add Skyport as an extension to an existing platform, and were able to reduce the complexities that arise when providing a suitable execution environment for scientific workflows. In contrast to our approach the authors solely focus on introducing a flexible execution environment, but do not provide a mechanism for continuously evolving container-based deployments. Li, Kanso & Gherbi (2015) present an approach that leverages Linux containers for achieving high availability of cloud applications. The authors present a middleware that is comprised of agents to enable high availability of Linux containers. In addition, application components are encapsulated inside containers, which makes the deployment of components transparent to the application. This allows monitoring and adapting components deployed in containers without modifying the application itself. Although this work shares similarities with our approach, the authors do not provide a framework for testing container-based deployments, which also supports semi-automatic compensation of found issues.
Next to scientific approaches, also several industrial platforms emerged that deal with the development and management of container-based applications, with the most prominent being Tutum (https://www.tutum.co) and Tectonic (https://tectonic.com). These cloud-based platforms allow building, deploying and managing dockerized applications. They are specifically built to make it easy for users to develop and operate the full spectrum of applications, reaching from single container apps, up to distributed microservices stacks. Furthermore, these platforms allow keeping applications secure and up to date, by providing easy patching mechanisms and holistic systems views. In contrast to our approach, these platforms only focus on one specific container technology, and are not extensible. IBM recently introduced the IBM Vulnerability Advisor (https://developer.ibm.com/bluemix/2015/07/02/vulnerability-advisor/), a tool for discovering possible vulnerabilities and compliance policy problems in IBM containers. While IBM's approach shares similarities with our work, they are solely focusing on Docker containers that are hosted inside their own Bluemix environment and therefore do not provide a generic approach. Furthermore, their Vulnerability Advisor only provides guidance on how to improve the security of images, but does not support mechanisms to evolve containers.
Conclusion
The numerous benefits of container-based solutions have led to a rapid adoption of this paradigm in recent years. The ability to package application components into self-contained artifacts has brought substantial flexibility to developers and operation teams alike. However, to enable this flexibility, practitioners need to respect numerous dynamic security and compliance constraints, as well as manage the rapidly growing number of container images. In order to stay on top of this complexity it is essential to provide means to evolve these containers accordingly. In this paper we presented Smart Brix, a framework enabling continuous evolution of container application deployments. We described the URBEM scenario as a case study in the smart city context and provided a comprehensive description of its requirements in terms of container evolution. We introduced Smart Brix to address these requirements, described its architecture, and the proof of concept implementation. Smart Brix supports both, traditional continuous integration processes such as integration tests, as well as custom, business-relevant processes, e.g., to implement security, compliance, or other regulatory checks. Furthermore, Smart Brix not only enables the initial management of application container deployments, but is also designed to continuously monitor the complete application deployment topology and allows for timely reaction to changes (e.g., discovered application vulnerabilities). This is achieved using analytics and compensation pipelines that will autonomously detect and mitigate problems if possible, but are also designed with an escalation mechanism that will eventually request human intervention if automated implementation of a change is not possible. We evaluated our framework using a representative case study that clearly showed that the framework is feasible and that we could provide an effective and efficient approach for container evolution.
As part of our ongoing and future work, we will extend the presented framework to incorporate more sophisticated checking and compensation mechanisms. We will integrate mechanisms from machine learning, specifically focusing on unsupervised learning techniques as a potential vector to advance the framework with autonomous capabilities. We also aim to integrate the Smart Brix framework with our work on IoT cloud applications (Inzinger et al., 2014; Vögler et al., 2015b; Vögler et al., 2015a). Furthermore, we plan to conduct a large-scale feasibility study of our framework in heterogenous container application deployments.