A comparative study of dimensionality reduction techniques for intrusion detection in IoT networks
- Published
- Accepted
- Received
- Academic Editor
- Ankit Vishnoi
- Subject Areas
- Algorithms and Analysis of Algorithms, Artificial Intelligence, Optimization Theory and Computation, Security and Privacy, Internet of Things
- Keywords
- Artificial intelligence (AI), Cybersecurity, Computational efficiency, Internet of Things (IoT), Intrusion detection system (IDS)
- Copyright
- © 2026 García-Merino et al.
- Licence
- This is an open access article distributed under the terms of the Creative Commons Attribution License, which permits unrestricted use, distribution, reproduction and adaptation in any medium and for any purpose provided that it is properly attributed. For attribution, the original author(s), title, publication source (PeerJ Computer Science) and either DOI or URL of the article must be cited.
- Cite this article
- 2026. A comparative study of dimensionality reduction techniques for intrusion detection in IoT networks. PeerJ Computer Science 12:e3553 https://doi.org/10.7717/peerj-cs.3553
Abstract
The widespread adoption of Internet of Things (IoT) technology has driven significant advancements in fields such as agriculture, manufacturing, industry, and transportation. However, the highly interconnected and resource-constrained nature of IoT ecosystems makes them particularly vulnerable to cyberattacks. Although AI-based intrusion detection systems provide an effective protection, their deployment on IoT devices is hindered due to limited memory, processing power, and storage capacity. One strategy for addressing these limitations is dimensionality reduction, consisting of the removal of redundant or irrelevant features in order to reduce computational demands without compromising model accuracy. This work analyses the effectiveness of various dimensionality reduction approaches for the development of efficient and lightweight Random Forest models for anomaly detection in IoT environments. Among the considered methods, Permutation Feature Importance consistently produced the most balanced models, reducing inference time, model size, and RAM usage, while slightly enhancing predictive performance. Furthermore, the feasibility of model deployment in real-world environments was assessed through experiments on a resource-constrained Raspberry Pi device.
Introduction
The integration of Internet of Things (IoT) and Artificial Intelligence (AI) technologies has enabled the interconnection of heterogeneous devices, sensors, and services, allowing real-time monitoring, automation, and intelligent decision-making. These capabilities have proven especially valuable in rural areas, where infrastructure is often limited and resources must be managed efficiently, giving rise to the concept of Smart Rural (Nawaz & Babar, 2025). Common applications include agriculture (Shi et al., 2019), farming (Navarro, Costa & Pereira, 2020), healthcare (Ge et al., 2023), and water resource management (Degada, Thapliyal & Mohanty, 2021), just to mention a few. However, the adoption of new technologies also introduces potential cybersecurity risks. In rural contexts, cyberattacks can lead to severe consequences due to disruption of agricultural production, leakage of private data, or denial of access to critical infrastructure (Campoverde-Molina & Luján-Mora, 2024; Alahe et al., 2024). Consequently, ensuring cybersecurity has become a priority for the technological development of these regions.
Protection against cyber threats relies on Intrusion Detection Systems (IDSs), which are security solutions designed to continuously monitor network or system activity to detect unauthorised access, anomalous behaviour, or known attack patterns (Ferrag et al., 2021). Traditionally, IDSs are classified into two main categories: signature-based and anomaly-based. The former operate by comparing observed network activity against a predefined database of known attack signatures. Although this approach is effective at identifying well-known threats, it presents significant difficulties when dealing with novel attacks or sophisticated intrusions capable of masking their patterns (Al-Haija & Droos, 2025). To overcome these limitations, AI-based IDSs have gained increasing popularity (Panagiotou et al., 2021). These systems adopt an anomaly-based approach, making use of Machine Learning (ML) techniques to model network behaviour and detect patterns that may indicate potential threats.
A wide range of AI techniques have been applied to the development of IDSs, including Support Vector Machines (SVM) Mohammadi et al. (2021), k-Nearest Neighbours (k-NN) (Agarwal et al., 2021), Decision Trees (DT) (Mahbooba et al., 2021), and Neural Networks (NN) (Mo et al., 2024), among others. Within this landscape, the Random Forest (RF) method has become a standard due to its robustness, interpretability, and ability to handle high-dimensional data (Bakro et al., 2024). As a result, the optimisation of RF models for the development of cybersecurity solutions has attracted great interest in recent scientific literature (Pramilarani & Kumari, 2024; Majidian et al., 2024). This need is particularly relevant in IoT environments, where the limited computational resources of devices make it difficult to deploy effective protection mechanisms (Kimani, Oduol & Langat, 2019; Mestre et al., 2025). Given this, a suitable strategy to improve efficiency involves the use of Dimensionality Reduction (DR) techniques. However, the role of DR in IDS development has received relatively little research attention (Swarna Priya et al., 2020). This issue is compounded by the fact that many reviews on AI model optimisation overlook DR (see, for example, Wang et al. (2021), Shuvo et al. (2022) and Surianarayanan et al. (2023)). Moreover, most studies on DR focus only on model accuracy improvements and fail to explicitly assess the savings in computational resources achieved (Gyamfi & Jurcut, 2022; Rahman, Al Shakil & Mustakim, 2025). In addition, the experimental evaluation of optimised models on resource-constrained devices remains a research gap in the literature (Gyamfi & Jurcut, 2022; Rahman, Al Shakil & Mustakim, 2025).
The discussion above underscores the necessity of a comprehensive study quantifying the performance of different DR methods in terms of computational efficiency within the context of IoT-oriented IDSs. In this work, five different DR techniques—namely, the test, Mutual Information, Permutation Feature Importance, Principal Component Analysis (PCA) and a Genetic Algorithm—have been compared for the development of lightweight RF-based IDSs for IoT cybersecurity. These methods have been selected based on their widespread use in existing literature and related studies in the context of lightweight intrusion detection in resource-constrained environments (Fatima et al., 2024). To ensure the robustness of our findings, the numerical experiments were conducted on two well-known, publicly available IoT-focused datasets: Edge-IIoTset and CICIoT2023.
To evaluate the real computational savings of DR process, the obtained models have been executed on both a high-performance server and a Raspberry Pi device, the latter representing a realistic IoT deployment scenario. The results demonstrate that the integration of DR techniques can lead to substantial computational savings in terms of model size, inference time and RAM consumption without compromising predictive performance. However, they also reveal significant differences between the assessed methods, highlighting the importance of selecting an appropriate optimisation strategy. In this regard, Permutation Feature Importance achieved the best overall results, providing the best balance between predictive power and computational efficiency. Most importantly, these findings emphasise the idea that the objective of DR should not be to retain the fewest possible features, but rather to identify those feature subsets that minimise the computational demands of the resulting models.
The rest of this article is organised as follows. ‘Literature Review’ presents a review of related work on DR in the context of IDS developement. ‘Methodology’ defines the mathematical background of the problem, the methods compared in the study, the datasets used for the analysis, the data preprocessing procedure, and the experimental setup designed to obtain the numerical results. ‘Numerical Results’ presents the numerical results and discussion. Finally, ‘Conclusions and Future Work’ recapitulates the contributions of this work and concludes this study.
Code and numerical results are available at https://github.com/uned-cibergid-projects/Study-of-DR-for-IoT-Intrusion-Detection/tree/main.
Literature review
This section provides an overview of the most relevant literature on the application of DR techniques in the context of IDS development, summarising key findings from previous work and providing the background against which the present study is positioned.
A considerable body of research has focused on proposing novel DR techniques, often by combining various existing methods. For instance, a feature selection (FS) algorithm based on the Evaluation Based on Distance from Average Solution (EDAS) technique was proposed in Abellana et al. (2022), showing that the method was capable of reducing the dataset without compromising classifier performance. The works of Fatani et al. (2021a, 2021b) introduced a novel DR approach that combined multiple metaheuristic algorithms, although model sizes and inference times were not assessed. Lee et al. (2020) proposed a stacked autoencoder combined with mutual information for constructing lightweight IDSs. Although the study underscores the necessity of model efficiency, it does not quantify the specific impact of the DR process on prediction time, using instead the final number of selected features as a proxy for computational efficiency. The studies by Albulayhi et al. (2022) and by Nimbalkar & Kshirsagar (2021) introduced hybrid feature-selection methodologies combining information gain and gain ratio through set operations to enhance intrusion detection in IoT environments. Xu et al. (2023) proposed a comprehensive intrusion-detection framework optimised through FS, Bayesian hyperparameter tuning and data balancing. Their methodology includes a two-stage FS process in which the Binary Grey Wolf Optimizer heuristic is first applied to filter out low-impact features, followed by the recursive elimination of the less important features to further refine the feature subset. In a recent study, Doost et al. (2025) presented a hybrid intrusion-detection approach combining convolutional neural network (CNN)-based feature extraction with a RF classifier, evaluated on the KDD99 and UNSW-NB15 datasets. Although runtime measurements were reported for the DR algorithms, the study did not analyse their impact on inference times or deployment efficiency.
A particularly interesting direction involves the incorporation of multi-objective algorithms, such as NSGA-II, into the feature-selection process. In this respect, De la Hoz et al. (2014) addressed feature selection as a multi-objective optimisation problem where the goals were the maximisation of detection accuracy and the minimisation of feature redundancy. In a similar vein, Roopak, Tian & Chambers (2020) utilised an a variation of the NSGA-II algorithm for detecting DDoS attacks in IoT networks. By jointly optimising up to six objectives (relevance, redundancy, number of features, accuracy, recall, and precision), their approach achieved a reduction of the CICIDS2017 dataset feature set from 80 to only six features while enhancing predictive performance.
However, as discussed in the previous section, although these studies emphasise the need to develop fast and lightweight ML models, they generally focus on accuracy, while overlooking efficiency metrics relevant for deployment, such as inference time, model size, and memory consumption. Furthermore, most works do not perform an in-depth comparison between different DR methods. As a notable exception, Singh & Ujjwal (2023) compared four metaheuristic FS algorithms for developing IDSs for IoT, and focused their discussion on the predictive performance of the final models and the runtime of the DR algorithms. Similarly, Mohy-Eddine et al. (2023) examined the effectiveness of SelectKBest, PCA, and a Genetic Algorithm in reducing the computational cost of a K-Nearest Neighbour-based IDS, concluding that SelectKBest offered the best trade-off between model accuracy and inference time. A recent study by Li et al. (2024) compared several DR methods using the ToN-IoT dataset (Moustafa, 2021). Their findings suggest that feature extraction (FE) techniques such as PCA achieve higher accuracy in attack detection and require less time for the dimensionality reduction process when the number of features is small, whereas FS methods yielded better results when the number of features increases. Interestingly, the results in Li et al. (2024) also demonstrate that a lower-dimensional feature set does not necessarily lead to faster inference times, highlighting the complexity of efficiency evaluation in IDS models.
In summary, previous research demonstrates significant progress in applying DR the development of lightweight IDSs, yet provides limited quantitative insight into its computational implications. The present work addresses this gap by assessing some of the most popular techniques and testing the resulting models on a realistic resource-constrained IoT device.
Methodology
This section provides a brief description of the RF algorithm, the DR methods employed, the datasets on which the analyses were conducted, the data preprocessing procedure, the two experimental setups designed to obtain the numerical results and the metrics used to assess the prediction models.
Prediction models
A wide variety of ML and deep learning (DL) models have been proposed for the development of IDSs, including SVMs, logistic regression, decision trees or NNs, just to mention a few. Although DL approaches often achieve high performance, they are typically too resource-intensive for resource-constrained environments, even after applying aggressive optimisations (Daghero et al., 2021). Consequently, this work focuses on RF models, an ensemble method that builds multiple decision trees using different subsets of the data and combines their outputs to produce more accurate and stable predictions.
RF models are considered a standard in ML literature due to their flexibility, strong classification performance, and inherent interpretability (Bakro et al., 2024). This last aspect is particularly relevant in the context of cybersecurity, where understanding why an alert has been raised is often as important as the alert itself. Moreover, they require minimal parameter tuning, which makes them easy to implement for practitioners working in real-world environments.
It should be noted that the computational cost of RF models grows with the amount of trees in the ensemble. This is particularly relevant when deploying models on resource-constrained IoT devices. Therefore, the number of trees in all RF models has been set to a moderate value of 20 throughout this work.
Dimensionality reduction methods
Dimensionality reduction encompasses two fundamental approaches: feature selection, which consists of identifying and retaining the most relevant variables from the original dataset; and feature extraction, which involves transforming the original features into a new set of variables that capture the essential structure of the data.
FS techniques can be further classified into filter and wrapper approaches (Chen et al., 2020). The former consist of scoring the relationship between each feature and the target variable according to a specific criterion, and discarding those with the lowest scores. The number of features to retain is determined by a user-specified threshold, which is usually a fixed number of features to keep or a minimum score below which features are excluded. On the other hand, wrapper methods assess feature subsets by training a predictive model and using its performance to guide the selection process. These approaches are usually more accurate than filter methods, since they can detect interactions between features. However, these strategies entail a higher computational cost, since they require training and validating a model multiple times across different feature subsets (Morán et al., 2024).
In contrast to FS, FE techniques reduce dimensionality by transforming the original variables into a new set of features. Their main drawback is the loss of interpretability, as the new features typically lack intuitive meaning within the original problem domain. Furthermore, when deploying an IDS on resource-constrained IoT devices, FE requires on-device transformation, thereby increasing the computational load during inference. One of the most common FE methods is PCA, which consists of transforming the original feature set into a new set of uncorrelated variables known as principal components, ordered by the amount of variance they capture.
To provide a comprehensive comparison, all the approaches described above need to be considered. Therefore, this analysis includes three widely used filter-based feature selection techniques —the test, Mutual Information, and Permutation Feature Importance—, one wrapper method (Genetic Algorithm), and one feature extraction technique (PCA). A brief description of each method is provided below.
- 1.
test: the test is an statistical technique that evaluates the dependency between each feature and the target class by measuring how the observed distribution of values differs from the expected one. Features with higher scores are considered more relevant for classification (Fatima, Rehman & Rehman, 2023).
It should be noted that the test is designed for categorical or nominal variables only (Morán et al., 2024). When applied to continuous features, the test treats each unique value as a separate category. In this case, it does not return an error as long as the feature values are non-negative, but this misinterpretation may lead to biased results: features with high variability can appear artificially significant due to their large number of unique values. Despite this limitation, it is common in the cybersecurity literature to apply the test directly to continuous features without any prior discretisation. For instance, in recent works (Nururrahmah & Ahmad, 2023; Fatima, Rehman & Rehman, 2023; Kilichev, Turimov & Kim, 2024), the test was employed for IDS development using datasets such as KDD Cup 99, NSL-KDD, ToN-IoT, and Edge-IIoTset without reporting any specific preprocessing for continuous variables. This tendency may be attributed either to an implicit reliance on standard tools to manage these issues internally, or simply to the fact that, in many cases, satisfactory results are achieved, leading authors to overlook the potential bias introduced. In light of the discussion above, and given its common use in the literature, it was decided to include the naïve method in this article to compare its performance against the other approaches.
- 2.
Mutual Information (MI): MI is a symmetric, non-negative value that indicates the dependency between two random variables X and Y by measuring the reduction of uncertainty about the former having observed the other (Altmann et al., 2010). Formally, MI measures the divergence between the joint distribution and the product of the marginal distributions as follows: (1) where and represent the probability spaces over which the random variables X and Y are defined.
- 3.
Permutation Feature Importance (PFI): in decision tree-based models such as RF, FI is commonly computed by measuring how much a feature contributes to reducing node impurity, typically using the Gini index criterion, when it is selected for a split (Strobl et al., 2007). Alternatively, permutation-based FI evaluates how much the performance of the model degrades when the values of a given feature are randomly permuted. If the shuffling process leads to an increase in prediction error, it indicates that the model depends on that feature to make accurate predictions (Molnar, 2022). In this article, the latter approach has been chosen, since it has been reported that the former tends to introduce bias in multiclass prediction models (Altmann et al., 2010).
- 4.
Principal Component Analysis (PCA): a projection-based technique that converts the original set of features into a new set of uncorrelated variables known as principal components. Each component is formed as a linear combination of the original variables, and are ordered according to the amount of variance they capture from the original data. The number of components selected to fit a model is usually determined by setting an explained variance threshold, typically around 95% to 99% (Alhowaide, Alsmadi & Tang, 2020).
- 5.
Genetic Algorithm (GA): Metaheuristic algorithms are optimization techniques designed to efficiently explore large and complex search spaces, often inspired by natural or physical processes. In the context of DR, metaheuristic strategies have gained significant attention due to their flexibility and effectiveness for FS (see, for example Fatani et al. (2021a, 2021b), Singh & Ujjwal (2023)). In this work, a GA has been selected as a representative example of the application of metaheuristic approaches for DR.
Within the GA framework, each candidate subset of features is represented as a binary vector whose length corresponds to the total number of predictors. After randomly generating an initial population of candidate feature sets, the algorithm uses evolutionary strategies such as mutation and crossover to identify subsets that optimise a given performance metric, such as classification accuracy (Halim et al., 2021). The main limitation of this approach lies in its computational burden, as selecting features by means of GA requires fitting hundreds of models.
Dataset description
Selecting adequate datasets is essential when designing AI-based IDSs. However, most IoT cybersecurity works utilise generic datasets that fail to reflect the specific characteristics of IoT traffic. According to the review by Aversano et al. (2021) the most commonly employed datasets are NSL-KDD, UNSW-NB15, and KDD Cup 99, none of which were specifically designed for real IoT scenarios. Furthermore, it is important to ensure diversity in both data volume and attack types to conduct a robust analysis. For instance, the BoT-IoT dataset provides a large amount of data but includes only four types of threats, namely: reconaissanse, theft, DoS and DDoS (Koroniotis et al., 2019). Taking these considerations into account, the numerical experiments have been conducted on two publicly available benchmark datasets developed specifically for IoT intrusion detection: Edge-IIoTset (https://www.kaggle.com/datasets/mohamedamineferrag/edgeiiotset-cyber-security-dataset-of-iot-iiot) and CICIoT2023 (https://www.kaggle.com/datasets/akashdogra/cic-iot-2023).
The Edge-IIoT dataset (Ferrag et al., 2021) provides a comprehensive IoT traffic setting, contains a broad range of attacks, and includes a total of 61 selected features describing various aspects of the network. A summary of the attack scenarios, their effects, and the most relevant features for their characterisation, according to expert knowledge, is presented in Table 1. Note that the source and destination IP addresses have been explicitly omitted from the features column. Both variables can be relevant when detecting attacks since, for example, if a command-and-control has been installed on a device, it will connect to an unknown external IP address. However, considering these features can undermine the generality of the models, introducing a bias towards a blacklist of malicious IP addresses.
| Attack name | Description | Effects | Key features |
|---|---|---|---|
| TCP SYN Flood DDoS | Sending manipulated SYN packets | Increased number of packets from different sources to the same node | Time between packets, number of packets per flow, flow direction |
| UDP Flood DDoS | Sending manipulated UDP packets | Increased number of packets from different sources to the same node | Time between packets, number of packets per flow, flow direction |
| HTTP Flood DDoS | Creating a high number of connections with HTTP GET requests | Increased number of HTTP requests from different sources to the same application server | HTTP request method, time between packets, number of packets per flow, flow direction |
| ICMP Flood DDoS | Sending multiple ICMP echo requests (ping) to servers | Increased number of ICMP packets from different sources to the same server | ICMP type, time between packets, number of packets per flow, flow direction |
| Port scanning | Detecting open ports on a system to identify active services | High number of packets in a short time from one device to many nodes | TCP source port, TCP destination port, time between request packets |
| OS fingerprinting | Analyzing packets to infer the OS version | Unusual TCP options and HTTP user agents | TCP options, HTTP user agent, time between packets |
| Vulnerability scanning | Analyzing ports and packet data to detect vulnerable services | High number of requests to open ports | TCP options, TCP flags, HTTP user agent, time between packets, TCP ports |
| DNS Spoofing | Manipulating DNS tables to alter communication between two parties | Abnormal traffic flows | TCP sequence, TCP ACK, time between packets, DNS requests |
| ARP Spoofing | Manipulating ARP tables to alter communication between two parties | Abnormal traffic flows | ARP requests, ARP responses, time between packets, TCP sequence, TCP ACK |
| Cross-site Scripting (XSS) | Injecting malicious scripts into web pages viewed by other users | Unusual HTTP requests and responses | HTTP request URI, HTTP request method, HTTP request URI method |
| SQL Injection | Injecting malicious SQL code to access or manipulate databases | Unusual HTTP requests | HTTP request URI, HTTP request method, HTTP request URI method |
| File upload attack | Uploading malware files to a target node | Upload traffic with large frame length and small time variation; HTTP POST to unknown IP with specific content type | HTTP request URI, HTTP request method, HTTP file data/content type, frame size, TCP ports, time between packets |
| Backdoor | Malware designed to gain control over a device | Abnormal traffic using ports not associated with installed services | TCP ports |
| Password CRACKING | Brute-force access to IoT resources using unauthorized credentials | Repeated connections from the same IP to the same port in short intervals; repeated POST requests to login URI | TCP port, time between packets, TCP flags, HTTP request URI, HTTP request method, HTTP authorization header, TCP sequence and ACK, retransmissions |
| Ransomware | Malware that encrypts user files and demands ransom | Connections to unknown IPs (command-and-control); file downloads from unknown sources | TCP destination port, HTTP POST request, DNS query names, HTTP request URI, HTTP content type |
On the other hand, the CICIoT2023 dataset (Neto et al., 2023) contains network traffic captured in a testbed composed of 105 real IoT devices, including a variety of brands and types, providing an accurate representation of a real-world deployment in a smart home environment. Of particular relevance is the use of IoT devices as malicious agents, reflecting realistic internal threat scenarios where infected nodes can initiate attacks against other IoT devices. In addition to benign traffic, the dataset includes a total of 33 distinct attack types, grouped into seven main categories: Denial of Service (DoS), Distributed Denial of Service (DDoS), brute force, spoofing, reconnaissance, web-based attacks, and Mirai-related attacks. The main challenge when working with the CICIoT2023 dataset is its massive size, containing over 46 million records and 47 features per instance, including the label feature that identifies the type of attack. Consequently, processing this dataset requires careful data management, which is described below.
Dataset preprocessing
Since the data in the Edge-IIoTset and CICIoT2023 datasets originate from traffic captured in real testbed environments, a preprocessing phase is necessary before training the prediction model. For this analysis, the following preprocessing steps were applied:
- 1.
Dataset merging: Due to its large scale, the CICIoT2023 dataset is distributed across 169 separate CSV files, each containing a portion of the overall traffic. All files were merged into a single file to allow model training.
- 2.
Removing unnecessary columns: following the recommendations of Ferrag et al. (2022), the authors of the Edge-IIoTset dataset, features identified as irrelevant for the analysis or potentially introducing bias into the model were excluded. For instance, as noted above, features like ip.src_host, ip.dst_host, and the ARP protocol equivalents directly identify the source and destination devices in the network, enabling the classifier to memorise device identifiers rather than detecting anomalies in network behaviour. Similarly, frame.time must be excluded because if the attacks were carried out at a specific time, the model could associate certain timestamps with them, instead of learning network patterns. As an additional example, the mqtt.msg feature can include application-level data such as sensor readings or textual content that may directly reveal the attack class. Consequently, it could bias the model towards recognising specific payload patterns instead of protocol-level anomalies. The full set of excluded variables can be found in the code repository associated with this article.
- 3.
Removing constant columns: features with a single unique value across all records were removed, as they do not contribute to the model.
- 4.
Encoding categorical features: non-numeric features were transformed into numerical format following an ordinal encoding scheme.
- 5.
Handling duplicates and missing values: duplicate entries and records containing missing values were detected and eliminated. This step was particularly important in the CICIoT2023 dataset, where more than 22 million rows, representing almost half of the total, were removed.
- 6.
Detecting and removing identical columns: redundant features containing identical information were discarded.
- 7.
Data scaling: continuous features were log-transformed to reduce skewness and limit the impact of extreme values. This step is of particular importance for the PCA method, given its sensitivity to feature variance and magnitude. Specifically, PCA requires feature scaling, typically through standardisation. However, when features are highly skewed toward large values, standardisation alone may lead to distortions in variance, causing certain variables to dominate the principal components. The logarithmic transformation before standardisation mitigates this effect, improving the performance of the PCA models.
- 8.
Undersampling. This preprocessing step was applied only to the CICIoT2023 dataset, due to its significantly larger size, even after removing duplicate records. Moreover, CICIoT2023 dataset is extremely imbalanced, with classes containing several millions of records while others only a few thousands. To address both issues, a simple yet sensible rule-based undersampling strategy was implemented: those classes with fewer than 100,000 samples were preserved entirely, those with more than 100,000 but fewer than 500,000 were reduced to 60% of their original size, from 500,000 to 5 million they were reduced to 40%, and the extremely large class DDoS-ICMP_Flood, containing more than seven million records, was limited to 20% of its instances.
- 9.
Data splitting: for training and testing purposes, both datasets were split into proportions of 80/20, with stratification by attack type to preserve the class distribution across the training and test sets.
Experimental setup
To provide a fair comparison between the different DR methods, three feature rankings were first constructed based on the test, MI, and PFI criteria described in ‘Dimensionality Reduction Methods’. Similarly, PCA was applied to compute the set of principal components from the original feature space. Subsequently, an incremental evaluation was conducted for each method using a sequential forward selection strategy: at each step, one additional feature (or principal component), selected according to the corresponding ranking, was included in the RF model fitting process. Each model was constructed and evaluated in terms of accuracy, model size, and inference time following a hold-out validation scheme, with the training and testing sets specified in ‘Dataset Preprocessing’. In parallel, a Genetic Algorithm was employed on the training set to identify feature subsets that maximise model accuracy, which was estimated using cross-validation, and the resulting model was assessed on the test set using the same metrics. To reduce variability in the inference time measurements, the prediction step was repeated ten times on the test set, and the median value of all runs was recorded as the model inference time.
After completing this process, the selection of the best model produced by each method was based on its predictive power on the test set, determined by accuracy. Among the top-performing models, those that made the most efficient use of computational resources were preferred. Once the best models were identified, a more detailed evaluation of them was conducted using the precision, recall, and F1-score metrics defined in Eq. (2). Finally, the best models were deployed on a Raspberry Pi device, and assessed in terms of inference time and RAM usage during the prediction stage.
(2)
The original training and testing of models were conducted on high-performance machine equipped with 2x Intel Xeon Silver 4210 CPUs (10 cores, 2.2 GHz) and 96 GB of RAM, running Python 3.13.1, with Conda 24.11.2, Scikit-learn v1.4.2, Pandas v2.2.3, and NumPy v1.26.4. On the other hand, the resource-constrained Raspberry Pi device was equipped with an ARM Cortex-A72 processor (quad-core, 64-bit, 1.8 GHz) and 8 GB of RAM, running Python 3.10.16, with Conda 25.1.1, Scikit-learn v1.6.1, Pandas v2.2.3, and NumPy v1.24.3.
Numerical results
This section presents the numerical results obtained by applying the methodology described in ‘Experimental Setup’. It is important to emphasise that achieving a balance between between attack detection accuracy and resource consumption is key in the context of IoT systems. From a cybersecurity perspective, an attacker needs only one chance to succeed, highlighting the importance of maximising intrusion detection capabilities. However, if a model is overly complex, requiring significant storage, memory and compute cycles, it becomes difficult to deploy into resource-constrained environments.
Edge-IIoTset
This section presents the numerical results obtained by applying the techniques described in ‘Experimental Setup’ to the Edge-IIoTset dataset. Figure 1 illustrates that increasing the number of features included in the model leads to a convergence in accuracy among all methods, reaching approximately 98.9% in each case. On the other hand, Figs. 2 and 3 depict the corresponding prediction time model size for each approach, respectively. To facilitate a more detailed comparison, the selected models obtained by each method, including the one obtained via GA, are outlined in Table 2.
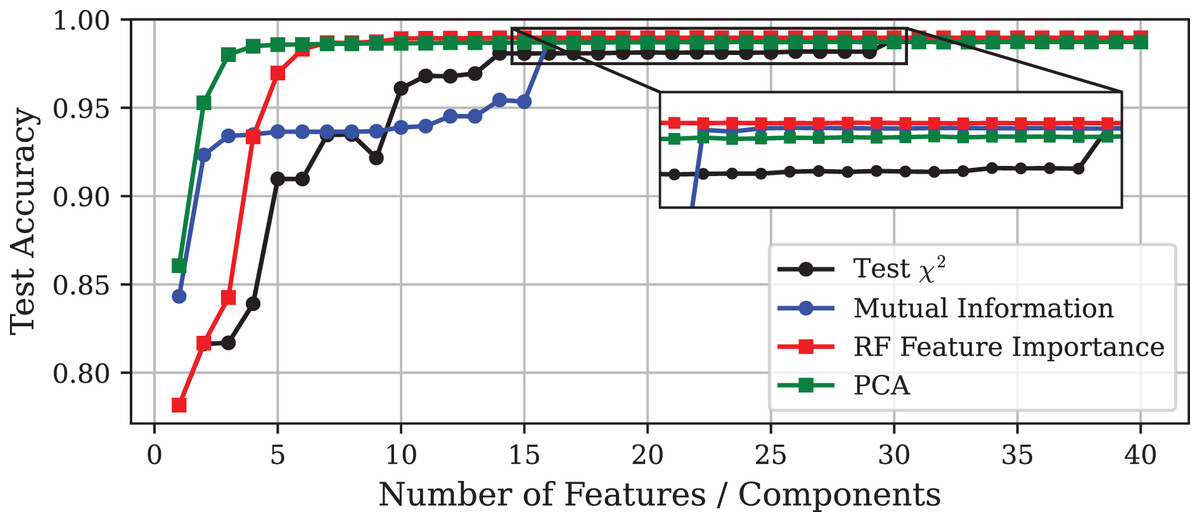
Figure 1: Test accuracy vs. number of features or principal components using different DR techniques on the Edge-IIoTset dataset.
The inset displays a zoomed-in view of the same curves, allowing a clearer visualisation of the small performance differences among the methods.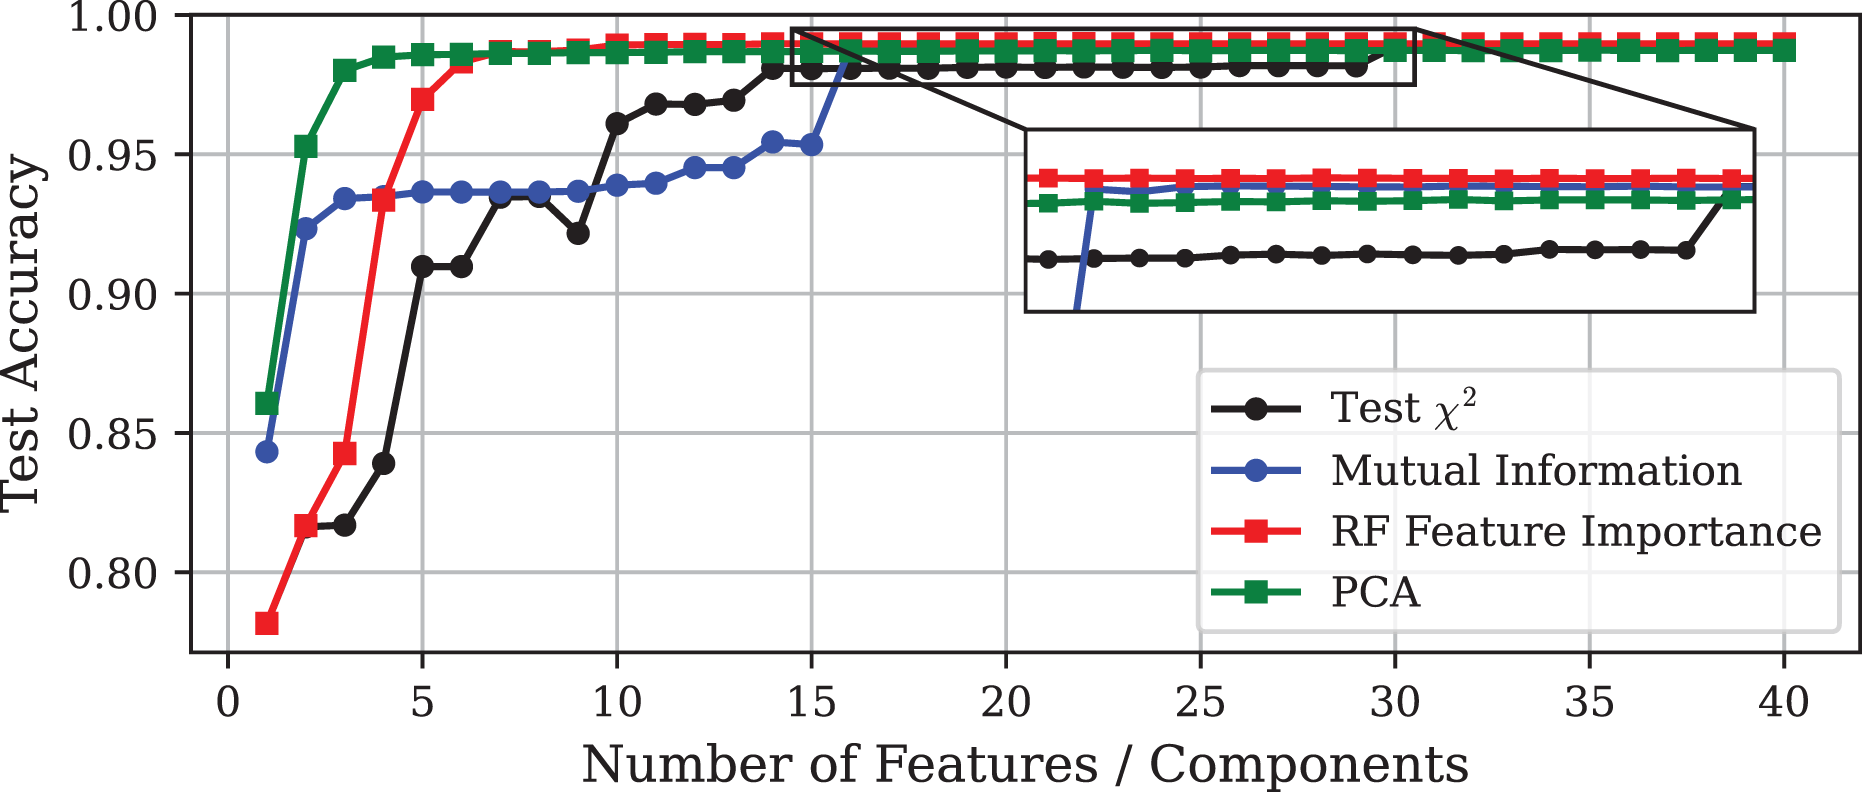
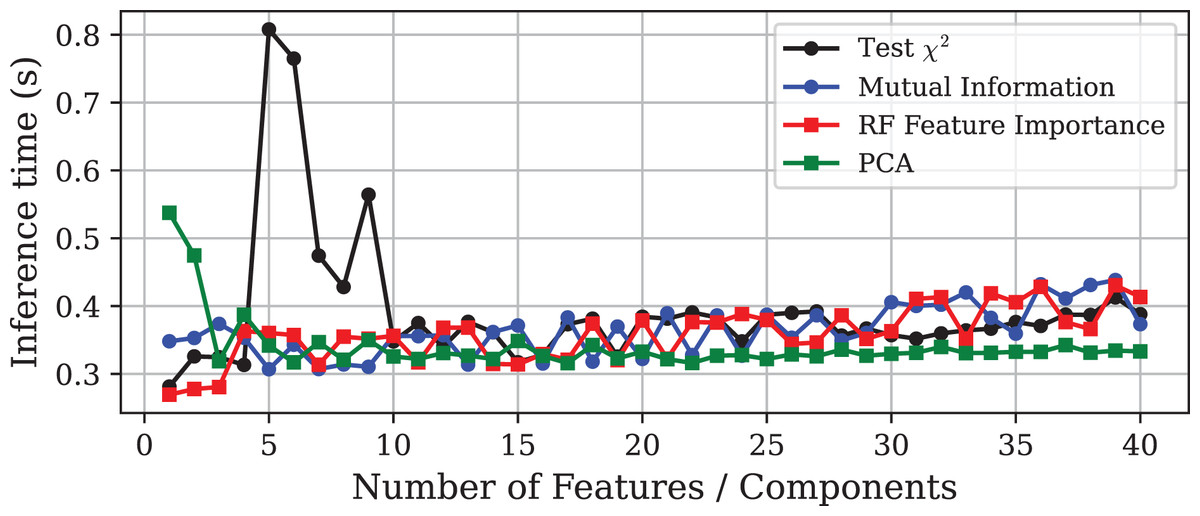
Figure 2: Prediction time vs. number of features or principal components using different DR techniques on the Edge-IIoTset dataset.
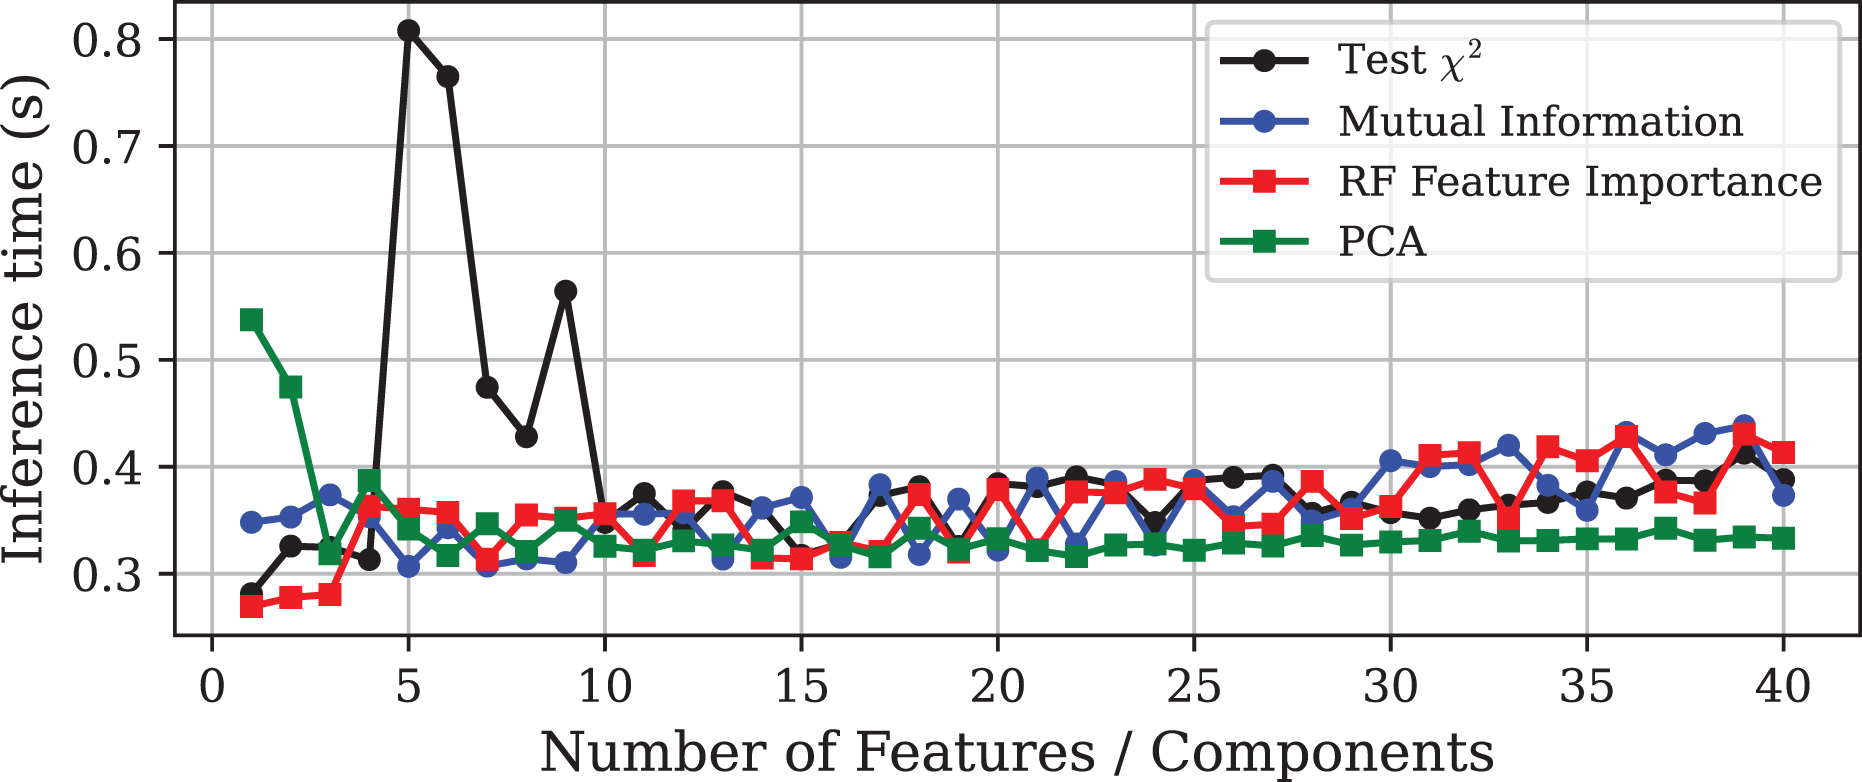
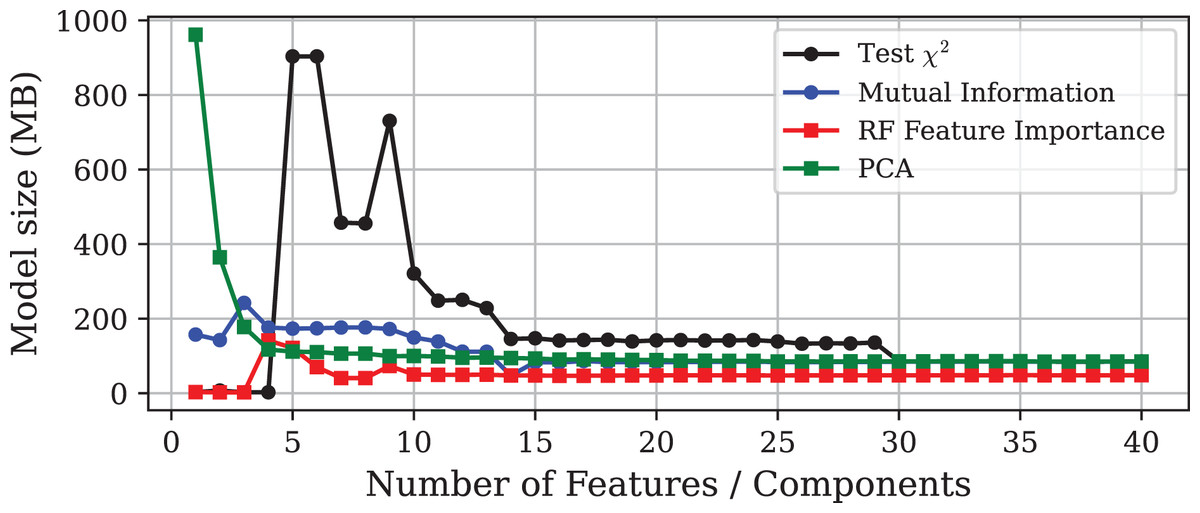
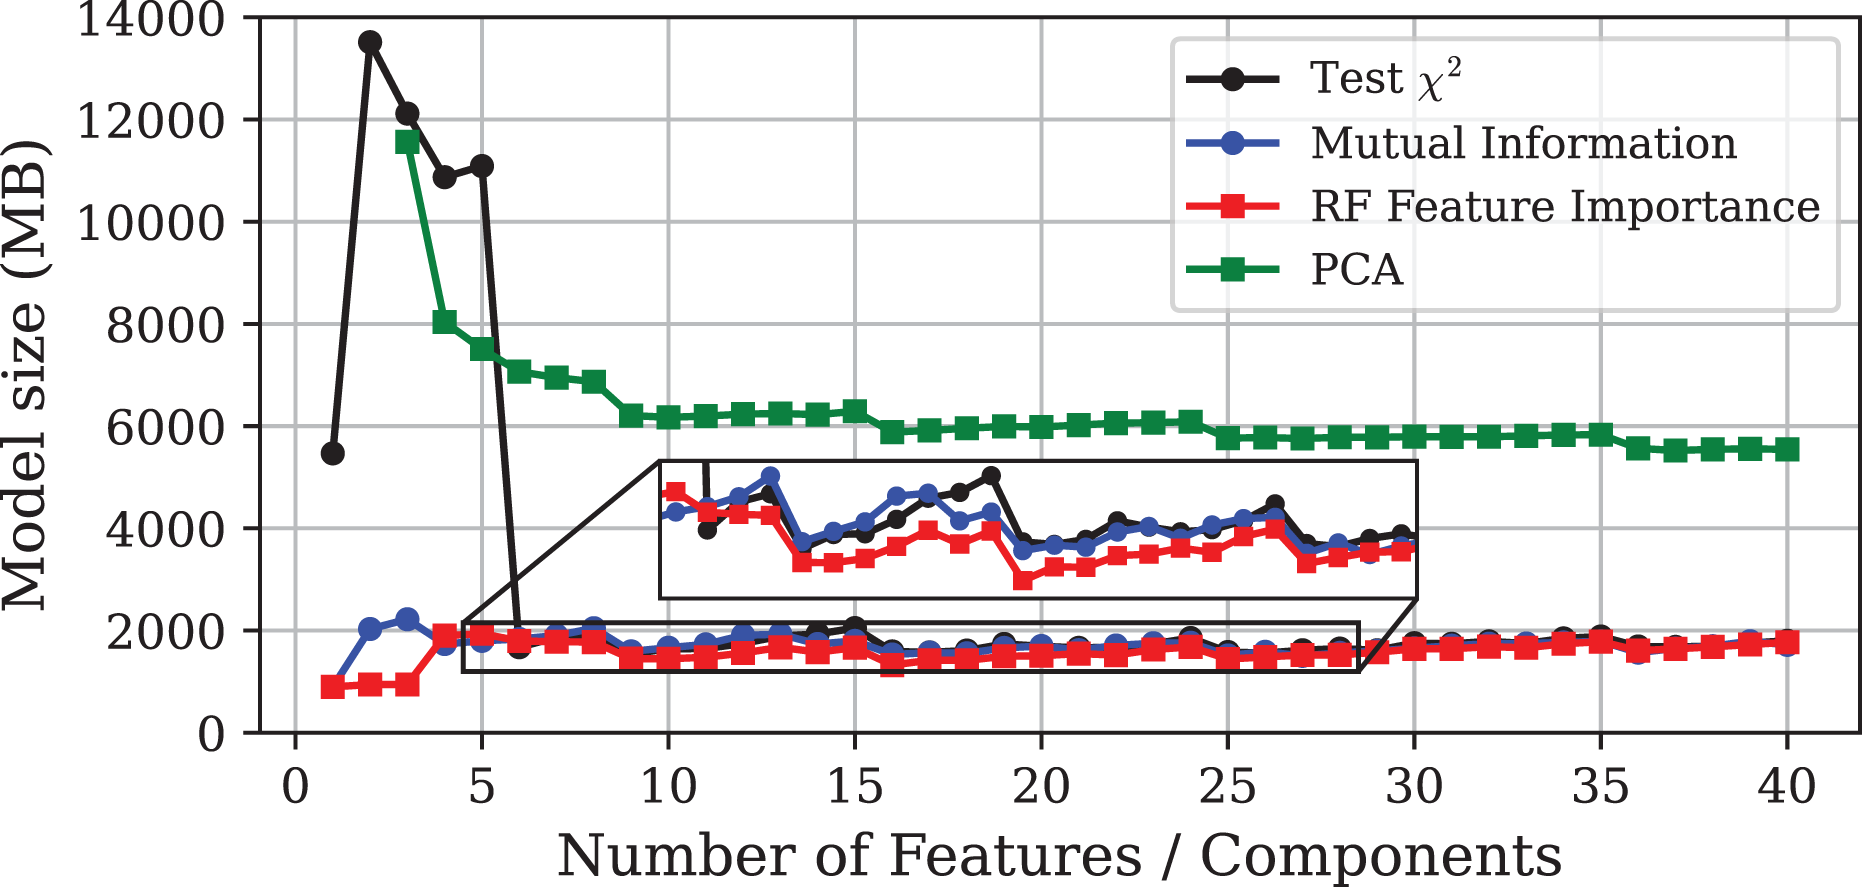
Figure 3: Model size vs. number of features or principal components using different DR techniques on the Edge-IIoTset dataset.
| DR method | #Feat. | Acc. | Prec. | Rec. | F1 | Size (MB) | Inf. Time (s) |
|---|---|---|---|---|---|---|---|
| Base RF | 43 | 98.87 | 98.87 | 98.87 | 98.87 | 85.61 | 0.451 |
| test | 31 | 98.88 | 98.88 | 98.88 | 98.88 | 85.41 | 0.352 |
| MI | 16 | 98.85 | 98.85 | 98.85 | 98.84 | 83.24 | 0.318 |
| RF-FI | 14 | 98.97 | 98.99 | 98.97 | 98.97 | 47.54 | 0.315 |
| PCA | 22 | 98.71 | 98.72 | 98.71 | 98.71 | 87.13 | 0.316 |
| GA | 39 | 98.96 | 98.99 | 98.96 | 98.96 | 48.20 | 0.420 |
The experiment demonstrates that models with similar performance in accuracy can differ significantly in terms of computational efficiency. It must be emphasised that the goal of DR should not be the minimisation of the final number of features, but rather to improve the predictive performance of the model to optimise the use of computational resources. In this light, Fig. 2 shows that, in general, inference time tends to increase slightly as more features are included in the model. Notable exceptions are the models obtained through PCA and the test. In the case of PCA, models trained with only one or two components exhibit very high inference times, although this stabilises at lower values as more components are added. More interesting is the case of the test, where the prediction time increases dramatically with the inclusion of the fifth feature, and then gradually decreases as more variables are incorporated to the model.
This unusual behaviour can be explained by the fact that the decision trees were fully grown and left unpruned. When the feature set is made up of features without enough discriminative power or includes contradictory patterns, the trees tend to grow deeper to separate the data, leading to a substantial increase in model complexity. As more features are considered, trees can find more useful and faster splits, reducing the need to grow as much. As a result, the trees are smaller, and the final model becomes lighter, even with more variables. This phenomenon exemplify the existence of ill-posed feature combinations, in the sense that they introduce instability or noise into the learning process, leading to unnecessarily complex models. Therefore, this finding suggests the existence of well-posed feature subsets capable of minimising resource demands while preserving predictive capability.
With respect to model size, Fig. 3 shows how it evolves as the dimensionality increases. The results are consistent with those observed for inference time, highlighting the pronounced increase in model size for -selected subsets before stabilising. Notably, while the test, Mutual Information (MI), and PCA methods produce models whose sizes stabilise around the baseline (85 MB), the models trained on subsets selected by PFI require only around 47 MB, resulting in a storage saving of approximately 45%.
Finally, as shown in Table 2, the feature subset obtained through Genetic Algorithm produces a model that is both compact and highly accurate, but slow in terms of inference time. This outcome is expected, as the objective of GA-based feature selection is to maximise accuracy without taking into account computational efficiency.
CICIoT2023
This section presents the results obtained on the CICIoT2023 dataset. In line with ‘Edge-IIoTset’, Figs. 4, 5 and 6 show the evolution of model performance for the -test, MI, PFI and PCA approaches in terms of accuracy, inference time, and model size, respectively. Similarly, Table 3 provides a more detailed comparison of the selected models. Overall, the results obtained are consistent with those observed for the Edge-IIoTset dataset. However, there are some relevant differences worthy of closer examination.
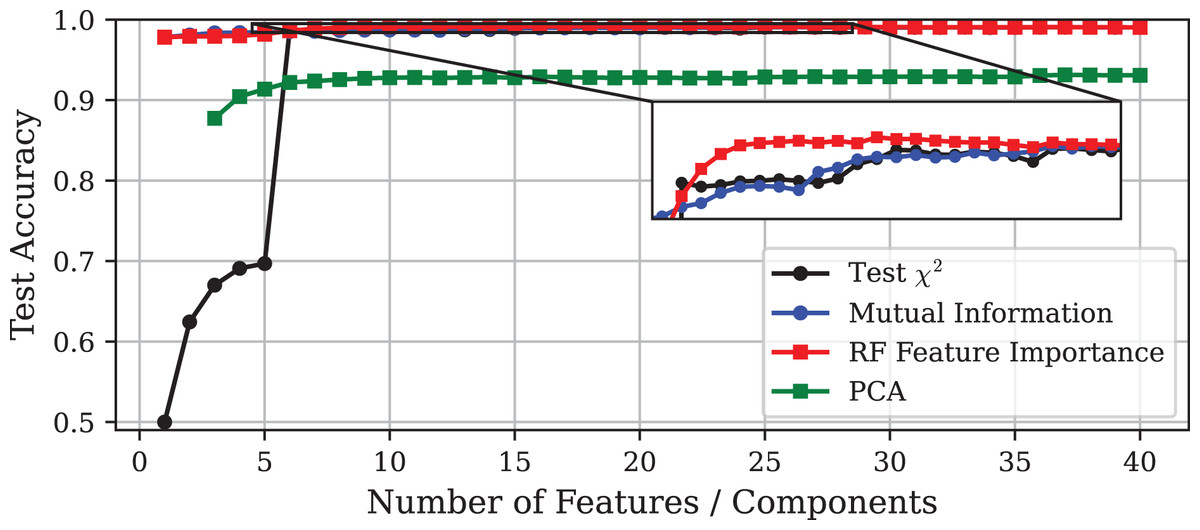
Figure 4: Test accuracy vs. number of features or principal components using different DR techniques on the CICIoT2023 dataset.
The inset displays a zoomed-in view of the same curves, allowing a clearer visualisation of the small performance differences among the methods.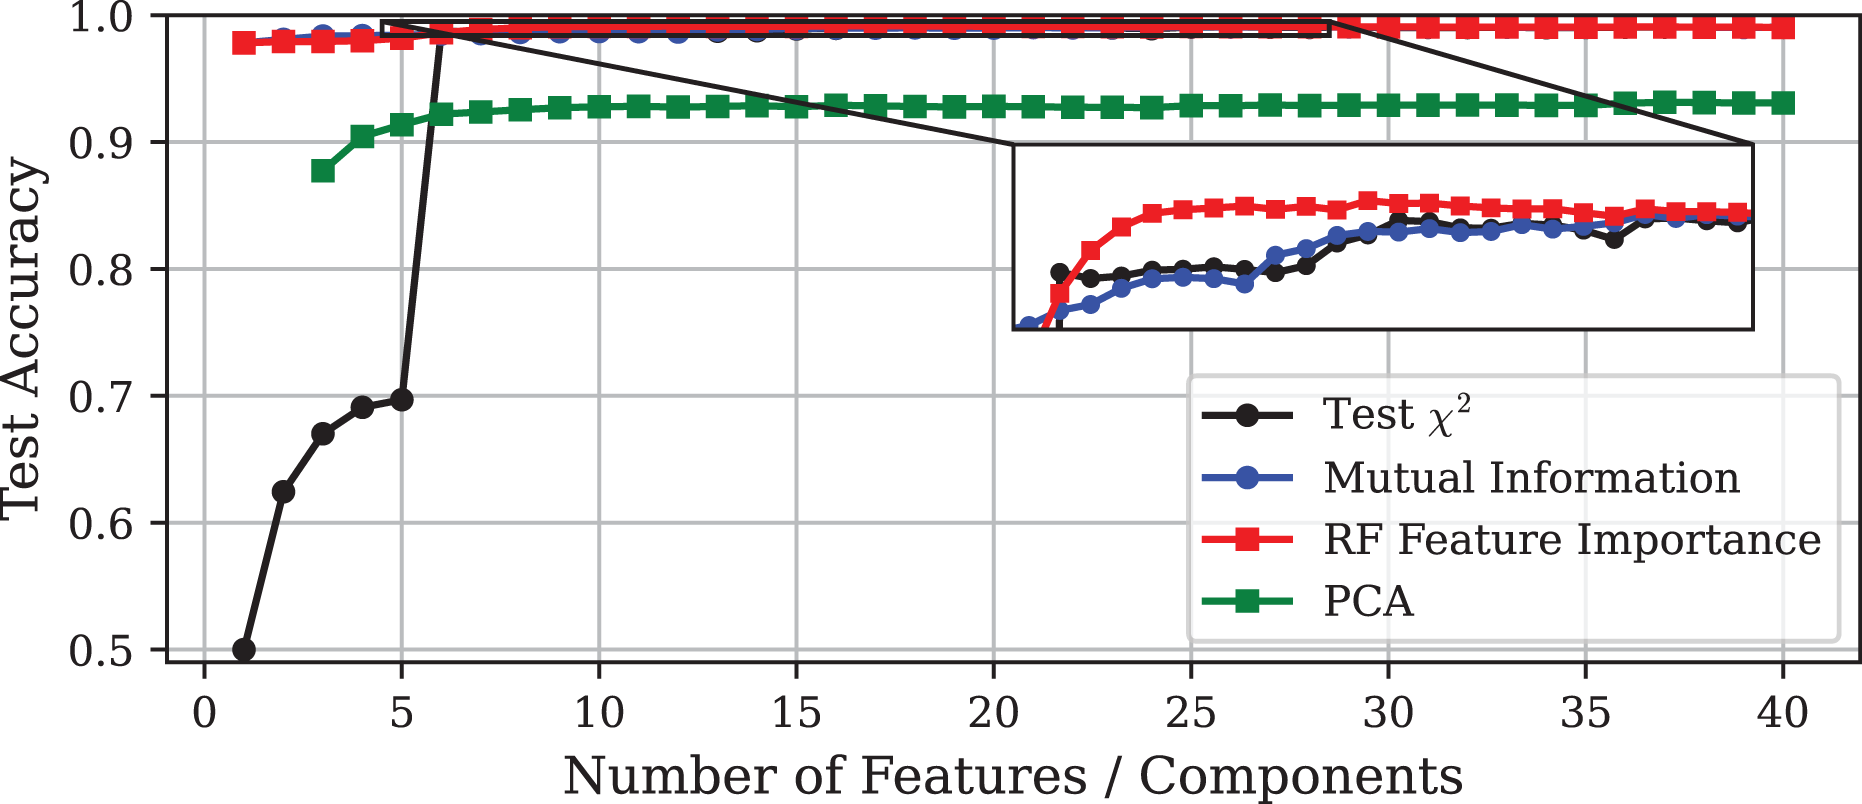
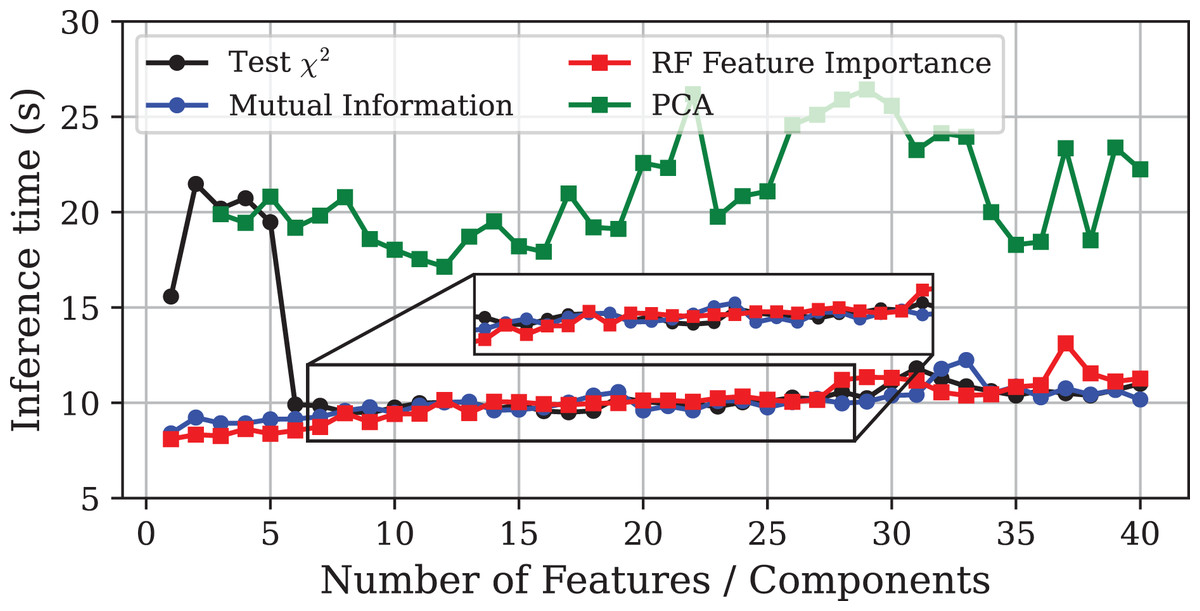
Figure 5: Inference time vs. number of features or principal components using different DR techniques on the CICIoT2023 dataset.
The inset displays a zoomed-in view of the same curves, allowing a clearer visualisation of the small performance differences among the methods.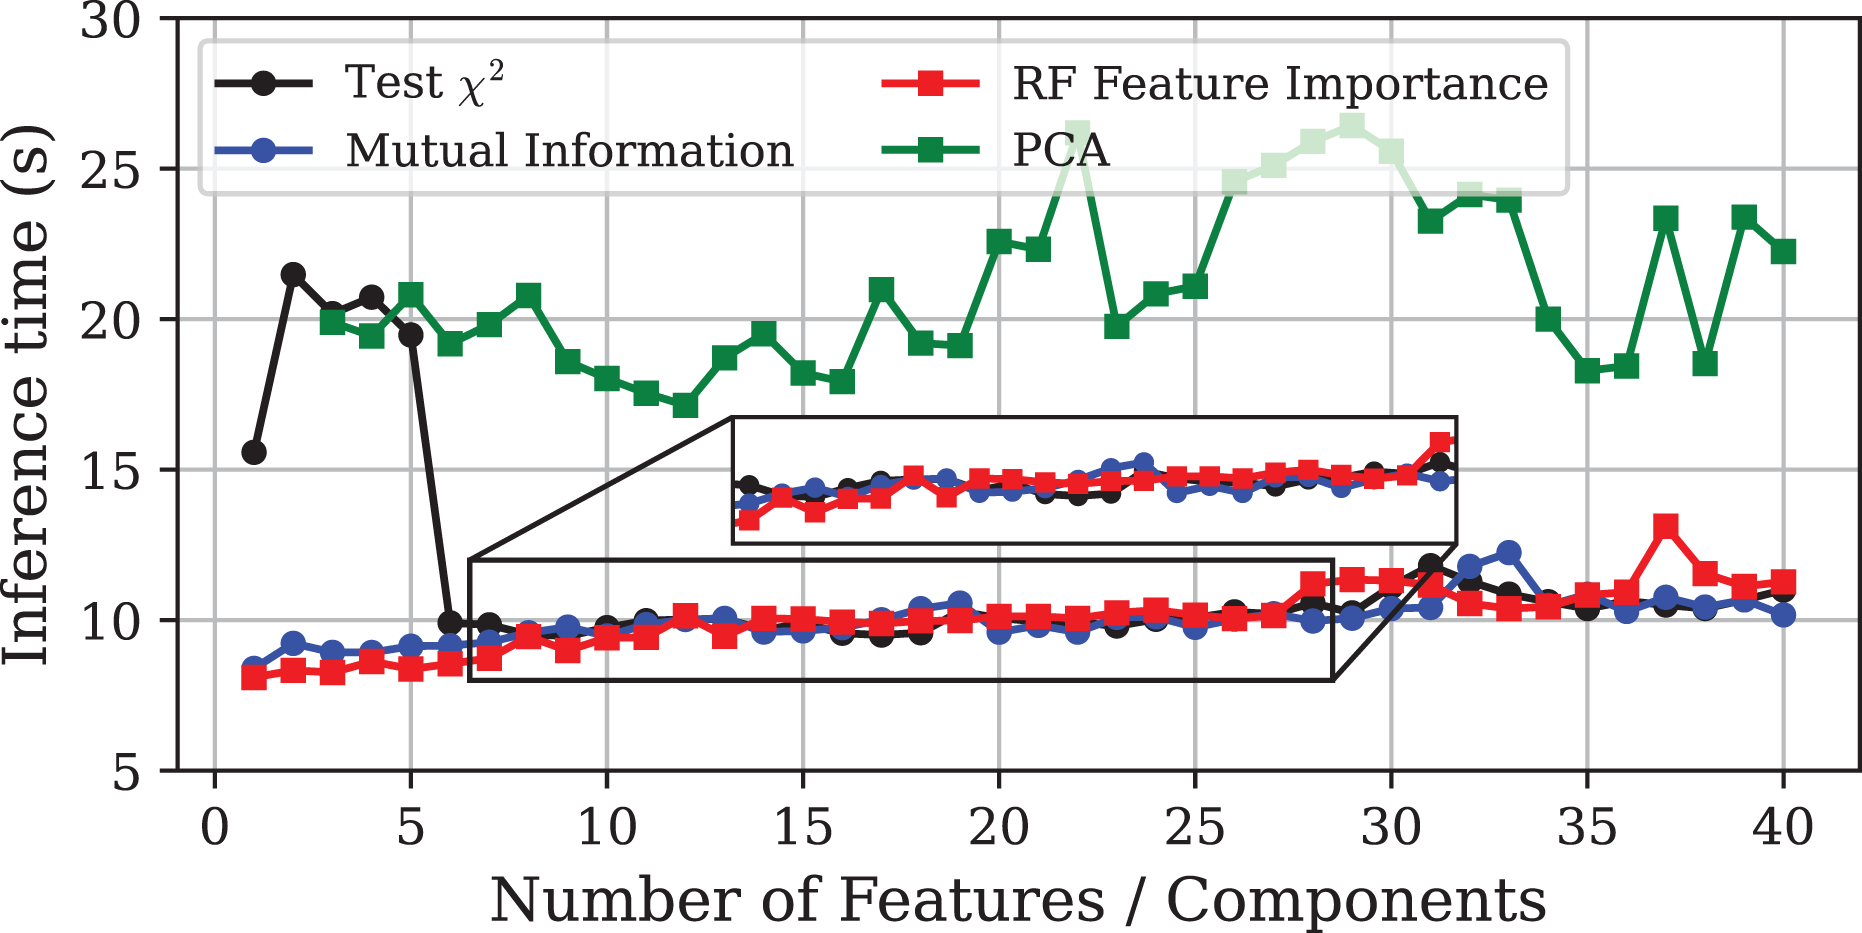
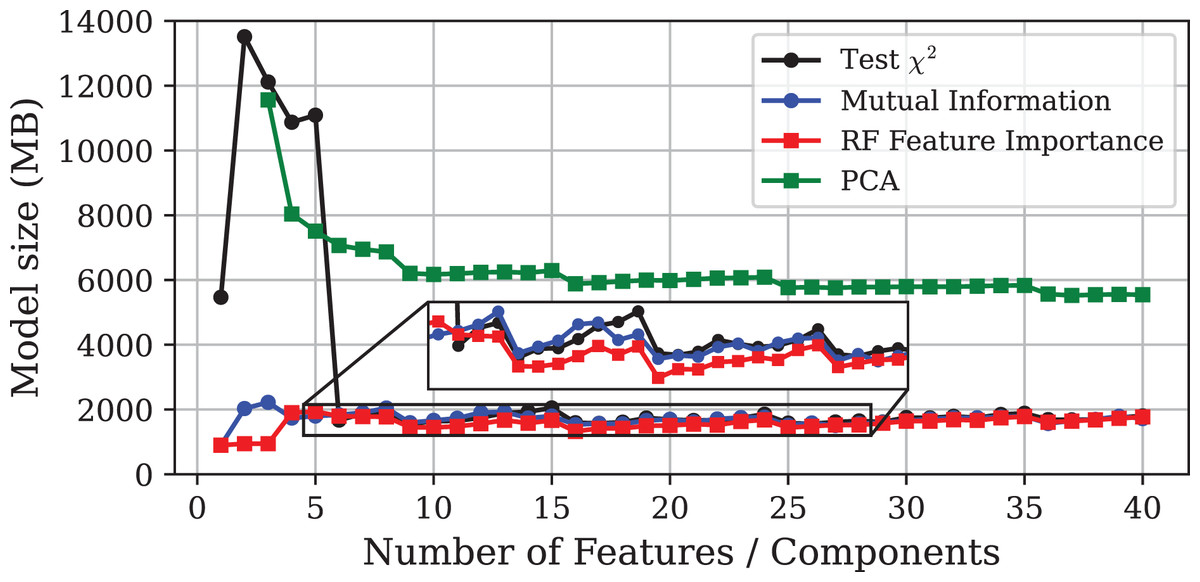
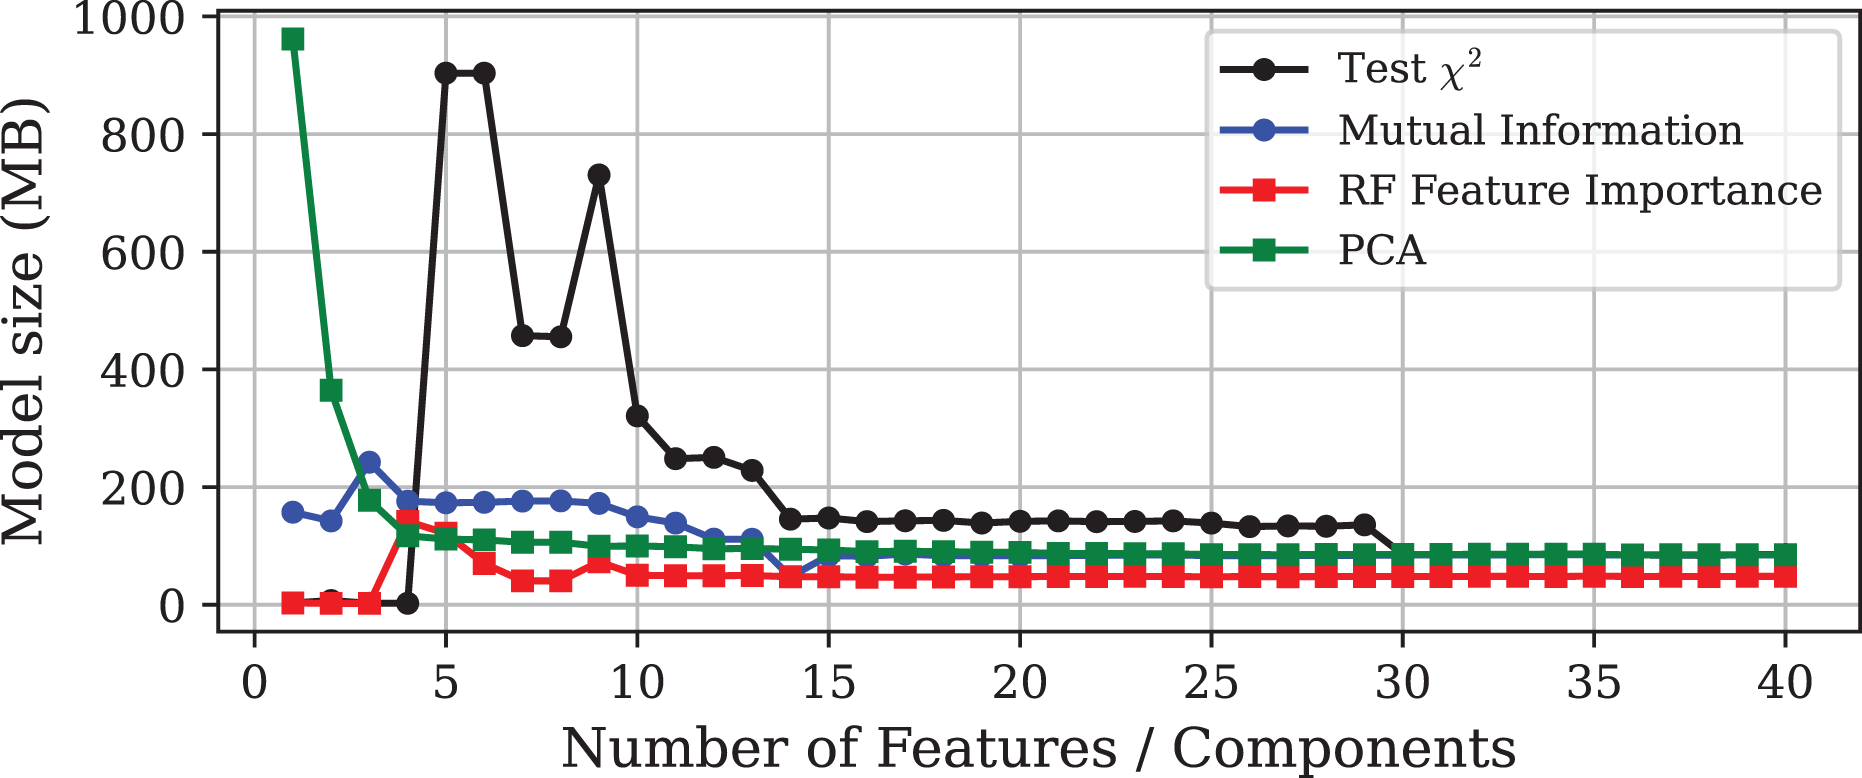
Figure 6: Model size vs. number of features or principal components using different DR techniques on the CICIoT2023 dataset.
| DR method | #Feat. | Acc. | Prec. | Rec. | F1 | Size (MB) | Inf. time (s) |
|---|---|---|---|---|---|---|---|
| Base RF | 44 | 99.06 | 99.04 | 99.06 | 99.03 | 1,750.6 | 11.96 |
| test | 25 | 99.06 | 99.04 | 99.06 | 99.04 | 1,579.3 | 10.08 |
| MI | 25 | 99.08 | 99.07 | 99.08 | 99.06 | 1,511.9 | 9.76 |
| RF-FI | 10 | 99.11 | 99.10 | 99.11 | 99.10 | 1,447.0 | 9.42 |
| PCA | 12 | 92.76 | 92.75 | 92.76 | 92.68 | 6,234.6 | 17.14 |
| GA | 20 | 99.13 | 99.12 | 99.13 | 99.12 | 1,576.4 | 9.63 |
The most notable discrepancy is the poor performance of the PCA method. PCA-based models exhibit a substantial decrease in accuracy compared to the other approaches, while requiring twice the inference time and four times more storage. Furthermore, due to the high computational cost, it was not possible to train models using only one or two principal components, even when using high-performance hardware.
A possible explanation for the poor performance of PCA could be the dominance of the Inter-Arrival Time (IAT) feature, which appears to provide most of the discriminative information. This is supported by the fact that both MI and PFI methods ranked IAT as the most relevant feature, leading to models that reach around 98% accuracy using IAT alone. In the same line, the -test approach identified IAT as the sixth feature in relevance, and its inclusion led to a nearly 30-point gain in accuracy, along with substantial reductions in inference time and model size. Since PCA constructs components that capture global variance without regard to class labels, it tends to combine IAT with other features in the first few components. This transformation may dilute the discriminative power of IAT, resulting in the model failing to produce accurate results.
Beyond the specific behaviour of PCA, a general increase in model sizes and inference times was observed. This is to be expected, as CICIoT2023 is significantly larger and more complex than Edge-IIoTset. Furthermore, the test set, representing 20% of the dataset, was considerably larger in this experiment, naturally leading to longer inference times. Nonetheless, the relative performance of the different methods remained consistent with the results obtained for Edge-IIoTset. Once again, PFI produced the most balanced models in terms of predictive power and resource consumption. The GA also delivered satisfactory results, yielding the most accurate model while maintaining a low inference time.
Performance on Raspberry Pi
While the previous analyses focused on the predictive performance and computational requirements of the models in a high-performance environment, it is also important to evaluate their behaviour on resource-constrained devices, representative of real IoT networks. To this end, a Raspberry Pi was used to assess the practical feasibility of deploying the selected models. The evaluation focused on two key metrics: inference time and RAM usage. To ensure measurement stability, each model was executed ten times. Results are presented in Tables 4 and 5 for the Edge-IIoTset and the CICIoT2023 datasets, respectively. The reported values include the mean, median, standard deviation, and 95% confidence interval for both metrics. Given the large size of the CICIoT2023 test set, it was necessary to subsample it for use on the Raspberry Pi. Specifically, 10% of the set was retained using stratified sampling to preserve the original class distribution. Despite this consideration, due to its large memory footprint, the PCA-based model could not be executed on the Raspberry Pi for the CICIoT2023 dataset. In line with previous experiments, the models selected using the PFI were found to be the fastest and most efficient in terms of RAM usage. For the Edge-IIoTset dataset, inference time was reduced by approximately 8%, and RAM consumption decreased by about 5%. Interestingly, although the PCA model used slightly less RAM, it was the slowest to execute. This, combined with its lower accuracy, made the PFI model preferable. In the case of the CICIoT2023 dataset, the improvements were even more significant, with reductions of around 11% in inference time and 28% in RAM usage. This improvement is particularly relevant, as it represents nearly 1GB of memory savings on device equipped with only 8 GB of RAM. To strengthen the validity of these findings, ANOVA tests followed by multiple comparison analyses were conducted for both metrics and datasets. The results confirmed that the differences observed among considered methods were statistically significant, with p-values ranging from to in the multiple comparisons tests. Full details of the analysis are available in the public GitHub repository linked to this article. Finally, the selected models were significantly more compact, with model sizes reduced by 45% on Edge-IIoTset and by 18% on CICIoT2023, respectively. These improvements facilitate practical deployment in real-world IoT networks, where storage and memory constraints are often limiting factors.
| Method | Inference time (s) | RAM usage (MB) | ||||||
|---|---|---|---|---|---|---|---|---|
| Mean | Median | SD | 95% CI | Mean | Median | SD | 95% CI | |
| Base RF | 2.458 | 2.458 | 0.022 | [2.442–2.474] | 757.88 | 757.90 | 0.06 | [757.8–757.9] |
| test | 2.423 | 2.426 | 0.009 | [2.417–2.429] | 811.99 | 813.51 | 4.22 | [809.0–815.0] |
| MI | 2.365 | 2.362 | 0.011 | [2.357–2.373] | 786.87 | 786.86 | 2.52 | [785.1–788.7] |
| PFI | 2.235 | 2.235 | 0.006 | [2.230–2.239] | 719.92 | 719.94 | 2.79 | [717.9–721.9] |
| PCA | 2.520 | 2.522 | 0.015 | [2.510–2.531] | 696.13 | 696.14 | 0.04 | [696.1–696.2] |
| GA | 2.307 | 2.304 | 0.018 | [2.294–2.319] | 756.52 | 755.41 | 2.47 | [754.8–758.3] |
| Method | Inference time (s) | RAM usage (MB) | ||||||
|---|---|---|---|---|---|---|---|---|
| Mean | Median | SD | 95% CI | Mean | Median | SD | 95% CI | |
| Base RF | 6.938 | 6.959 | 0.147 | [6.833–7.043] | 3,544.3 | 3,545.7 | 3.16 | [3,542–3,547] |
| test | 6.610 | 6.632 | 0.089 | [6.547–6.674] | 2,987.1 | 2,987.8 | 3.54 | [2,985–2,989] |
| MI | 6.643 | 6.617 | 0.140 | [6.542–6.743] | 2,904.2 | 2,905.7 | 4.04 | [2,901–2,907] |
| PFI | 6.164 | 6.139 | 0.112 | [6.084–6.244] | 2,546.4 | 2,547.61 | 2.96 | [2,544–2,549] |
| PCA | NA | NA | NA | NA | NA | NA | NA | NA |
| GA | 6.572 | 6.606 | 0.166 | [6.453–6.691] | 2,888.6 | 2,888.6 | 3.94 | [2,886–2,891] |
Conclusions and future work
In this study, the effectiveness of various DR strategies for the development of compact and efficient RF models for securing IoT environments was evaluated. The analyses were conducted using two comprehensive IoT datasets, Edge-IIoTset and CICIoT2023, both of which contain real network traffic and a wide variety of attack scenarios. Among the methods considered, PFI produced the most balanced models in terms of predictive performance and resource efficiency. Finally, the feasibility of deploying the selected models was demonstrated through experiments on a resource-constrained Raspberry Pi device. The key findings of the work include the following:
The experimental results revealed substantial differences among the assessed DR techniques, particularly in terms of computational efficiency. Both PFI and GA significantly outperformed the baseline models, with PFI producing slightly faster and more compact results. In contrast, PCA exhibited inconsistent behaviour: when the dataset structure was favourable, it rapidly converged to accurate low-dimensional models; however, in the CICIoT2023 dataset, it produced unreliable models that underperformed across all metrics.
The best trade-off between predictive performance and computational efficiency was achieved through the PFI method in both datasets. For the Edge-IIoTset dataset, the number of features was reduced from 43 to 14, while accuracy was slightly improved. This led to reductions of 45%, 8%, and 5% in model size, inference time, and RAM usage, respectively. Similar benefits were observed on the CICIoT2023 dataset, with improvements of 18% in model size, 11% in inference time, and 28% in RAM usage, the latter being of particular relevance given the typical resource constraints of IoT devices.
The evolution of inference time and model size observed in the models fitted according to the -based ranking in the Edge-IIoTset dataset highlights the existence of ill-posed feature subsets, in the sense that they introduce instability or noise into the learning process, resulting in unnecessarily complex models despite improvements in accuracy. This finding suggests the potential existence of well-posed feature subsets that could further minimise resource consumption while maintaining predictive performance
Despite the robustness of the results, some limitations must be acknowledged. First, despite efforts to reduce its variability, inference time cannot be measured with absolute precision, and small variations may occur across runs. However, across multiple executions, these minor differences have not been found to affect the reported results. Second, the computational performance observed may depend on the specific hardware used, potentially affecting the generalisability of the results to other resource-constrained devices. Finally, the DR process itself must be performed offline, as it involves training multiple models and therefore requires substantial computational resources. However, since the simplification of the final models significantly reduces resource demands, on-device retraining or model updating becomes closer to feasibility.
To sum up, the presented numerical results and discussion demonstrate that the focus of the DR process should not be on minimising the number of features, but on enhancing the overall efficiency and deployability of AI models on resource-constrained devices. In this line, future research will aim to develop strategies for effectively identifying those feature subsets that minimise resource usage while preserving predictive performance. Additionally, alternative data representations, such as sparse and dense matrix formulations or vector pooling techniques, will be explored to further improve the efficiency of lightweight IDS. Furthermore, future work will seek to apply the findings presented in this article to practical IoT deployments in rural areas, where computational resources are particularly scarce. To this end, we plan to extend the experimental evaluation to low-power hardware platforms such as ESP32 and STM32, assessing their suitability for real-time intrusion detection.