Study on slurry mass concentration prediction method driven by multi-source data fusion
- Published
- Accepted
- Received
- Academic Editor
- Xiangjie Kong
- Subject Areas
- Algorithms and Analysis of Algorithms, Artificial Intelligence, Data Mining and Machine Learning, Theory and Formal Methods
- Keywords
- Infrared transmitted light intensity, Differential pressure, Slurry mass concentration, Multi-source data fusion, Decaying regularization
- Copyright
- © 2026 Wang et al.
- Licence
- This is an open access article distributed under the terms of the Creative Commons Attribution License, which permits unrestricted use, distribution, reproduction and adaptation in any medium and for any purpose provided that it is properly attributed. For attribution, the original author(s), title, publication source (PeerJ Computer Science) and either DOI or URL of the article must be cited.
- Cite this article
- 2026. Study on slurry mass concentration prediction method driven by multi-source data fusion. PeerJ Computer Science 12:e3512 https://doi.org/10.7717/peerj-cs.3512
Abstract
In coal preparation processes, slurry mass concentration is a critical parameter affecting key operations such as dense medium separation, flotation, and thickening/filtration. Variations in slurry mass concentration directly impact equipment efficiency and product quality, making accurate prediction vital for intelligent coal preparation and process optimization control. However, traditional offline detection methods are constrained by lengthy measurement cycles and sluggish response times, which fail to satisfy the requirements of real-time monitoring. Existing online detection techniques primarily measure slurry volumetric concentration but exhibit reduced accuracy owing to variations in particle true density and physical characteristics, leading to inadequate robustness. Therefore, integrating multiple detection modalities for online prediction of slurry mass concentration has become an effective approach to enhance measurement accuracy and prediction stability. This article proposes a multivariate-fusion, data-driven method for slurry mass concentration prediction based on optical intensity (5/50/200 mW) and differential pressure. An Adaptive Regularization and Initialization-based Incremental Constructive Algorithm (ARI-ICA) model with improved nonlinear feature mapping is employed, in which an adaptive node-generation mechanism and gradually decaying regularized regression are introduced to predict the slurry volumetric concentration and true particle density from the optical-intensity and differential-pressure signals, after which the slurry mass concentration is computed via the governing physical relation. Parameter ranges settings: residual-driven weight sampling interval [0.05E, 1.0E] (best); regularization-decay grid [0.90, 0.95, 0.99] (best 0.99). The study comprises >160 samples (70/30 train/test). This fusion not only enhances feature representation and robustness against sensor noise but also ensures physical consistency through the intrinsic correlations between optical absorption, flow resistance, and slurry density. The model leverages adaptive feature node generation and regularized regression techniques to capture nonlinear input-output relationships under limited sample conditions, thereby mitigating overfitting risk while preserving model sparsity and interpretability. In this study, the proposed method achieves a root mean square error (RMSE) of 0.121, a coefficient of determination (R2) of 0.930, and a mean absolute error (MAE) of 0.080 for slurry mass concentration prediction, all outperforming the comparative models and greatly enhancing the accuracy and real-time capability of slurry mass concentration soft sensing, indicating significant potential for industrial applications.
Introduction
Coal is China’s primary energy source and a critical raw material for the chemical industry, playing a pivotal role in the national economy (Ramudzwagi, Tshiongo-Makgwe & Nheta, 2022). With the rapid development of the coal industry and continuous advances in processing technology, slurry mass concentration has become a critical process parameter that directly affects fine coal separation, medium density control, reagent dosing, and dewatering efficiency, ultimately impacting system energy consumption and resource utilization efficiency. Thus, accurate and stable measurement of slurry mass concentration is crucial for enhancing production efficiency, guaranteeing product quality, and minimizing resource waste.
However, due to the highly coupled solid–liquid phases and dynamic changes in particle concentration within slurry systems, mass concentration is difficult to measure directly and online. Traditional offline measurement methods such as drying and volumetric flask techniques suffer from delayed response and cumbersome operation, making them inadequate for the real-time control needs of modern coal preparation processes. Current mainstream online detection techniques, including radiometric, photoelectric, and differential pressure methods, generally measure only slurry volumetric concentration signals. While these approaches can track concentration trends to some extent, their measurement accuracy is often compromised by physical factors such as variations in particle true density, optical absorption characteristics, and particle distribution. This leads to poor system robustness, significant error fluctuations, and the need for frequent recalibration during long-term operation. Furthermore, we carried out experimental cross-validation across four representative online slurry-concentration measurement techniques—ultrasonic, radiometric, photoelectric, and differential-pressure—and observed the following: ultrasonic sensing is highly dependent on probe design and calibration and is easily disturbed by entrained bubbles; radiometric methods entail radiation hazards and are sensitive to particle size distribution and composition, with high cost and maintenance burdens; photoelectric methods are susceptible to nonuniform particle sizes and bubbles and exhibit a limited dynamic range; and differential-pressure sensing is constrained by density fluctuations and particle heterogeneity. Consequently, single-sensor solutions lack robustness and accuracy under complex operating conditions and cannot meet real-time control requirements; multi-source fusion is therefore preferable. Therefore, there is an urgent need to develop a high-accuracy and stable slurry mass concentration detection and prediction method that enables online measurement through multi-source data fusion, to meet the pressing demands for automation and intelligent control in modern coal preparation processes (Huang et al., 2025). Recent computational fluid dynamics (CFD) studies emphasize that the rheological response of concentrated mineral slurries—governed by solids loading, particle-size distribution, and flocculation state—directly controls pipeline transport efficiency, energy consumption, and wear, particularly in backfill systems (Wang et al., 2024). In parallel, online characterization has advanced rapidly, spanning infrared laser spectroscopies, tomographic, and chemometrics- or machine learning (ML)-driven analytics, enabling inline quantification of solids content and rheological indices under industrial solids loadings (Scott, 2022).
To address the aforementioned challenges, this article proposes a soft sensing modeling approach for slurry mass concentration that integrates light intensity and differential pressure signals. Specifically, optical and differential pressure sensors are utilized to capture the particle distribution state and fluid resistance changes in the slurry, respectively. An improved nonlinear feature mapping Adaptive Regularization and Initialization-based Incremental Constructive Algorithm (ARI-ICA) model is developed through the introduction of an adaptive node generation mechanism and progressively decaying regularized regression. Overfitting-control design of ARI-ICA: We implement residual-aligned constructive growth with a cosine-squared geometric constraint and a dynamic threshold: , a residual-scaled sampling range for candidate weights decaying ridge regularization at the readout ( , ); and early stopping when no candidate passes the threshold. These mechanisms keep the network compact and bias the solution toward simpler hypotheses under limited samples, which effectively reduces model complexity and improves interpretability (Kaushal & Tomita, 2002). This enables nonlinear modeling and high-accuracy prediction of two critical intermediate variables: slurry volumetric concentration and true particle density.
Furthermore, based on the mass conservation principle for solid-liquid systems, the predicted intermediate variables are transformed into the final slurry mass concentration using known physical equations, achieving real-time estimation of this parameter that cannot be directly measured online. This method not only fully leverages easily accessible online signals but also effectively combines data-driven modeling with domain knowledge, enhancing the model’s interpretability and generalization capability. It thus provides both a theoretical foundation and engineering support for intelligent monitoring and control of slurry concentration (Tripathy & Das, 2022). Finally, a browser/server (B/S) architecture–based slurry mass concentration prediction system driven by multi-source data fusion was developed, in which the proposed method is embedded in the back-end to enable real-time monitoring and analysis of slurry mass concentration.
Coal preparation process and problem description of slurry mass concentration measurement
Abbreviations and acronyms coal preparation process
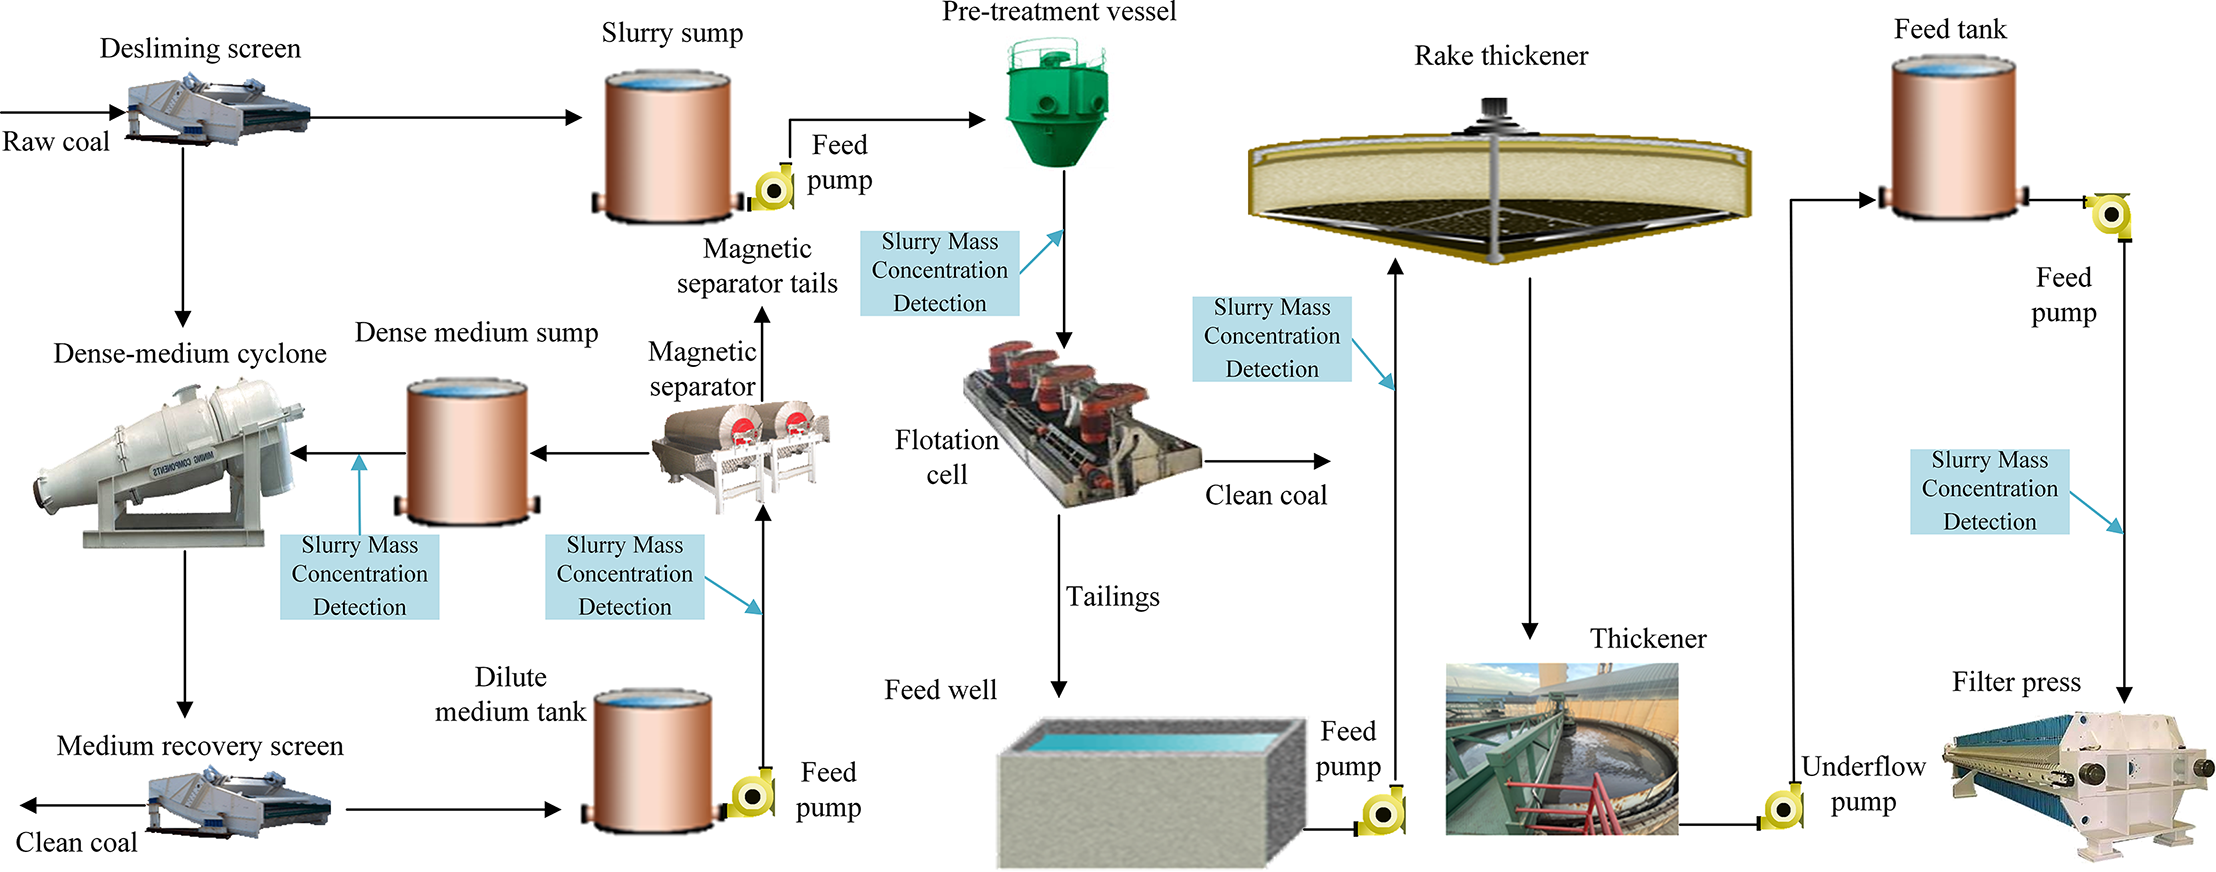
In the coal preparation process, slurry mass concentration serves as a core control variable that permeates the entire flowsheet and exerts a decisive influence on key unit operations such as dense-medium cyclone separation, magnetic recovery, flotation, and thickening/filtration. As illustrated in Fig. 1, from raw coal pretreatment through dense-medium separation, magnetic-medium recovery, flotation, thickening, filtration, and water recycling, the operational stability and product quality of each stage depend directly on the accurate regulation of slurry concentration. In dense-medium separation, the separation precision is governed by the medium density, which is itself determined by the feed slurry mass concentration; maintaining a stable concentration is therefore essential for stabilizing the separation interface and achieving the desired clean-coal ash content. During magnetic recovery, excessively high feed concentration increases slurry viscosity and promotes particle agglomeration, thereby elevating tailings grade and constraining processing capacity, whereas excessively low concentration reduces recovery per unit volume and may lead to losses of magnetic medium (Lv et al., 2022). Thus, the feed concentration must be maintained within an optimal range to balance recovery rate, product yield, and throughput.
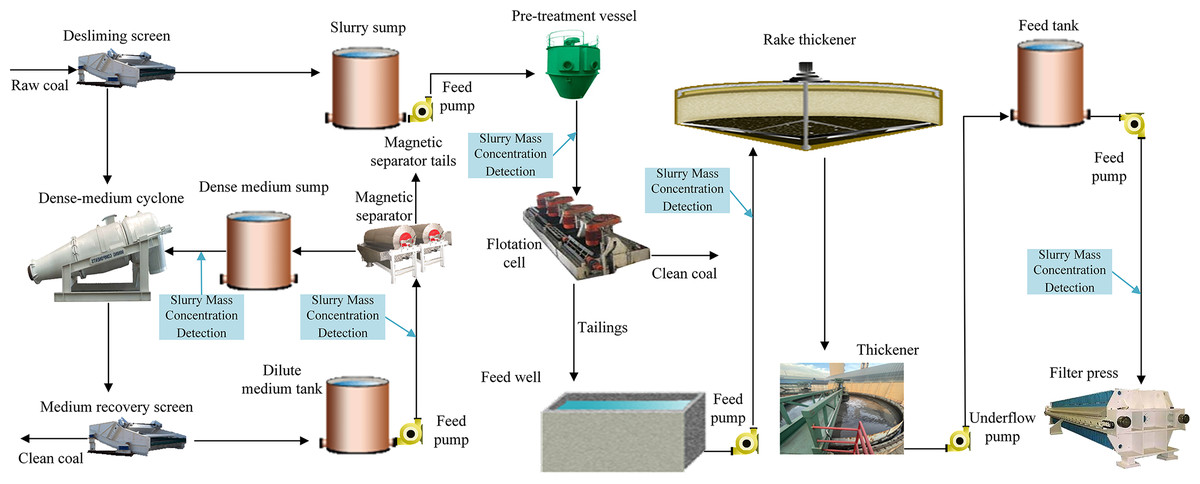
Figure 1: Coal preparation process flow diagram.
Within the flotation circuit, slurry concentration directly affects collector dispersion, hydrophobic agglomeration, and the probability of effective bubble–particle collisions, thereby determining flotation selectivity and clean-coal recovery. In the subsequent thickening and filtration stages, slurry mass concentration becomes the dominant factor controlling dewatering performance: insufficient concentration results in slow settling and turbid overflow, while overly high concentration impairs flocculant dispersion and deteriorates thickening efficiency; in filtration, low feed concentration prolongs filter cake formation and decreases dewatering efficiency. Overall, slurry mass concentration governs medium density, separation stability, flotation response, and dewatering performance, and is tightly coupled with pump speed, dilution water addition, and reagent dosing. It therefore represents a fundamental parameter for coordinating product quality and energy efficiency and for ensuring the stable and efficient operation of the entire coal preparation process.
Problem description of slurry mass concentration measurement in coal preparation
At coal preparation plants, real-time monitoring of feed slurry mass concentration is essential to ensure stable operation of key process stages. However, the commonly utilized manual measurement methods typically involve multiple steps such as settling, filtering, drying, and weighing, which suffer from poor sampling representativeness, long detection cycles, and delayed experimental outcomes (Bamberger & Greenwood, 2004).
For example, in the dense medium cyclone and magnetic separator feed stages, manually determining slurry mass concentration cannot promptly capture fluctuations, making it difficult to detect and correct issues such as unstable separation density limits and medium losses in time. In the flotation feed process, the low frequency of manual sampling cannot dynamically guide the appropriate dosing and distribution of flotation reagents, negatively impacting dispersion performance and clean coal recovery. For thickeners, manual measurement of feed concentration is susceptible to disturbances such as slurry stratification, leading to imprecise control of flocculant and coagulant dosing, which affects settling and separation efficiency. Similarly, fluctuations in filter press feed concentration are difficult to detect and adjust promptly through manual inspection, reducing filter cake formation efficiency and dewatering performance.
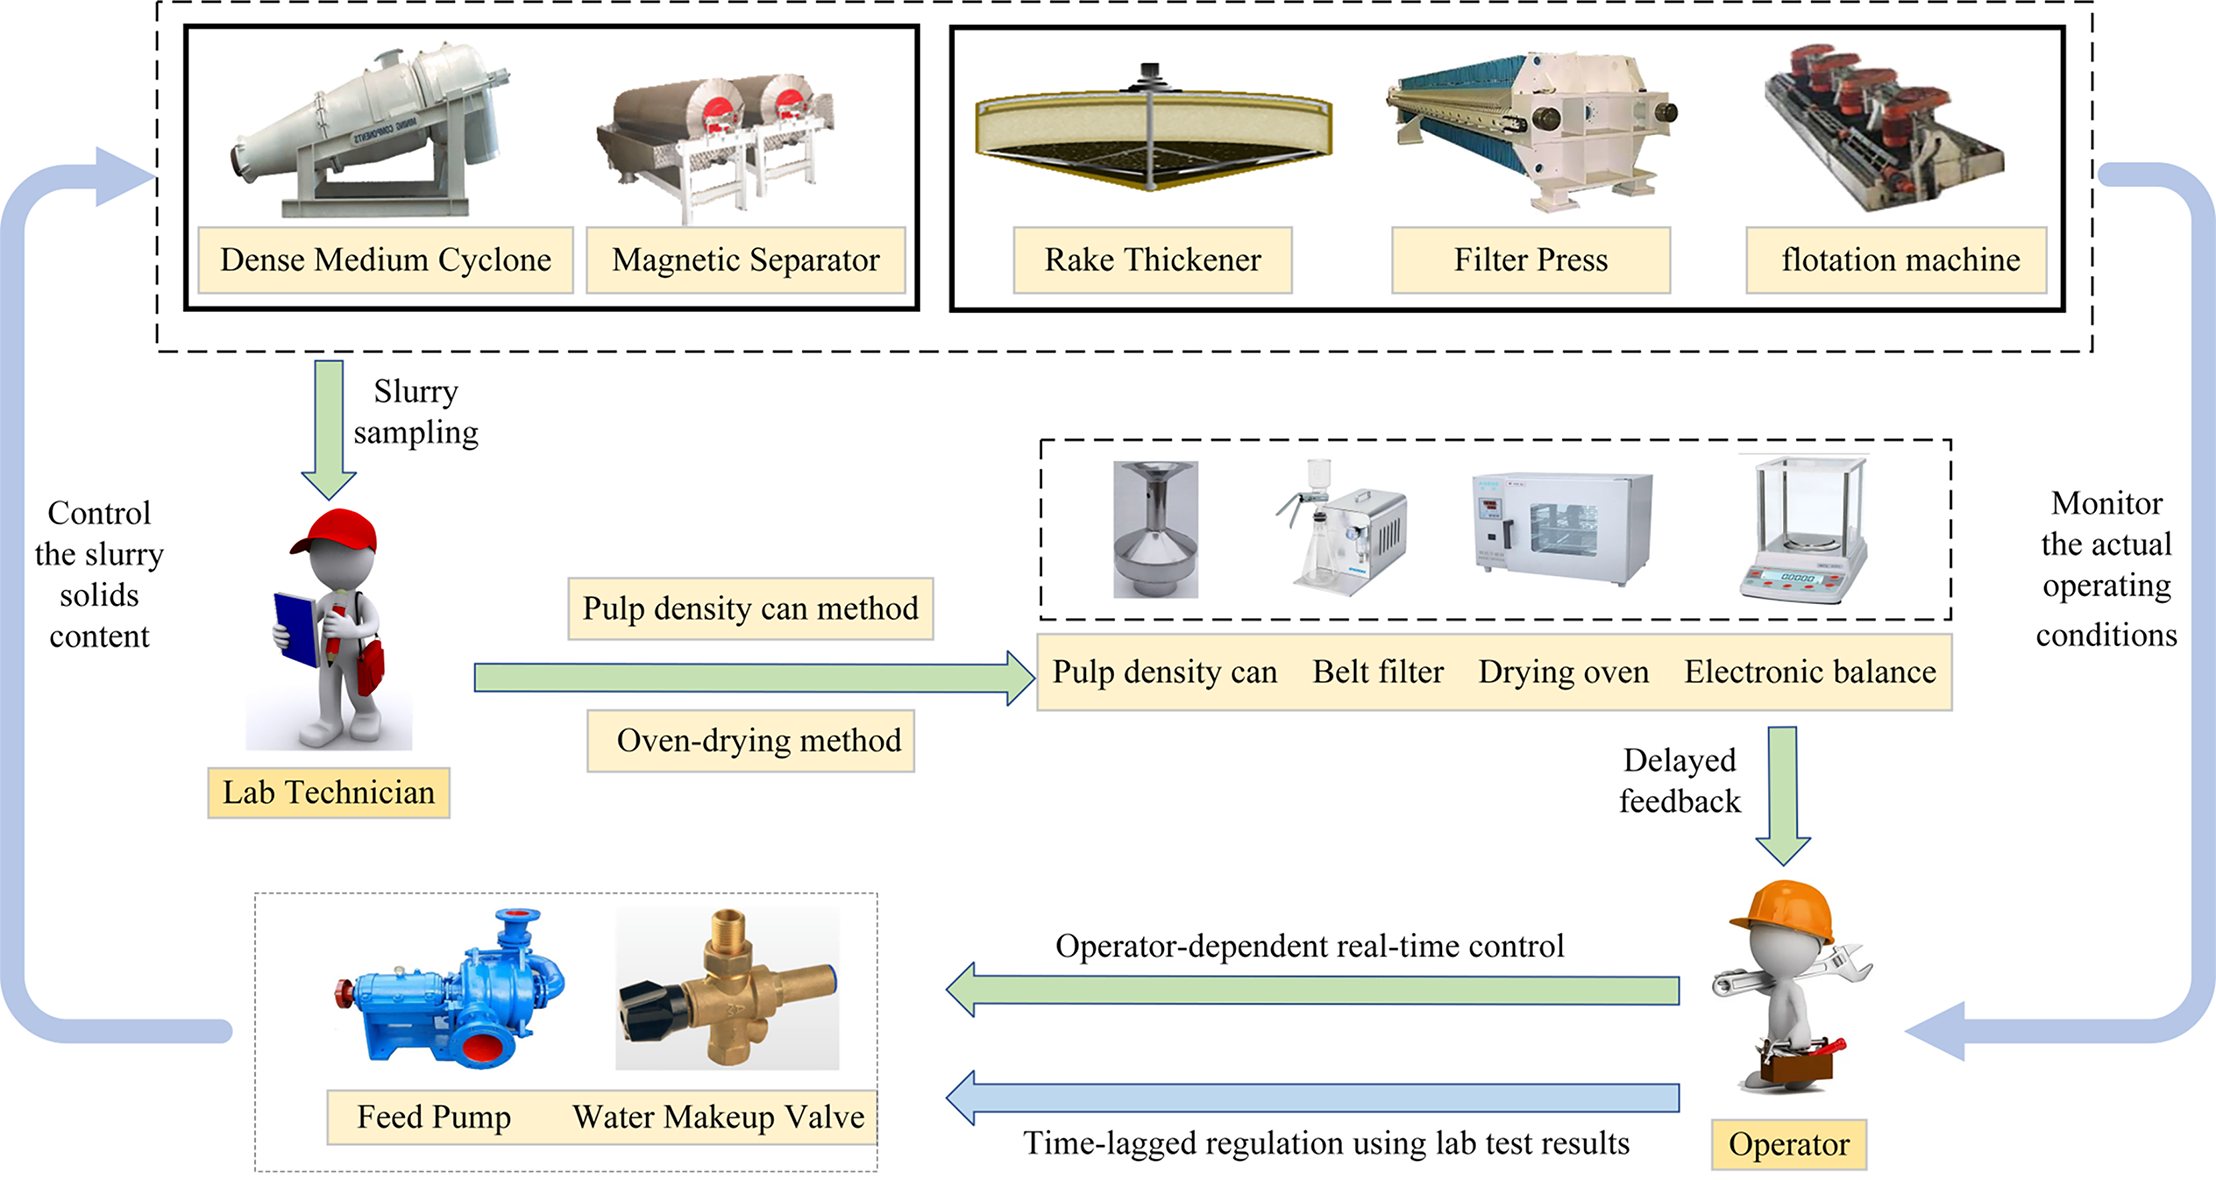
As shown in Fig. 2, the current status of slurry mass-concentration monitoring and control reveals that conventional grab sampling and offline assays suffer from delayed feedback and operator-induced variability. Field adjustments rely on experience-based rapid actions and assay-driven lagged corrections. Under fluctuating operating conditions, these approaches fail to achieve timely process stabilization, highlighting the necessity of continuous online characterization and automated, coordinated control.
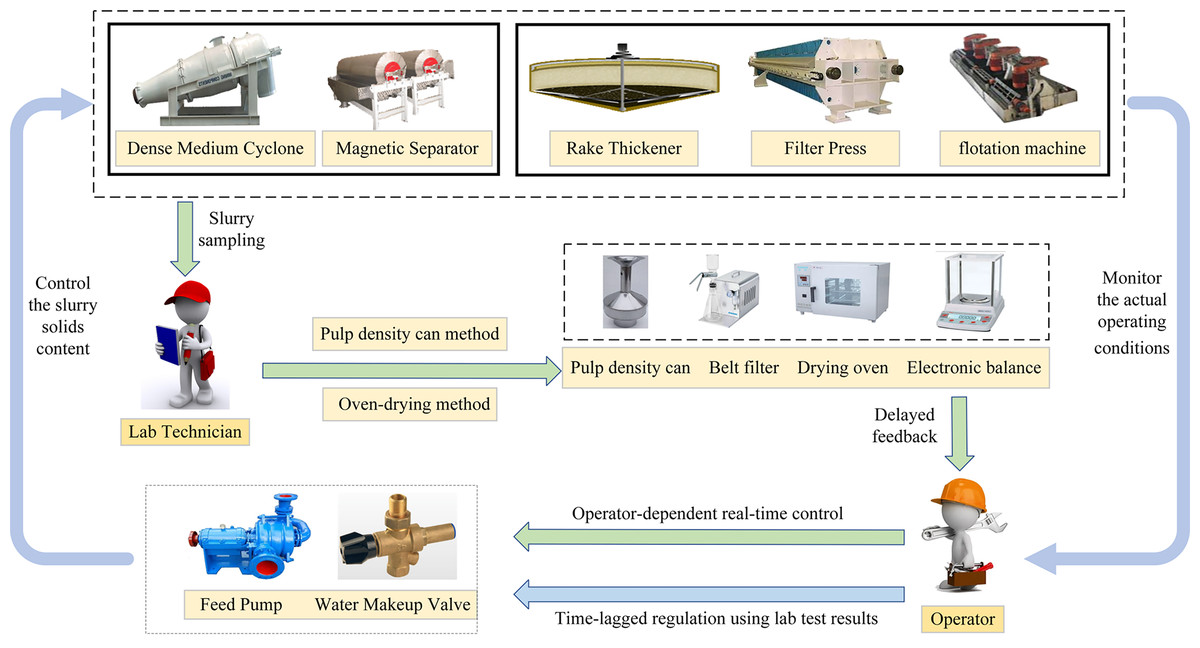
Figure 2: Slurry mass concentration control status.
Overall, manual testing not only entails high labor intensity but also fails to provide real-time, online monitoring and closed-loop control, making it inadequate for meeting the modern coal preparation plant’s requirements for efficient, stable, and intelligent production management.
Slurry mass concentration measurement methods
Bimodal collaborative measurement approach for slurry mass concentration
In the measurement of slurry mass concentration, both infrared transmitted light intensity and pressure difference can characterize changes in slurry properties, and there is a certain correlation between the two. The transmitted light intensity is affected by factors such as slurry volumetric concentration, true particle density, and particle size distribution, while the pressure difference depends on parameters including slurry volumetric concentration, fluid dynamic characteristics, and the resistance of the pipeline system (Jiang et al., 2022). After optimization measures, these two measurement methods are primarily constrained by slurry volumetric concentration and true particle density, thus providing complementary advantages in slurry concentration monitoring. Meanwhile, given known volumetric concentration and true particle density, the mass concentration of the system can be further calculated. Mass concentration is defined as the mass of solid particles contained in a unit volume of the suspension and can be directly obtained as the product of the volumetric fraction and the true particle density. enabling estimation of slurry mass concentration without additional measurement conditions.
Infrared transmitted light intensity measurement is a widely utilized method for investigating the physical and chemical properties of materials such as slurries, liquids, or gases (Zhao et al., 2024). The fundamental principle of the method is that an infrared laser emitted by the infrared light source penetrates the sample under test, and the characteristics of the sample are inferred by measuring variations in the transmitted light intensity. In infrared transmission intensity measurements, the infrared light source emits an infrared laser, typically within a wavelength range of 700 nm to 1 mm. Depending on the properties of the substance, the infrared light may be absorbed, scattered, or transmitted during propagation. In this study, slurry mass concentration is reported in g L−1, slurry volumetric concentration in %, and particle true density in g cm−3.
In infrared transmitted light intensity measurement, the Lambert–Beer law provides the theoretical basis for describing the relationship between light intensity and sample concentration. According to the Lambert–Beer law, there is an exponential relationship between the transmitted light intensity and the concentration and thickness of the sample. Specifically, the transmitted light intensity decreases as the sample concentration increases, as expressed in Eqs. (1) and (2):
(1)
(2) where is the mean free path of photons, with higher values indicating more photons passing through the sample cell; is the inner diameter of the sample cell; where denotes the incident light intensity and the transmitted light intensity; is the particle diameter; is the absorbance; and is the slurry volumetric concentration.
By combining Eqs. (1) and (2), we obtain
(3)
Under ideal conditions, parameters and are considered constants, while is influenced by the absorbance of the dispersed phase. In the slurry system, ash content affects the slurry absorbance, and there is a strong correlation between particle ash content and density. Therefore, in this study, is considered a function of the true particle density, i.e., .
The principle of pressure difference measurement is based on the pressure differential in fluid mechanics. When slurry flows through a pipeline, the presence of solid particles introduces resistance, resulting in a pressure difference (Wang et al., 2012). By precisely measuring the pressure difference between the two ends of the pipeline, the slurry volumetric concentration can be inferred. In this study, since the measurement of slurry volumetric concentration is performed in a vertical pipe, the effect of local resistance losses on the overall pressure difference can be neglected. Therefore, this work focuses on the influence of frictional (along-the-length) resistance losses on pressure difference measurement.
In practical applications, coal-slurry flow is influenced by pipe-wall friction, which generates distributed (along-the-pipe) resistance that cannot be neglected during transport. The corresponding frictional loss is calculated as follows:
(4) where denotes the along-the-pipe friction factor, is the pipe length, the internal pipe diameter, the cross-section–averaged velocity, and the gravitational acceleration.
Accordingly, the differential pressure measured by the laboratory instrument comprises two contributions—the ideal hydrostatic head and the distributed frictional loss. The total differential pressure can therefore be expressed as . Hence, Eq. (5) is obtained.
(5) where is the slurry density; is the pressure difference; is the frictional (along-the-pipe) resistance loss; is the acceleration due to gravity and is the liquid level difference;
The slurry density is determined by the densities of both solid particles and the liquid phase (water). In the slurry, the proportion of solid particles and water varies with the volumetric concentration, resulting in changes in slurry density. Specifically, the slurry density can be calculated as the weighted average of the true density of solid particles and the density of water, where the proportion of solid particles is determined by the slurry volumetric concentration . Therefore, the slurry density can be calculated by the following relation:
(6) where is the slurry density; is the density of water; is the true density of particles and is the slurry volumetric concentration.
Substituting the slurry density into the above pressure difference formula (Eq. (5)), we obtain:
(7)
Based on the foregoing analyses of the transmission-optics and pressure-drop theories, simultaneous solution of the governing relations allows the volumetric concentration and the true particle density to be expressed as functions of the transmitted light intensity and the differential pressure. In Eq. (9), the parameter denotes the correlation function of the true particle density; its physical meaning and analytical form have been detailed earlier in the manuscript:
(8)
(9)
By equating the right-hand sides of Eqs. (8) and (9)—i.e., enforcing that, under the theoretical assumptions, the differential-pressure and transmission-based formulations provide a consistent description of the volumetric concentration—we obtain:
(10)
Since several physical quantities in the equations are constant under the experimental conditions, we simplify the expressions for ease of derivation. Let:
(11)
(12)
(13) Under these definitions, the original expression simplifies to:
(14) Hence, the true particle density is obtained as:
(15)
Based on the foregoing analyses of transmission-optics and pressure-drop theories, simultaneous solution of the governing relations yields the volumetric concentration and the true particle density as functions of the transmitted light intensity and the differential pressure. Substituting the expression for true particle density into the volumetric concentration formula (Eq. (9)), and combining and simplifying the constant terms, the volumetric concentration can be expressed as:
(16)
Meanwhile, given the known volumetric concentration and true particle density, the mass concentration of the system can be further calculated. Mass concentration is defined as the mass of solid particles contained in a unit volume of the suspension, and it can be directly obtained as the product of the volumetric fraction and the true particle density:
(17)
Thereby enabling the estimation of slurry mass concentration without requiring additional measurement conditions.
Bimodal cooperative detection system for slurry mass concentration
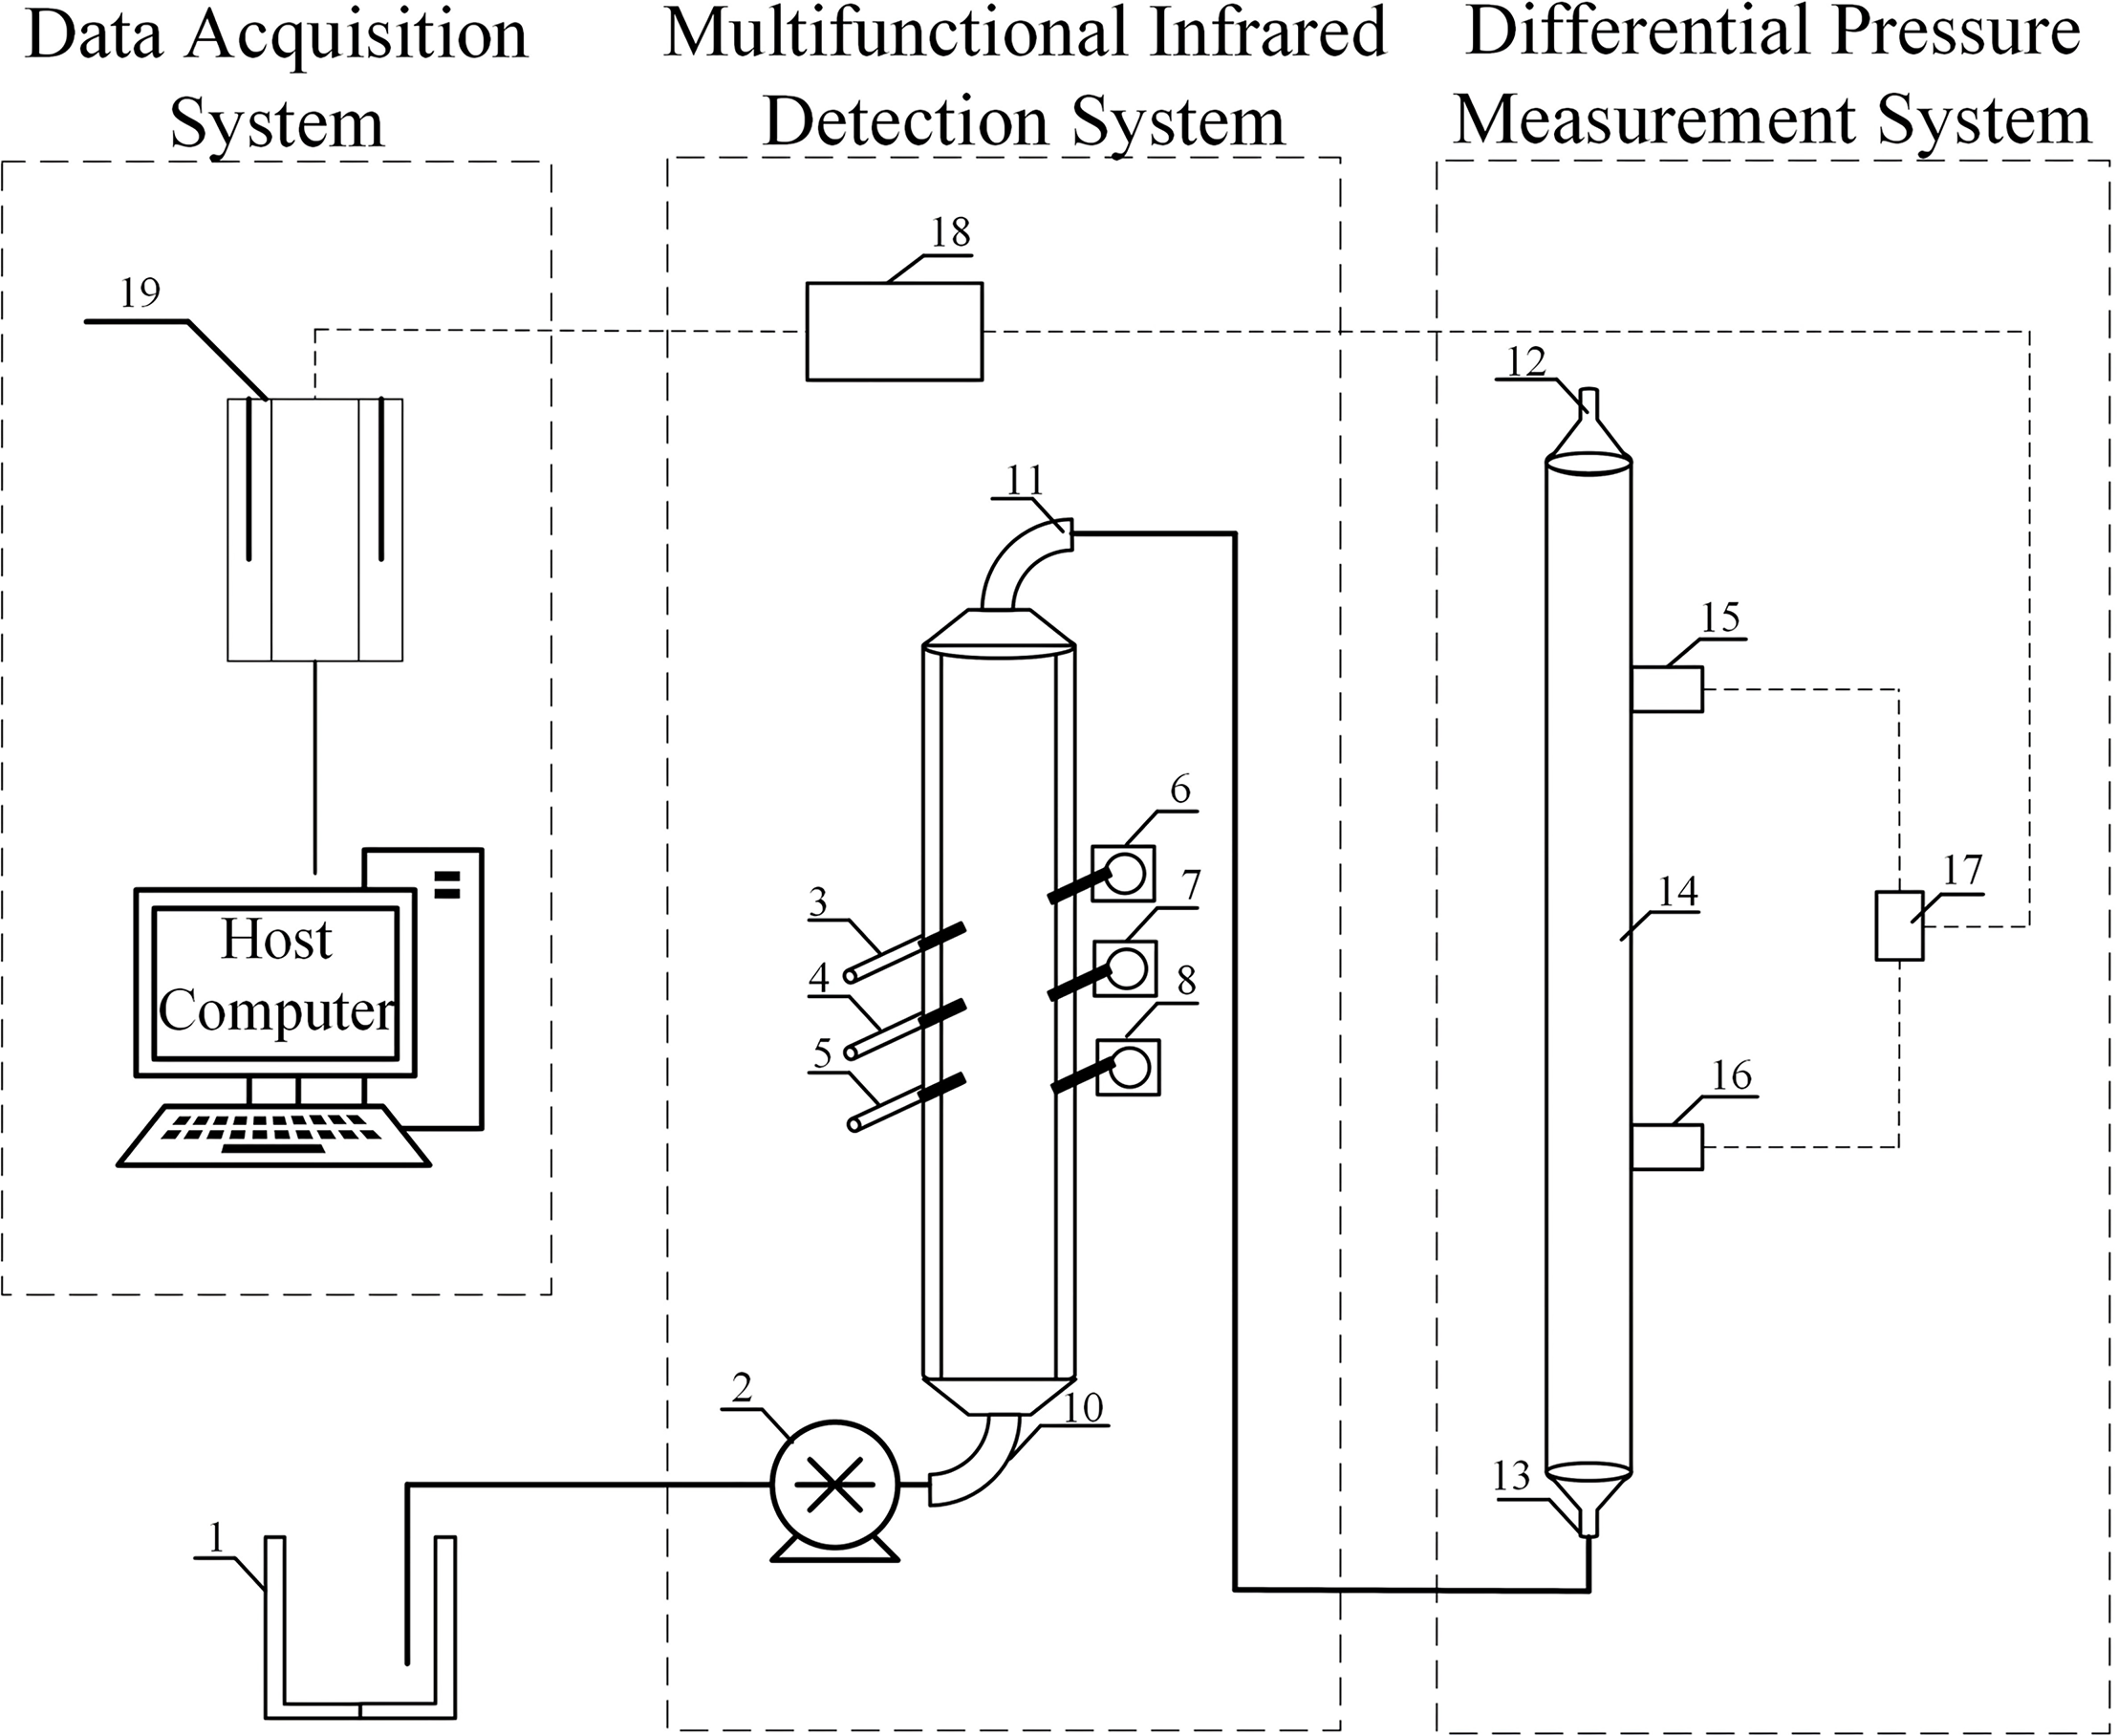
In the coal preparation process, slurry mass concentration data originate from different sources and have different types. In this study, a bimodal cooperative detection system is utilized for feature-level fusion, combining process data and acquired data based on measurements from multi-power infrared laser emitters and differential pressure sensors to obtain more comprehensive and accurate information, thereby improving the precision of slurry mass concentration measurement (Liu et al., 2025). The experimental system consists of three main components: a multifunctional infrared detection module, a pressure difference measurement module, and a data acquisition system. The multifunctional infrared detection module is utilized to acquire slurry transmitted light signals; the pressure difference measurement module monitors slurry flow characteristics in real time; and the data acquisition system is responsible for signal acquisition and storage. As shown in Fig. 3, the experimental setup for bimodal slurry mass-concentration measurement integrates three infrared emitters of different power levels within the same rectangular channel, and incorporates pressure taps on the vertical pipe section to connect a differential-pressure transmitter. All signals are synchronously sampled by a unified data acquisition unit, achieving spatial co-location and temporal synchronization of the optical and differential-pressure sensing modalities. This configuration ensures measurement consistency and repeatability, providing a reliable experimental foundation for subsequent multi-source fusion modeling and the ARI-ICA prediction framework.
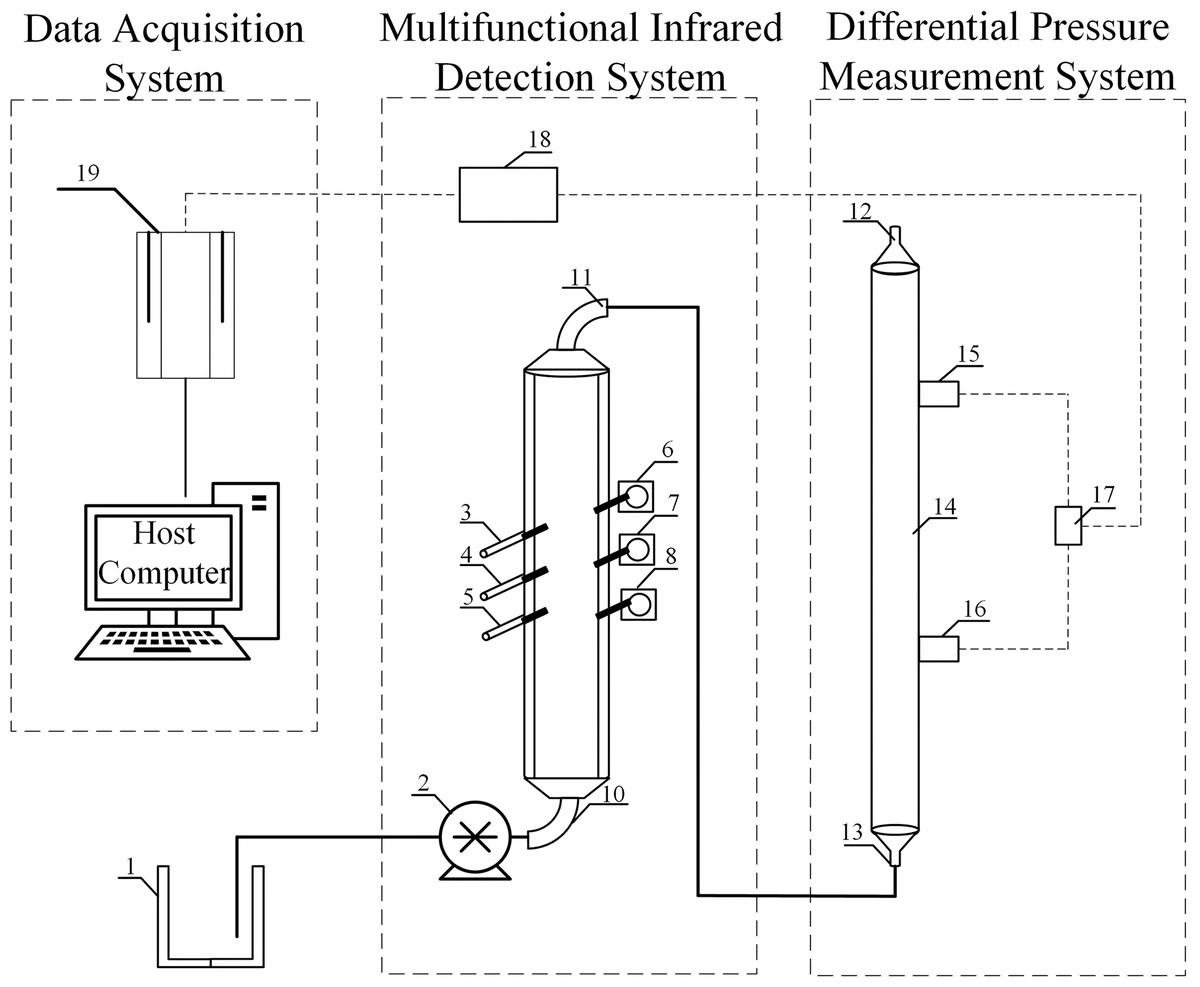
Figure 3: Block diagram of the slurry mass concentration measurement equipment: 1-Slurry tank 2-Slurry pump 3, 4, 5-5/mW, 50/mW, and 200/mW infrared laser emitters 6, 7, 8-Infrared semiconductor sensors 9-Rectangular channel 10, 11-Inlet and outlet.
The variation in transmitted light intensity is primarily determined by the slurry volumetric concentration and true particle density, while factors such as particle size distribution and sample cell diameter also play a role. As the slurry concentration increases, the number of particles grows, enhancing the absorption and scattering effects of light, which leads to a decrease in transmitted light intensity. The true particle density also significantly influences the transmitted light intensity, as different particle densities alter the slurry’s absorbance characteristics, thereby affecting the transmitted light intensity (Zeng, Zhu & Chen, 2023). To improve the accuracy of transmission light measurements, precise control of slurry volumetric concentration and true particle density is required to reduce measurement errors. By appropriately adjusting the slurry concentration or diluting the sample, the influence of concentration fluctuations on transmitted light intensity can be effectively mitigated. Moreover, rationally defining the range of true particle density values and employing accurate physical measurement methods contribute to enhancing measurement precision.
The expression for pressure difference during slurry flow encompasses the combined effects of slurry volumetric concentration, true particle density, flow velocity, and pipeline dimensions. These variables interact synergistically to determine the accuracy of pressure difference measurements. To enhance the precision of pressure difference data for slurry concentration prediction, optimization and control of key parameters such as slurry flow rate, particle distribution, and pipeline diameter are necessary. In this study, the pressure difference measurement module integrates the aforementioned components through the careful selection of differential pressure sensors, sampling tubes, and connecting fittings, forming an efficient and stable measurement apparatus. Specifically, the sampling tube is connected via two three-way joints to ensure stable and unobstructed slurry flow. The differential pressure sensor is installed outside the three-way joint, continuously monitoring the pressure difference during flow and converting it into an electrical signal transmitted to the data acquisition system for storage, thereby guaranteeing the accuracy and reliability of the measured data (Zheng et al., 2023).
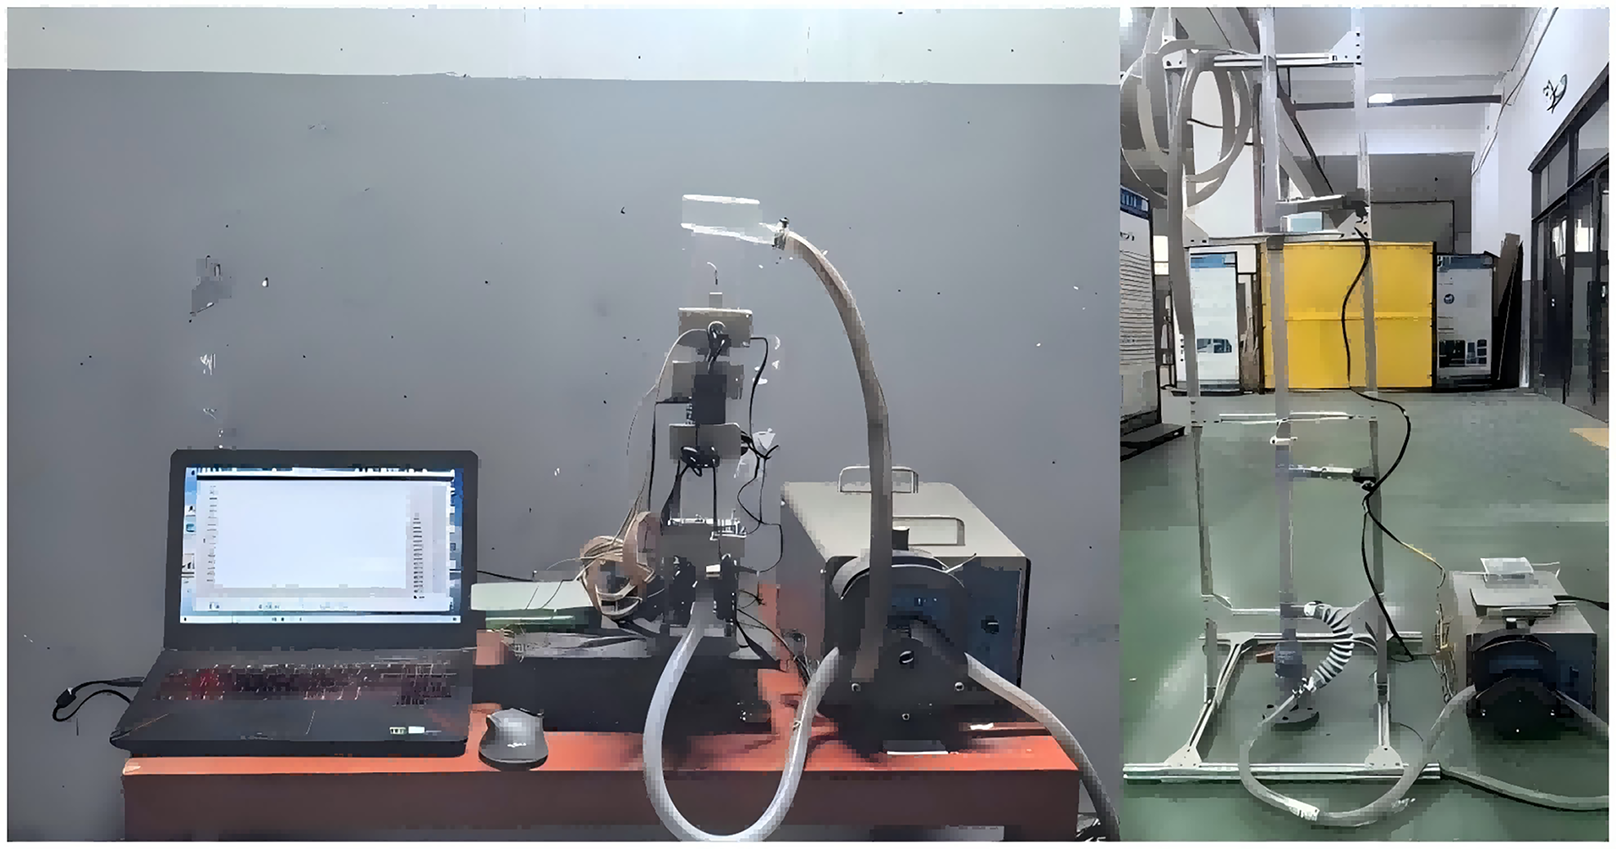
A photograph of the overall infrared and pressure difference detection system is shown in Fig. 4, clearly illustrating the layout and function of the major components. The entire system can stably acquire transmitted light intensity data required for slurry concentration measurement and accurately provide high-quality pressure difference data for slurry concentration. This setup lays a solid experimental foundation for subsequent data analysis and the establishment of slurry mass concentration prediction models.
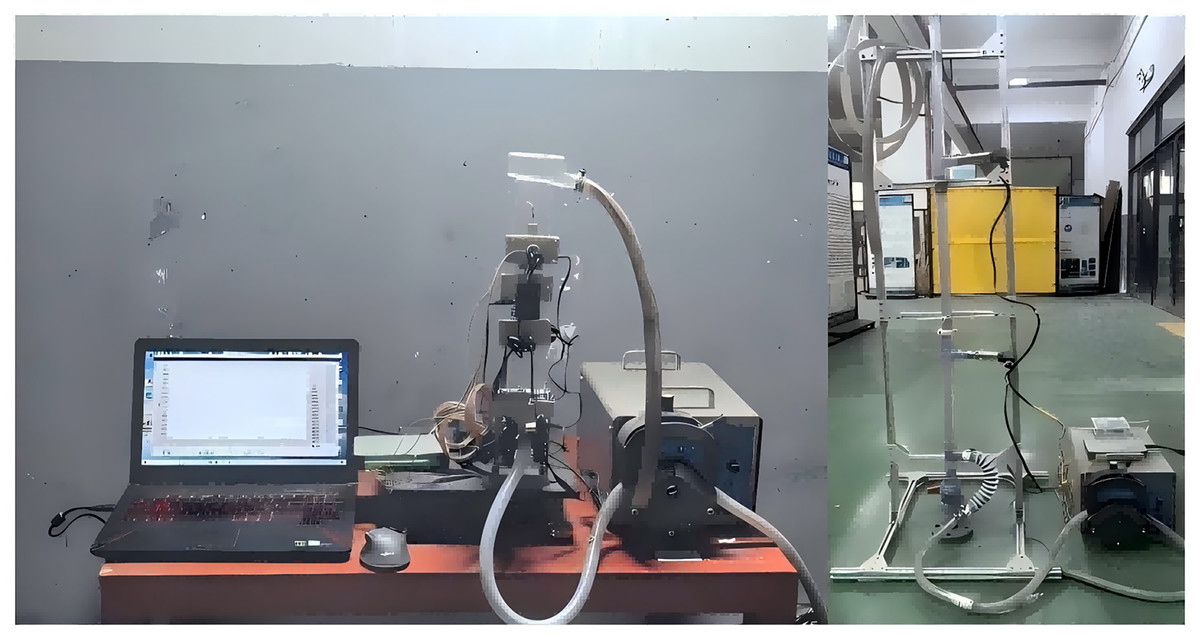
Figure 4: Physical view of the slurry mass concentration measurement apparatus.
Slurry mass concentration prediction method driven by multi-source data fusion
Architecture of the ARI-ICA model with regularization decay
In soft sensing of slurry mass concentration, infrared transmission and differential-pressure signals characterize the slurry from complementary perspectives—infrared captures particle-scale absorption and scattering, whereas differential pressure reflects macroscopic hydrodynamic resistance. Fusing these two modalities under physics-based constraints enables simultaneous extraction of particle size and concentration as well as flow velocity and solids content, thereby improving noise immunity and fault tolerance while ensuring physical consistency and interpretability of the predictions.
In traditional Random Weight Neural Networks (RWNN), the weights and biases of hidden nodes are typically generated randomly. However, this approach fails to exploit the structure of the current residual, which may lead to inefficient learning. Given the data scale and feature dimensionality in this study (160 samples; inputs comprising three infrared intensity channels and one differential-pressure signal), we prioritized a lightweight, interpretable ARI-ICA model over deep networks or large ensemble methods. Backpropagation Neural Network (BP) are prone to local optima and are data-hungry; Extreme Learning Machine (ELM) shows weak adaptability in complex scenarios with poorly constrained generalization; Support Vector Regression (SVR) exhibits limited robustness and interpretability. By contrast, ARI-ICA employs incremental construction under a geometric-correlation constraint and residual-scaled dynamic sampling, and introduces a decaying ridge regularization at the output layer, thereby maintaining structural sparsity and suppressing overfitting in the small-sample regime. Moreover, the model first predicts the volumetric concentration and the true particle density from multi-source signals, and then computes the mass concentration via , ensuring physical consistency and interpretability. On this basis, we adopt a nonlinear mapping model, ARI-ICA, endowed with adaptive node generation and progressively decaying regularization to efficiently learn complex relationships in the multi-source input space, resulting in markedly enhanced accuracy, robustness, and stability for mass-concentration prediction.
In order to select new hidden nodes, ICA incorporates geometric constraints to ensure that newly added hidden nodes exhibit sufficient correlation with the current residual error (Nan et al., 2024). Anti-overfitting and complexity: A new hidden node is accepted only if its output passes a dynamic cosine-squared threshold against the residual; candidate weights are scaled to the residual norm, and the output layer uses decaying ridge regression. The alignment between the output of a candidate node and the residual error is quantified by the squared cosine of the angle between them, defined as
(18)
A candidate node is accepted and added to the network if and only if is greater than or equal to the adjusted threshold , thereby avoiding redundancy and maintaining a sparse structure. Synergy with regularization: Residual-scaled sampling anneals the candidate magnitude, while the decaying ridge readout, enforces strong-then-weak shrinkage. Together with early stopping ( or no candidate passes), this keeps the network compact and reduces overfitting on small datasets.
The threshold is defined as
(19) where, is a hyperparameter that controls the convergence rate and exploration range, and denotes the number of currently selected hidden nodes. This design enables dynamic adjustment of the strictness of node selection during the stepwise construction process, ensuring that each newly introduced node effectively reduces the current residual error and enhances the model’s representational capacity.
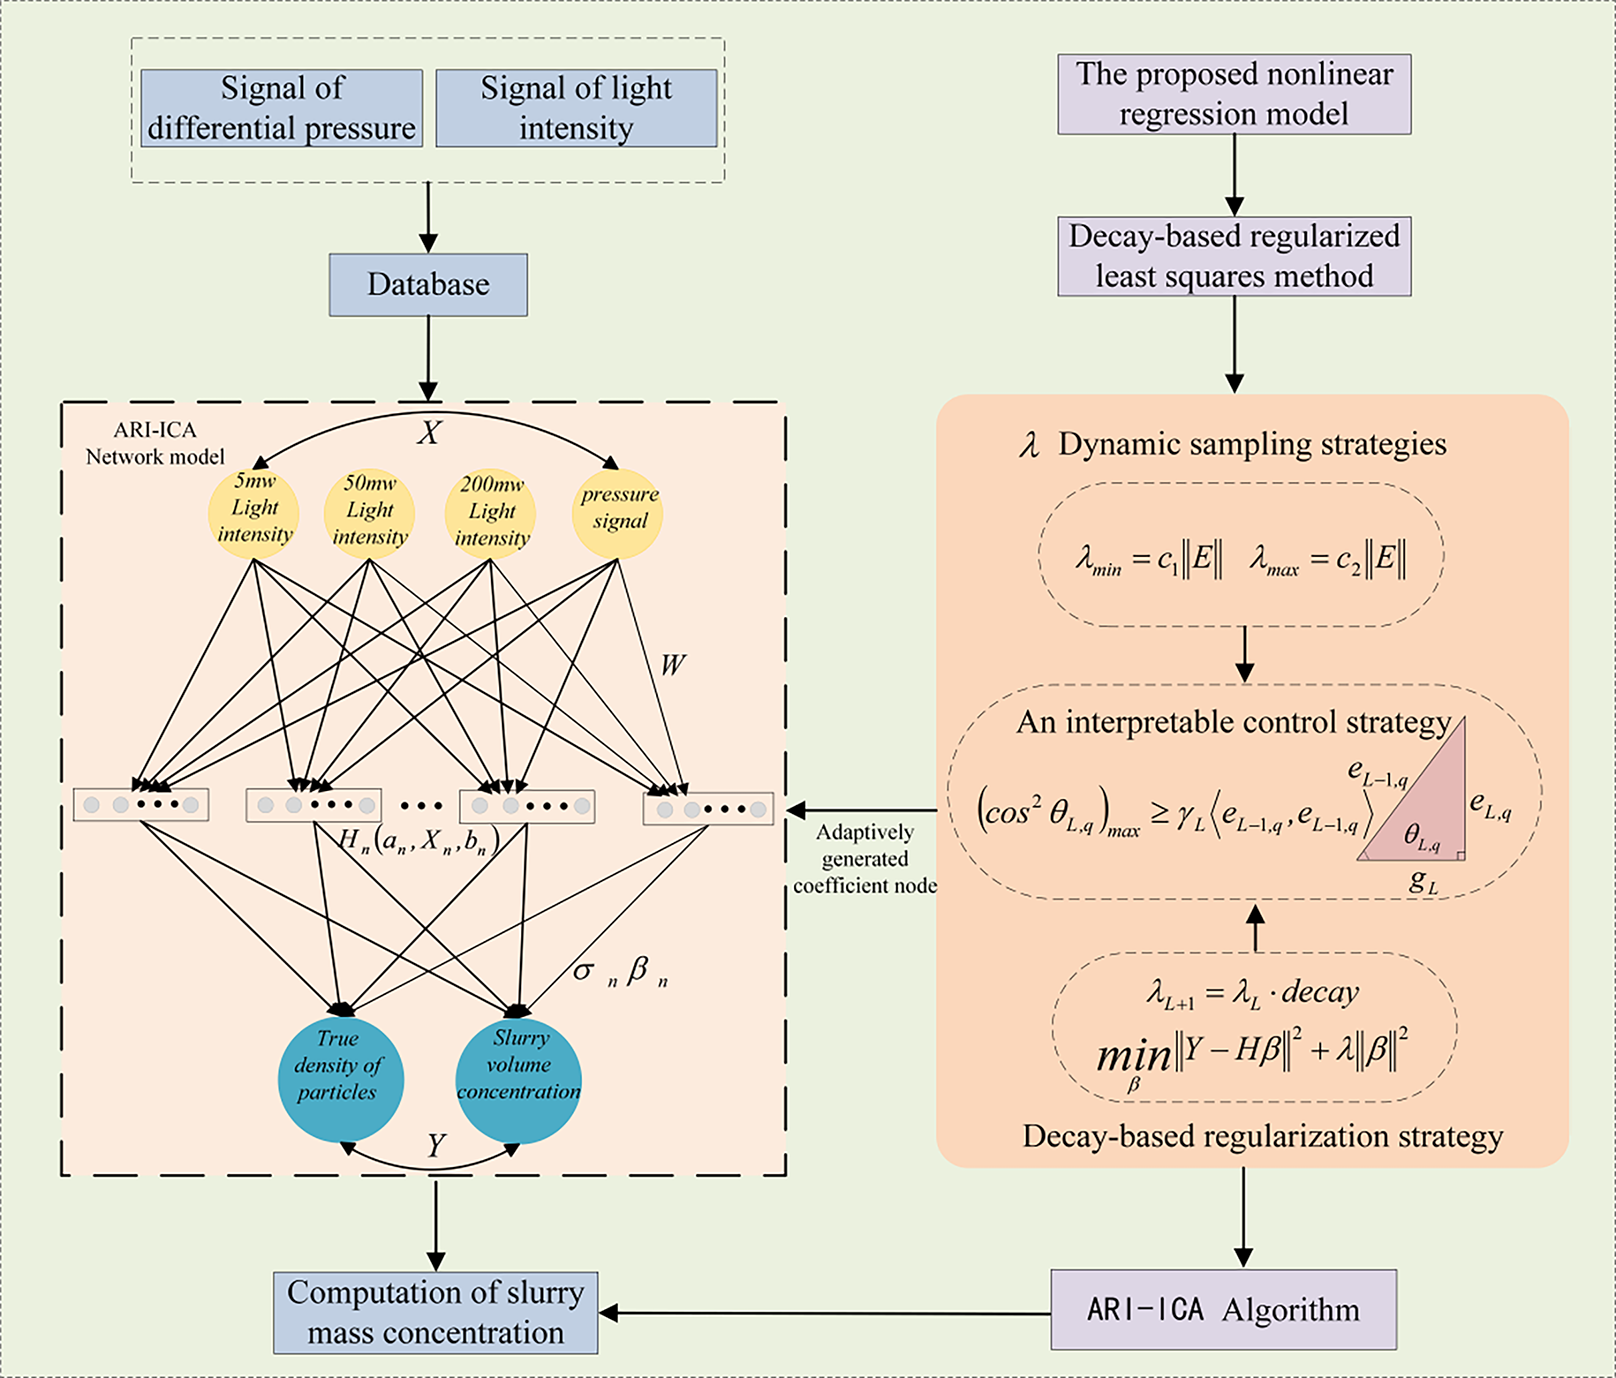
To address the issue of uneven weight distribution in ICA and improve the model’s generalization performance, the original algorithm is extended by introducing a dynamic weight sampling range and a decaying regularization term. This modification reduces network complexity while allowing new nodes to be added either individually or in batches, thereby improving learning efficiency (Meng, Tang & Qiao, 2022). The ICA architecture for adding multiple nodes and handling multidimensional regression is illustrated in Fig. 5. Here, denotes the input variables and the tarobtain output variables. and represent the input weight vector and bias of the hidden node, respectively. denotes the output weight obtained after incorporating the regularization term for the single hidden node. is the iteration coefficient, and represents the activation value of the hidden node.
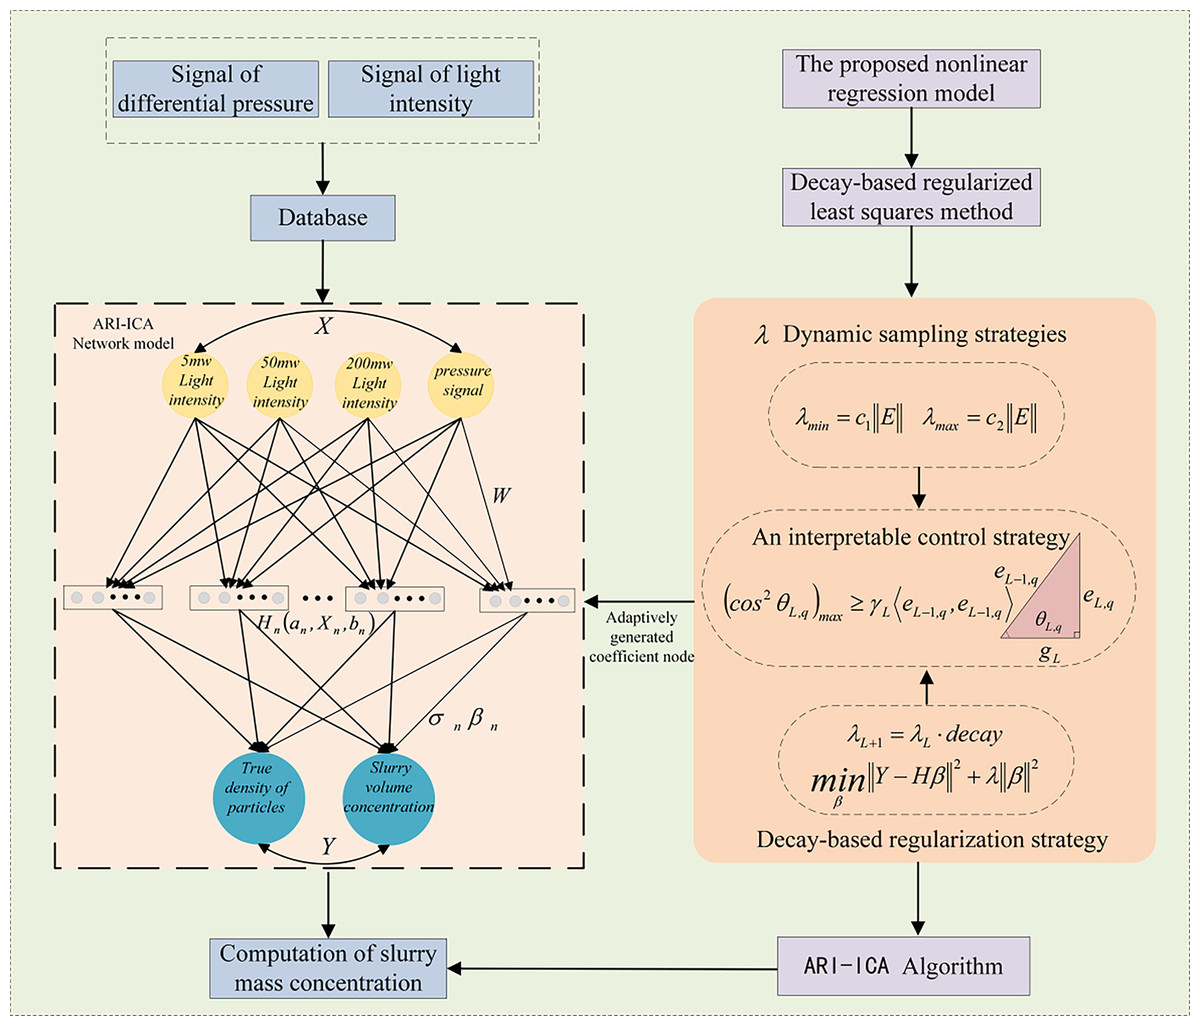
Figure 5: Illustration of the ARI-ICA modeling strategy.
ARI-ICA learning procedure with decaying regularization
After completing the transmission-light and differential-pressure experiments, the acquired raw signals—recorded as voltage time series over finite intervals—were processed to mitigate contamination from noise, sensor errors, and other external disturbances. Signal processing employed the fast Fourier transform (FFT) and frequency-domain filtering. Specifically, the FFT module in Origin (OriginLab) was used to analyze the spectral characteristics of the raw signals; appropriate filters were then applied in the frequency domain to suppress noise components and smooth the data, thereby improving the signal-to-noise ratio. The denoised signals were subsequently averaged over the analysis window, and these mean values were taken as the representative transmitted-light intensity and differential pressure for each slurry volumetric concentration.
In the model constructed in this study, the input variables include three infrared light intensity signals (5, 50, and 200 mW) and one differential pressure signal. These inputs are processed through a regression-based prediction model trained on experimental data, producing two output variables: slurry volume concentration and true particle density. Since the ultimate prediction target is the slurry mass concentration, and there exists a clear mathematical relationship among the three parameters, a specific physical equation can be utilized to convert the predicted volume concentration and particle density into mass concentration (Geng et al., 2022). Based on this relationship, the mass concentration can be calculated as: , where represents the slurry volume concentration and denotes the true particle density. The slurry mass concentration is obtained as the product of the volume concentration and the particle density.
To achieve the nonlinear mapping from the four input variables to the two output variables, this work adopts an Incremental Constructive Algorithm (ICA) framework. On top of this, two improvements are introduced: a dynamic weight sampling range and a dynamic decay regularization strategy, both of which enhance the model’s expressiveness and robustness (Yuan, Li & Wang, 2020). In contrast to traditional methods that utilize a fixed interval for random weight sampling, this work proposes an improved dynamic sampling range strategy, which is applied to the random initialization of hidden node weights and biases (LeCun, Bengio & Hinton, 2015).
Uniform random sampling is performed within a specified range . This method adaptively adjusts the sampling scale based on the current residual error, enabling a transition from coarse global search to fine local search. Such an approach increases the probability of satisfying geometric constraints at different training stages, facilitating to avoid the “flat region” saturation problem caused by overly small weights in early training, as well as oscillations due to excessively large weights in later stages. To prevent the sampling space from being too narrow when residuals are large early in training, or too wide during later convergence phases, a dynamic weight sampling range strategy is introduced. In the experiments, three residual-norm scaling intervals—(0.05, 1.0), (0.1, 5.0), and (0.5, 10.0)—were compared. The results show that the predicted RMSE values of ARI-ICA were 0.099, 0.139, and 0.123 for these intervals, respectively. Among them, the interval (0.05, 1.0) yielded more stable convergence behavior across different stages of the analysis.
Let , . Within this range, weights and biases are uniformly sampled, enabling the network to adaptively adjust the search scale of node parameters at different training stages.
The improvement of dynamic decay regularization is implemented by solving a regularized least squares problem at each step of the output layer regression.
This study proposes a dynamic decay strategy for the regularization term (Pani & Mohanta, 2014), formulated as
(20) which allows the model to maintain strong regularization in the early stages to prevent overfitting while gradually reducing regularization strength during later fine-tuning phases. This approach aims to achieve a balance between global fitting capability and local precision. Initially, a large regularization coefficient is employed to avoid overfitting; as the residual error decreases progressively, the regularization parameter is decayed at each iteration.
If the decay parameter is set too small, the regularization term will rapidly decay toward zero, potentially leading to overfitting in the later stages of training. Conversely, if it is set too large, the decay will be too slow, resulting in excessively strong regularization and underfitting during the later training phases. To verify the rationality of this parameter setting, a sensitivity analysis was conducted in the experimental section for different decay values (0.90, 0.95, and 0.99).
The results show that the RMSE values of ARI-ICA under these decay coefficients were 0.129, 0.098, and 0.087, respectively. These findings indicate that a decay value of 0.99 achieved relatively superior error performance on most datasets. Therefore, the decay parameter in this study was set to 0.99, corresponding to a 1% reduction in the regularization coefficient per iteration. This setting has been demonstrated in both the literature and practical experience to represent a balance point between convergence speed and fitting flexibility, enabling improved fitting capability in later training stages.
Specifically, let the input sample matrix be denoted by and the output by . The objective is to learn a nonlinear function approximation.
(21)
Specifically, is the hidden layer output matrix constructed in a stepwise manner, while denotes the output layer weights. At each iteration, a new hidden node is generated through the following procedure. First, the activation function is defined as:
(22)
The response of the hidden node is given by:
(23)
To select the optimal node from the candidate pool in each training iteration and ensure that the newly added hidden node contributes to the current residual, a geometric constraint is introduced:
(24) and set a dynamic threshold
(25)
A hidden node is accepted only under condition . After hidden nodes have successfully passed this selection criterion, they are assembled to form the hidden layer output matrix (Zhang, 2012).
(26)
To improve the search efficiency, a residual-driven sampling interval is employed:
(27)
(28)
To facilitate adaptive adjustment of the search scale for node parameters at different training stages, the weights and biases are uniformly sampled within the defined range.
The output layer weights are determined by minimizing a regularized least squares objective:
(29)
In this context, represents the regularization parameter that is progressively decayed throughout the training, .
The final model is represented by , defined as . Each column corresponds to the response of a hidden node selected through dynamic sampling and geometric constraints, enabling a nonlinear mapping from a four-dimensional input space to a two-dimensional output space. This approach effectively enhances the model’s interpretability while improving its representational capacity and convergence performance in complex nonlinear tasks.
Experimental outcomes and analysis
The data utilized in this study were obtained from a laboratory-built experimental platform for slurry mass concentration measurement. Based on a differential pressure sensing system and a dual-modal collaborative detection method combining multifunctional infrared transmission, over 160 experimental samples were collected. All raw data were acquired in real time via on-site instruments and calibrated through manual chemical assays, comprising slurry mass concentration measurements corresponding to differential pressure signals and light intensity signals at different frequencies (Cao & Lin, 2014). For model development and validation, 70% of the continuously collected data were allocated to the training set and 30% to the test set. The prediction experimental outcomes on the test set were ultimately utilized as the basis for evaluating and analyzing the model performance in this study.
The hyperparameters of other comparative models are also selected using the same approach to prevent bias in experimental conclusions arising from parameter choices. Root Mean Square Error (RMSE), Mean Absolute Error (MAE), and the coefficient of determination (R2) are utilized as model evaluation metrics. The formulas for RMSE, MAE, and R2 are defined as follows:
(30)
(31)
(32) where, denotes the number of samples, is the true value, is the predicted value, and represents the mean of all true values.
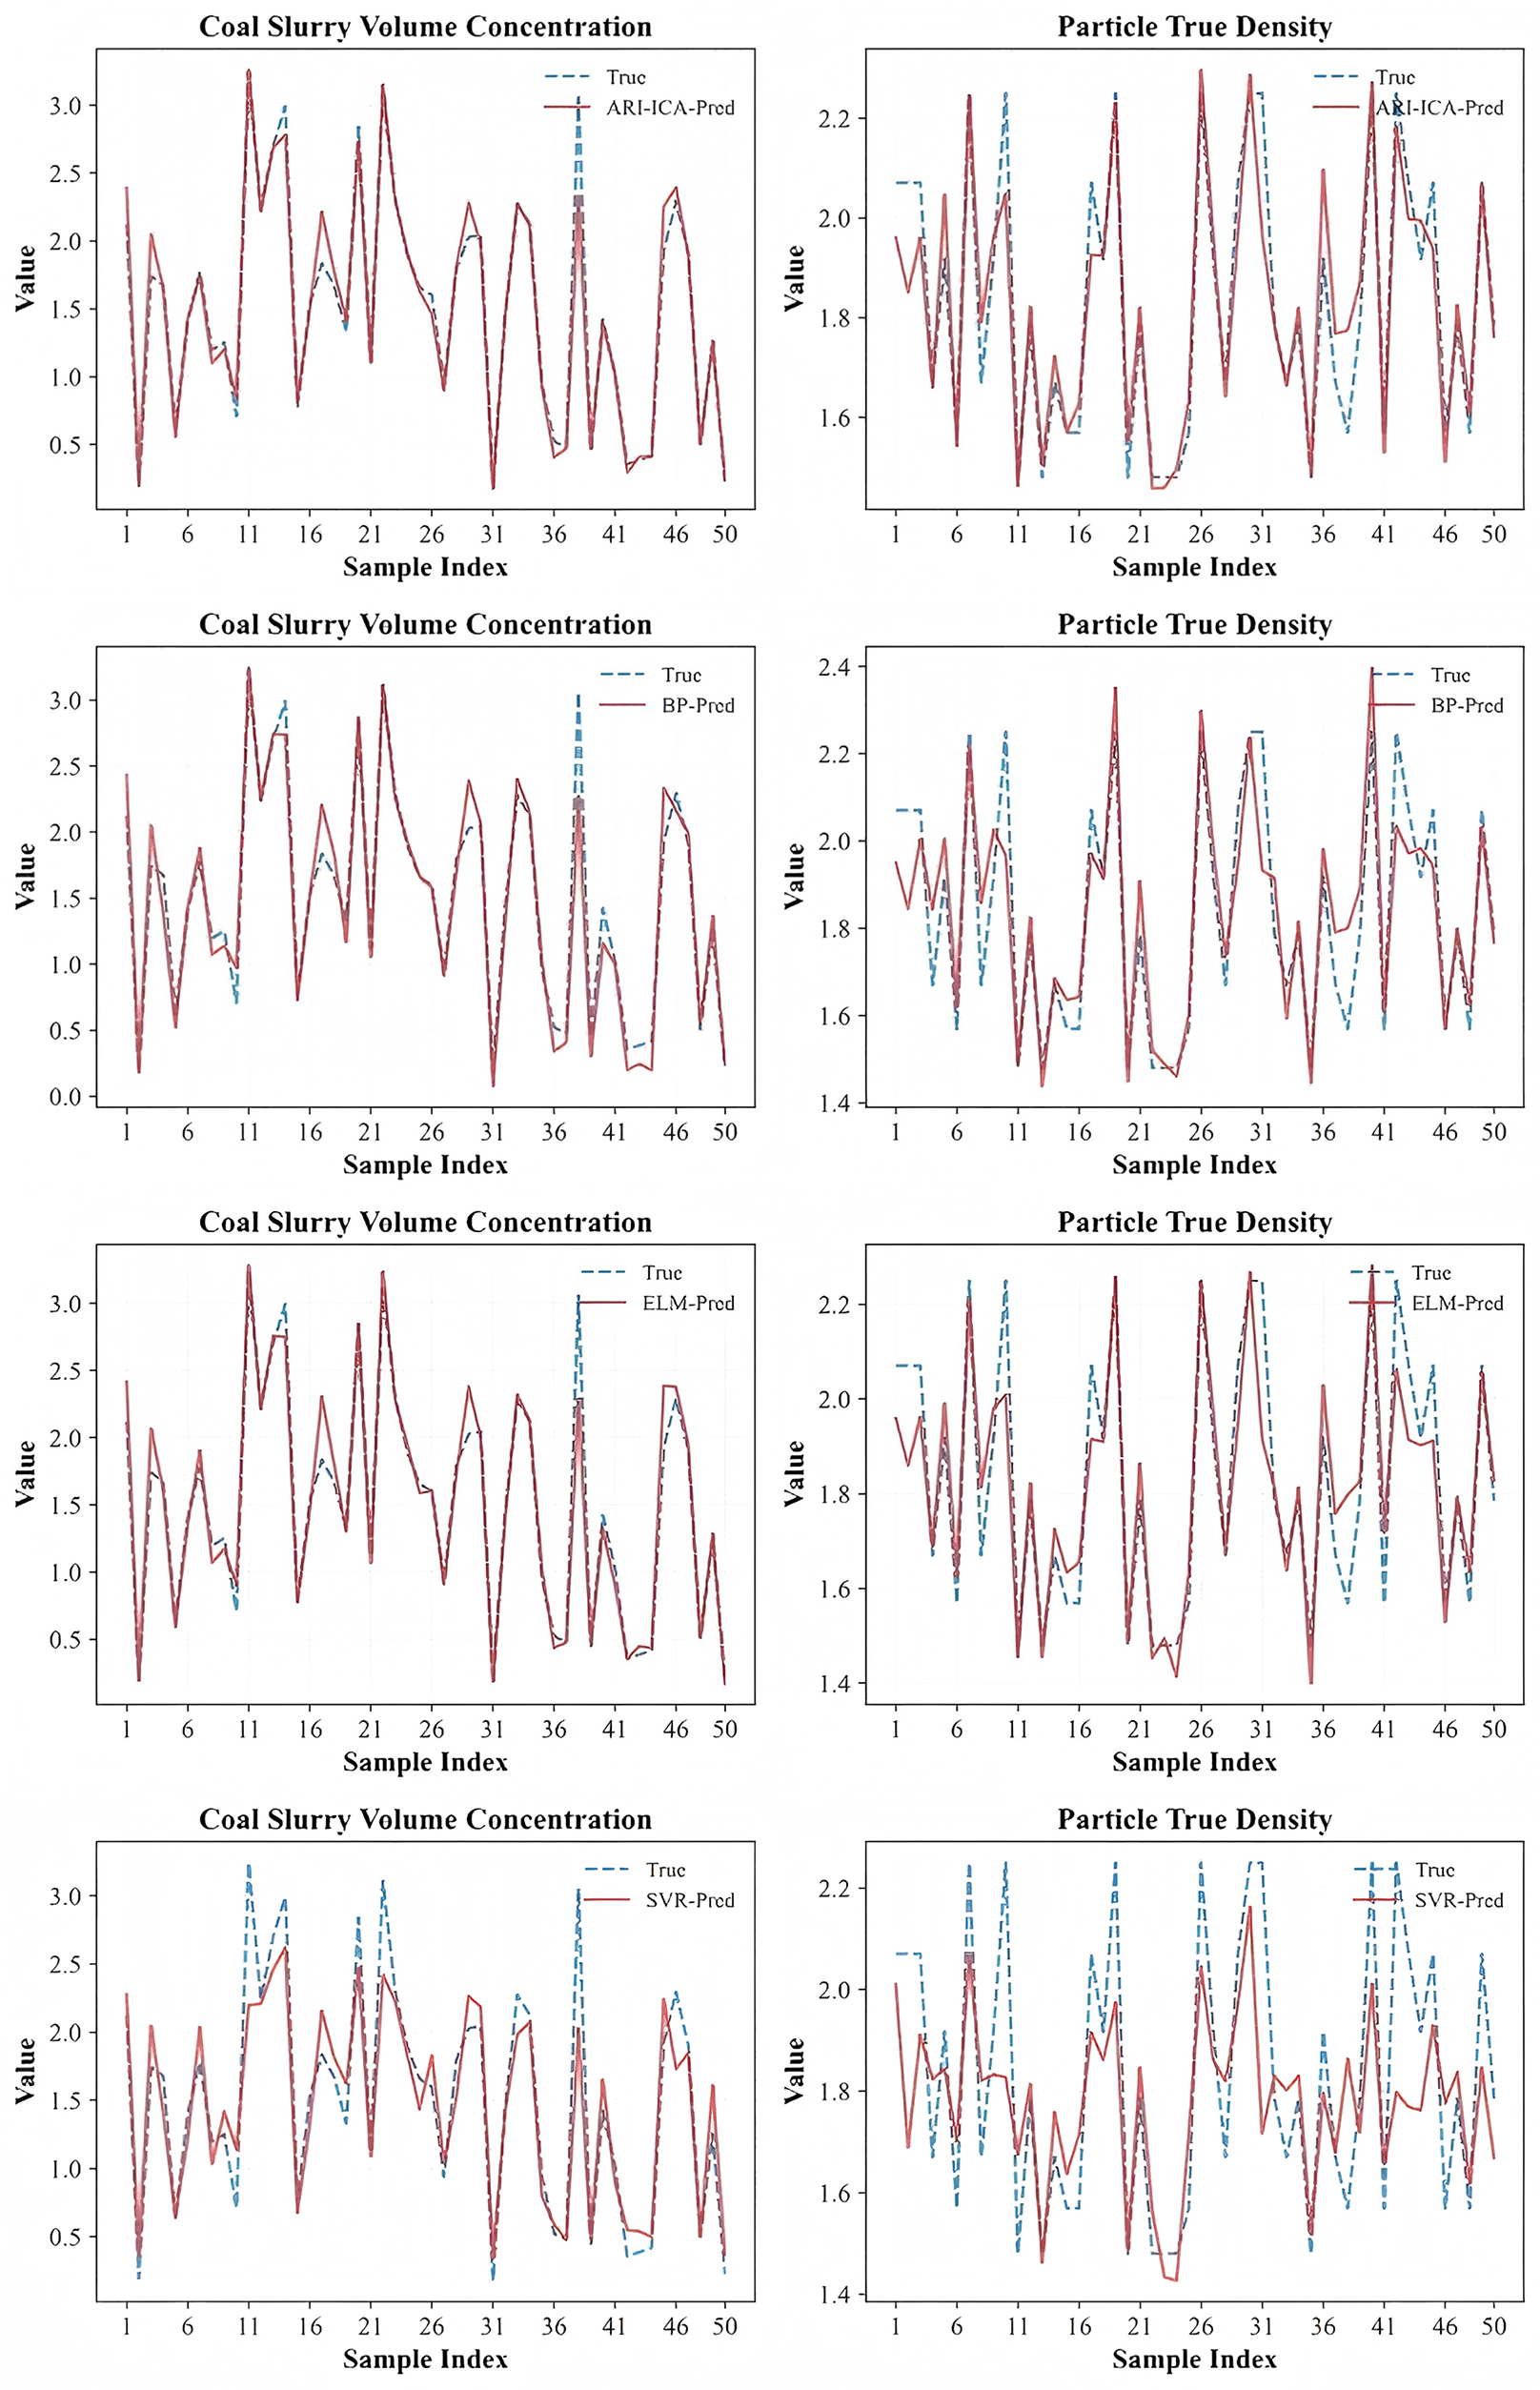
To further demonstrate the effectiveness of the proposed ARI-ICA modeling approach for data-driven modeling of flotation concentrate ash content, a comparative analysis was conducted with three neural network-based algorithms: BP, SVR and ELM. The activation functions utilized in all four models were the function (Ye & Dai, 2018). The prediction results of data-driven models for slurry volume concentration and particle true density using four algorithms are presented in Fig. 6, where the horizontal axis denotes the data sequence number and the vertical axis represents the values of slurry volume concentration and particle true density.
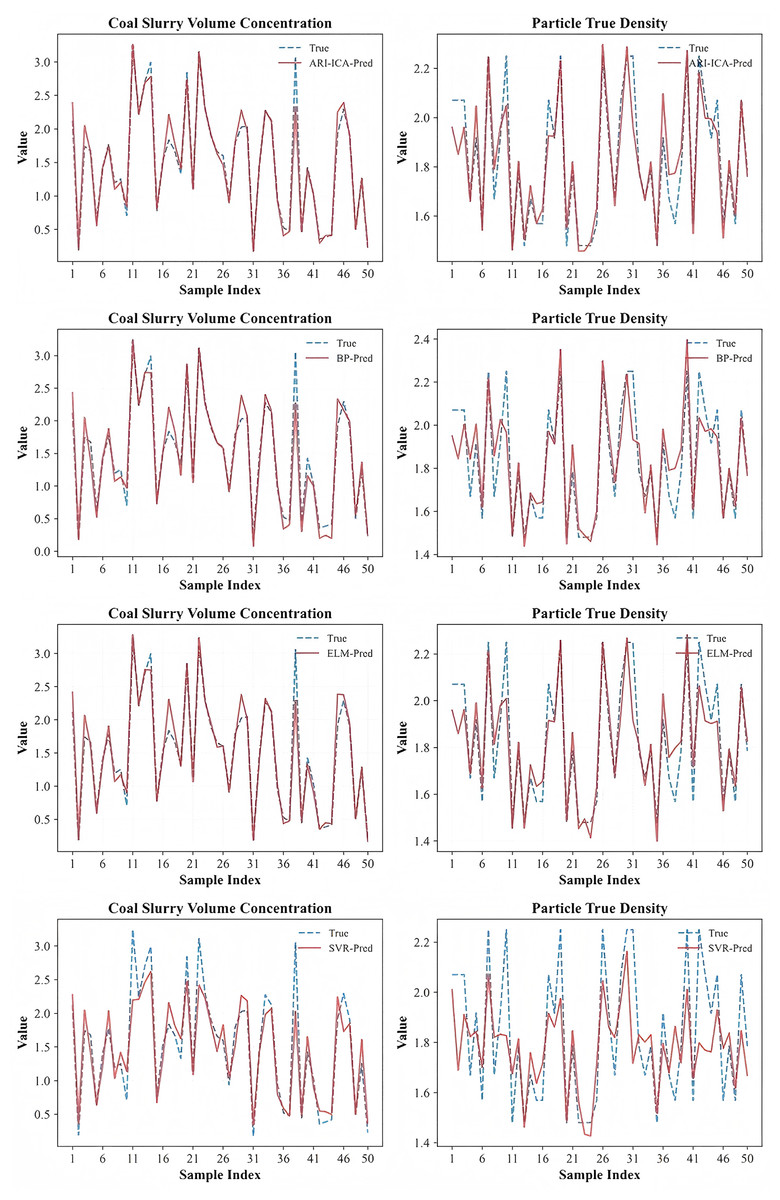
Figure 6: Comparison of the prediction performance of four algorithms for slurry volumetric concentration and true particle density.
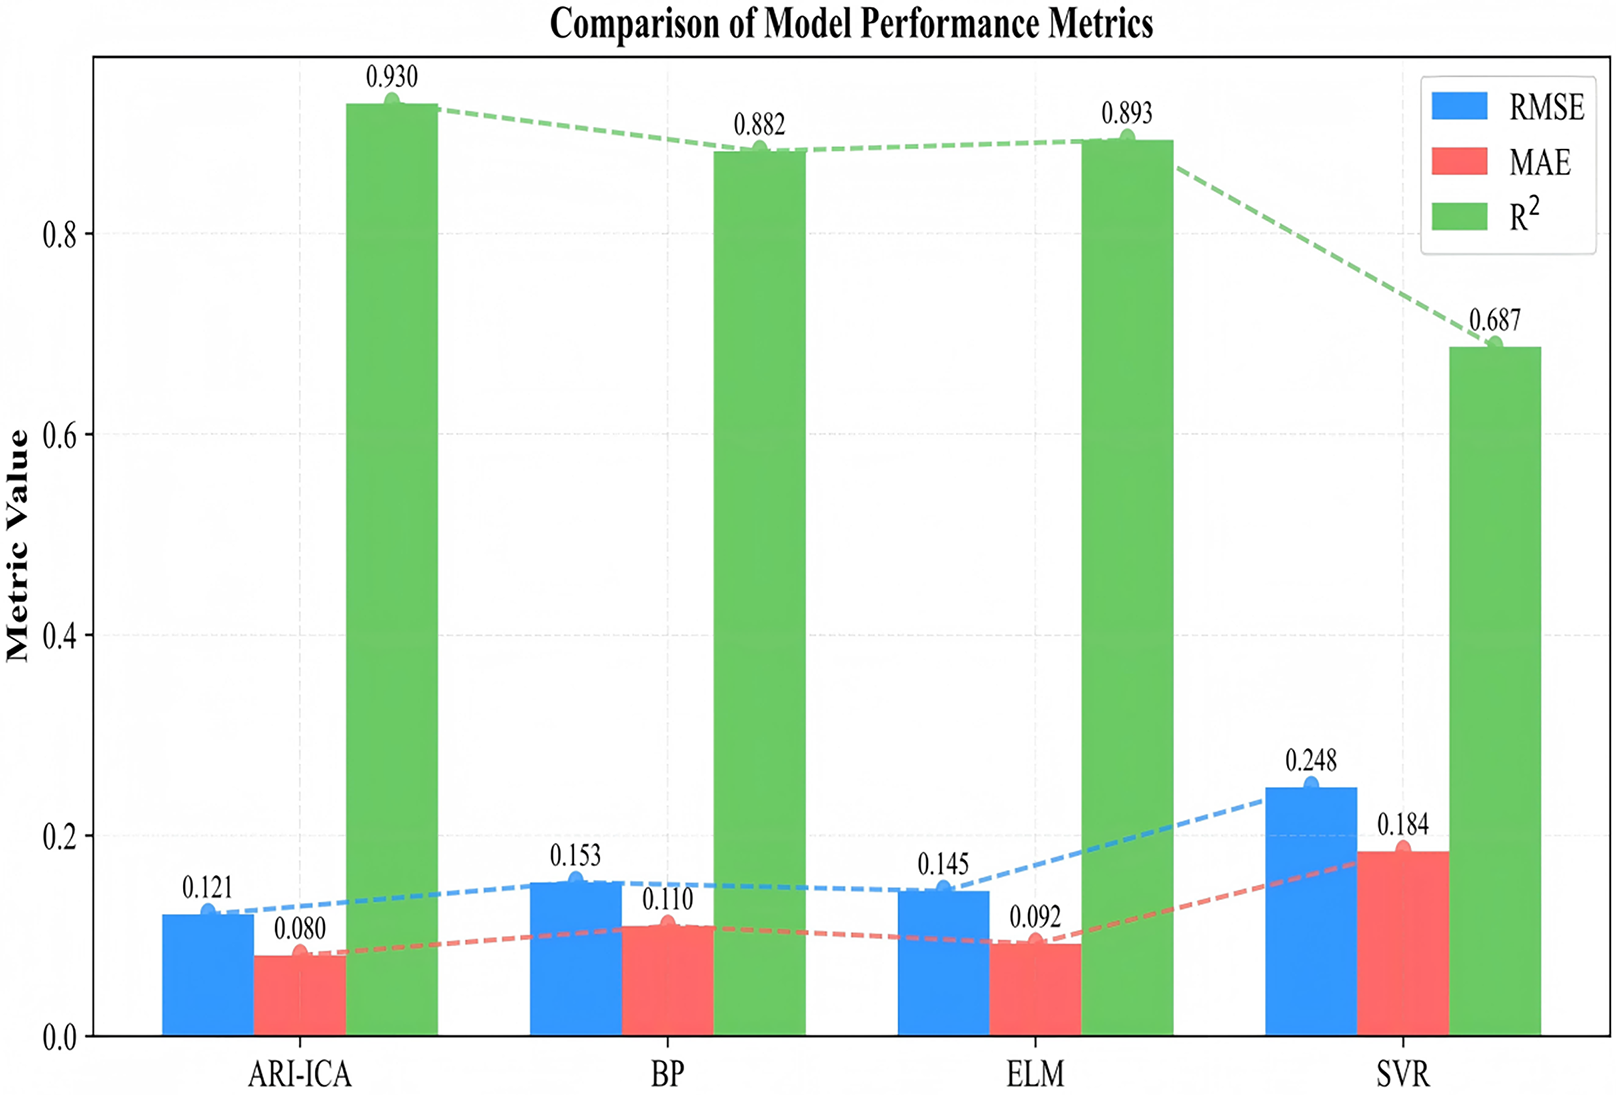
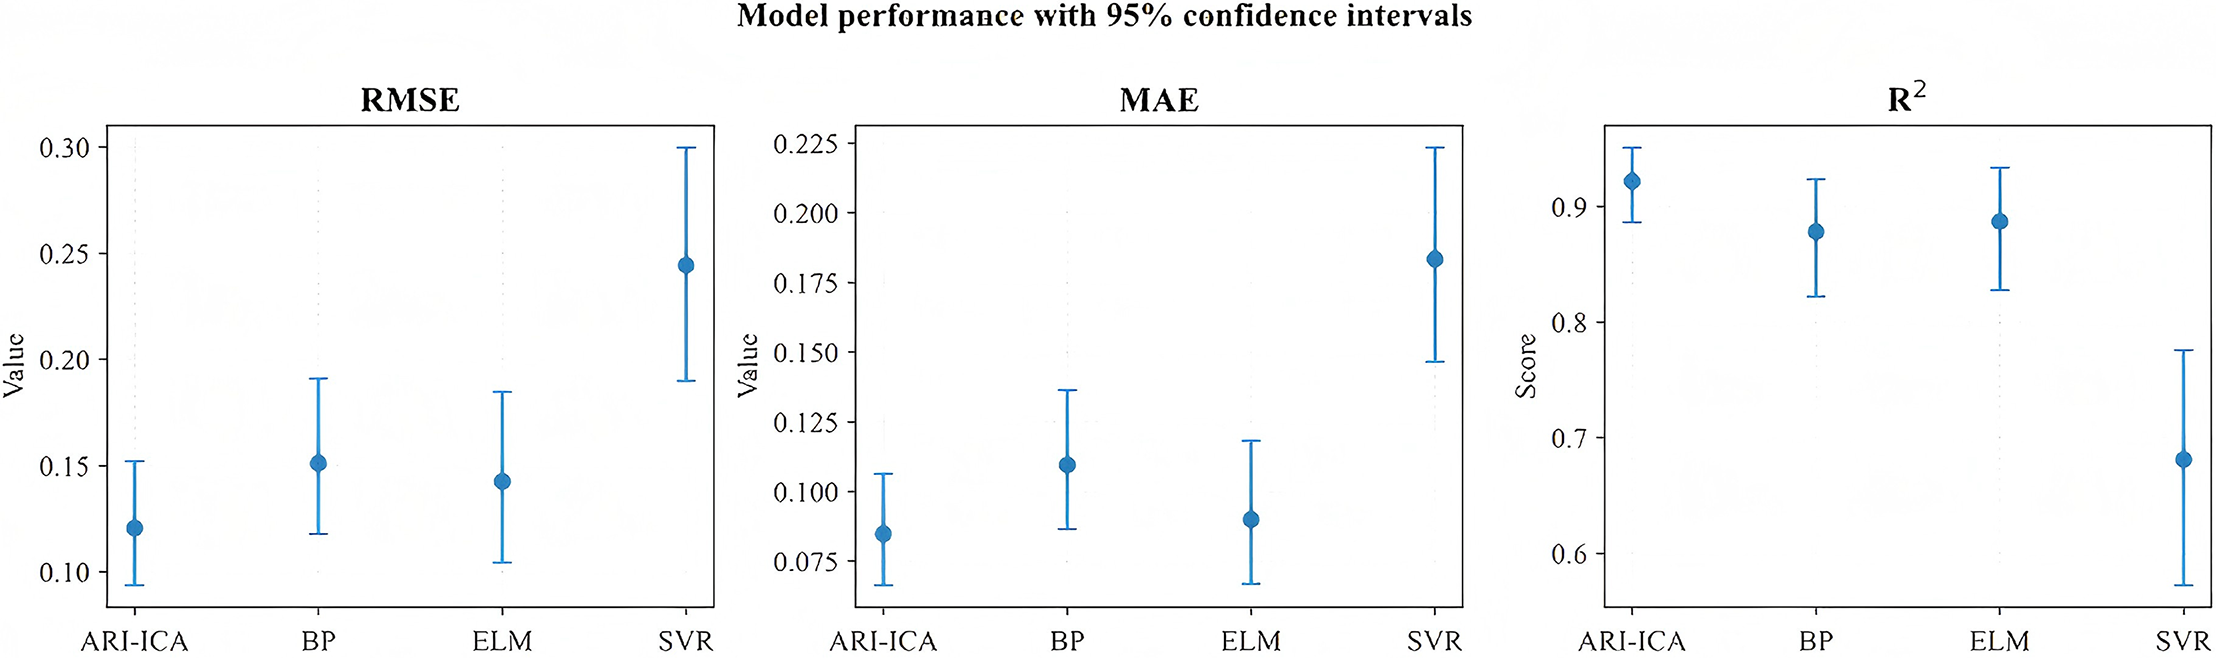
Figure 7 illustrates the trends of RMSE, MAE and R2 for different models on the test set. Figure 8 shows bar heights as metric means with error bars as 95% Confidence Intervals (CIs). This makes the superiority of ARI-ICA statistically transparent. As shown in the figure, the proposed ARI-ICA algorithm yields the lowest root mean square error among the four algorithms, as well as higher values of mean absolute error and coefficient of determination. All evaluation metrics are superior to those of the other three algorithms, demonstrating that the ARI-ICA based slurry mass concentration detection model developed in this chapter offers improved accuracy and robustness (Wu, Różycki & Wilamowski, 2015). This method enhances the accuracy of slurry mass concentration detection in coal production and meets the practical operational requirements of coal preparation plants.
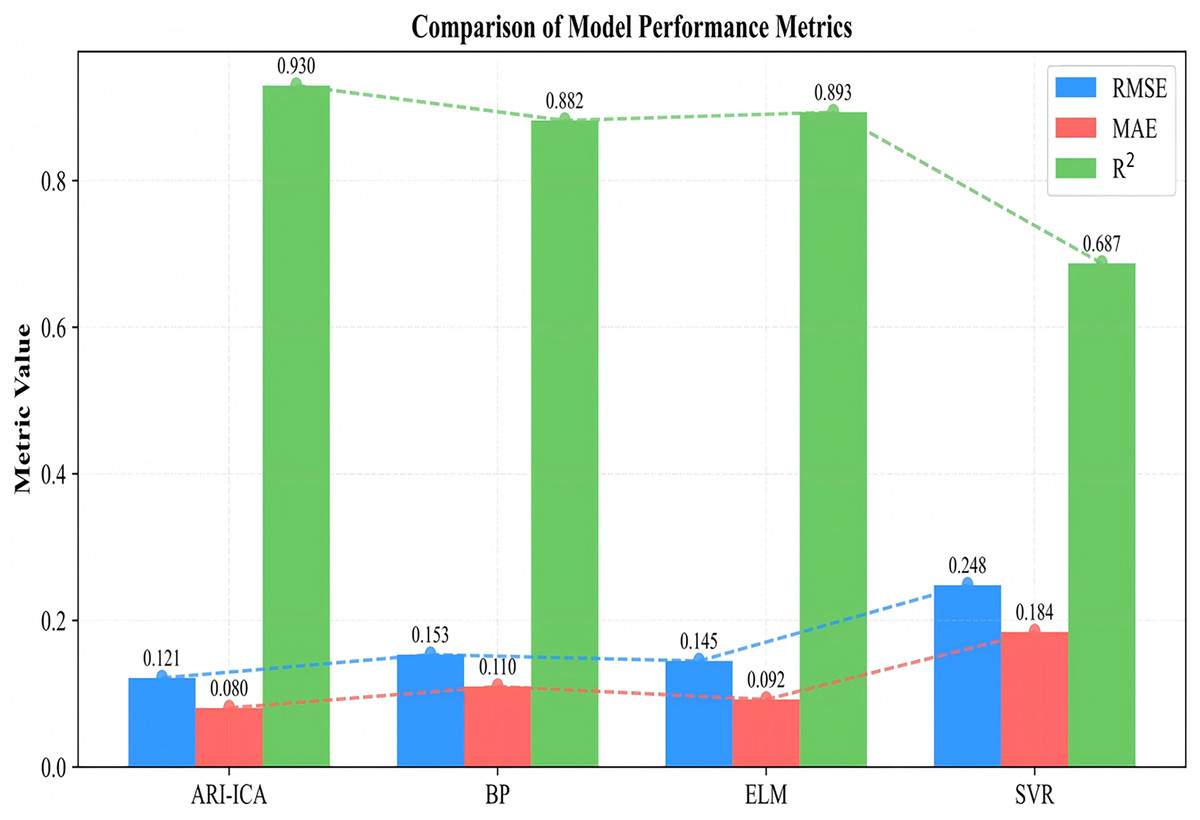
Figure 7: Test set trends of different models.
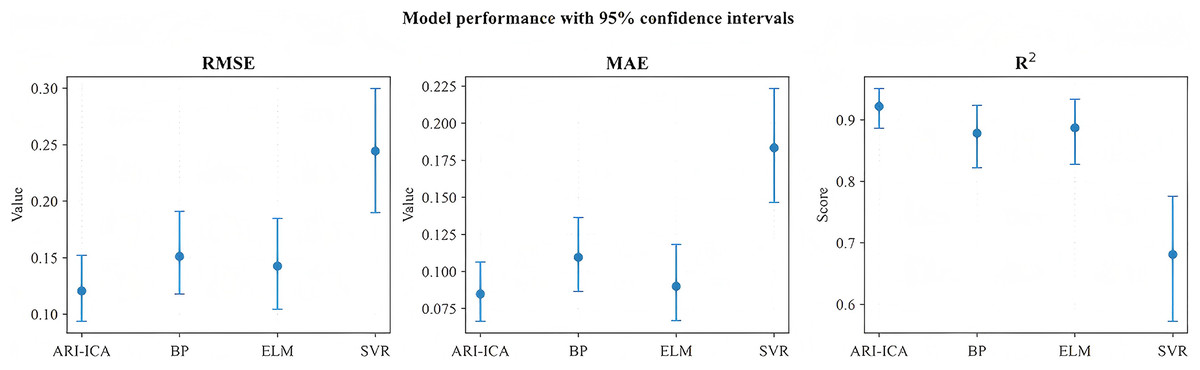
Figure 8: Uncertainty quantification: 95% confidence intervals for RMSE, MAE, and R2.
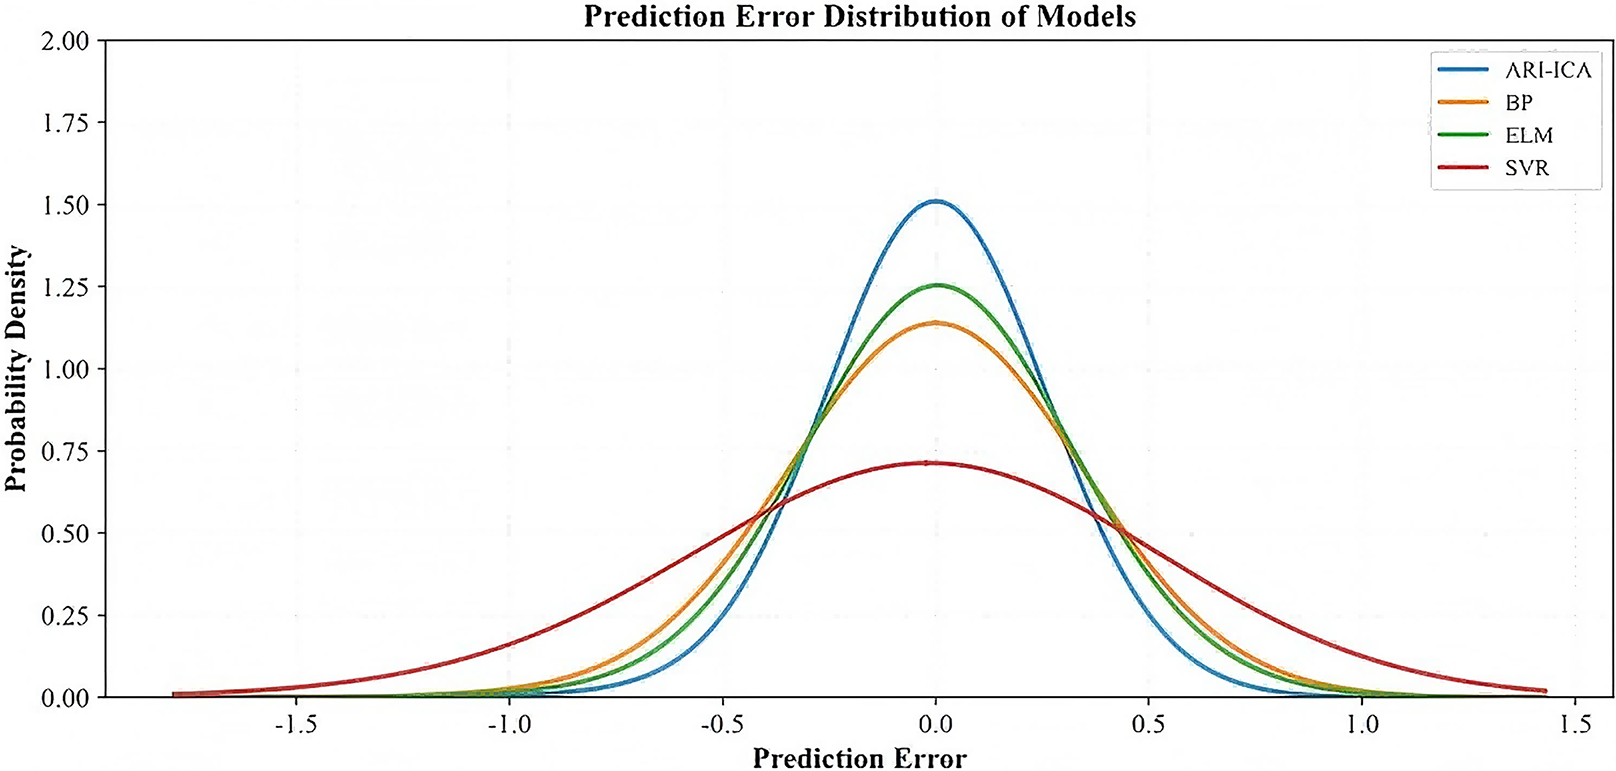
The probability density functions (PDF) of the estimation errors on the test set for the four models are shown in Fig. 9. The PDF curve of the ARI-ICA model exhibits an approximately normal distribution, characterized by lower probabilities at both ends and a higher peak at the center. This indicates a high concentration of prediction errors near zero, reflecting superior prediction accuracy and stability (Ma & Khorasani, 2004).
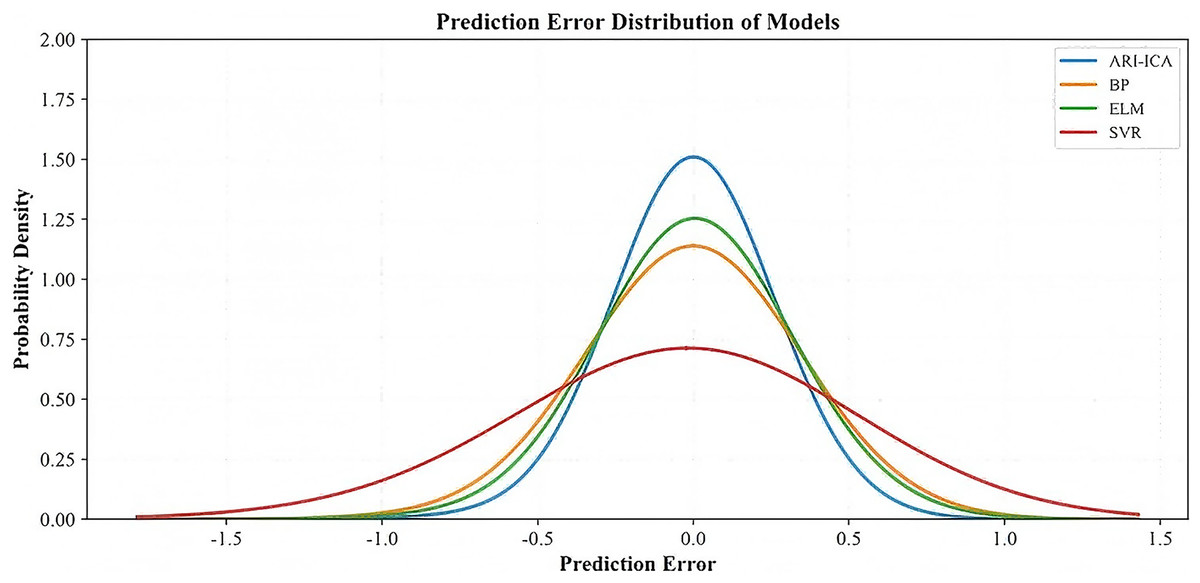
Figure 9: Probability density functions of estimation errors for different models.
We set ARI-ICA hyperparameters by three principles. (i) Capacity control under small-N: geometric node-acceptance with a dynamic cosine-squared threshold and early stopping limits hidden-layer growth and reduces overfitting. (ii) Stable search dynamics: residual-scaled dynamic sampling anneals bias magnitudes from coarse to fine; among (0.05, 1.0), (0.1, 5.0), (0.5, 10.0), (0.05, 1.0) gave fewer nodes/time-to-tolerance and lower test RMSE, hence adopted. (iii) Bias–variance balance: decaying ridge at the readout improves conditioning early and relaxes later; sensitivity across {0.90, 0.95, 0.99} shows 0.99 performs best on most datasets, corresponding to ~1% shrinkage per iteration. These choices, together with cross-validation, standardization, and fixed seeds, yielded consistent improvements in test RMSE/MAE/R² with 95% CIs and tighter error PDFs. Such characteristics make the ARI-ICA model more suitable for complex flotation industrial environments, whereas the other three models demonstrate relatively poorer performance.
System development and on-site application
In industrial practice, maximizing the deployment of AI-driven data-modeling techniques to unlock data value has become a priority for key-parameter monitoring and intelligent control in coal preparation processes. To enable online estimation of slurry solids concentration and provide an operator-facing visualization, we developed a multi-source data-fusion–driven intelligent prediction system based on a browser–server (B/S) architecture (Kwok & Yeung, 1997). The software architecture is shown in Fig. 10. The system adopts a decoupled front-end/back-end design coordinated through Application Programming Interface (API) endpoints: the front end is implemented with the Vue framework, and the back end uses Java and Python. Data models are mapped to relational database tables, and the method proposed in this study is embedded in the back-end service. Additional capabilities include data storage, local-area-network access, data querying, and Excel export. In operation, the system assists plant operators in rapidly adjusting reagent dosage and make-up water to optimize separation performance. For data acquisition, raw slurry data were collected in situ at a coal preparation plant during routine production.
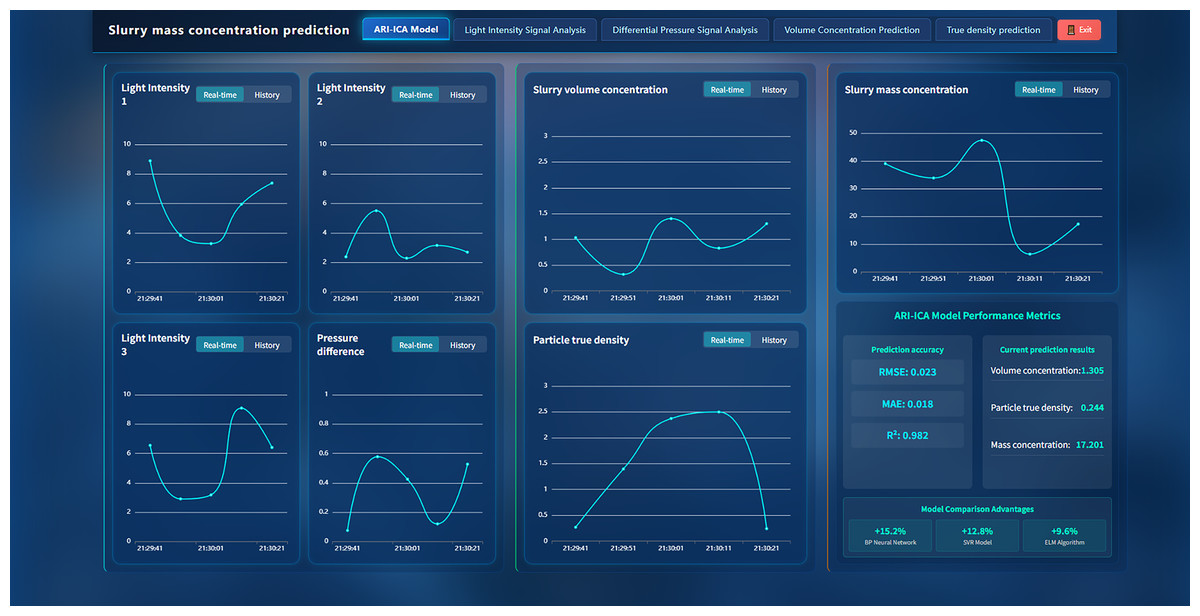
Figure 10: System software framework.
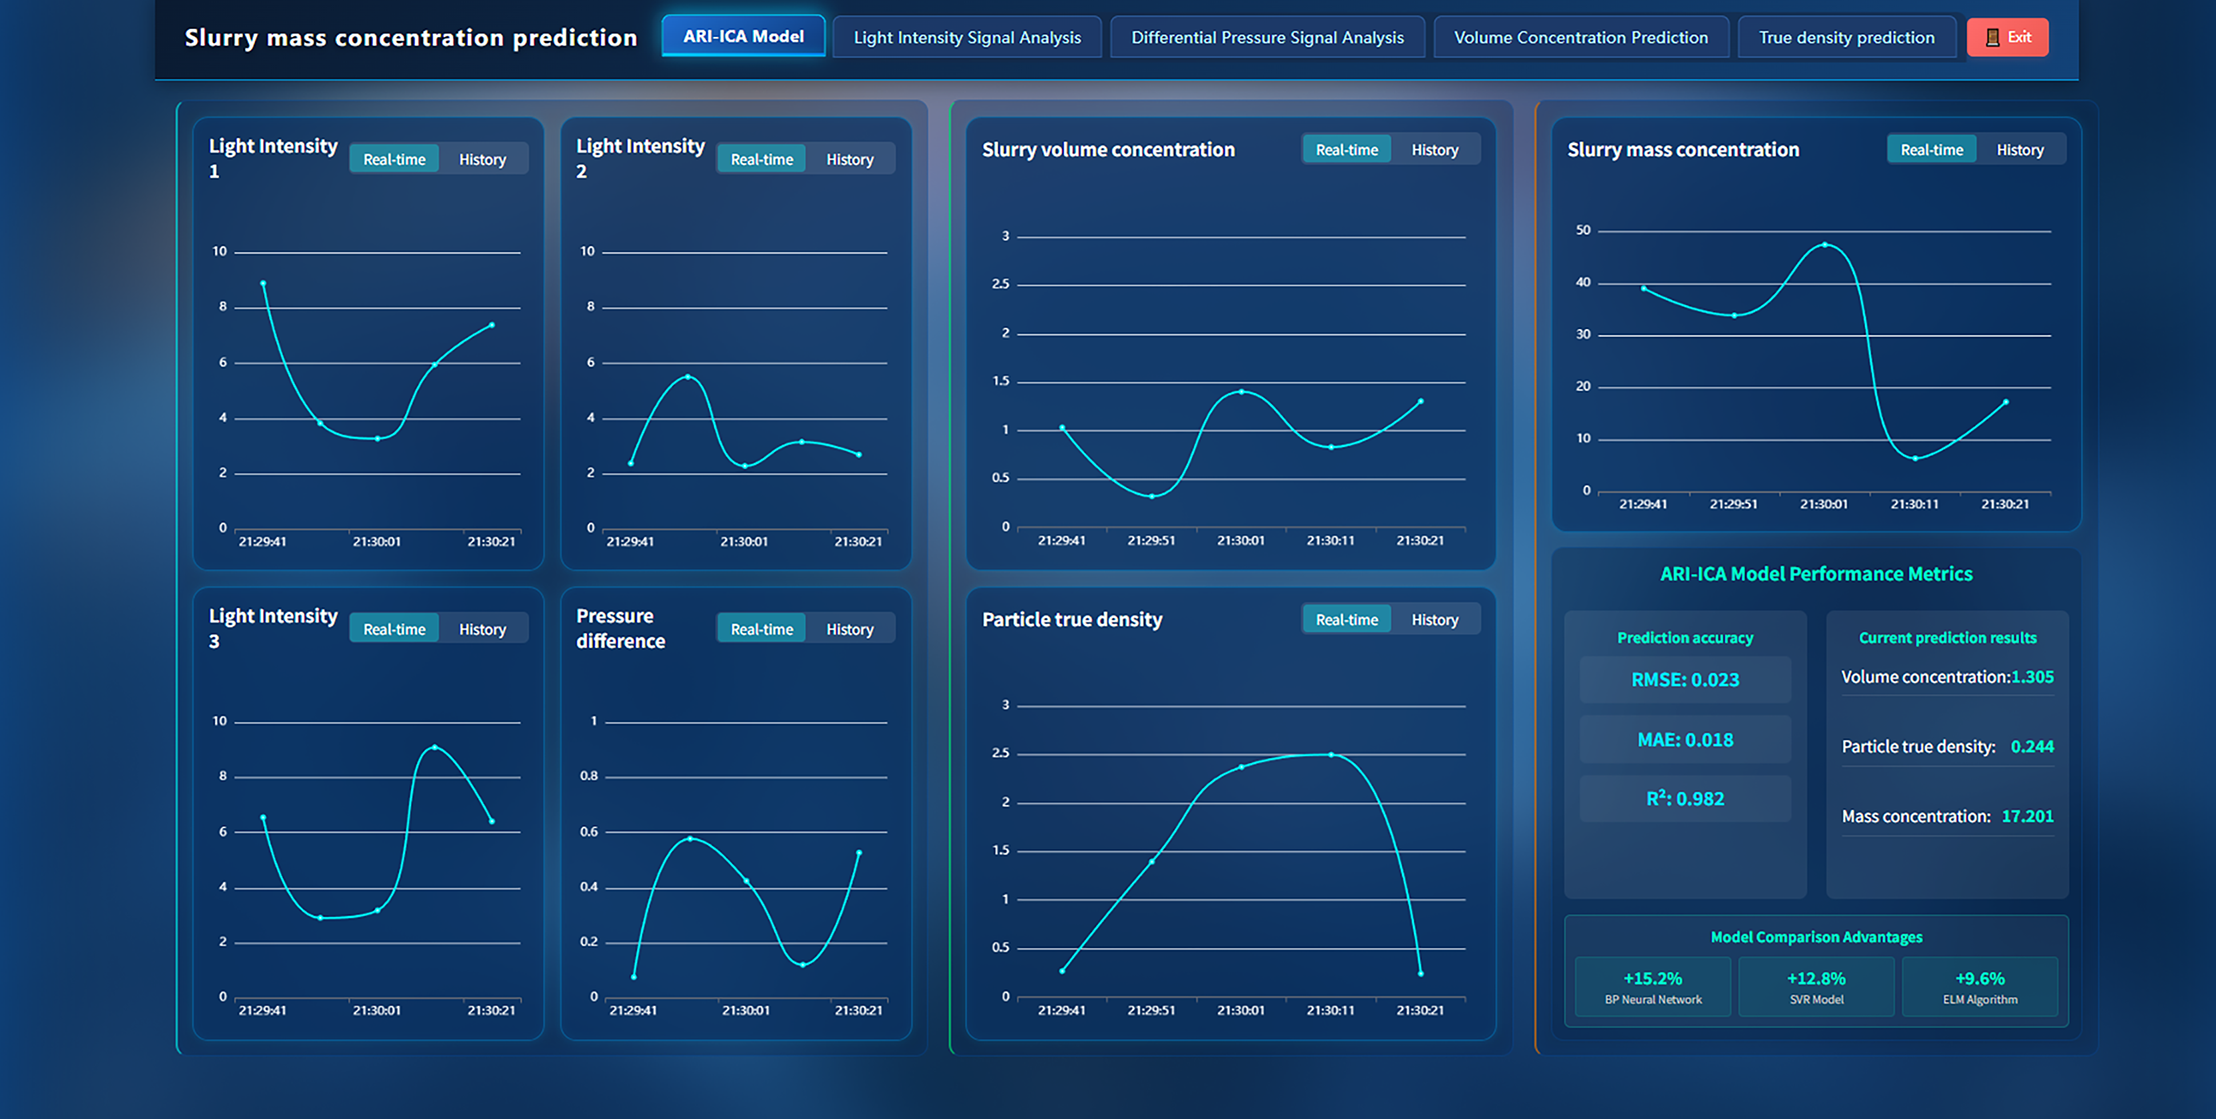
After deploying the acquisition hardware for optical-intensity and differential-pressure signals and implementing the prediction software, we evaluated the system under laboratory conditions. Slurry samples spanning a range of concentration gradients were collected during on-site shifts and circulated to the detection system via a recirculation pump, enabling synchronous acquisition of transmitted-light intensity and differential-pressure signals. In parallel, aliquots of each coal-slurry sample were oven-dried to obtain reference mass-concentration measurements. The system outputs were then compared against the laboratory references to assess measurement accuracy and stability.
As summarized in Table 1, the slurry mass-concentration detection system exhibits high predictive accuracy, with predictions closely matching the laboratory reference values. For all samples, the absolute prediction error is below 1.5%, and for most samples it is within 1%, indicating stable performance across different concentration levels. These results validate the effectiveness and practical utility of the proposed model, which remains robust to concentration fluctuations induced by changes in experimental conditions (Feng et al., 2009). The approach meets high-precision detection requirements and provides a solid technical basis for intelligent coal-slurry concentration monitoring and closed-loop process control.
| Sample number | Detect the quality and concentration of slurry (g/L) | Actual slurry mass concentration (g/L) | Absolute error/% |
|---|---|---|---|
| 1 | 18.52 | 19.17 | 0.65 |
| 2 | 22.52 | 21.93 | 0.59 |
| 3 | 20.16 | 21.14 | 0.98 |
| 4 | 32.54 | 32.73 | 0.19 |
| 5 | 15.31 | 14.06 | 1.25 |
| 6 | 43.12 | 42.27 | 0.85 |
| 7 | 21.35 | 22.13 | 0.78 |
| 8 | 28.47 | 28.30 | 0.17 |
| 9 | 32.37 | 33.49 | 1.12 |
| 10 | 48.78 | 47.91 | 0.87 |
Conclusions and outlook
This article addresses the challenge of real-time online measurement of slurry mass concentration in coal production by proposing a multi-source data fusion–driven prediction method. The approach utilizes two online-measurable signals—infrared light intensity and pressure difference—and employs the ARI-ICA model with adaptive feature node generation and decaying regularized regression to predict slurry volumetric concentration, particle true density, and slurry mass concentration. Future research may further explore the incorporation of additional influencing factors, the development of adaptive model parameter updating mechanisms, as well as long-term validation and deployment of the model in industrial field environments.
Operationally, the real-time predictions enable density-ratio, cyclone, thickener, and pump-speed loops that reduce re-work, pumping losses, and dryer duty, improving specific energy efficiency while maintaining product quality. The decaying-ridge schedule serves as a capacity controller, delivering strong early shrinkage and gradual relaxation, which improves generalization and numerical stability on small datasets. Through multi-source data fusion, the proposed method effectively combines optical and pressure information derived from distinct physical mechanisms. This integration enhances the robustness, interpretability, and accuracy of slurry mass concentration prediction, ensuring consistent performance under complex industrial conditions. Based on established physical formulas, these intermediate variables are further utilized to calculate the slurry mass concentration, achieving high-accuracy online prediction of this critical process parameter.
The results show that the two modalities exhibit complementary sensitivity to fluctuations in turbulence intensity and particle-size dispersion. When high turbidity causes the optical channel to deviate from Lambert–Beer behavior or become locally saturated, the differential-pressure channel provides robust constraints through the distributed friction and hydrostatic terms. Conversely, when perturbations in pipeline geometry or flow rate bias the pressure-drop signal, the optical channel remains more sensitive to microscopic particle variations, thereby introducing redundant noise immunity and improving stability under complex operating conditions. ARI-ICA mitigates overfitting via residual-driven incremental construction, dynamically adjusted sampling intervals, and gradually decaying ridge regularization, enabling sparse and robust learning in the small-sample regime. Cross-validation and early stopping are further employed to ensure structural convergence and strong generalization performance. Compared with traditional methods such as BP neural networks, SVR, and ELM, the ARI-ICA model achieves superior prediction performance in terms of RMSE, MAE, and coefficient of determination (R2). On the test set, the proposed model achieves an RMSE of 0.121, an MAE of 0.080, and a coefficient of determination R2 = 0.93. These correspond to RMSE reductions of approximately 20.9%, 16.6%, and 51.2% and MAE reductions of 27.3%, 13.0%, and 56.5% relative to the BP, ELM, and SVR models, respectively, while R2 is improved by 0.048–0.243. The error probability density function (PDF) further shows that ARI-ICA exhibits the highest and most sharply concentrated peak, indicating smaller error variance and stronger robustness to noise, thereby confirming its applicability and advantage in slurry mass concentration soft sensing tasks.
Supplemental Information
Data and source code.
The data utilized in this study were obtained from a laboratory-built experimental platform for slurry mass concentration measurement. Based on a differential pressure sensing system and a dual-modal collaborative detection method combining multifunctional infrared transmission, over 160 experimental samples were collected. All data were acquired in real time via on-site instruments and calibrated through manual chemical assays, comprising slurry mass concentration measurements corresponding to differential pressure signals and light intensity signals at different frequencies (Cao & Lin, 2014). For model development and validation, 70% of the continuously collected data were allocated to the training set and 30% to the test set. The prediction experimental outcomes on the test set were ultimately utilized as the basis for evaluating and analyzing the model performance in this study. The PDF curve of the ARI-ICA model exhibits an approximately normal distribution, characterized by lower probabilities at both ends and a higher peak at the center. This indicates a high concentration of prediction errors near zero, reflecting superior prediction accuracy and stability. The trends of RMSE, MAE and R2 for different models on the test set. As shown in the figure, the proposed ARI-ICA algorithm yields the lowest root mean square error among the four algorithms.