Research and application of ceramic identification and traceability methods based on SIFT and blockchain
- Published
- Accepted
- Received
- Academic Editor
- Xiangjie Kong
- Subject Areas
- Algorithms and Analysis of Algorithms, Artificial Intelligence, Computer Vision, Security and Privacy, Blockchain
- Keywords
- Microscopic image, SIFT, AdaLAM, Blockchain, IPFS
- Copyright
- © 2025 Chang et al.
- Licence
- This is an open access article distributed under the terms of the Creative Commons Attribution License, which permits unrestricted use, distribution, reproduction and adaptation in any medium and for any purpose provided that it is properly attributed. For attribution, the original author(s), title, publication source (PeerJ Computer Science) and either DOI or URL of the article must be cited.
- Cite this article
- 2025. Research and application of ceramic identification and traceability methods based on SIFT and blockchain. PeerJ Computer Science 11:e3325 https://doi.org/10.7717/peerj-cs.3325
Abstract
To address the challenges in ceramic artwork authentication and provenance—such as reduced matching precision caused by edge noise and outliers and the high storage cost of blockchain systems—we propose a hybrid SIFT (Scale Invariant Feature Transform)-Canny-Adaptive Locally-Affine Matching (AdaLAM) algorithm integrated with an Inter Planetary File System (IPFS)-blockchain solution. The proposed method first applies Canny edge detection to remove irrelevant edge points and then leverages AdaLAM’s local geometric consistency verification to dynamically optimize the matching threshold, enabling high-precision feature matching on low-texture microscopic images. On the micro-ceramic dataset, the proposed method achieves an average precision of 99.33% and an Root Mean Square Error (RMSE) of 0.0934 pixels, significantly outperforming the traditional SIFT+BF (Brute Force Matching) method (precision = 36.29%, RMSE = 32.7237 pixels), with a 63.04% improvement in precision and a 350-fold reduction in RMSE. The method maintains state-of-the-art robustness under varying scale, rotation (45°–270°), and illumination conditions (±15°), achieving a precision of 1.0. Additionally, microscopic images are stored using IPFS, resulting in a 99.9969% reduction in storage cost. A decentralized ceramic traceability system is implemented via smart contracts, offering a low-cost and highly robust solution. This work offers a novel technological pathway for ceramic identification and provenance.
Introduction
Ceramics are among the most common items in daily life, yet for ceramic artworks and antiques with collectible or commercial value, authentication and provenance are essential. Traditional manual inspection methods (Enyuan et al., 2021) still hold value for identifying individual items; however, as the quantity of ceramic pieces increases, issues of efficiency and accuracy may arise.
Physical and chemical analysis methods (Kagonbé et al., 2021) are commonly used for ceramic authentication. However, these approaches typically require expensive equipment and must be operated by trained professionals. Although some improved physical and chemical techniques (Mammadov & Ahadova, 2023; Húlan et al., 2023) yield better experimental results, they still require sampling from the ceramic object, which can be invasive and potentially damaging.
In recent years, computer-based methods have shown promising results in ceramic identification and offer potential solutions to the aforementioned limitations. For example, Hocenski, Matić & Vidović (2016) demonstrated a computer vision workstation prototype for real-time detection of defects in unfired bricks. Niu, Zhang & Chen (2022) proposed a deep learning-based feature extraction method using Eased as the platform and applied it to 5,834 images of 272 types of ancient ceramics from kilns, tombs, and Yue kiln sites. The system achieved good performance through manual annotation and supervised training. Ling et al. (2025) introduced a multi-task learning approach for the identification of porcelain from the Song and Yuan dynasties. This deep learning-based method requires a large volume of annotated data to achieve accurate classification.
Image acquisition is of fundamental importance in computer vision-based ceramic feature extraction. When employing macroscopic images, we have to execute non-destructive sampling. However, macroscopic traits are generally easy to mimic, which restricts their efficiency in identification tasks. To solve this issue, we consider the usage of microscopic pictures. Unlike surface patterns, microscopic characteristics—such as air bubbles in the ceramic matrix—are essentially distinct to each piece and are generated irrevocably during the firing process, i.e., are extremely unique and cannot be copied.
For example, Chai et al. (2020) proposed an approach for producing microscopic fingerprint photographs of ceramics using specific microscopic areas to identify distinct objects. Qiu, Xu & Cheng (2022) coupled microscopic features with computer vision algorithms for ceramics identification, demonstrating the potential of microstructural information in assuring ceramic identification.
This research proposes a viable and reliable technique for ceramic identification, combining microscopic properties of ceramics and computer vision. This study introduces the SIFT-Canny-AdaLAM (Scale Invariant Feature Transform-Canny-Adaptive Locally-Affine Matching) algorithm to further increase recognition accuracy and enhance the identification effect.
In recent years, data security challenges have become increasingly prevalent. However, centralized data storage is still widespread, mainly due to its advantages of huge capacity, easy maintenance, fast processing, and minimal resource usage (Islam & Apu, 2024).
However, the limitations of centralized storage are significant. As noted by Mistry et al. (2020), such systems are more susceptible to cyberattacks and typically involve substantial maintenance costs. A breach in a centralized network can lead to the failure of the entire system.
Due to the constraints of centralized storage, researchers have been researching alternative network storage options. Di Pierro (2017) characterize blockchain as a unique technology based on hashing algorithms that underpins bitcoin transactions and the execution of smart contracts. Guo & Yu (2022) note that blockchain offers a wonderful collection of features like decentralization, anonymity, auditability, verifiability, transparency, and data integrity. Varma et al. (2024) fully evaluated blockchain technology in the context of sustainable supply chains. Chen, Li & Xu (2024) suggested that blockchain can help to prevent fraud and increase supply chain traceability.
Therefore, leveraging the immutability of blockchain for ceramic product traceability is both practical and feasible. However, it is essential to address the high cost of storing large-volume ceramic images on-chain and explore low-cost solutions.
Related work
Identification
Ceramic artworks are easily replicated at the macroscopic level, and methods based on macro features (such as physical or chemical techniques) may damage the ceramics. Therefore, we adopt a microscopic approach.
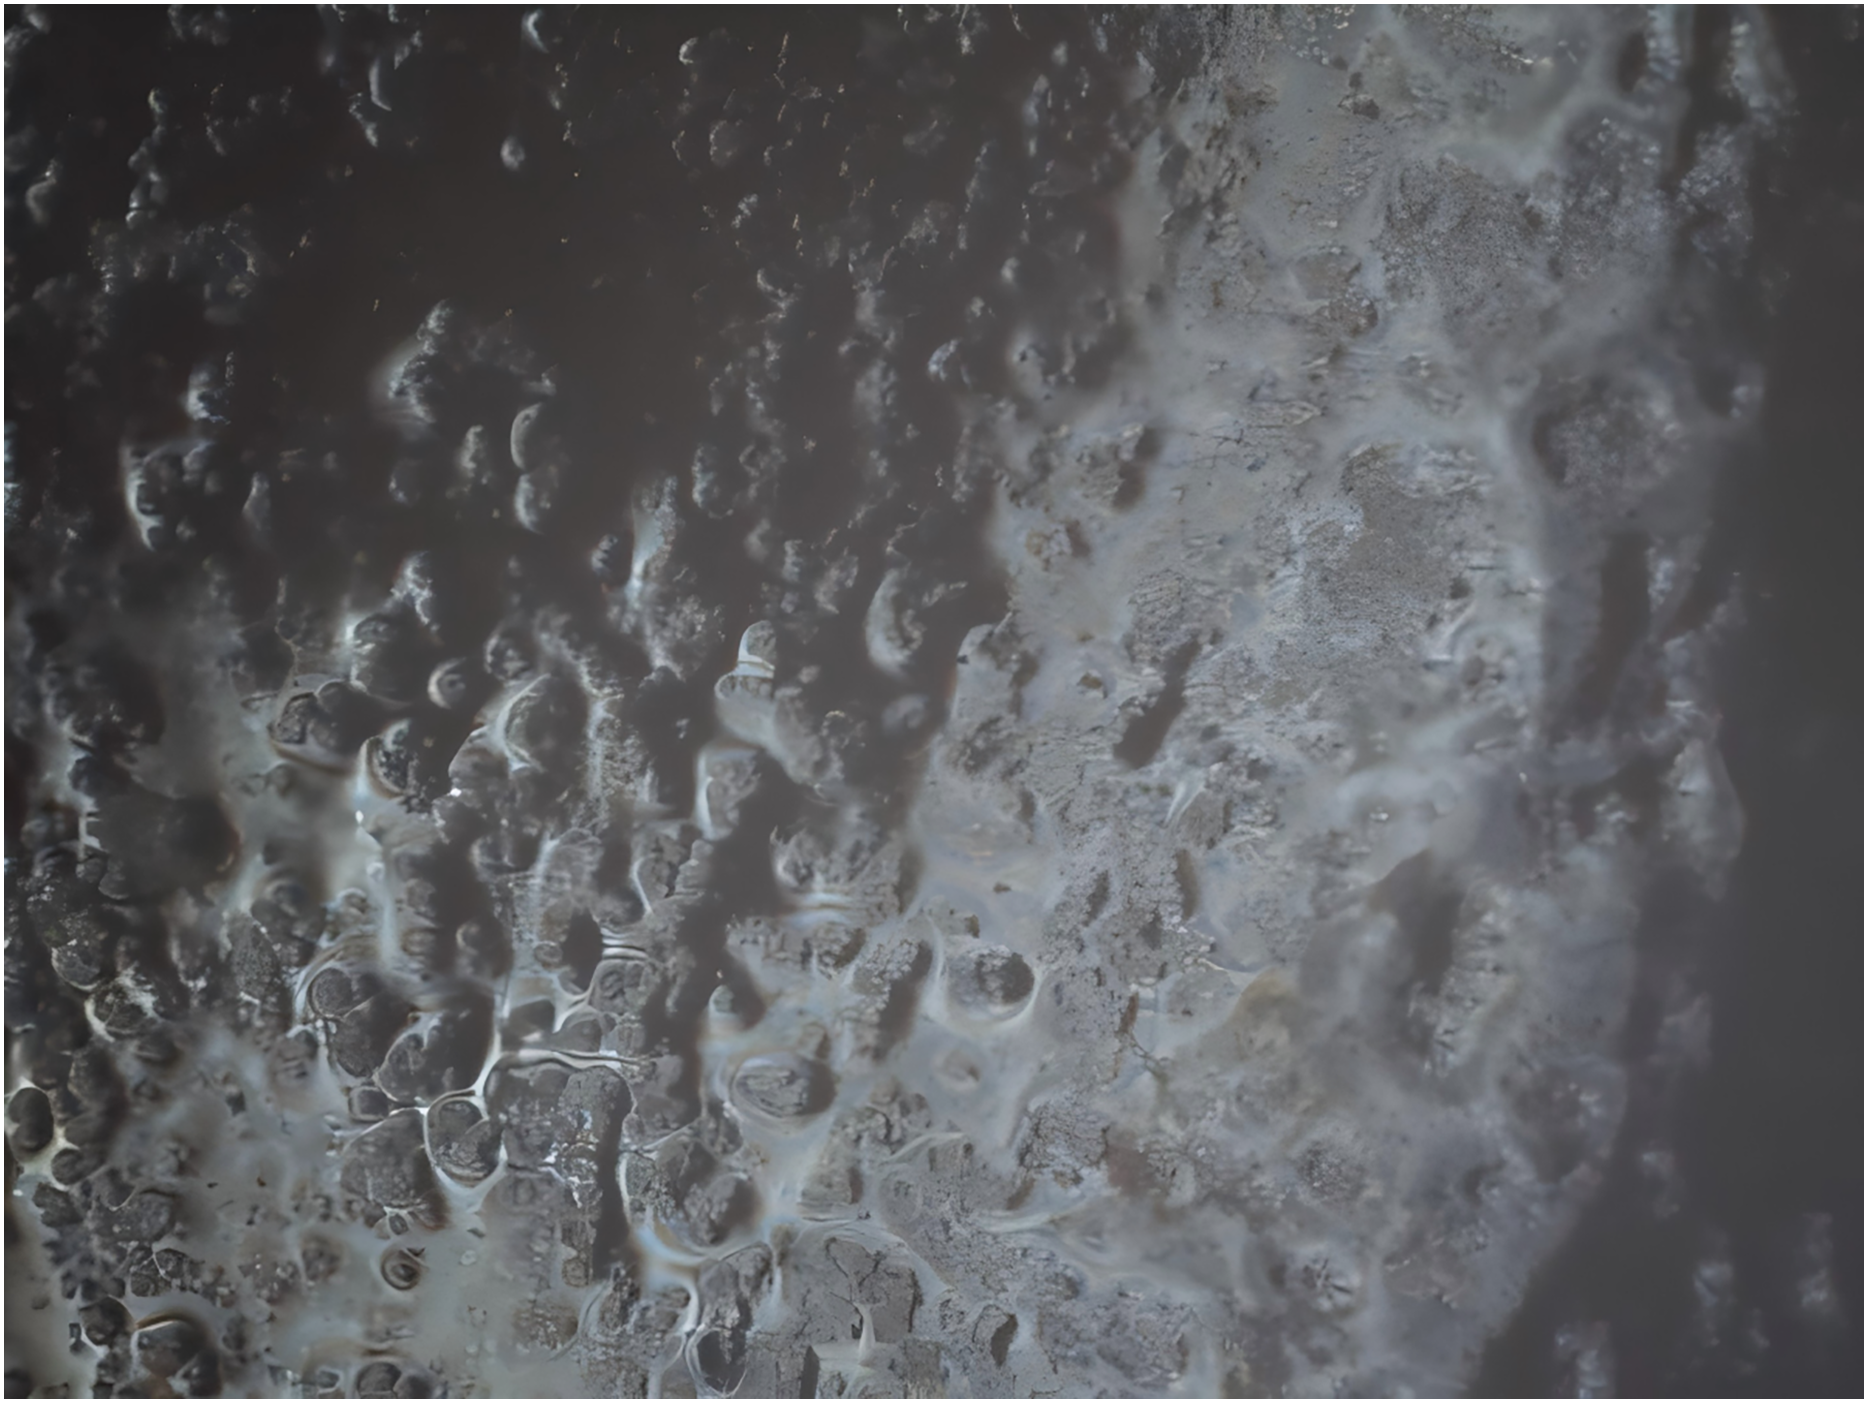
We first connect the microscope to the computer, then adjust the constant light source, and finally fine-tune the eyepiece and objective lens to capture clear images of ceramic bubbles. Figure 1 shows a microscopic image of ceramics, where the holes are randomly arranged.
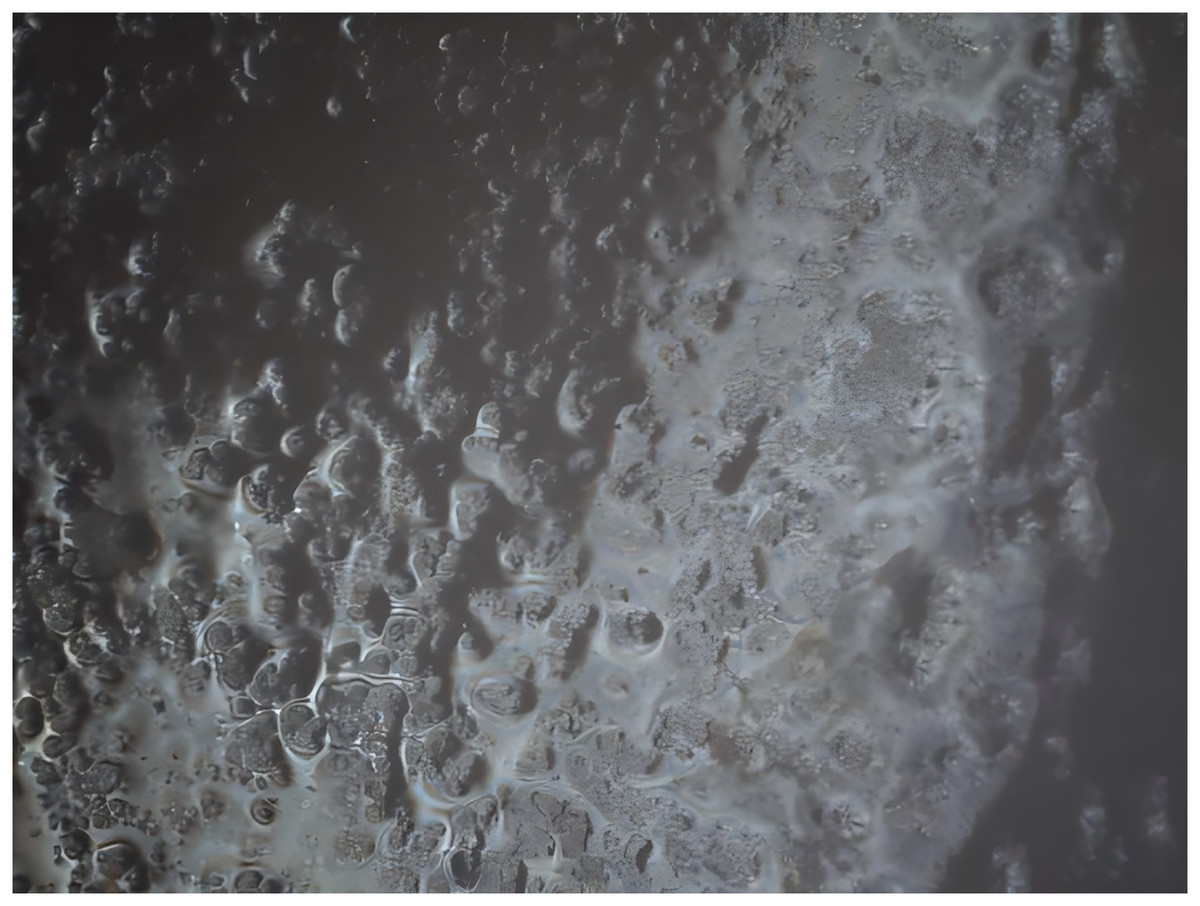
Figure 1: The arrangement of pores on the ceramic surface.
After capturing the microscopic pores of the ceramics, we can use computer vision-based for ceramic authentication. Image feature matching can be applied to tasks such as image fusion, image retrieval, object tracking, face recognition, and change detection (Leng et al., 2019). There are many classic image feature matching algorithms. For example, SIFT (Scale Invariant Feature Transform) (Lowe, 2004), SURF (Speeded Up Robust Features) (Bay et al., 2007), and ORB (Oriented FAST and Rotated BRIEF) (Rublee et al., 2011).
In recent years, many scholars have proposed improved methods based on these algorithms. Cavalli et al. (2020) proposed the AdaLAM algorithm based on SIFT, achieving excellent results in challenges. Tang et al. (2022) proposed an improved SIFT algorithm, which shortened image processing time and reduced algorithmic errors compared to the traditional SIFT. Liu et al. (2022) proposed an enhanced SIFT algorithm, which could be applied to subsequent straw cover detection. Jiang et al. (2023) designed a feature point detection method based on the SURF algorithm and a rotation binary descriptor construction method. Xie et al. (2022) presented an improved ORB algorithm, which enhanced the performance of ORB under conditions of underexposure or overexposure.
In a review by Chen, Rottensteiner & Heipke (2021), a detailed analysis of various types of image feature matching algorithms was presented. The review summarized the comparison between the SIFT algorithm and other feature-matching algorithms in terms of rotational invariance, scale invariance, illumination invariance, and robustness to viewpoint variations, as shown in Table 1.
| Algorithms | Rotation invariance | Scale invariance | Illumination invariance | Robustness to viewpoint changes |
|---|---|---|---|---|
| SIFT | Y | Y | Y | High |
| FAST | Y | Medium | ||
| ORB | Y | Y | Low | |
| Quad-Networks | Y | Y | Y | High |
| LIFT | Y | Y | Y | High |
Note:
Y stands for algorithm has some advantages in this aspect.
This comparison highlights the advantages of SIFT in ceramic authentication due to its strong robustness. Based on this, a more detailed comparison with our proposed method is provided in Table 2.
| Method | Core advantages | Limitations |
|---|---|---|
| SIFT+BF | scale invariance | high mismatch rate at edge points (>50%) |
| SIFT+RANSAC | robustness to outliers | high computational complexity (≥200 iterations) |
| FAST, ORB | high processing speed | few feature points extracted |
| Deep learning (e.g., Quad-Networks) | automated feature learning | often requires thousands to tens of thousands of labeled images, depending on task complexity and model architecture (Niu, Zhang & Chen, 2022; Ling et al., 2025) |
| Our method | edge filtering + dynamic matching | requires manual tuning of Canny thresholds |
Analysis: Traditional methods perform poorly in low-texture scenarios. The SIFT algorithm is sensitive to edge noise during matching. Due to the homogeneous texture of ceramic micro-images, 30–40% of keypoints detected by traditional SIFT fall on edges, leading to reduced matching accuracy. Deep learning models require high training costs. In contrast, our method achieves a breakthrough in accuracy by combining lightweight preprocessing (Canny edge detection) with geometric verification (AdaLAM).
Traceability
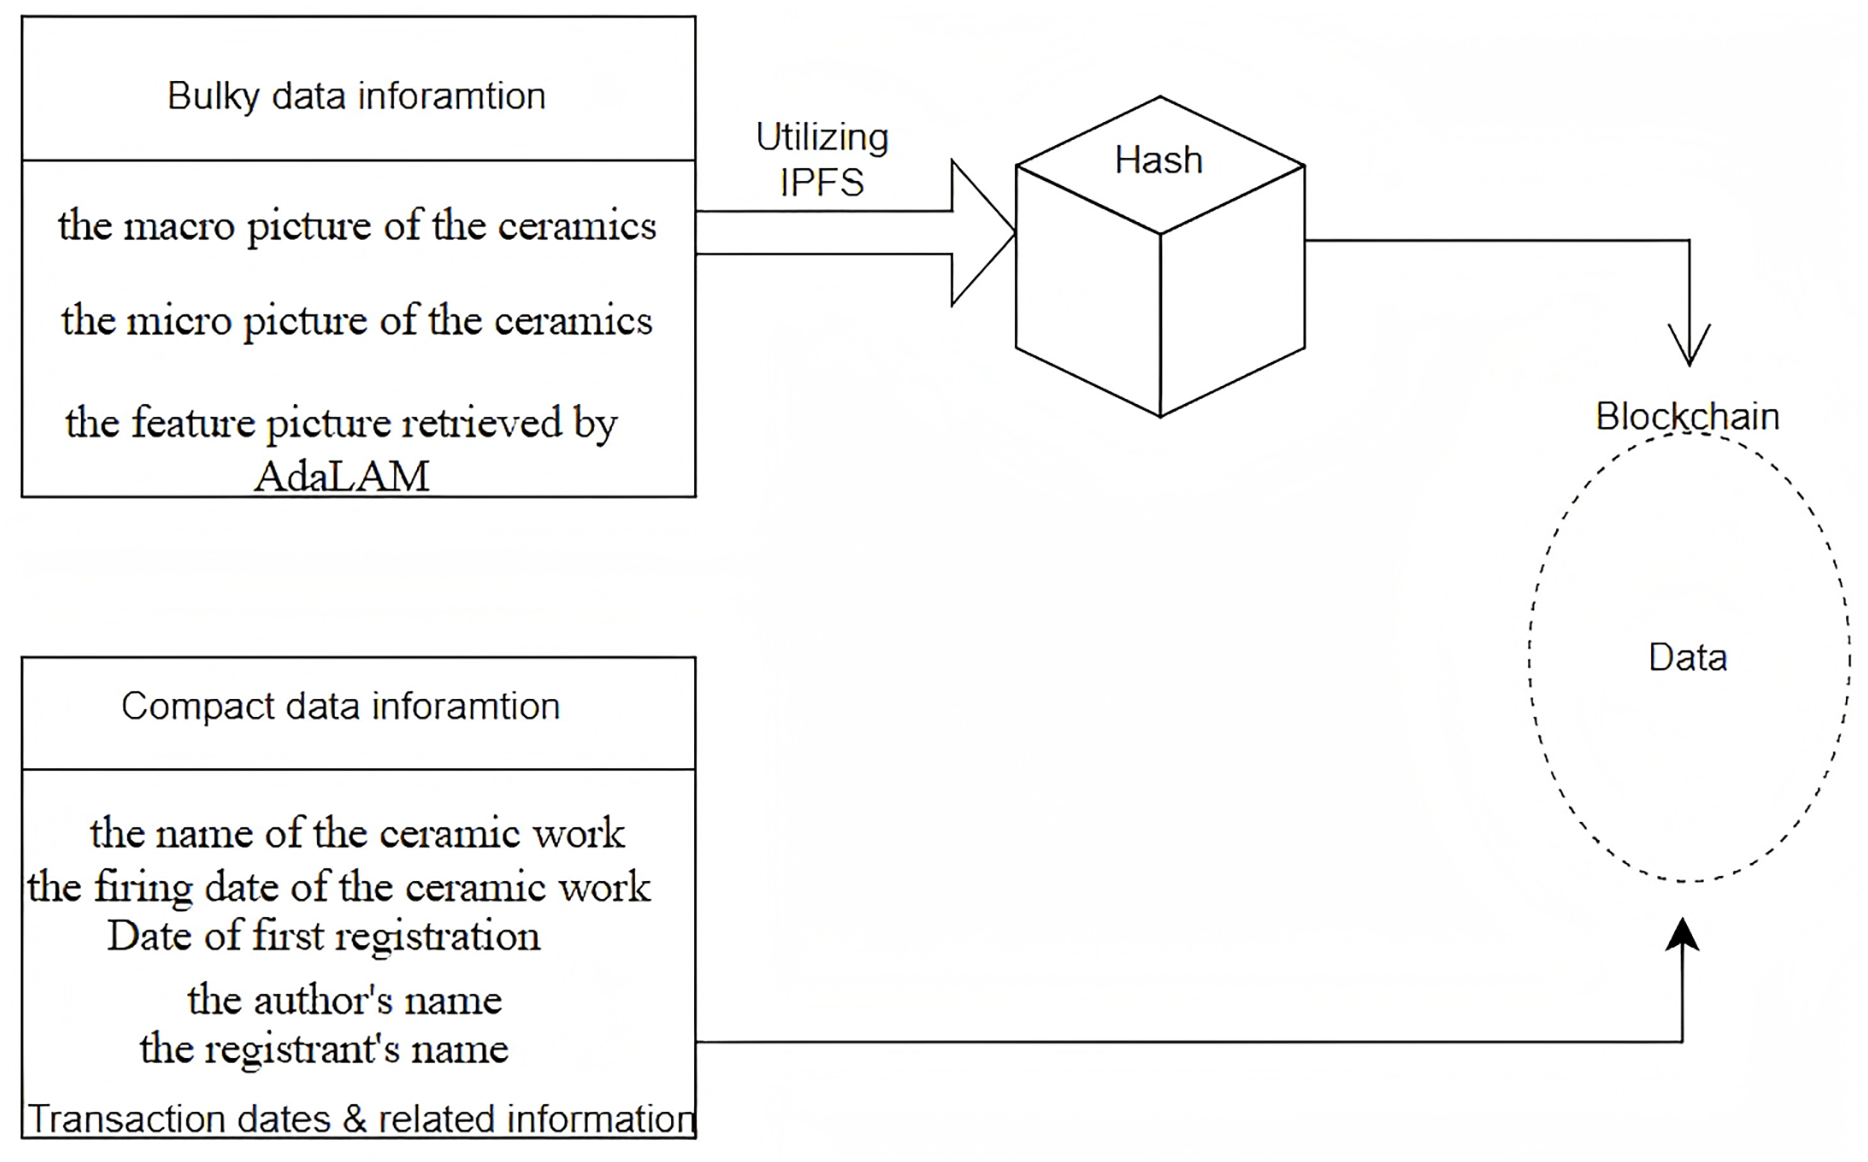
The first challenge we address is determining which types of information should be recorded for ceramic artifacts. We classify this information into two categories: high-volume data, which requires significant storage capacity and incurs high storage costs, and low-volume data, which consumes minimal memory and is more suitable for direct on-chain storage. High-volume data includes macro images, microstructural images of ceramics, and feature images extracted via computer vision techniques. Low-volume data refers to structured metadata such as the name of the ceramic piece, firing date, date of blockchain registration, artist name, and registrar identity.
The second research question we address is how to achieve cost-efficient data integration into the blockchain. While low-volume data can be directly stored on-chain, the high cost associated with storing high-volume data necessitates alternative strategies. Doan et al. (2022) introduced the InterPlanetary File System (IPFS), a novel decentralized storage architecture built on the principles of peer-to-peer networking and content addressing, enabling distributed cloud storage applicable in various scenarios. Kumar & Tripathi (2019) proposed a blockchain storage model based on IPFS to address challenges related to block-specific storage and transaction access. Dorri et al. (2021) presented a removable blockchain architecture incorporating a Temporary Chain (TC), which allows transaction data to be stored for a limited time, thereby reducing latency. Inspired by these works, our approach stores high-volume data in IPFS and then embeds the returned hash along with low-volume data into the blockchain, enabling a low-cost, hybrid on-chain/off-chain storage mechanism.
Recent research has further proved the practicality of such an architecture. Madushanka, Kumara & Rathnaweera (2024) presented the “SecureRights” architecture, which blends blockchain, digital watermarking, and IPFS to enable safe digital storage and copyright verification. Embedding watermarks and timestamps within the blockchain, the technology boosts tamper resistance and verifiability. Lamichhane & Herbke (2024) presented “Verifiable Decentralized IPFS Clustering (VDIC),” which improves data trust in IPFS utilizing decentralized IDs and verifiable credentials; these qualities are well suited for cultural heritage protection. Haque et al. (2024) propose a hybrid paradigm that combines the decentralization of blockchain with the off-chain data storage efficiency of IPFS. Together, these investigations demonstrate the feasibility of an “off-chain storage, on-chain verification” method in the cultural and artistic areas. Based on these studies, this research employs an IPFS-blockchain hybrid architecture that stores high-volume ceramic image data in IPFS and records the returned hash values and low-volume metadata on the Ethernet blockchain, thus realizing a tamper-proof, low-cost, and efficient traceability framework.
Finally, in order to implement the traceability function of registration and query, a specialized smart contract was built in this study. According to Zheng et al. (2020), a smart contract is an auto-execution mechanism placed on a blockchain that encapsulates predetermined rules and conditions. Once these requirements are fulfilled, the contract automatically activates the necessary action. In this work, smart contracts are designed to manage two key functions: registration and retrieval of ceramic records. To strengthen security, techniques such as access control and re-entry prevention are implemented into the contract.
System overview
The novelty of this system lies in the tailored integration of the SIFT, Canny, and AdaLAM algorithms for the domain of microscopic ceramic image recognition. While each algorithm is well-established individually, to the best of our knowledge, no prior work has combined them with domain-specific parameter optimization to address the unique challenges of microscopic ceramic images, such as high edge noise, low-texture surfaces, and domain-specific matching precision requirements. This tailored combination and application significantly improve matching precision and robustness compared to traditional ceramic recognition methods. Additionally, by leveraging the immutable nature of blockchain data, the system significantly enhances the reliability of ceramic recognition results.
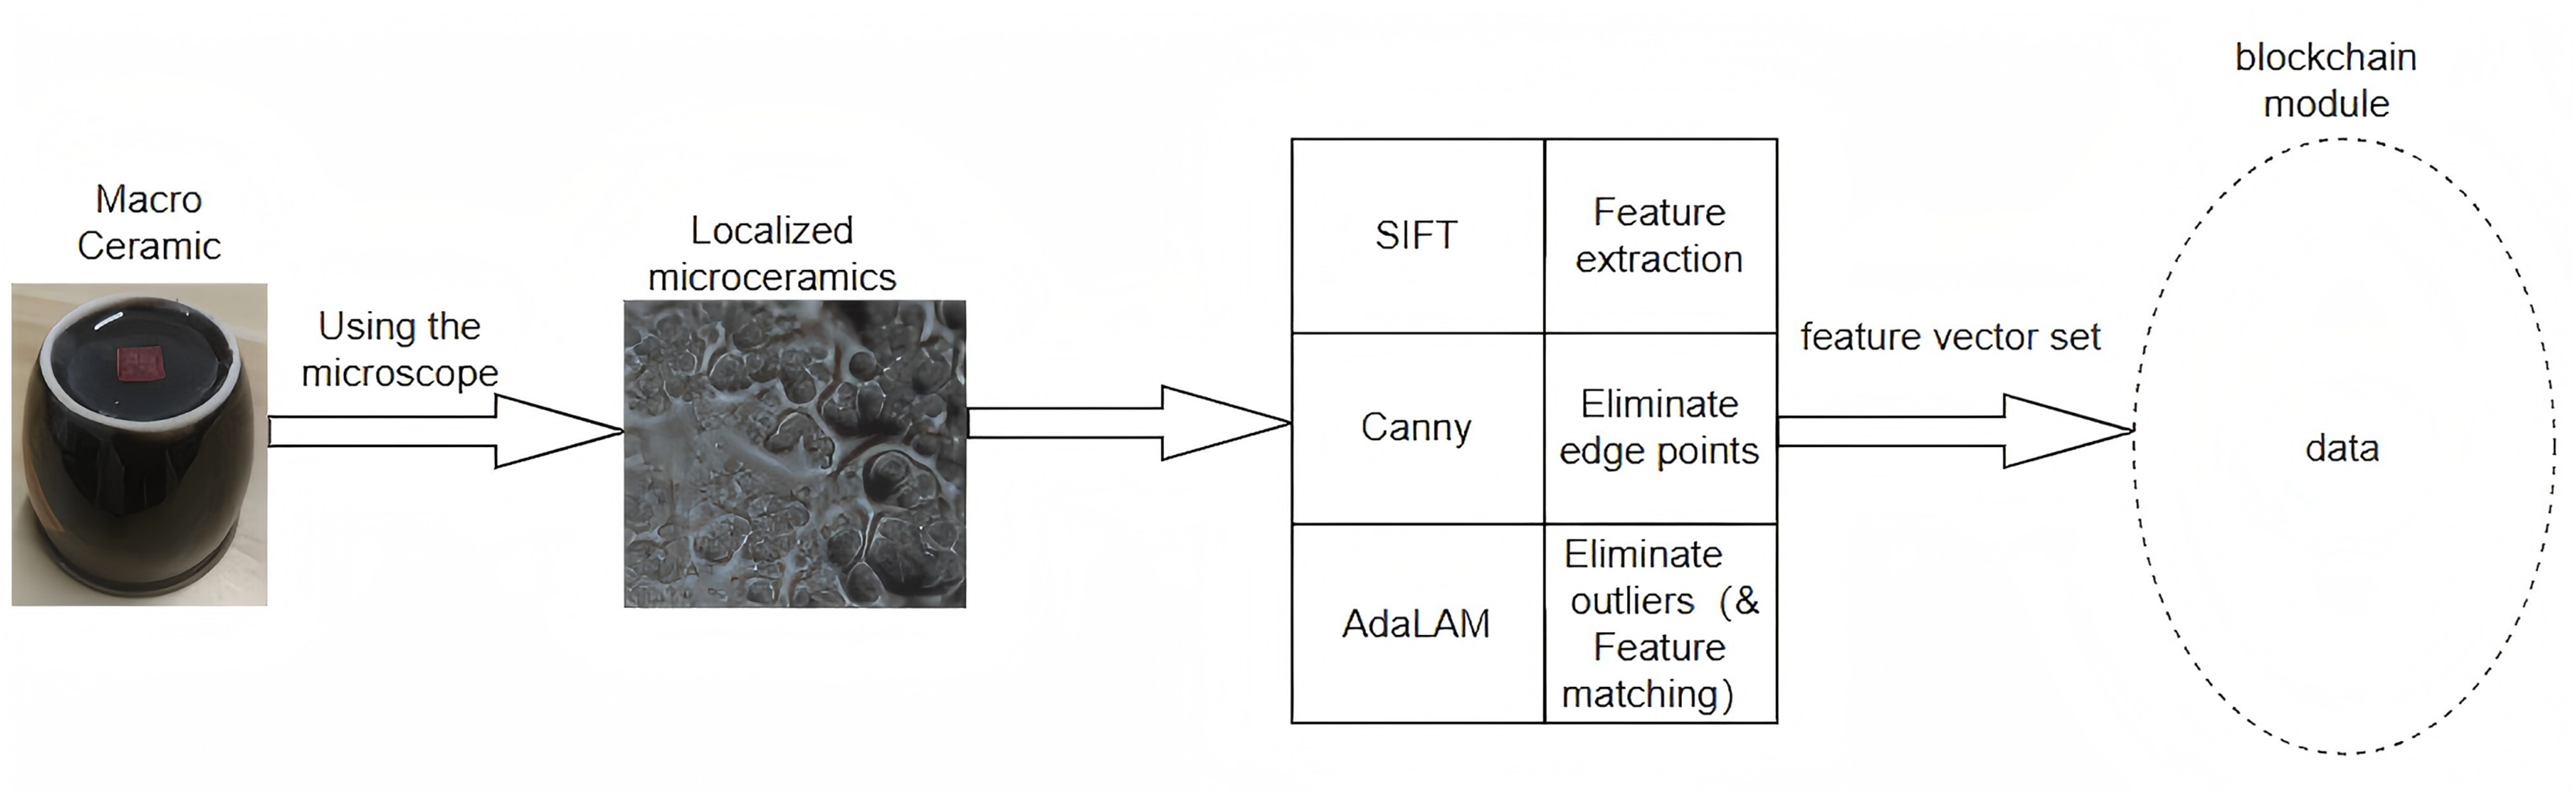
Figure 2 illustrates the identification process. When registering a new image, a micrograph is captured using a microscope, followed by feature point extraction through the SIFT algorithm. The Canny algorithm is then employed to remove edge points, and outliers are eliminated using the AdaLAM algorithm. Finally, the extracted feature vector set is transferred to the storage module. When verifying the ceramics, a micrograph is taken from the required position, the SIFT-Canny-AdaLAM method is applied, and the AdaLAM algorithm’s matching function is used to compare it with the ceramic data stored on the blockchain.
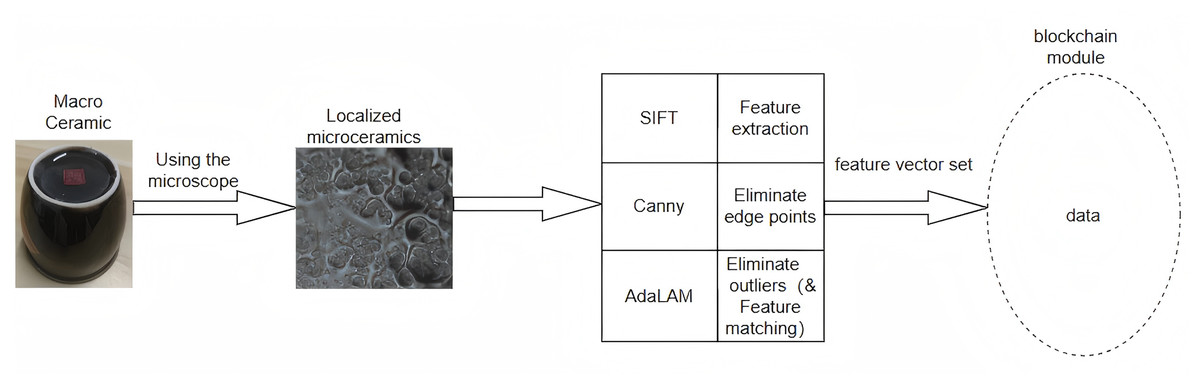
Figure 2: The basic structure for ceramic identification.
Figure 3 illustrates the traceability process. We first store the high-cost, high-volume data on IPFS, which generates a hash. This hash, along with the low-volume data, is then stored on the blockchain. This approach enables low-cost, decentralized, and tamper-proof storage. When querying information such as the firing date of the ceramic or details about past transactions, including time, location, and participants, the use of smart contract technology allows for direct and efficient retrieval of the desired information.
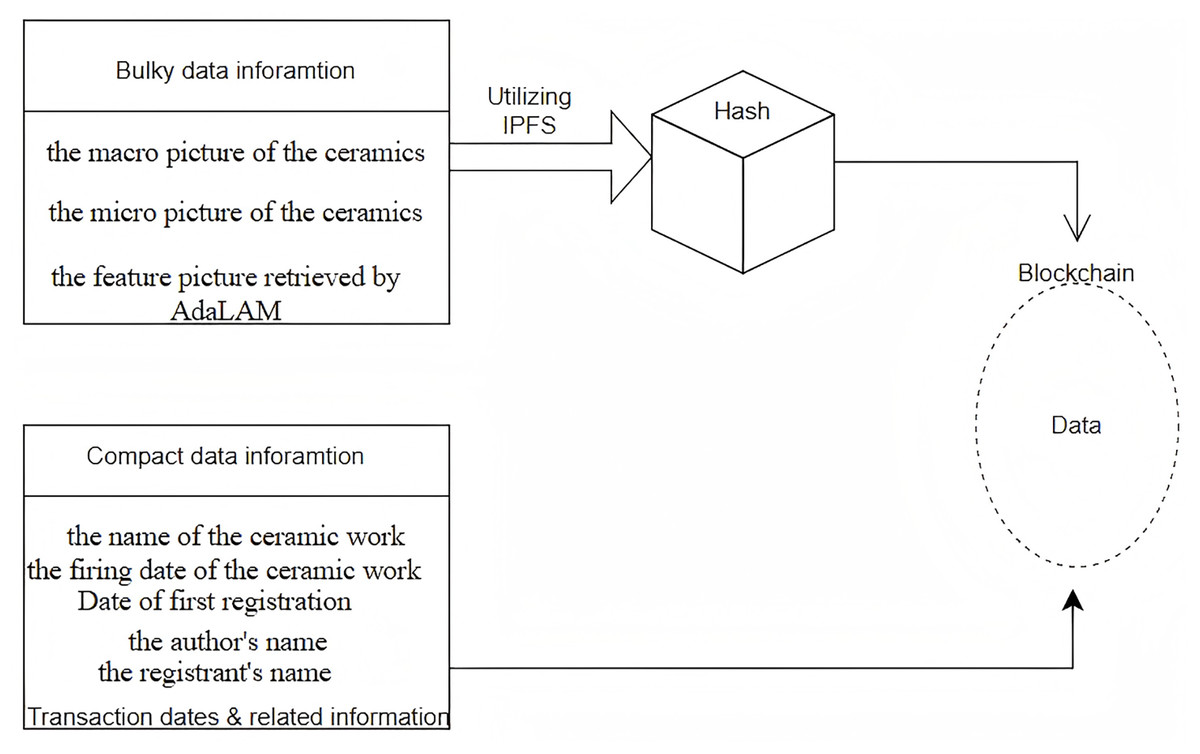
Figure 3: The basic structure for ceramic traceability.
Figure 4 illustrates the complete process of identification and traceability. The identification process leverages computer vision techniques, while the traceability process is built upon blockchain technologies. A macroscopic image is used as a control group and subsequently discarded. A microscopic image is then captured and processed using the SIFT-Canny-AdaLAM algorithm for feature extraction and matching. Ceramics whose matching results fall within the three-sigma rule are identified as authentic, while those outside the threshold are classified as counterfeits.
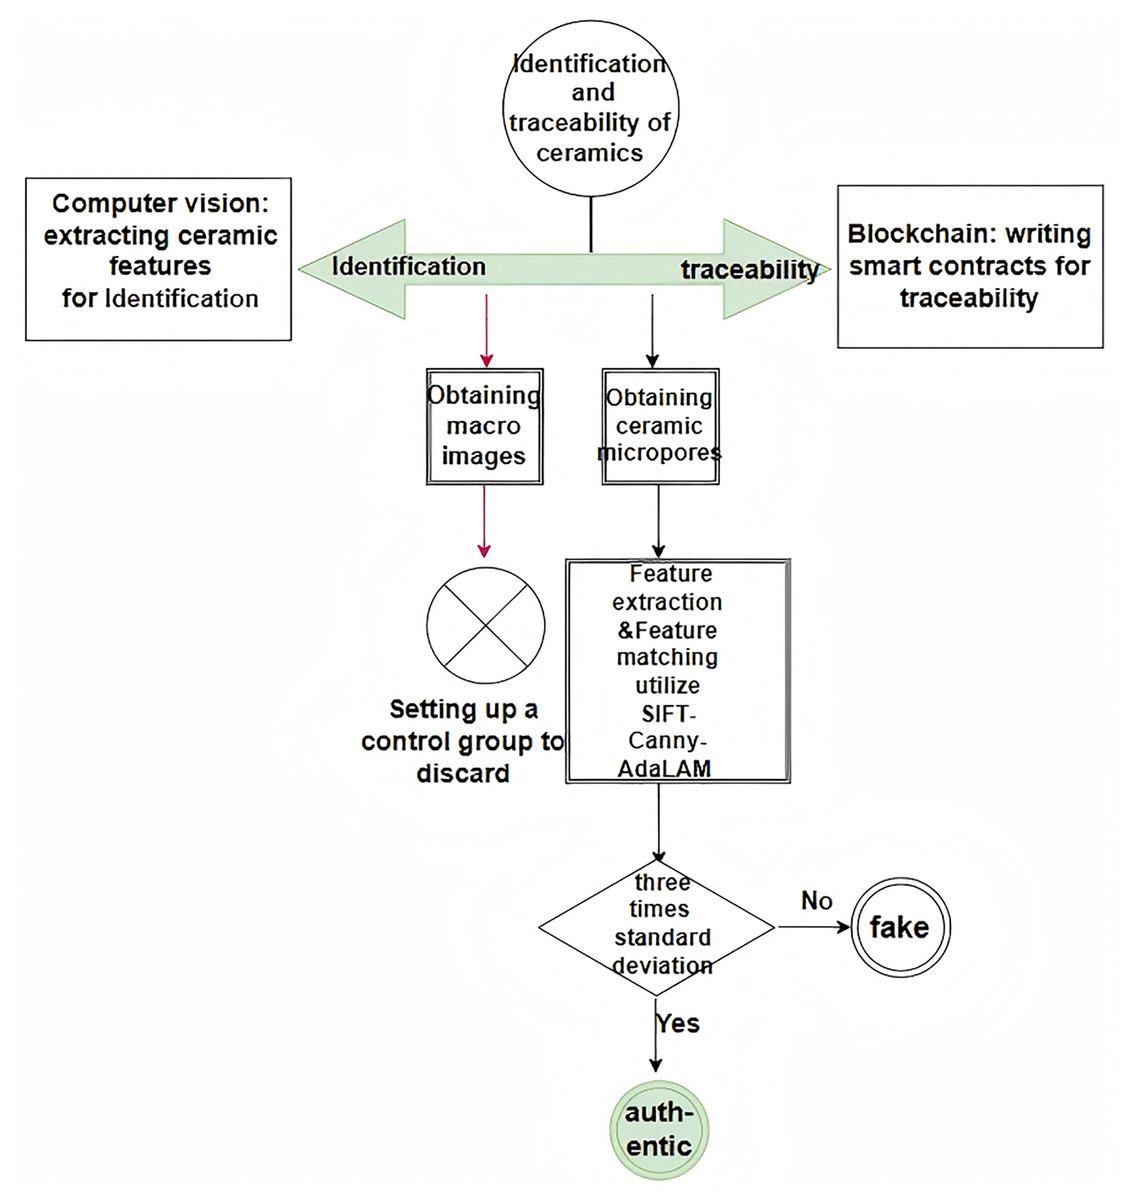
Figure 4: Overall system architecture.
Methodologies
Part A presents the implementation details of ceramic identification using the SIFT-Canny-AdaLAM method, while part B elaborates on the specific procedures for ceramic traceability.
- A.
SIFT-Canny-AdaLAM
The SIFT algorithm locates keypoints using the difference of Gaussian (DoG) operator, which provides robustness to scale, rotation, and illumination variations. However, due to the strong response of the DoG operator at edges, a large number of edge-related noise points are detected. Although post-processing steps exist to eliminate false keypoints, they are insufficient to fully mitigate this issue, ultimately affecting the accuracy of subsequent matching.
The Canny algorithm is a classical edge detection technique whose biggest benefit consists of excellent edge localization and robust noise suppression. When it is paired with the SIFT technique, it effectively eliminates (edge-related noise points that may be wrongly recognized by the SIFT technique alone) noisy points, thus enhancing the overall quality and reliability of the extracted keypoints.
Traditional matching algorithms (e.g., NNDR) (nearest neighbor distance ratio) use static thresholds that cannot adapt to varied picture attributes and tend to produce many outliers. AdaLAM solves this disadvantage by dynamically modifying the thresholds based on local geometric consistency to more precisely remove erroneous matches.
In the realm of visual feature extraction and matching, it is typically challenging for a single algorithm to cope with complicated real-world settings. This work uses SIFT, Canny, and AdaLAM algorithms to increase the performance of feature extraction and feature matching.
The proposed method is outlined as follows:
- 1.
Define the scale space and DoG operators
Define the concept of scale space, expressed as a function of:
(1)
(2) where G(x, y, σ) is the Gaussian function, I (x, y) is the original image, and * denotes the convolution operation. In order to efficiently detect critical points in the scale space, David G. Lowe proposed the DoG operator, which is obtained by differentiating the Gaussian at different scales and convolving the image.
(3)
- 2.
Spatial extreme point detection
Keypoints are made of DoG local extreme points, and the initial exploration of keypoints is obtained by comparing between 2 nearby layers of each DoG within 1 group. Any pixel point needs to be compared with all its neighboring points, and it is essential to compare the adjacent 3 × 3 eight points inside the neighborhood, as well as the higher and below layers, for a total of 8 + 9 × 2 = 26 points. Sub-pixel changes are made to the obtained points on the known discrete, and the difference is fitted to the DoG curve using the Taylor expansion of the DoG function in scale space, making the equation zero and obtaining its derivative. The corresponding extreme point equations are obtained.
(4)
(5)
(6) where X = (x, y, σ)T, is the center offset. A value of more than 0.5 in any dimension in X is considered as an offset.
- 3.
Join Canny and AdaLAM to identify final keypoints and perform fine matching
A 5 × 5 Gaussian filter is first used to remove the noise, and then the first-order derivatives (Gx and Gy) of the smoothed image in the horizontal and vertical axes are computed using the Sobel operator. The gradients and orientations of the borders are analyzed based on these two gradient maps (Gx and Gy), which are computed as:
(7)
(8)
If a pixel point is an edge, its gradient direction is always perpendicular to the edge. After establishing the direction and magnitude of the gradient, the complete image is scanned to remove spots that are not on the border. High and low thresholds should be set to locate strong edge pixel points and weak edge pixel points and connect the two to generate the final edge image.
At this point the feature points may be over-smoothed and the edges moved, and we filter the feature points again.
The initial matching information of the feature points is found by the nearest neighbor matching technique. The ratio test is used to select certain “seed points” with high confidence and good dispersion. The confidence score of each point is obtained by the ratio test, and the feature point with the greatest score within the radius r is picked as the “seed point.” Let Si = (x1Si, x2Si) be the correspondence of seed points. For the corresponding “seed points” (x1, x2) discovered on the two maps, Si reflects the correspondence of the “seed points”.
Secondly, take the seed point as the center of the circle and draw a circle with a certain threshold as the radius, search a set of neighboring points Ni, according to the seed point and its corresponding radius, and verify the direction α and proportion σ of all the matched points in Ni, in order to filter out some of the points that do not agree with the seed point.
(9)
(10) where αр = α2−α1 and σр = σ2/σ1 represent the angular and proportional differences between the two matches, respectively; R1 and R2 represent the diffusion radius of the “seed points” in image I1 and image I2, respectively; and λ is a hyperparameter that allows for adjusting the degree of overlap between neighbors; tα and tσ are thresholds for directional and proportionate consistency between candidate and seed matches.
The notion behind the following equation is that initial matches are regarded to be added to Ni if the relative positions of the seed points are similar and within the radius λR. Verify that the orientations and proportions of these matched points in Ni are consistent to determine if these points are consistent with the seed points.
We next apply random sample consensus (RANSAC) to discover the lowest number of matched pairings (x1k, x2k) to fit the affine matrix. The affine matrix Aij is created using least squares iteration j times as indicated in Eq. (11):
(11)
The residual values rk in the residual set are transferred to the confidence level ck as illustrated in Eq. (12):
(12)
P is the positive sample count, R is the radius in the following image, and the radius is ordered by the residual values in an incremental way. A threshold tc is specified, and the fit is better when CK > tc, when the match is treated as an interior point. On the contrary, it is an external point. Update rk and ck at each iteration until the maximum number of iterations is achieved and the inner point is retained.
The filtering rules for Step 3 are defined as follows:
Edge point determination:
Edge points are determined based on the gradient magnitude of the pixels. When the gradient magnitude of a pixel exceeds the high threshold, the pixel is directly defined as an edge point. Furthermore, if the gradient magnitude of a pixel is between the high and low thresholds and is connected to strong edges, the pixel will also be defined as an edge point. A histogram of the image gradients is computed, with the high threshold selected as a certain percentile (e.g., 90%, 95%, etc.) and the low threshold set as one-third or one-half of the high threshold. The high threshold is used to define strong edges. If set too high, it may miss important edges; if set too low, it will detect too much noise. The low threshold is used to connect edges. If set too high, it may miss weak edges; if set too low, it will introduce excessive noise. Through continuous experimentation, two sets of high and low thresholds (20, 200 and 30, 60) are tested in this study. When the low threshold = 20 and the high threshold = 200, only a small amount of edge noise is removed, preserving more detail. In real-world tests, the root mean square deviation (RMSD) is almost unaffected (change <0.001), and the matching accuracy remains above 99.33%. This setting is suitable for scenarios requiring high detail where a small amount of noise can be tolerated. When the low threshold = 30 and the high threshold = 60, more invalid edge points are removed, effectively reducing noise interference. Although the number of removed points increases, the RMSE change remains within an acceptable range (change <0.002), and the matching accuracy can reach 99.79%. This setting is more suitable for image matching tasks with higher noise levels or sensitivity to noise.
AdaLAM dynamic verification:
After removing unstable keypoints in the edge regions, we use AdaLAM for dynamic verification. AdaLAM achieves its function based on Eqs. (9) and (10). We set an angular difference threshold tα = 15°and a scale difference threshold tσ = 0.2 to ensure local structural consistency. Specifically, during the matching process, by comparing the local geometric structures of keypoint neighborhoods, when the angular difference between keypoints is less than 15° and the scale difference is less than 0.2, we consider the local structures of these keypoints to be consistent and retain them as valid match points. Conversely, keypoints that do not meet these criteria are considered outliers and are discarded.
To summarize, the method in this article first uses the original SIFT algorithm to detect candidate key points and then applies multi-stage processing to find the optimal edge of the image so as to eliminate the edge points (Liu, Pan & Yang, 2021), and at the same time, in order to improve the matching accuracy, based on the verification of local geometric structure, the strategy and threshold value of matching the local structural information of the image are dynamically adjusted (Yue et al., 2022; Bai, 2024; Wei et al., 2022; Xu et al., 2023; Zhang, 2022), so as to eliminate the outlier points produced by the restriction of descriptors, and then feature matching, so as to obtain high-precision matching results. The pseudo-code is provided in Algorithm 1.
| Input: Image1, Image2 |
| Output: Matches |
| 1: SIFT ← CreateSIFT() |
| 2: (KP1, DESC1) ← DetectAndCompute(Image1, SIFT) |
| 3: (KP2, DESC2) ← DetectAndCompute(Image2, SIFT) |
| 4: EDGES1 ← Canny(Image1) |
| 5: EDGES2 ← Canny(Image2) |
| 6: (KP1, DESC1) ← FilterByEdges(KP1, DESC1, EDGES1) |
| 7: (KP2, DESC2) ← FilterByEdges(KP2, DESC2, EDGES2) |
| 8: Matches ← AdaLAM(KP1, DESC1, KP2, DESC2) |
| 9: Return: Matches |
Algorithm 1 presents the feature matching pipeline based on SIFT, Canny edge filtering, and AdaLAM. For clarity, we define FilterByEdges as the operation of removing keypoints located on edge pixels, and DetectAndCompute as the combined process of keypoint detection and descriptor computation.
- B.
Smart contracts & security mechanisms for registering and querying ceramic products
To realize the ownership and traceability of ceramic artworks, this article develops a dedicated smart contract system based on the Ethereum smart contract platform, using the Solidity programming language. It mainly includes four modules: data structure design, user identity management, functional implementation (registration and query functionalities), and security protection, ensuring data trustworthiness and process control.
- 1.
Data structure design
We define the CeramicPicture structure to store the core information of ceramic products, including the author ID, author name, work ID, work name, IPFS hash value, and registration status. Meanwhile, multiple mappings are used to organize the data, including mappings that record the registration status of authors and administrators, mappings that associate works with authors, and mappings that record the list of works by an author. This design helps efficiently manage and query ceramic product information.
- 2.
Access control mechanism
To ensure that only authorized personnel can perform specific operations, we introduced custom access control modifiers.
OnlyAuthor: This modifier checks if the caller is a registered author. If the verification fails, an error message is thrown, and further operations are prevented.
OnlyManager: This modifier checks if the caller is a registered administrator. If the verification fails, an error is thrown, and the operation is terminated.
- 3.
Function implementation
Registration Function: The administrator can use the registerAuthor function to register a new author; the author uses the registerCeramic function to register ceramic works. During registration, it checks if the work is already registered. If not, the work’s information is stored, and the association between the work and the author is established.
Query Function: Users can use the getCeramicInfo function to query ceramic work information. During the query, it checks if the work is already registered. If it is registered, the detailed information of the work will be returned.
- 4.
Security mechanism
Reentrancy attack protection: The ReentrancyGuard contract from the OpenZeppelin library is used, and the nonReentrant modifier is added to the tradeCeramic function to prevent reentrancy attacks.
Overflow and underflow protection: As Solidity version 0.8.0 and above have overflow and underflow protection enabled by default, there is no need to manually add additional checks during numerical calculations.
Event logging: Corresponding events are designed for key operations such as author registration, artwork registration, and transaction completion, ensuring that on-chain actions are traceable.
Data integrity verification: During artwork registration, the input metadata (workID, workName, ipfsHash) can be subjected to hash verification and a unique identifier is stored, used for subsequent checks to ensure the data has not been tampered with.
- 5.
Smart contract pseudocode
The pseudocode, as shown in Algorithm 2, provides a summary of the main registration and query functions of the smart contract.
| Input: Author ID, Buyer address, Metadata of ceramic picture |
| Ouput: Stored metadata and successful transaction record |
| 1. Define a data structure CeramicPicture with attribute metadata. |
| 2. Initialize contract Manager. |
| 3. Function setInformation(authorID): |
| Store ceramic picture metadata associate with authorID. |
| 4. Function getInformation(authorID): |
| Return metadata of the ceramic picture by authorID. |
| 5. Initialize contract Trade. |
| 6. Function Trade(buyerAddress, sellerID): |
| Add msg.value to seller’s balance. |
| Transfer the updated balance to the seller’s wallet address. |
| 7. End. |
Experiments
Dataset preparation
We employed the “ChaoyanB011” digital electron microscope (2,048 × 1,536 resolution, manufactured in Shenzhen, China) to acquire high-resolution micrographs of ceramics with diverse shapes and sizes. The microscope allows flexible magnification adjustment to capture fine-grained surface features. To assess the performance of our matching algorithm, we constructed a dataset named micro-ceramic, consisting of 10,000 micrographs collected from 20 distinct ceramic artifacts. For each artifact, 500 localized images were acquired and organized into individual folders. These ceramics were selected to cover a range of visual similarities—from highly dissimilar to nearly identical in appearance. The dataset supports both genuine verification tests by selecting image pairs from the same artifact and impostor verification tests by selecting pairs from different artifacts, regardless of their macro-level resemblance.
Experimental setting
In order to test the performance of the algorithm and the viability of this study, a series of experiments were undertaken in the environment presented in Table 3.
| Software/Hardware | Parameter configuration/Version |
|---|---|
| Processor | Intel core i7-7700 |
| Operating system | window |
| Random access memory (RAM) | 16 G |
| GPU | GTX1050 |
| Programming tools | Python, Solidity, OpenCV |
| IPFS | Desktop0.32.0 |
| Programming platform | Remix, Ethereum public chain |
Computational cost analysis
To comprehensively evaluate the computational overhead of our method, we conducted comparative experiments under a consistent hardware environment.
First, in terms of runtime, we measured the average processing time per image pair for each algorithm across 10 true verification tests on the micro-ceramic dataset. The results show that the traditional SIFT algorithm takes approximately 0.65 s on average, while ORB requires about 0.35 s. In contrast, the AdaLAM algorithm and our proposed SIFT-Canny-AdaLAM method take 3.36 and 3.32 s on average, respectively. The increased runtime of AdaLAM and SIFT-Canny-AdaLAM is primarily due to the larger number of extracted feature points and the incorporation of dynamic local consistency verification. Nevertheless, the total processing time per image pair remains under 4 s, which meets the real-time requirements for ceramic identification in practical applications.
Second, regarding memory consumption, all algorithms were successfully executed under a 16 GB RAM environment without any noticeable memory overflow. The SIFT-Canny-AdaLAM method leverages Canny edge detection to filter out unstable edge keypoints, resulting in an effective number of retained feature points that is comparable to that of the traditional SIFT algorithm. In some cases, the number of feature points is slightly reduced by approximately 3% to 5%. As a result, the overall memory usage remains nearly unchanged, imposing minimal pressure on system resources.
Finally, in terms of algorithmic complexity, the feature extraction stage of the traditional SIFT algorithm has a time complexity of approximately O(N log N), while Canny edge detection operates at O(N). AdaLAM introduces a dynamic thresholding mechanism based on local geometric consistency during the matching stage, which increases computational overhead compared to the conventional NNDR method. However, both AdaLAM and the proposed SIFT-Canny-AdaLAM approach demonstrate superior performance in filtering out outliers and achieving perfect matching precision (precision = 1.0). This reduces downstream processing costs caused by false matches, resulting in better overall efficiency.
In summary, the proposed SIFT-Canny-AdaLAM method demonstrates favorable controllability in terms of runtime, memory consumption, and computational complexity. Its high practicality and strong potential for engineering applications make it well-suited for deployment in real-world ceramic identification and traceability systems.
Sample selection and evaluation scope
For the true verification experiments, 10 pairs of local micrographs were randomly selected from different regions of the same ceramic artifact. These pairs were chosen to cover both highly similar and less similar local patterns to reflect realistic within-object variability. For the false verification experiments, 100 sets of images were randomly selected from different artifacts, with a focus on challenging cases such as artifacts with similar macro-level appearances or those made from the same raw materials. These subsets were chosen to ensure computational feasibility while still being representative of the dataset’s variability and challenges.
Given that the dataset consists of 10,000 micrographs from 20 distinct ceramic artifacts, an exhaustive pairwise evaluation would involve C(10,000, 2) = 49,995,000 image pairs. The average runtime for each pair, measured at approximately 3.32 s for the SIFT-Canny-AdaLAM pipeline, means that testing all possible pairs would require about 1.66 × 10⁸ s (≈5.26 years) of continuous computation on our current hardware, which is infeasible. Thus, we adopted a representative random sampling strategy to balance coverage, challenge, and computational feasibility.
Furthermore, to strengthen the reliability of our findings, we report 95% confidence intervals (CI95) for precision and RMSE, as well as perform robustness tests on image rotation (45°–270°) and illumination variation (–15° to 15°). These multi-angle validations provide additional statistical confidence in the accuracy and stability of the proposed method.
Results
Experiments in the identification section
Algorithm performance comparison result analysis
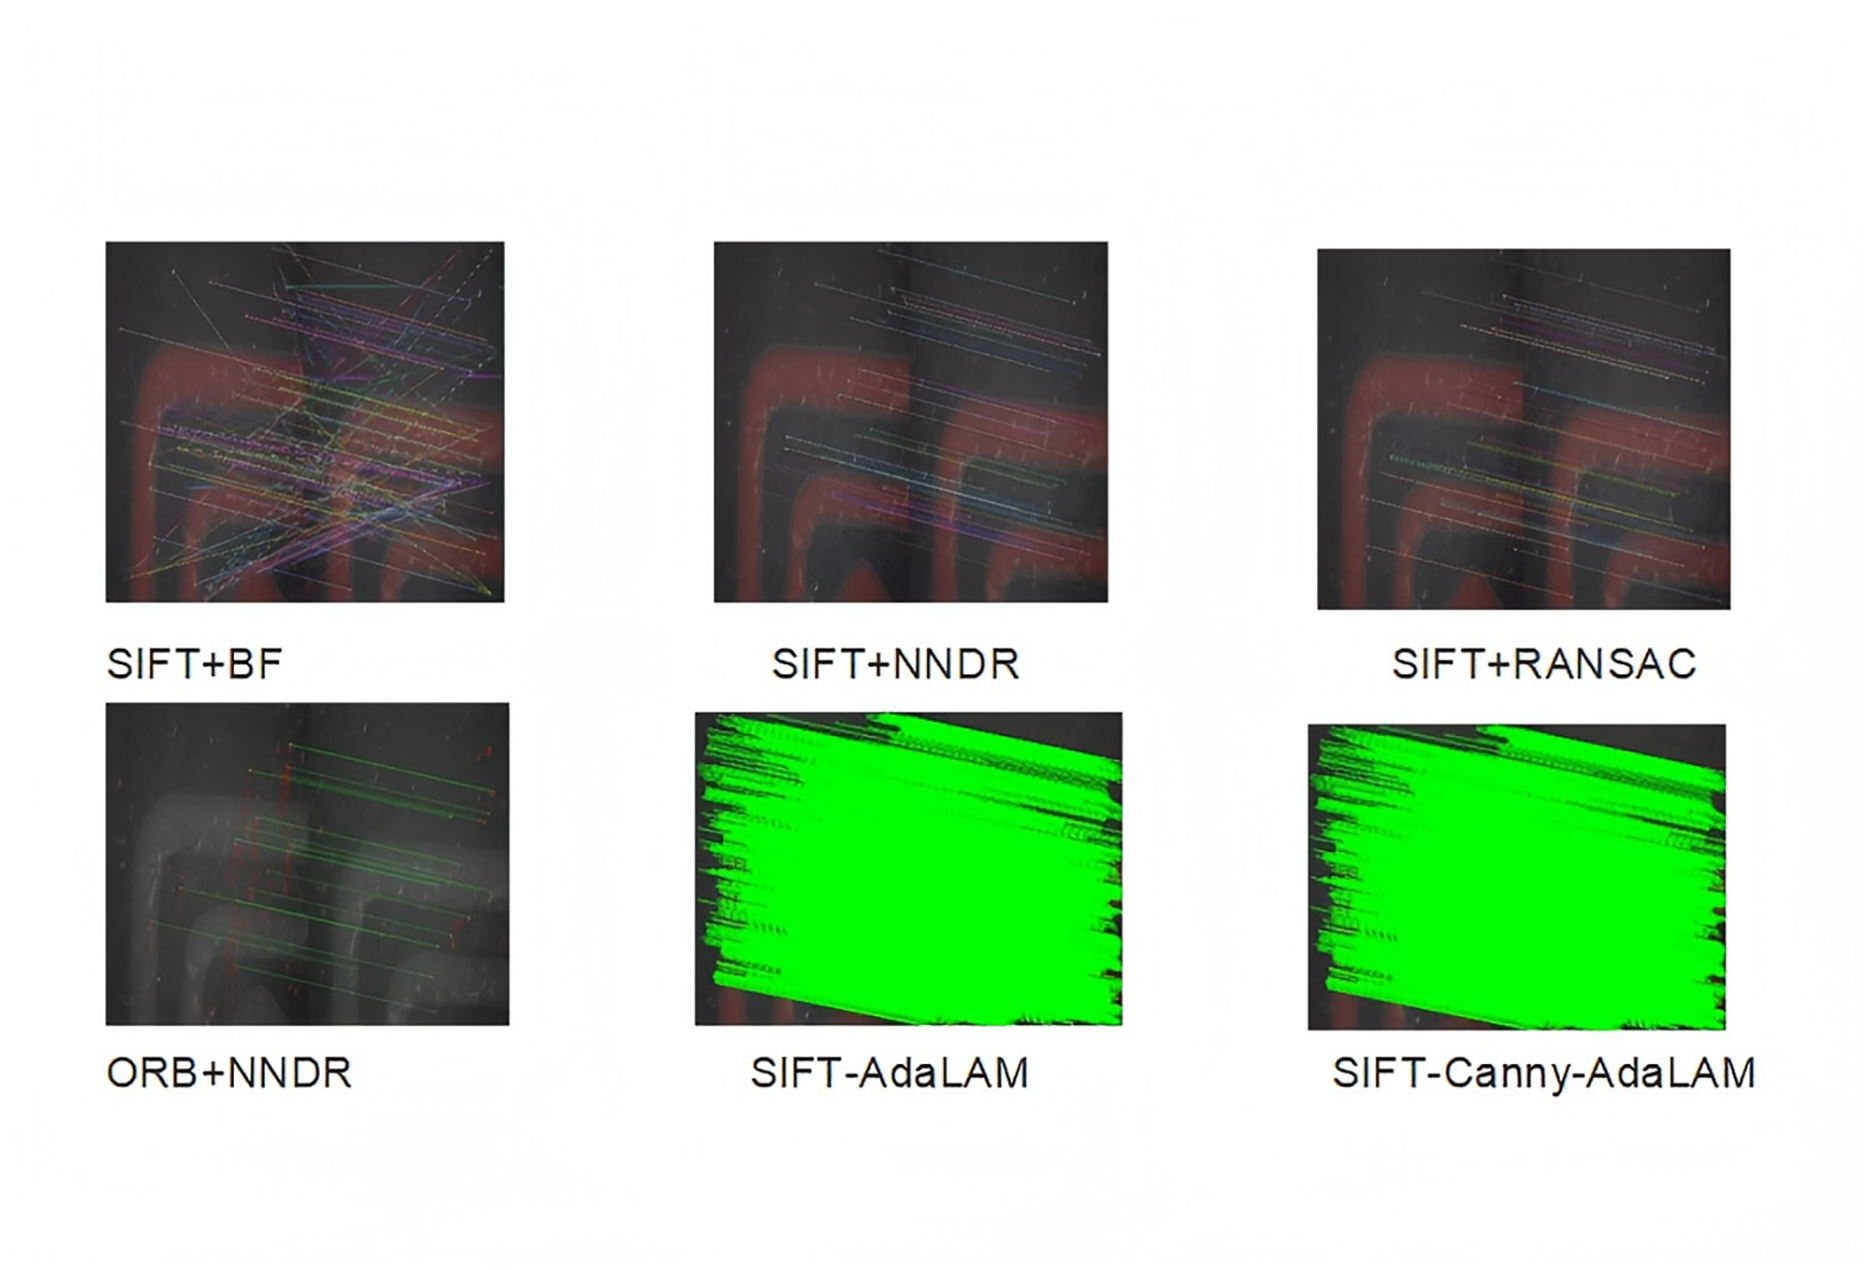
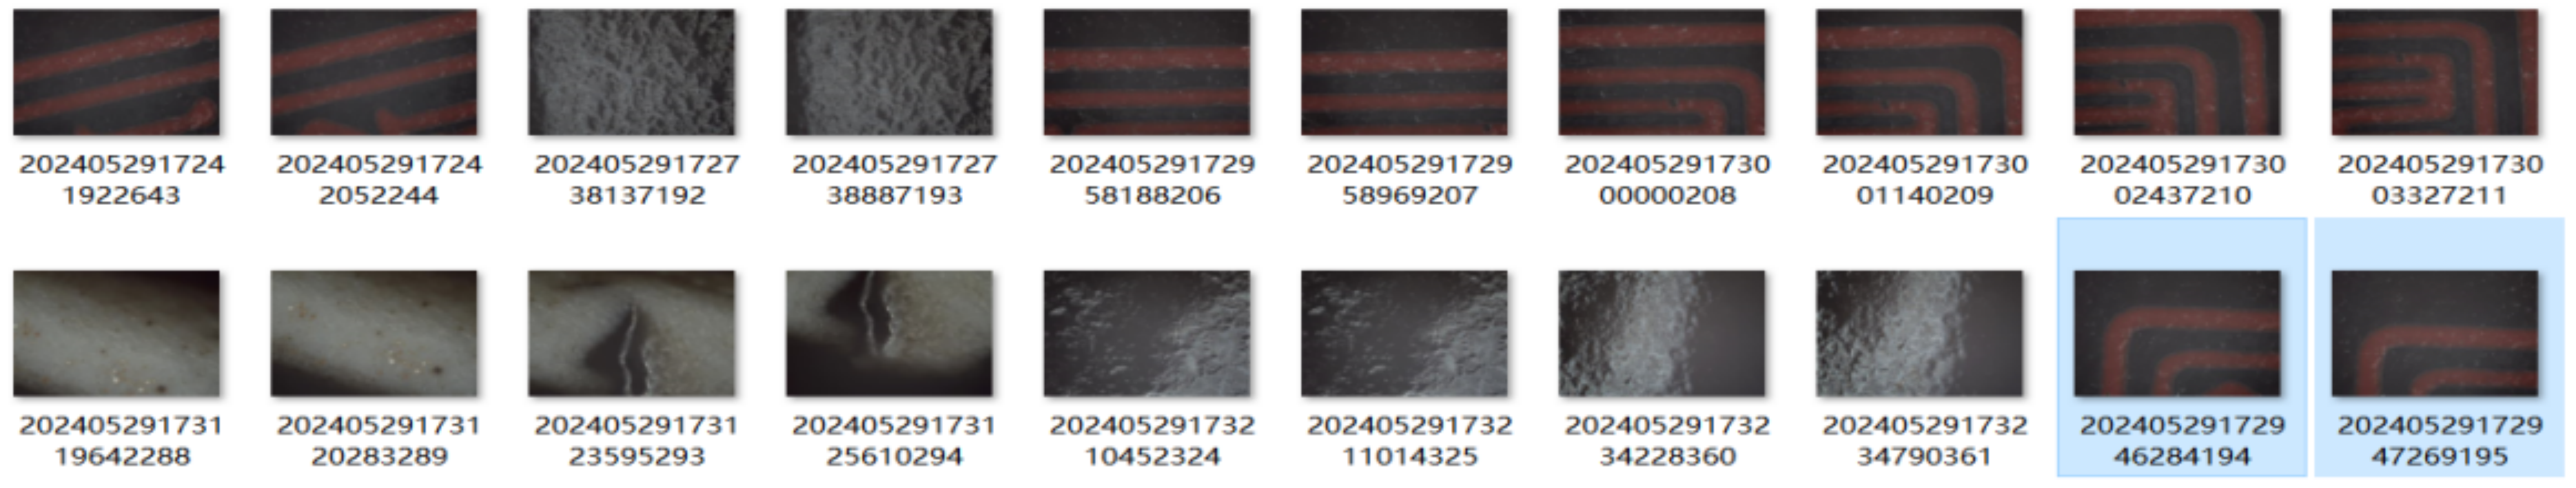
To evaluate the performance of the proposed algorithm, we selected 10 pairs of local micrographs from the same folder in the micro-ceramic dataset and conducted true verification tests using six different algorithms. Figure S1 presents the sample images used for testing. The matching results of one representative image pair are shown in Fig. 5, and the detailed results of RMSE, precision, and the number of matched pairs for each algorithm are summarized in Table 4. As illustrated in Fig. 5, the SIFT algorithm produces and matches significantly more keypoints than the ORB algorithm. Moreover, the SIFT-AdaLAM and SIFT-Canny-AdaLAM methods exhibit substantially better matching performance compared to the other approaches.
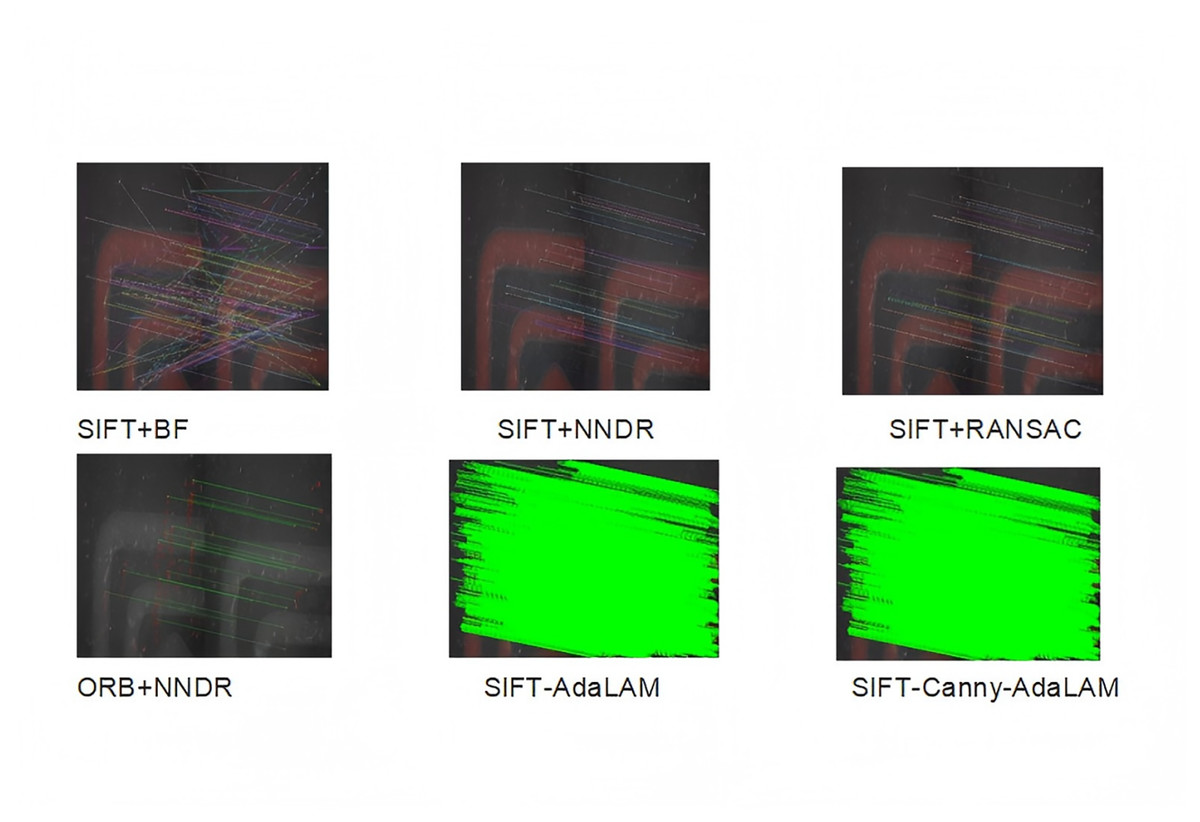
Figure 5: Comparison of matching results of different algorithms on the final pair of test images in the true verification experiments.
| Methods | Total matching points | Correct matching points | Precision | RMSE (pixels) | Number of key points filtered out of the first image | Number of key points filtered out of the second image | Low thres-hold and high thres-hold |
|---|---|---|---|---|---|---|---|
| SIFT+BF | 166 | 69 | 0.4157 | 49.9236 | |||
| SIFT+NNDR | 220 | 123 | 0.5591 | 37.6697 | |||
| SIFT+RANSAC | 272 | 175 | 0.6434 | 30.4682 | |||
| ORB+NNDR | 21 | 21 | 1.0 | 0.5625 | |||
| SIFT-AdaLAM | 2,202 | 2,202 | 1.0 | 0.0226 | |||
| SIFT-Canny-AdaLAM | 2,202 | 2,202 | 1.0 | 0.0226 | 4 | 0 | 20 and 200 |
| SIFT-Canny-AdaLAM | 2,170 | 2,170 | 1.0 | 0.0228 | 69 | 52 | 30 and 60 |
As shown in Table 4, varying the high and low thresholds of the Canny algorithm can yield different results. When the low threshold is set to 20 and the high threshold to 200, the performance of the SIFT-Canny-AdaLAM method—measured in terms of total matches, correct matches, precision, and RMSE—remains unchanged compared to the SIFT-AdaLAM method. However, the first image had four edge keypoints filtered out, while the second image had none filtered.
When the low threshold is increased to 30 and the high threshold is reduced to 60, the Canny algorithm filters out 69 edge keypoints from the first image and 52 from the second. Under these settings, the SIFT-Canny-AdaLAM method achieves an RMSE of 0.0228, with a total of 2,170 matching points—all of which are correct—resulting in a precision of 1.0.
These results show that the SIFT-Canny-AdaLAM method successfully removes the impact of unstable edge keypoints with the Canny algorithm, while keeping a precision of 1.0 and a nearly unchanged RMSE.
To enable a more comprehensive evaluation of each algorithm’s performance, we conduct experiments from two perspectives: true verification (matching images from the same ceramic) and false verification (matching images from different ceramics).
True verification (matching images from the same ceramic)
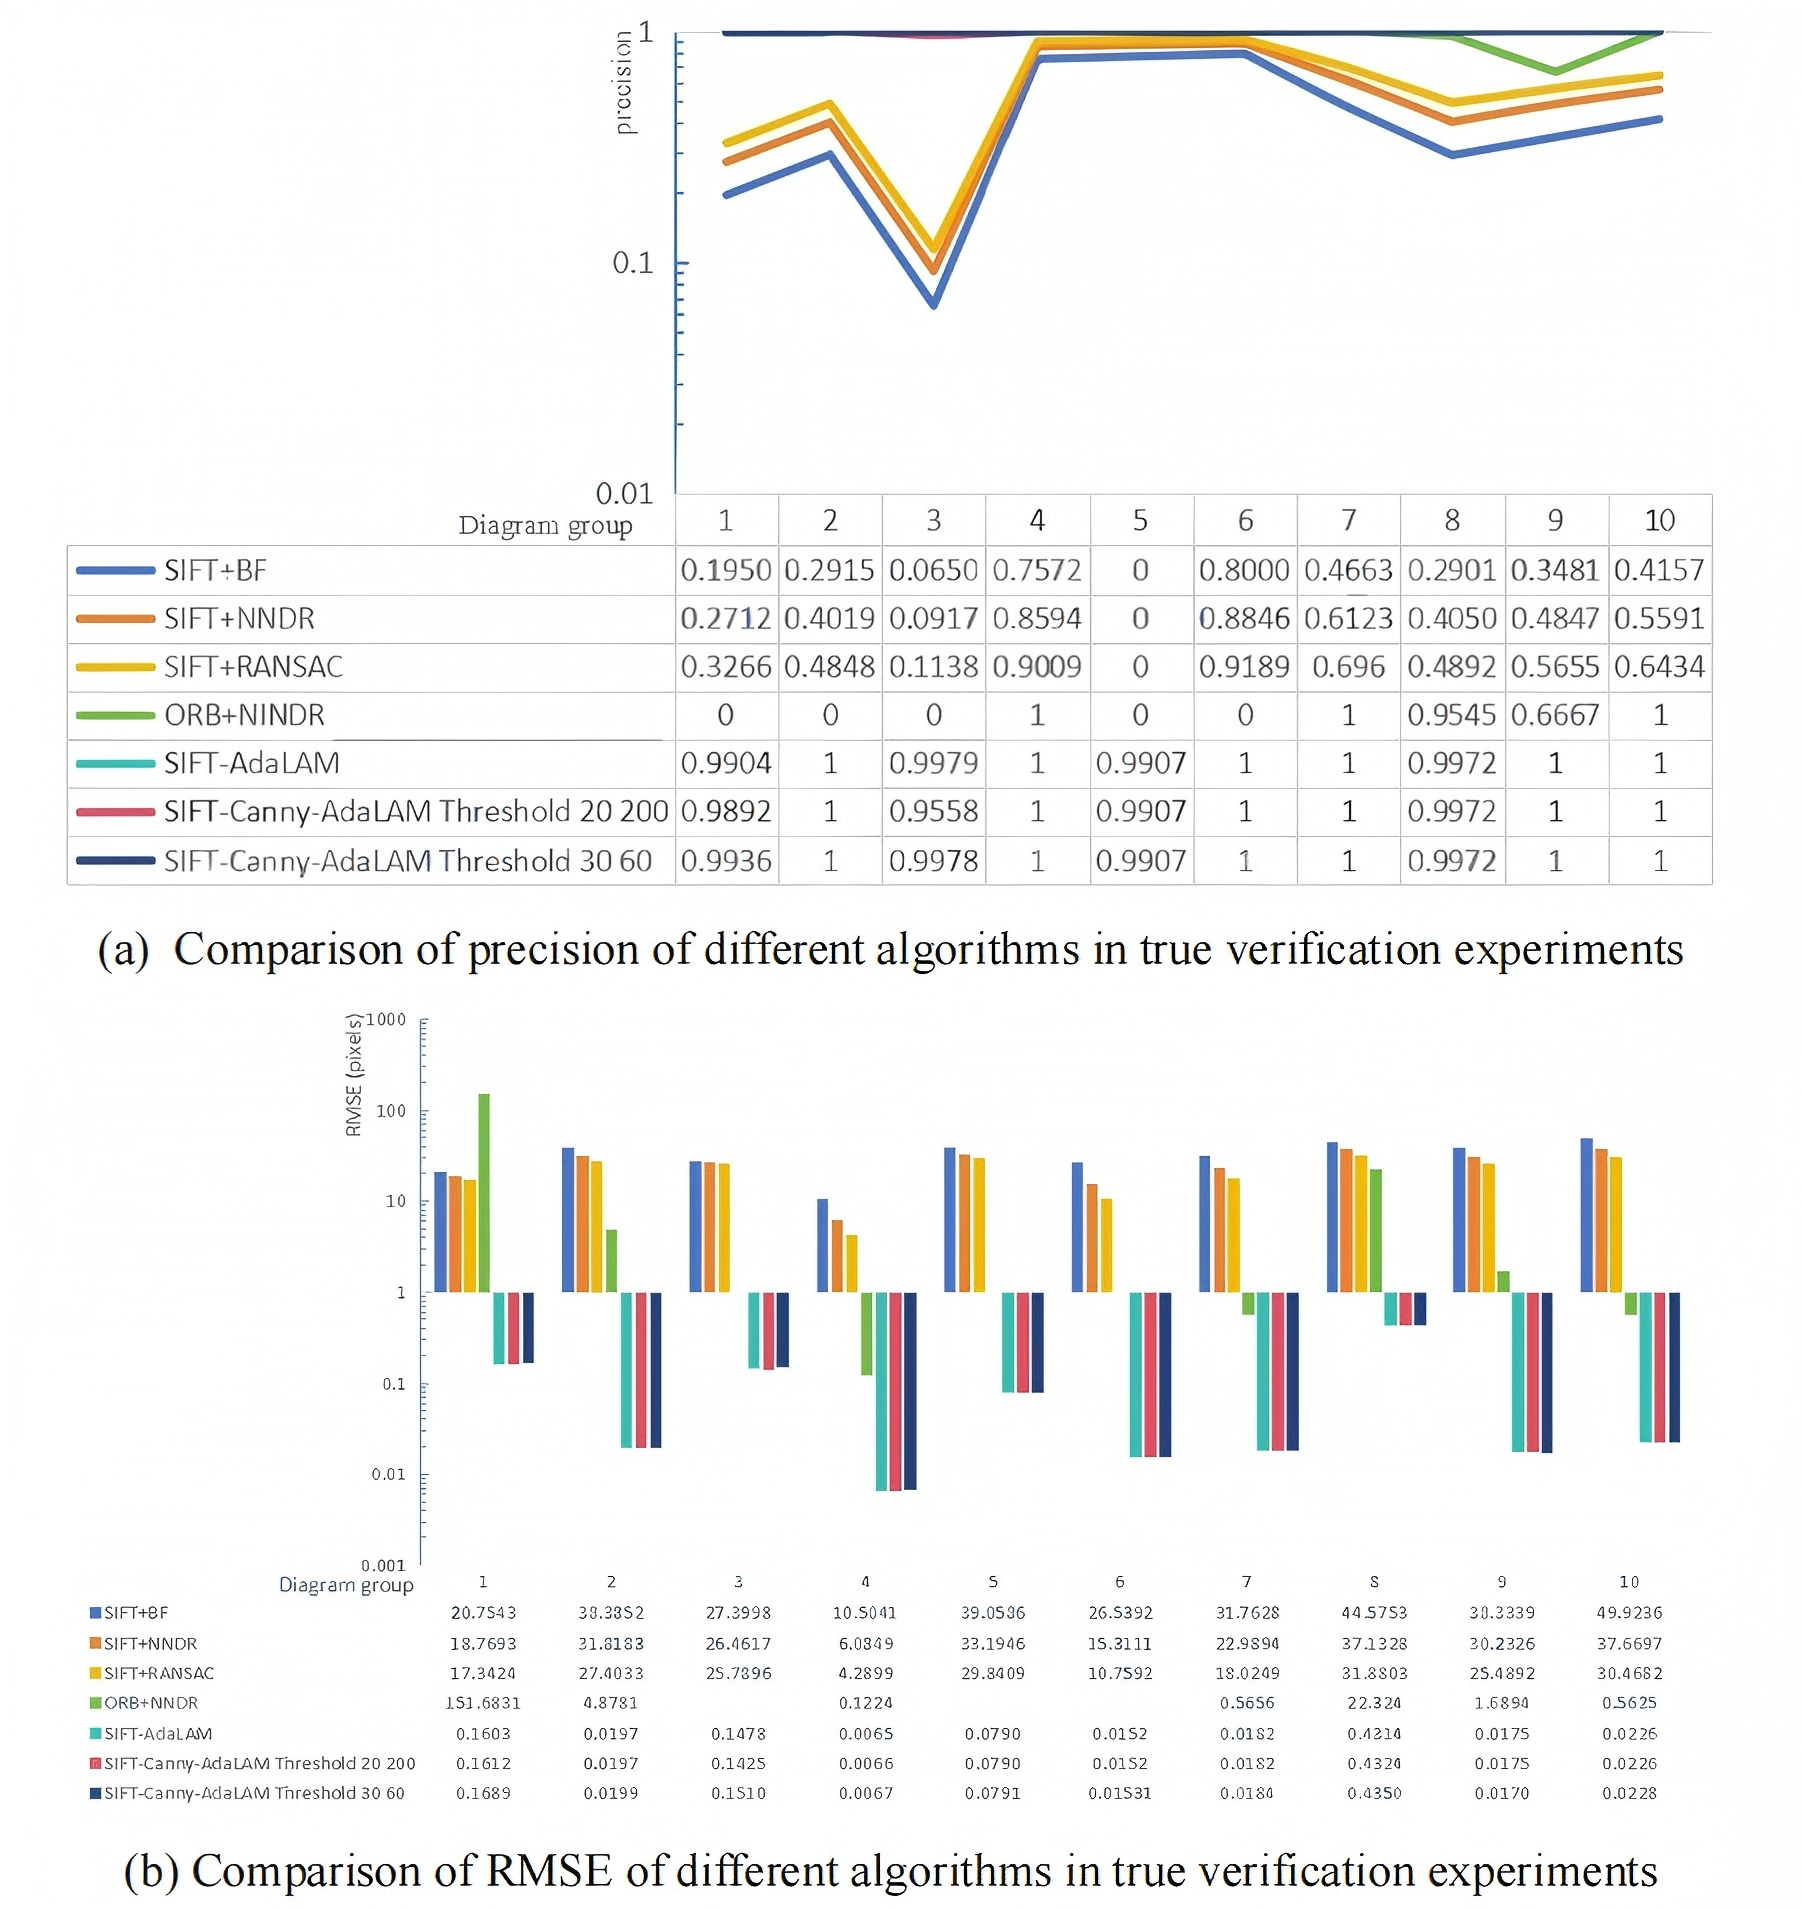
Figure S2(A) and S2(B) respectively illustrate the precision and RMSE (in pixels) of each algorithm under true verification conditions.
As shown in Fig. S2(A), during the true verification experiments, the RMSE values for SIFT-AdaLAM and the proposed SIFT-Canny-AdaLAM (under both threshold settings) remain below 1, while other algorithms exceed this threshold. Moreover, under low-texture conditions, the ORB+NNDR method often fails due to an insufficient number of detected keypoints. In contrast, the proposed method consistently achieves a precision above 95.58%, significantly outperforming the other approaches.
After the true verification experiments, we performed statistical analysis on the precision and RMSE of the two sets of thresholds (20/200, 30/60) for SIFT-Canny-AdaLAM and the traditional SIFT+BF method, and calculated the 95% confidence intervals (CI95), as shown in Table 5.
| Method | Precision mean (CI95) | RMSE (pixels) Mean (CI95) |
|---|---|---|
| SIFT-Canny-AdaLAM (20/200) | 0.9933 [0.9834–1.0000] | 0.0915 [−0.0032 to 0.1862] |
| SIFT-Canny-AdaLAM (30/60) | 0.9979 [0.9956–1.0000] | 0.0934 [−0.0024 to 0.1892] |
| SIFT+BF | 0.3629 [0.1752–0.5505] | 32.7237 [24.3119–41.1355] |
RMSE interpretation: for both threshold settings, the RMSE of our method is approximately 0.09 pixels, significantly lower than SIFT+BF (≈32.7), representing a reduction of around 350 times in error. Considering the microscope image resolution of 2,048 * 1,536, the current RMSE is already close to the precision limit. The impact of fine-tuning the threshold on RMSE is minimal (change <0.002), indicating that further reduction in error is unnecessary.
Precision interpretation: the precision of SIFT-Canny-AdaLAM is close to 100%, which represents an improvement of approximately 63 percentage points compared to SIFT+BF (≈36%). While high precision indicates a low false match rate, in scenarios with high noise, the second set of thresholds (30/60) filters more noise but also reduces the number of matching pairs. Therefore, a balance must be struck between stability and recall rate.
Comprehensive evaluation: based on the analysis of confidence intervals, it is evident that the proposed method maintains exceptionally high precision while achieving an extremely low RMSE, with statistical significance (the lower bound of Precision CI95 is well above 0.5). Depending on the application requirements, the method allows for flexible switching between “retaining details” (20/200) and “strong noise suppression” (30/60), meeting both the practical and robustness requirements of ceramic identification.
False verification (matching images from different ceramics)
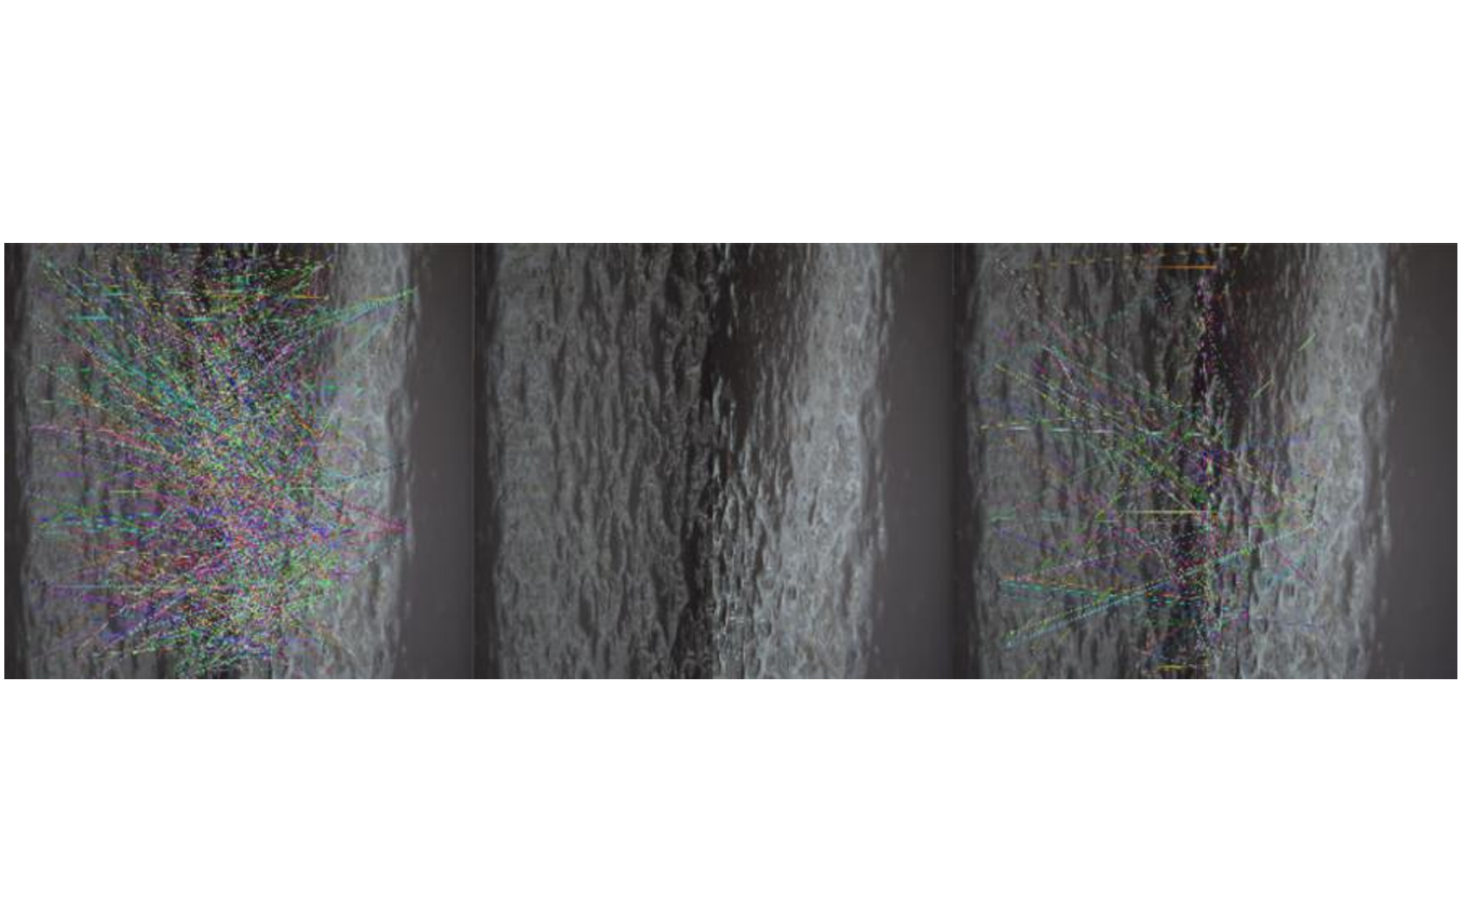
In the false verification test, we randomly selected 100 sets of microscopic images from different ceramics for matching tests. Some of these ceramics have similar macro features and the same raw materials. The results showed that only one set of images was successfully matched using SIFT+BF, SIFT+NNDR, and SIFT+RANSAC, while the other algorithms failed to match. The matching result images are shown in Fig. S3, and the detailed data can be found in Table 6. Although the match was successful, the number of matching pairs was only 1.
| Methods | RMSE (pixels) | Total matching points | Correct matching points | precision |
|---|---|---|---|---|
| SIFT+BF | 32.3214 | 1,000 | 1 | 0.0010 |
| SIFT+NNDR | 32.3214 | 1,000 | 1 | 0.0010 |
| SIFT+RANSAC | 30.1494 | 1,191 | 1 | 0.0008 |
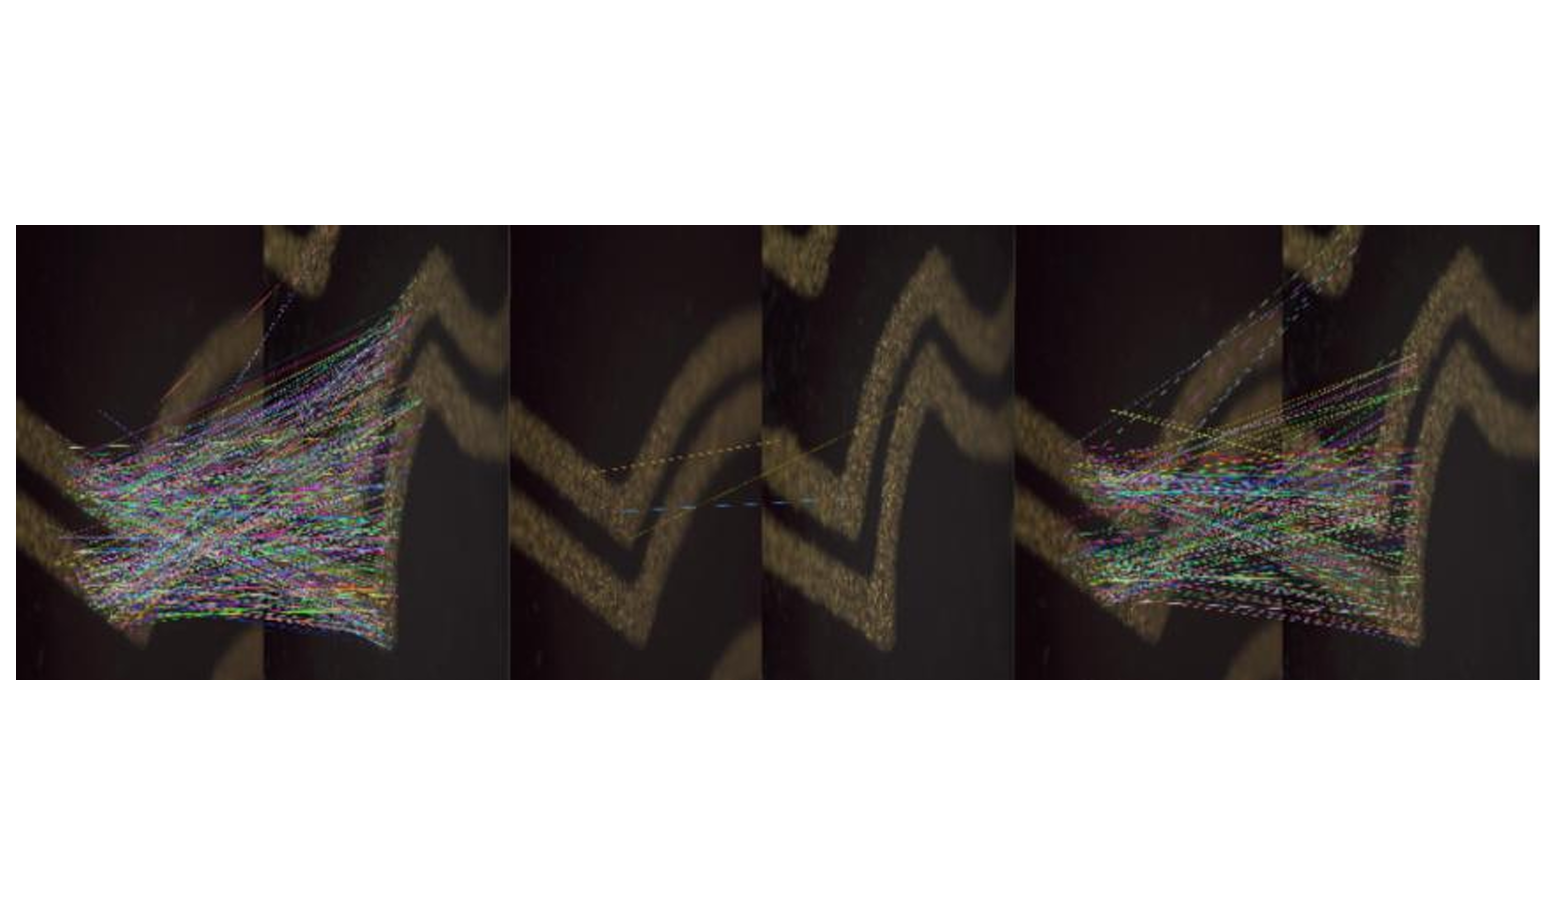
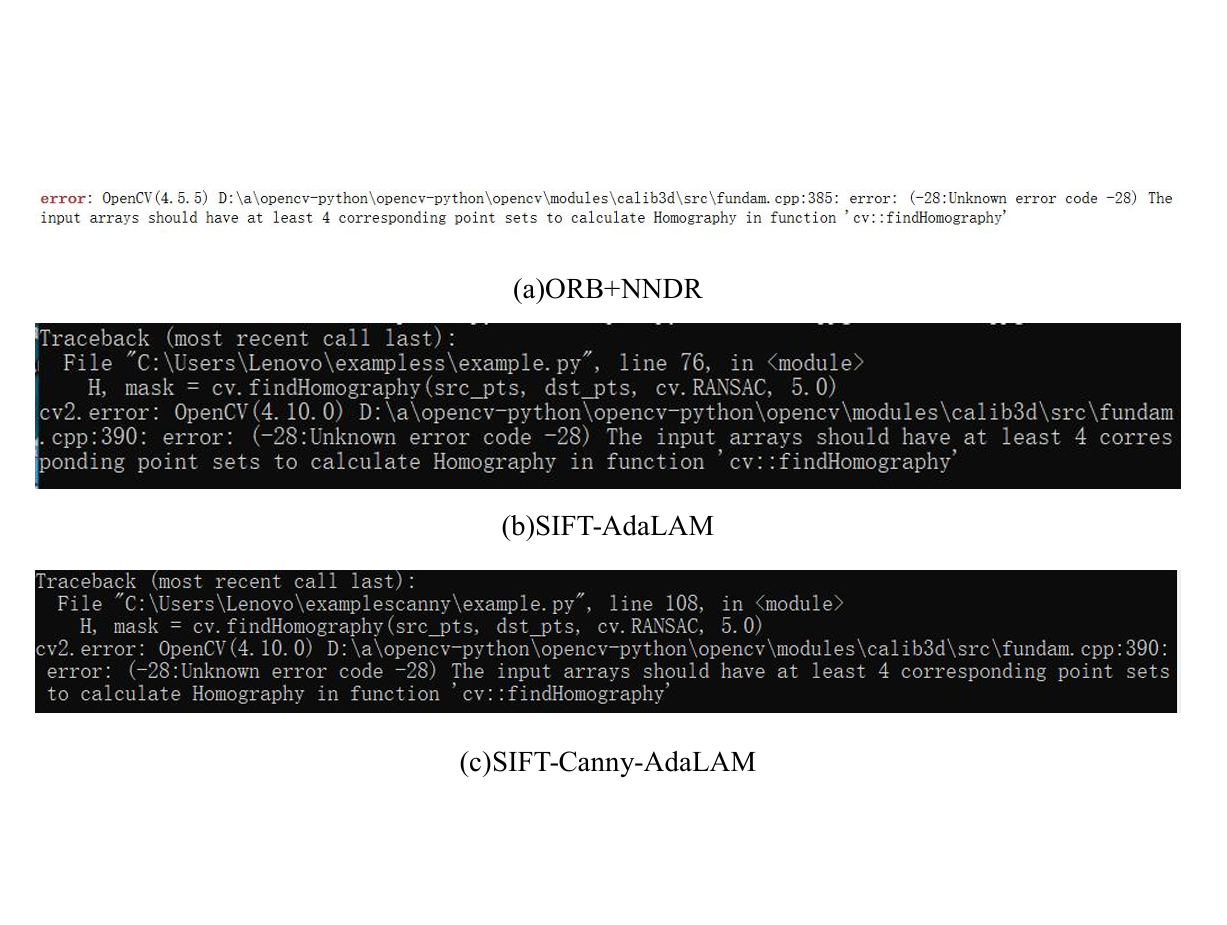
The alternative scenario is that SIFT+BF, SIFT+NNDR, and SIFT+RANSAC can perform matching, but all the matches are incorrect, and they are detected during algorithm execution. Figure S4 shows an example of a scenario where matching is possible, but the algorithm detects that all the matches are incorrect, as shown in Table 7. Similarly, for the ORB+NNDR, SIFT-AdaLAM, and SIFT-Canny-AdaLAM algorithms, during execution, the algorithm terminates when it detects fewer than four corresponding point sets in the input array, preventing the calculation of the homography matrix, as shown in Fig. S5.
| Methods | RMSE (pixels) | Total matching points | Correct matching points | Precision |
|---|---|---|---|---|
| SIFT+BF | 18.2633 | 422 | 0 | 0 |
| SIFT+NNDR | 18.1865 | 425 | 0 | 0 |
| SIFT+RANSAC | 14.6798 | 616 | 0 | 0 |
Through the above analysis, we can conclude that computer vision methods can effectively perform ceramic identification tasks.
Algorithm stability analysis
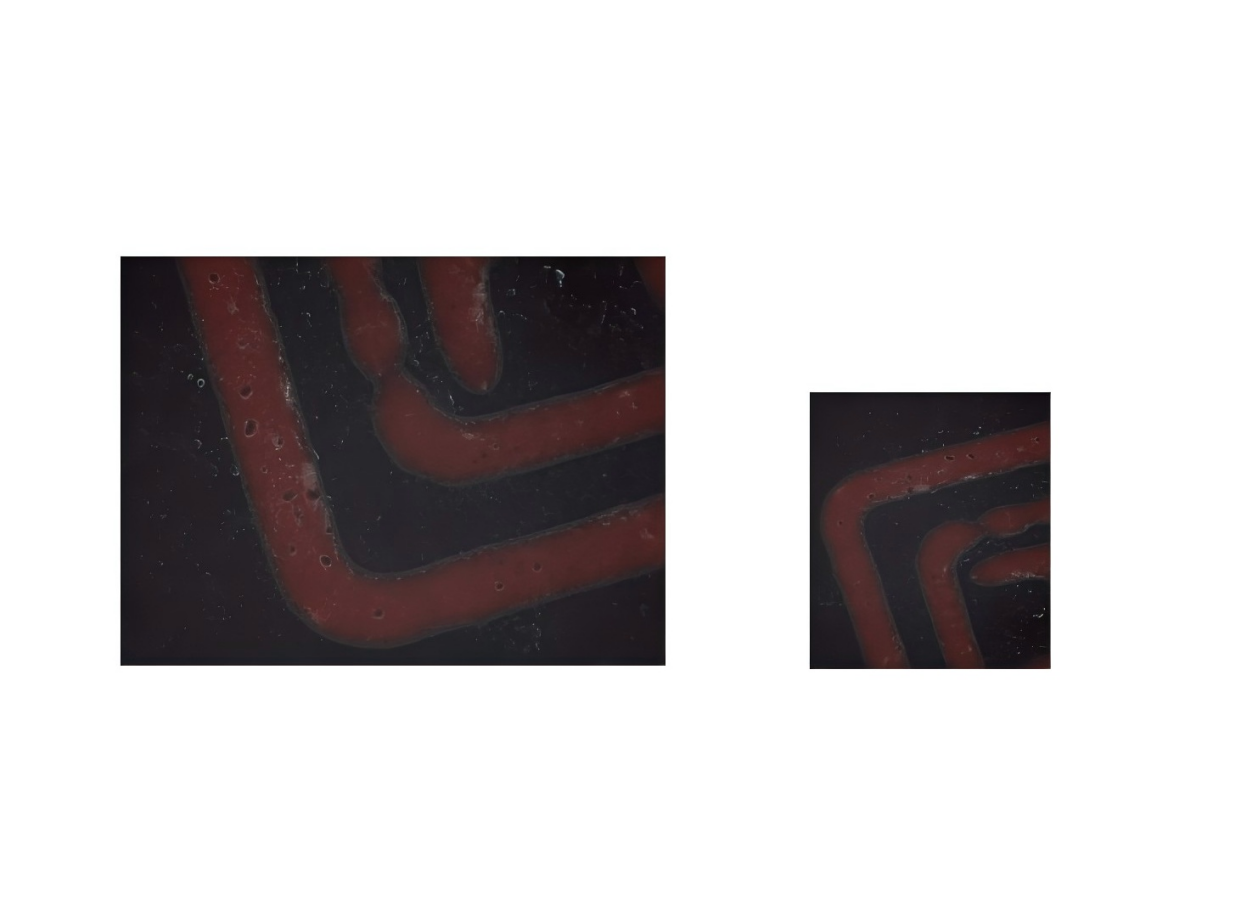
To validate the matching rate of the proposed method under image rotation and scale transformation, a test image from the ceramic micrographs was selected, and the image was scaled down by a factor of four and rotated 90° clockwise, as shown in Fig. S6.
Table 8 presents a comparative analysis of various algorithms under image rotation and scale variation. The results show that SIFT-AdaLAM and SIFT-Canny-AdaLAM extract a larger number of feature points and exhibit strong stability under these conditions. Both achieve a precision of 1, with RMSE values below 0.0087. Notably, when the Canny edge detector is set with a low threshold of 30 and a high threshold of 60, it effectively filters out a significant number of edge points.
| Methods | Total matching points | Correct matching points | Precision | RMSE (pixels) | Number of key points filtered out of the first image | Number of key points filtered out of the second image | Low thres-hold and high thres-hold |
|---|---|---|---|---|---|---|---|
| SIFT+BF | 217 | 93 | 0.4286 | 35.5614 | |||
| SIFT+NNDR | 287 | 163 | 0.5679 | 26.8879 | |||
| SIFT+RANSAC | 354 | 230 | 0.6497 | 21.7989 | |||
| ORB+NNDR | 14 | 14 | 1 | 0.7128 | |||
| SIFT-AdaLAM | 3,894 | 3,894 | 1 | 0.0087 | |||
| SIFT-Canny-AdaLAM | 3,886 | 3,886 | 1 | 0.0087 | 9 | 0 | 20 and 200 |
| SIFT-Canny-AdaLAM | 3,865 | 3,865 | 1 | 0.0087 | 64 | 27 | 30 and 60 |
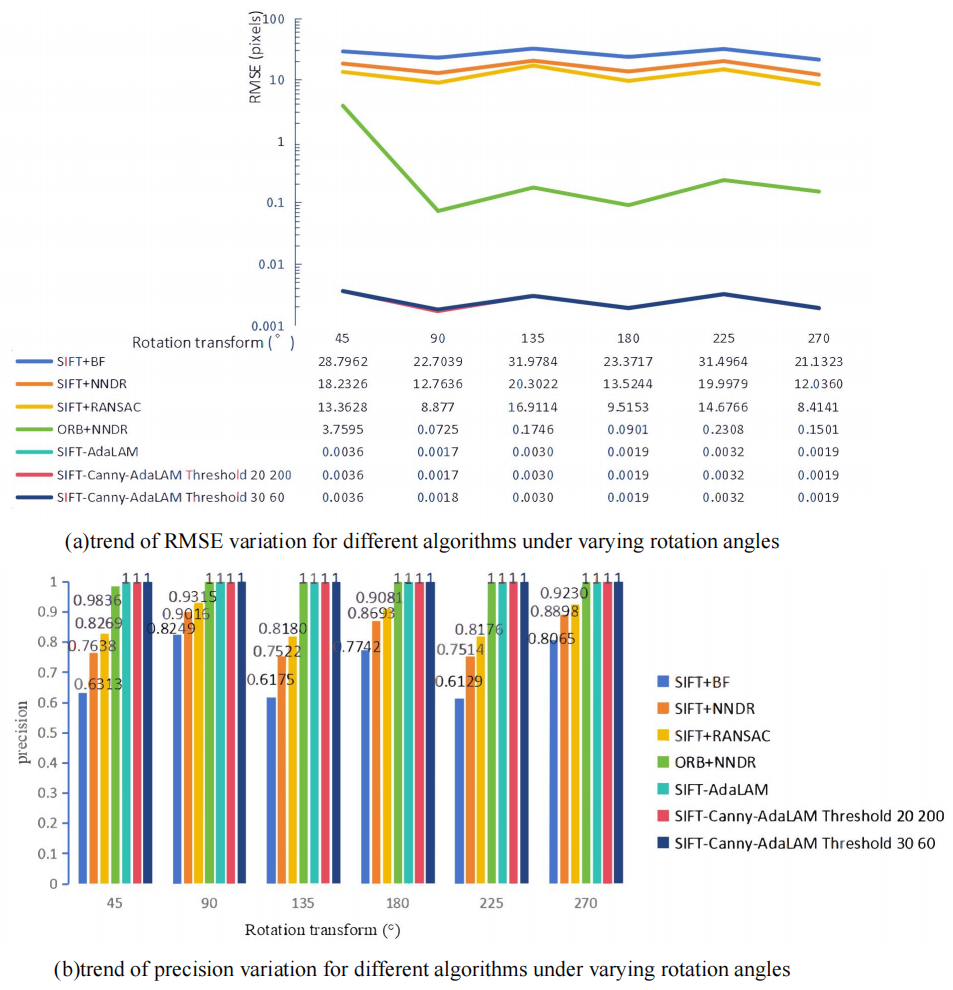
To further evaluate the rotational robustness of the proposed method, we recorded the matching performance of various algorithms under different rotation angles. As shown in Fig. S7, despite increasing rotation angles, our method maintains strong robustness, with RMSE values consistently below 0.036 and a precision of 1. For ORB+NNDR, the precision drops to 0.9836 at a 45-degree rotation, while it remains 1 at other angles; however, the number of matched feature points is relatively low, and the RMSE is significantly higher.
We validated the robustness of our method under image rotation by adjusting the rotation angle from 45° to 270° and applying statistical analysis to the results. When the Canny thresholds were set to 20 and 200, the average RMSE was 0.0026 pixels with a 95% confidence interval (CI95) of [0.0017–0.0034]. Similarly, with thresholds of 30 and 60, the average RMSE remained 0.0026, also with CI95 = [0.0017–0.0034]. These results demonstrate that our method maintains excellent robustness under rotation transformations.
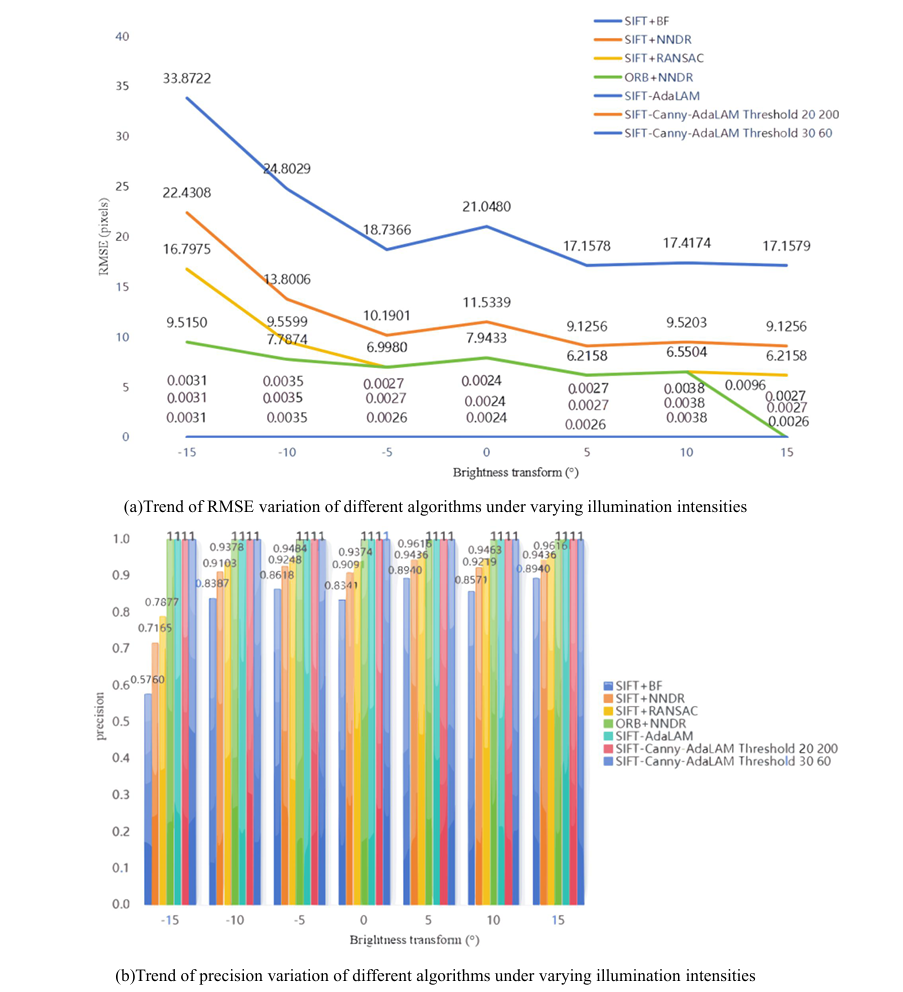
Illumination transform comparison
Variations in illumination intensity are common in real-world scenarios and represent one of the major factors affecting image matching performance. To evaluate the robustness of different algorithms under changing lighting conditions, we conducted a controlled experiment by manually adjusting the brightness of micrograph pairs from dark to bright. As shown in Fig. S8, the SIFT-Canny-AdaLAM method demonstrated strong robustness, maintaining a precision of 1 and an RMSE below 0.0038. ORB+NNDR also performed well, achieving a precision of 1; although its RMSE exceeded 6 under most lighting conditions, it decreased significantly to 0.0096 when the illumination intensity was set to 15.
To validate the robustness of the proposed method under illumination variations, we varied the lighting angle from –15° to 15° and conducted statistical analysis. With Canny thresholds set to 20 and 200, the average RMSE was 0.0030 pixels (CI95 = [0.0025–0.0034]); with thresholds of 30 and 60, the average RMSE remained 0.0030 pixels (CI95 = [0.0025–0.0027]). These results confirm that the proposed method maintains strong robustness under brightness changes.
Experiments in the traceability section
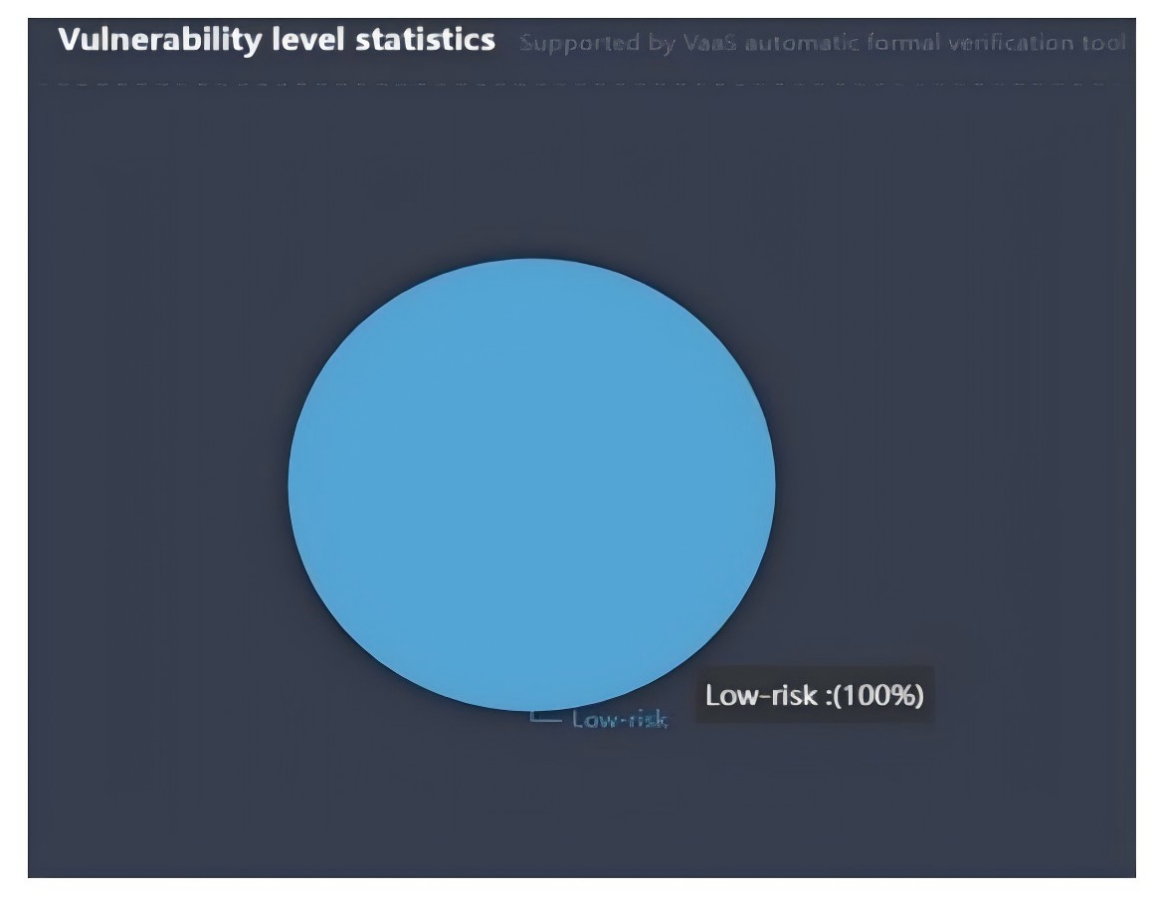
When placing transaction records on the blockchain, the security of the smart contract becomes a top priority. This is because hackers may exploit vulnerabilities in the smart contract to attack the blockchain network. In this article, we use beosin-vaas (https://beosin.com/vaas), an online tool that checks the security of smart contracts. As shown in Fig. S9, the smart contract designed in this article is capable of defending against common attacks.
Additionally, cost considerations are critical. Storing a 1 MB (900 × 900 pixels) image directly on the blockchain incurs approximately 0.1069 ETH (≈ $320.82), whereas storing only the IPFS-generated hash of the micrograph on-chain costs merely 0.000003264 ETH (≈ $0.01), representing a 99.9969% reduction in storage expenses.
Discussion
Beyond the main evaluation, we further conducted a parameter sensitivity analysis to assess the robustness of the proposed pipeline under different threshold settings (Figs. S10 and S11, Tables S1 and S2).
Parameter sensitivity analysis
To assess the robustness of our system against parameter variations, we conducted a parameter sensitivity analysis on the two key components of the pipeline: Canny edge detection thresholds and AdaLAM filtering thresholds. Because the proposed method filters impostor pairs completely, precision values are consistently 1.0 for true verification and 0 for impostor verification. Accordingly, we focus on RMSE and inlier counts when comparing parameter settings.
- 1.
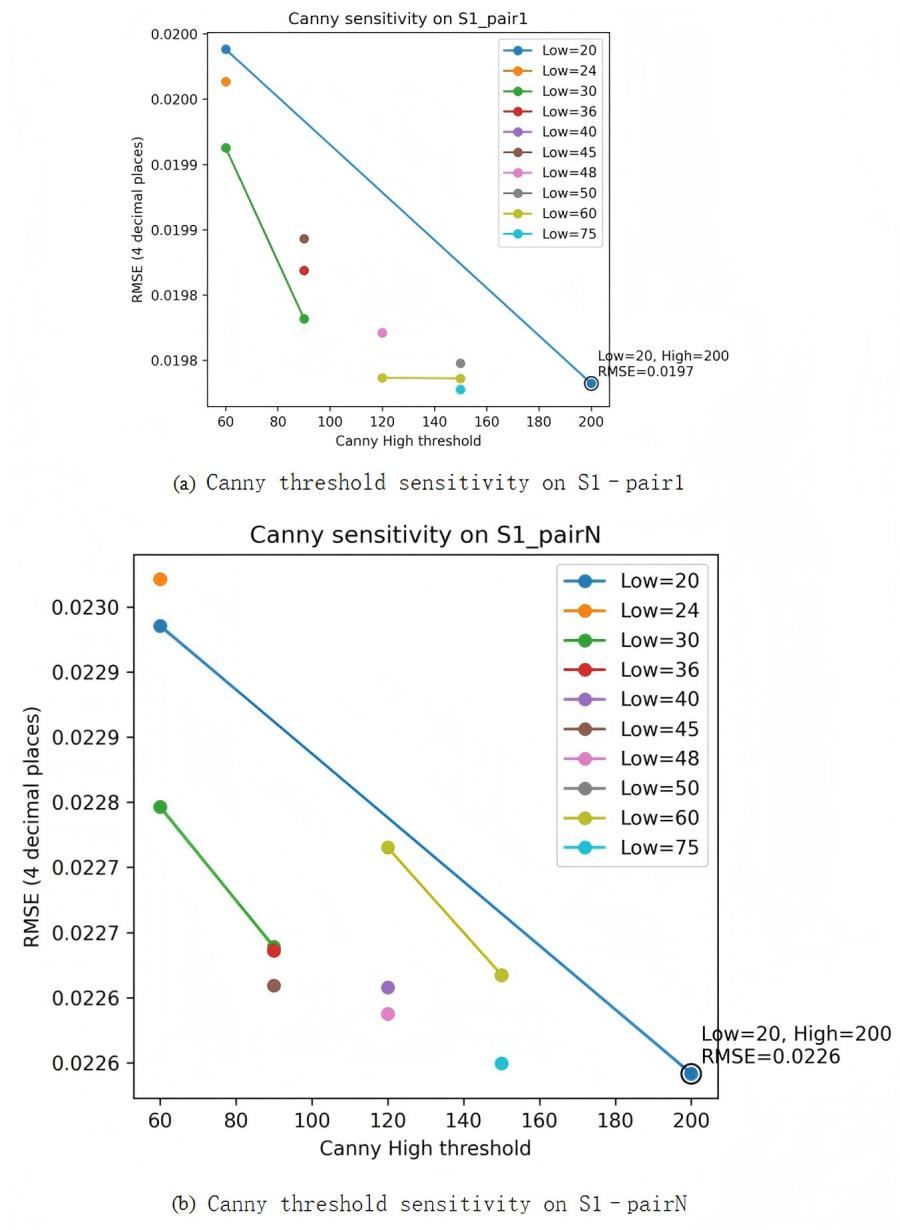
Canny thresholds sensitivity
We tested a range of Canny threshold parameters: High ∈ {60, 90, 120, 150, 200} and Low values chosen to cover hysteresis ratios of 2:1 to 3:1, including the setting used in our original system (Low = 20, High = 200). We observed minimal variation in precision across all configurations for true verification pairs (S1–pair1, S1–pairN, namely, the first and last pairs of images in Fig. S1 mentioned earlier), with RMSE varying by only 1.31% for S1–pair1 and 1.67% for S1–pairN. For the impostor pair (S4–false, namely, Fig. S4 mentioned earlier), no inliers were detected under all parameter settings (precision = 0). Results are summarized in Table S1 and illustrated in Fig. S10.
- 2.
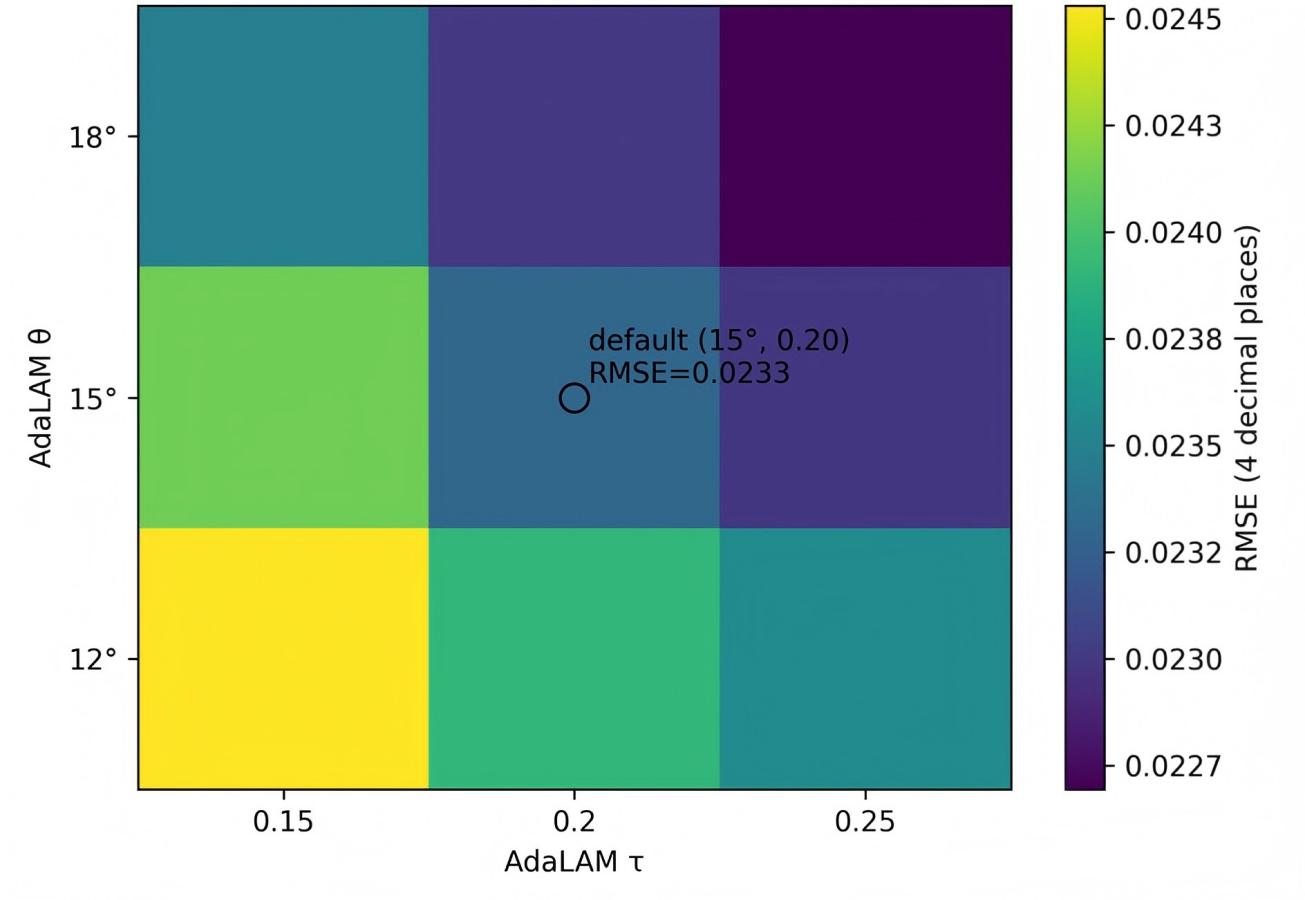
AdaLAM thresholds sensitivity
We further evaluated AdaLAM’s rotation tolerance θ ∈ {12°, 15°, 18°} and scale ratio threshold τ ∈ {0.15, 0.20, 0.25}. Precision remained at 1.0 for the true verification pair and 0 for the impostor pair across all 3 × 3 configurations. RMSE varied by 7.81% across the grid, while the number of inliers generally increased with larger τ (e.g., from 1,638 to 2,038), indicating a favorable accuracy–recall trade-off. The default setting (θ = 15°, τ = 0.20) lies within this stable region and is near the Pareto front in terms of accuracy and inlier count. Results are provided in Table S2 and visualized as a heatmap in Fig. S11.
Summary
Overall, the method is not reliant on a single “magic number”: it sustains stable precision and small RMSE fluctuations over reasonable parameter ranges for both components. These findings confirm the robustness of our pipeline and provide practical guidance for parameter selection in deployment.
Conclusion
The findings from both the primary experiments and the parameter sensitivity analysis provide a strong basis for the following conclusions, which highlight the effectiveness and limitations of the proposed system.
To address issues of low authentication accuracy, high cost, lengthy processing time, and potential damage to artifacts during ceramic transactions, this article proposes a novel ceramic identification and traceability system combining the SIFT-Canny-AdaLAM algorithm with blockchain technology. Our study demonstrates that microscopic images of ceramics possess inherently unique features without harming the artifacts. By applying the SIFT-Canny-AdaLAM algorithm for feature extraction and matching, and storing large-volume image data on IPFS to obtain a hash address—then binding this hash with the ceramic’s structural information on the blockchain—the system enables rapid authentication by simply uploading a local micrograph. Experimental results show that SIFT-Canny-AdaLAM outperforms competing methods in true verification, false verification, scale, rotation, and illumination variation tests. Coupled with the immutability of IPFS and blockchain, and a risk-resistant smart contract, the system significantly enhances the reliability of ceramic authentication and provenance.
Certainly, this system still requires further improvements. The possibility of identifying unrecorded ceramics is very low, and obtaining results still requires some manual analysis. Additionally, the content addressing mechanism of the IPFS architecture causes data retrieval delays (with an average of 2.3 s), which can be optimized through edge node caching in the future. Lastly, the issue of rigid logic in smart contracts, which makes it difficult to dynamically adjust identification rules, requires further research into combining “upgradable contracts” with oracles. However, as an auxiliary method for ceramic identification and traceability, it provides a reliable basis for these processes. Overall, the method proposed in this article is a promising approach for ceramic identification and traceability. This method is not only applicable to ceramic identification but can also be extended to other fields that require high-precision feature matching and data traceability, such as the identification and traceability of other cultural relics and industrial products.
Future work
Building on these conclusions, we outline several directions for future research. We recognize the value of a larger-scale evaluation and plan to extend the experimental campaign using distributed or cloud computing methods in future work. This will enable us to cover a larger portion of the dataset and further improve the statistical confidence in our results.
Supplemental Information
Example of running code.
The results of this video run are the same as the results on page 13 of this thesis because the same data is being run
Sample local micrographs selected from the micro-ceramic dataset.
Performance variation of different algorithms in true verification experiments.
Example images of successful matches in the false verification test (SIFT+BF, SIFT+NNDR, SIFT+RANSAC showing correct matches).
From left to right, the matching results are plotted for SIFT+BF, SIFT+NNDR, SIFT+RANSAC respectively
The example images of matched pairs that passed the false verification test (SIFT+BF, SIFT+NNDR, SIFT+RANSAC showing incorrect matches).
From left to right, the matching results are plotted for SIFT+BF, SIFT+NNDR, SIFT+RANSAC respectively