A progressive decay Mixup data augmentation for long-tailed image classification
- Published
- Accepted
- Received
- Academic Editor
- Bilal Alatas
- Subject Areas
- Algorithms and Analysis of Algorithms, Artificial Intelligence, Computer Vision, Optimization Theory and Computation, Neural Networks
- Keywords
- Long-tailed distribution, Mixup, Data augmentation, Over-sampling
- Copyright
- © 2025 Li et al.
- Licence
- This is an open access article distributed under the terms of the Creative Commons Attribution License, which permits unrestricted use, distribution, reproduction and adaptation in any medium and for any purpose provided that it is properly attributed. For attribution, the original author(s), title, publication source (PeerJ Computer Science) and either DOI or URL of the article must be cited.
- Cite this article
- 2025. A progressive decay Mixup data augmentation for long-tailed image classification. PeerJ Computer Science 11:e3261 https://doi.org/10.7717/peerj-cs.3261
Abstract
Image classification with long-tailed distribution (i.e., a few classes occupy most of the training samples, while most classes have only a small number of representations) is a challenging visual task at present. In this article, we propose a novelty Mixup-based data augmentation technique, which uses two sampling mechanisms (i.e., instance-based sampling and class-based sampling) to independently sample and mix the training samples. Specifically, we obtain a conventional sample distribution from instance-based sampling and a balanced sample distribution from class-based sampling. The two sets of samples are then mixed to provide a more balanced sample distribution for model training and effectively reduce the under-fitting of tail classes. In addition, we also design a decay mixing strategy to dynamically adjust the sample mixing weights during the training process. By doing so, we can gradually guide the model training and prevent over-fitting. We validate the proposed method on the long-tailed version of datasets created by CIFAR-10, CIFAR-100, CINIC-10, Tiny-ImageNet, Fashion-Mnist, and ImageNet-LT. Experimental results demonstrate that our method achieves better classification performance than other advanced Mixup-based techniques in data imbalanced scenarios.
Introduction
Deep convolutional neural networks (CNNs) have advanced performance in image classification (He et al., 2016; Krizhevsky, Sutskever & Hinton, 2012). However, the classification performance may decline when the data presents a long-tailed distribution (Buda, Maki & Mazurowski, 2018; Park et al., 2021; Yang & Xu, 2020; Zhang et al., 2023). Due to the dominant role of the sample sufficient classes (i.e., head classes), the model’s fitting to the sample lacking classes (i.e., tail classes) is inadequate, which impairs the classification performance of the model.
To mitigate the adverse effects caused by long-tailed distribution, many solutions have been developed in relevant works (Huang et al., 2016; Pang et al., 2023; Wang et al., 2023; Zhang et al., 2021, 2022a). Among these methods, re-sampling and re-weighting are the basic techniques to solve the long-tailed distribution problem. Re-sampling technique is mainly to preprocess the training samples and achieve the balance of training sample distribution through over-sampling or under-sampling (Ando & Huang, 2017; Morais & Vasconcelos, 2019; Zhu, Liu & Zhu, 2022; Zhao et al., 2023). These methods improve the representation ability of tail classes by synthesizing the tail class samples. Re-weighting technique usually provides greater weight compensation for tail classes to alleviate the shortage of tail classes learning (Ren et al., 2018; Santiago et al., 2021; Shu et al., 2019).
Although the above techniques have certain advantages on the long-tailed distribution problem, some studies have found that the rebalancing methods (i.e., re-sampling and re-weighting) can impair the representation learning and inhibit the performance of the model (Cao et al., 2019; Zhou et al., 2020). Therefore, some related works (Kang et al., 2019; Zhou et al., 2020) decouple the training process and coordinate the combination of conventional training and rebalancing training to achieve better performance. The typical method is bilateral-branch network (BBN) (Zhou et al., 2020), which designs a two-branch network to consider both representation learning and rebalancing learning, so as to effectively avoid the damage of rebalancing learning to features. Besides, some related works use data augmentation to increase the diversity of tail class samples (Li et al., 2021; Mullick, Datta & Das, 2019), like adaptive synthetic (ADASYN) (He et al., 2008) or Synthetic Minority Over-sampling Technique (SMOTE) (Chawla et al., 2002). These methods improve the representation ability of tail classes by synthesizing the tail class samples.
Our approach is the improvement method of the well-known Mixup (Zhang et al., 2017) data augmentation. Mixup is a common data augmentation that enhances the generalization performance of the model through the weighted mixing of training sample pairs. However, Mixup randomly combines training samples regardless of their classes, and mixing in a long-tailed distribution will introduce noise and reduce the performance of the model. Some approaches involving Mixup and long-tailed distribution have been explored recently (Baik, Yoon & Choi, 2024; Chou et al., 2020; Galdran et al., 2021; Kabra et al., 2020; Zhang et al., 2022b). Remix (Chou et al., 2020) retains part of the tail class labels to alleviate the lack of tail classes in the process of mixing. Balanced Mixup (Galdran et al., 2021) performs both instance-based sampling and class-based sampling during mixing to create a balanced distribution of synthetic samples. Label-Occurrence-Balanced Mixup (Zhang et al., 2022a) combines Mixup with over-sampling so that the occurrence of labels in each class remains statistically balanced. In contrast, Curriculum of Data Augmentation (CUDA) (Ahn, Ko & Yun, 2023) mitigates class imbalance by adjusting augmentation strength based on class difficulty.
In this article, we proposed a novel mixing mechanism based on the Mixup data augmentation named progressive decay Mixup. First, the mechanism simultaneously performs instance-based sampling and class-based sampling to provide a balanced sample distribution for mixing. Figure 1 shows the sample distribution diagram of the above sampling strategies. Second, we propose a progressive decay strategy which uses a linear decay factor instead of the random mixing factor in Mixup. By doing this, the proposed strategy can adaptively adjust the mixing weights of the two sampling batches and avoid model overfitting by guiding the model learning gradually. Third, compared with the classical bilateral-branch network (BBN) (Zhou et al., 2020), the proposed method can availably guide the model training by assigning label distribution without introducing additional models (Zeng et al., 2024). The main contributions of our work are:
- (a)
We provide a more complete form of the Mixup algorithm for long-tailed distribution scenario, and the modified Mixup successfully integrates oversampling with Mixup organically.
- (b)
For the process of sample mixing, we propose a novel progressive decay strategy which enables the model to focus on tail classes progressively.
- (c)
By evaluating our method in various long-tailed versions of datasets, the proposed method outperforms other Mixup-based techniques in the long-tailed distribution.
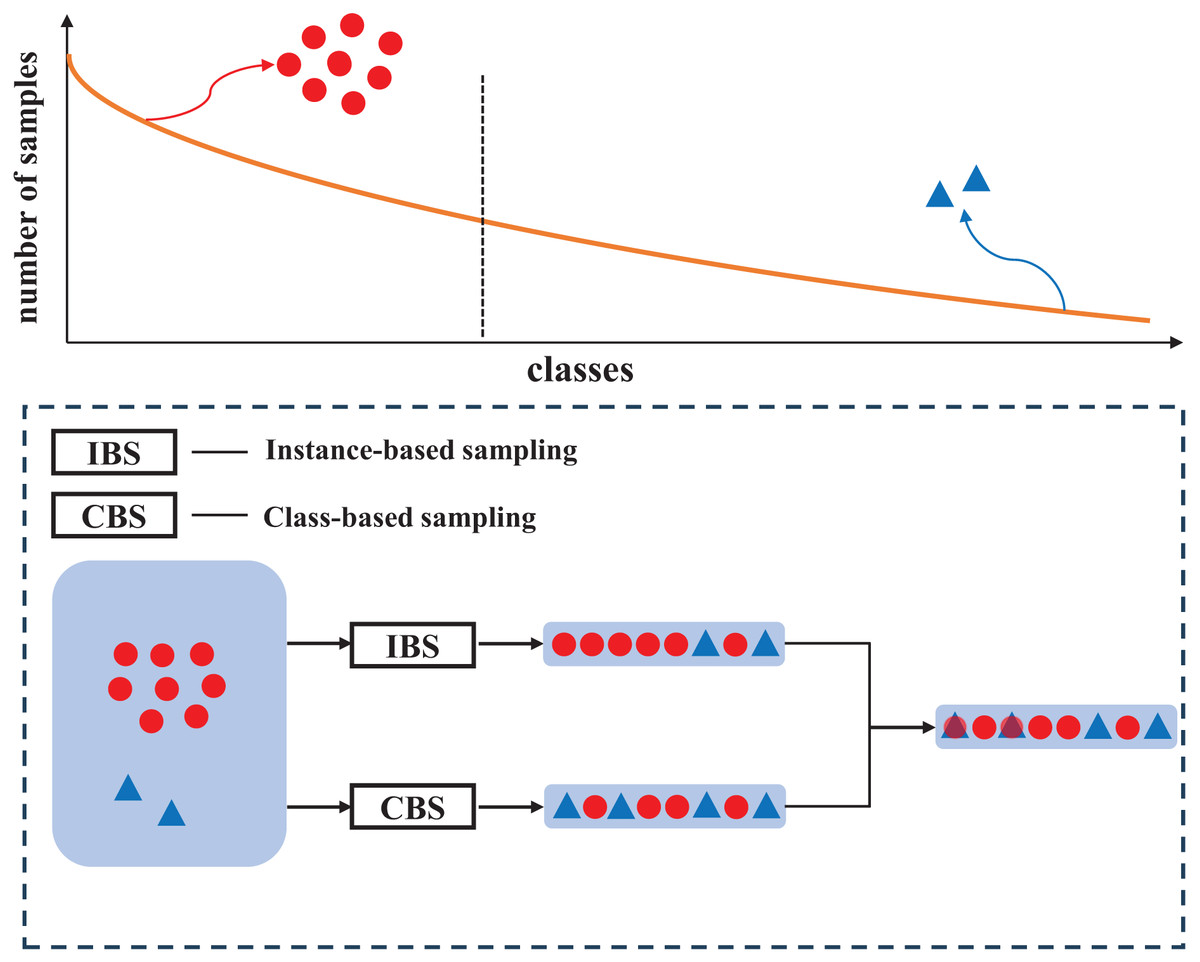
Figure 1: Distribution diagram of mixed samples obtained from two sampling strategies.
By taking advantage of class-balanced sampling, the proposed mechanism can effectively increase the proportion of tail class labels in mixed samples, to alleviate the label imbalance.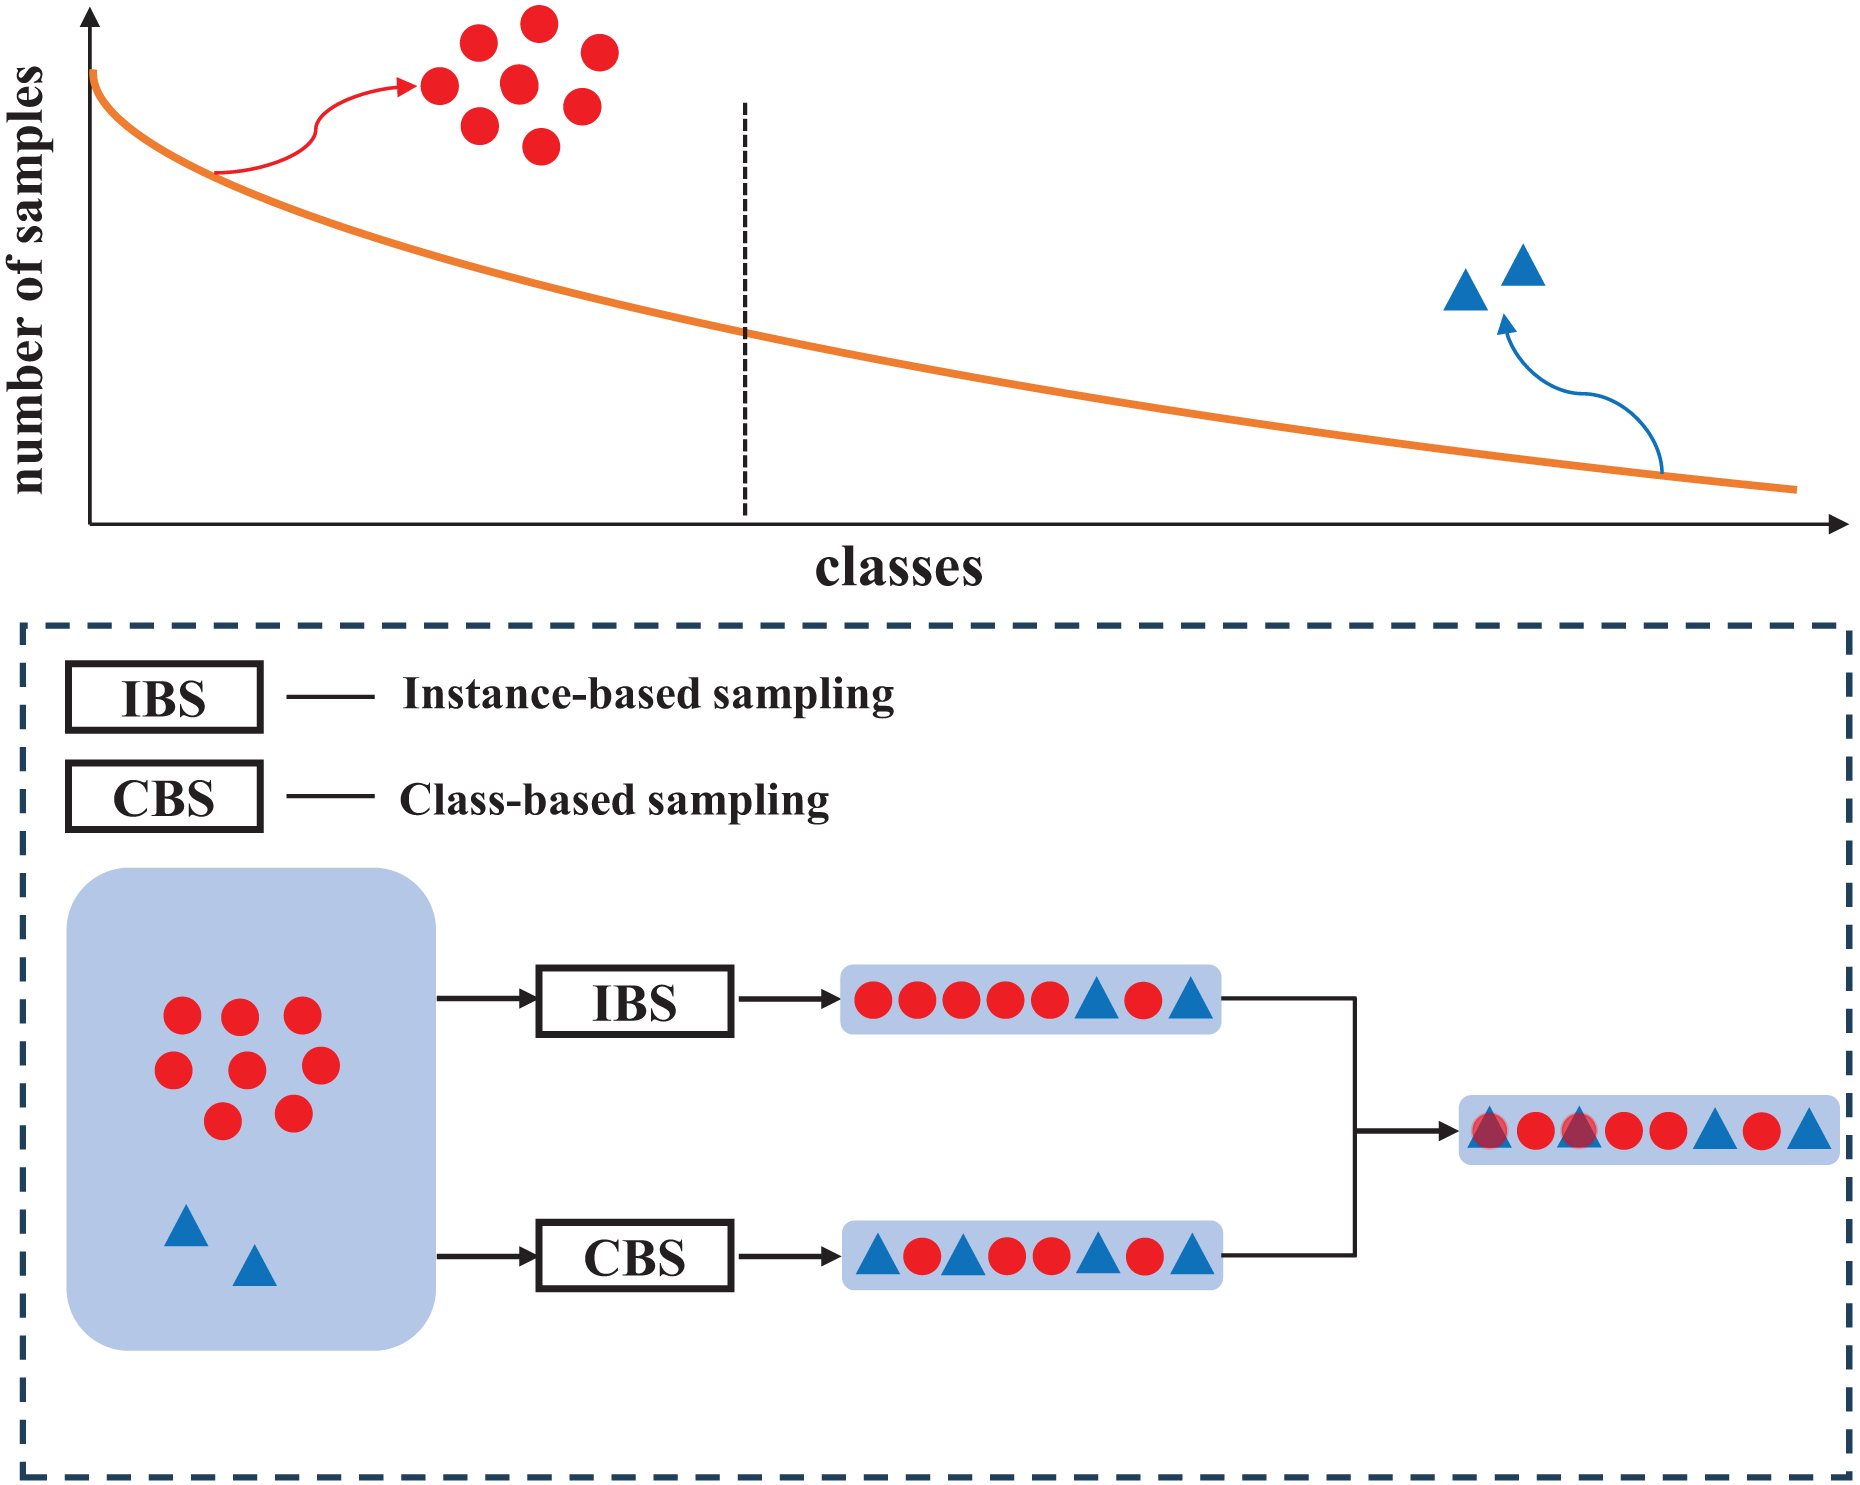
Related work
Re-sampling
Re-sampling aims to pre-process imbalanced data, which mainly includes over-sampling and under-sampling (Buda, Maki & Mazurowski, 2018). For over-sampling, the usual practice is to randomly repeat the tail class samples and add them to the original samples. However, the appearance of repeated tail class samples may lead to overfitting of tail classes. Therefore, some data augmentation techniques have been proposed to further improve the diversity of tail class samples, and the classical methods include SMOTE (Chawla et al., 2002) and ADASYN (He et al., 2008). Recently, some newfangled over-sampling techniques have been presented. Li et al. (2021) produced diverse tail class samples by translating deep features along many semantically meaningful directions. Park et al. (2022) proposed an over-sampling method that generated tail class samples by using the rich background of head class samples. Zhu, Liu & Zhu (2022) proposed an interpolating over-sampling method which generated minority samples by identifying clean tail class subregions. For under-sampling, it achieves the relative balance of sample distribution by randomly eliminating part of the head class samples (Wan, Zhou & Wang, 2024). However, this approach has an obvious drawback, which may inevitably lose important features (Wang et al., 2019), thus affecting the performance of the network. Niu et al. (2022) addressed the class imbalance problem by introducing a reliability-based approach grounded in Dempster-Shafer theory, aiming to alleviate the dominance of majority classes. Zhang et al. (2025) employed belief function theory in evidential clustering to better represent data uncertainty and imprecision. To improve classification on imbalanced datasets, Tian et al. (2022) developed an evidential ensemble method that combines hybrid-sampling (incorporating over-sampling and under-sampling) at the decision level.
Re-weighting
Re-weighting mainly assigns greater weight compensation to tail classes (Ren et al., 2018; Tan et al., 2020), thereby narrowing the gap between various classes in the classifier. The basic method is weighted by the reciprocal of class frequency or weighted by the reciprocal of the square root of class frequency (Tan et al., 2020). Lin et al. (2017) proposed a focal loss, whose principle was to introduce a weight coefficient to reduce the weight of negative samples in the total loss, so as to give higher weight to hard-classified tail classes. Cui et al. (2019) proposed a class-balanced loss, and the weight was assigned by considering the overlap of each sample. Ren et al. (2020) proposed a balanced-meta softmax, where predicted values were nuancedly weighted to counteract the misclassification bias arising from class imbalance. Zhao et al. (2023) conducted collaborative training of loss re-weighting and sample re-sampling, which significantly improved the performance of the tail classes.
Representation and classifier learning based on decoupling
The method based on decoupling learning (Kang et al., 2019; Zhou et al., 2020) is a research field that has attracted much attention in recent years, and such methods have achieved excellent performance in long-tailed distribution. Decoupling learning is to decouple the training process, which tends to learn features in the early stage of training and then tends to re-balance in the later stage of training. Kang et al. (2019) proposed a two-stage training strategy in which the original unbalanced sample distribution was used in the first stage of training for the representation learning, and re-sampling was used in the second stage to enhance the attention of tail classes gradually. Zhou et al. (2020) designed an end-to-end bilateral-branch network (BBN) to consider both classifier learning and representative learning, and its accumulative learning strategy completed the modeling of the tail classes during the training process. BBN received extensive attention in recent years because of its excellent performance in image recognition. For example, Baik, Yoon & Choi (2024) added data augmentation in two-branch network architecture to strengthen the representation learning of tail classes. Guo & Wang (2021) proposed a cross-branch training strategy to improve the synergy of the two branches and consider the performance improvement of both head classes and tail classes.
Mixup-based data augmentation
Mixup (Zhang et al., 2017) is a classical data augmentation that imposes linear constraints on the model through linear interpolation between samples to improve the generalization performance of the model. However, mixing under a long-tailed distribution may create noise samples and lead to an imbalance of mixed labels. To solve this problem, many Mixup-based improvements have been presented (Chou et al., 2020; Galdran et al., 2021; Zhang et al., 2022a). Chou et al. (2020) proposed a Rebalanced Mixup which retained part of the tail class labels during the mixing process to address the imbalanced problem. Galdran et al. (2021) proposed a Balanced Mixup which performs class-based sampling to create a balanced distribution of synthetic samples. Kabra et al. (2020) proposed a synthetic over-sampling method that uses Mixup to supplement the mixed samples into the original samples. Zhang et al. (2022a) proposed a Label-Occurrence-Balanced Mixup which combined Mixup with over-sampling to keep each class label statistically balanced. Ahn, Ko & Yun (2023) introduced CUDA, a curriculum-based data augmentation approach that dynamically determines both the classes to be augmented and the corresponding augmentation strength for each class. Baik, Yoon & Choi (2024) proposed an effective augmentation strategy, referred to as Bilateral Mixup Augmentation, which enhances long-tailed visual recognition by mixing head and tail class samples in a balanced manner. Pan et al. (2024) presented Contrastive CutMix, which constructs semantically consistent augmented samples to further improve performance in long-tailed recognition tasks. Zhao, He & Zhao (2025) developed a dual progressive augmentation framework that progressively balances the learning process to mitigate class imbalance in long-tailed classification scenarios.
Proposed methods
In this section, we first introduce the concepts of the Mixup data augmentation and the traditional over-sampling strategy, and then we explain the details of the proposed progressive decay Mixup algorithm.
Review of Mixup technique
Mixup (Zhang et al., 2017) is a common data augmentation, which creates mixed samples by linear weighting between samples to improve the linear representation of the model. Specifically, assuming any training sample and its label , Mixup generates mixed sample by linearly weighting two random training samples and . The expression is as follows:
(1)
The mixing factor is sampled from the , where is the hyperparameter that controls the beta distribution. Due to the randomness of data sampling, Mixup technique may synthesize noise samples when the data distribution is extremely class-imbalanced, and it also leads to the reduction of classification performance.
Data sampling strategies
When the training data presents a long-tailed distribution, tail classes are usually suppressed by head classes during the training process, which causes the underfitting of tail classes, and even tail classes are completely ignored by the model. Data-level based sampling strategies can be used to relieve this effect, such as over-sampling, although repeatedly showing the same tail class samples to the model may result in overfitting of tail classes. The general sampling strategy can be described as follows:
(2) where refers to the index of classes. represents the sampling frequency from the class . is the total sample number of class . K denotes the number of classes. is a parameter setting.
When , the sampling frequency is equal to the frequency of the samples on the training set (i.e., instance-based sampling). In this case, the classes with more samples have a higher sampling frequency, and it obtains an imbalanced sample batch .
When , the sampling probability remains the same for each class (i.e., class-based sampling), and class-based sampling strategy receives a balanced sample batch .
Proposed double sampler mixup
The two sets of data batches obtained from the above sampling strategies are then linearly weighted. By doing so, we leverage class-based sampling to effectively enhance the proportion of tail classes, while incorporating the linear mechanism of Mixup to prevent overfitting. Meanwhile, we hope to achieve the guiding effect of the model by dynamically adjusting the weights of the two sample groups. The specific mixing process is shown as follows:
(3) where is the generated new sample. denotes the sample from the imbalanced batch , and represents the sample from the balanced batch . is the proposed linear decay factor.
Proposed decay mixing strategy
The mixing factor in the original Mixup is acquired from the beta distribution , but it still relies on a hyperparameter . Motivated from cumulative learning of bilateral-branch network (Zhou et al., 2020), we propose a decay mixing strategy which designs a linear decay coefficient instead of the random mixing factor. The specific mixing factor is as follows:
(4) where is the proposed linear decay factor, and refers to the specific number of training epochs. is the total number of training epochs. As the training epochs increased, the value of is gradually decreasing. The training samples of generated batches are fed into the network for training. For each class , the probability of output via the softmax is as follows:
(5) where denotes the probability of output. is the predicted score. The weighted cross entropy loss is formulated follows:
(6) where is expressed as cross entropy loss. The specific process of the proposed method is shown in Fig. 2.
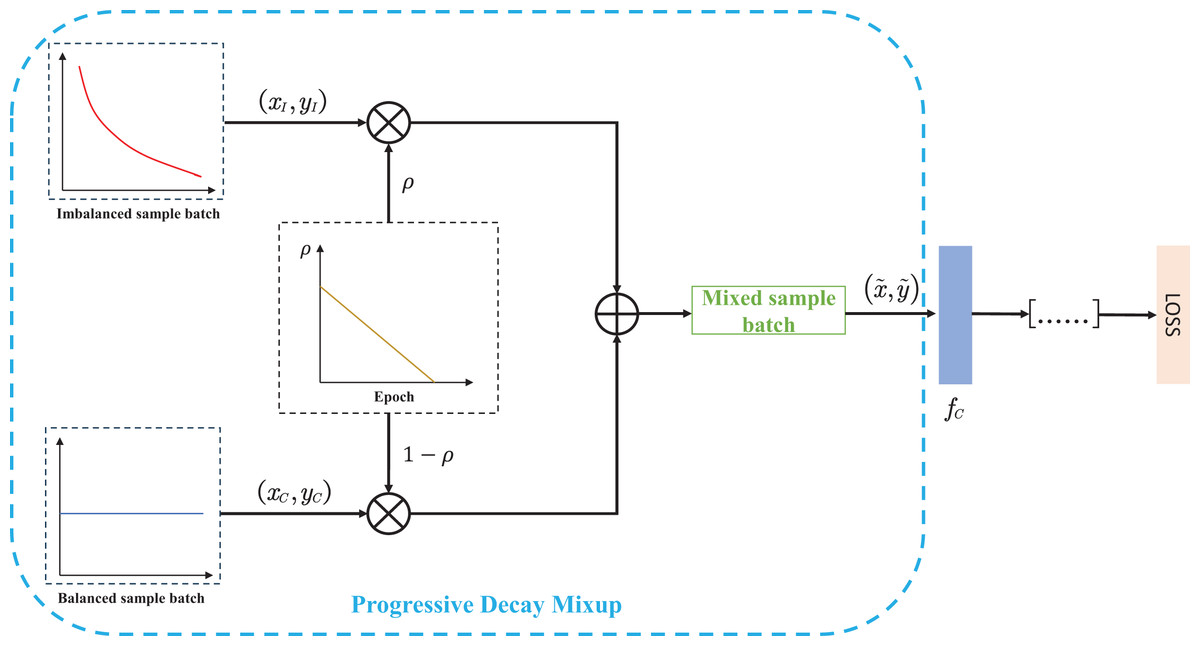
Figure 2: The specific process of the progressive decay MIxup data augmentation.
Firstly, we create balanced sample batches and imbalanced sample batches by using two samplers with different sampling properties. Secondly, the two sets of sample batches are mixed to generate new batches for model training. Moreover, the proposed linear decay factor is designed as a mixing coefficient to adjust the weights of the two batches, which guides the model training.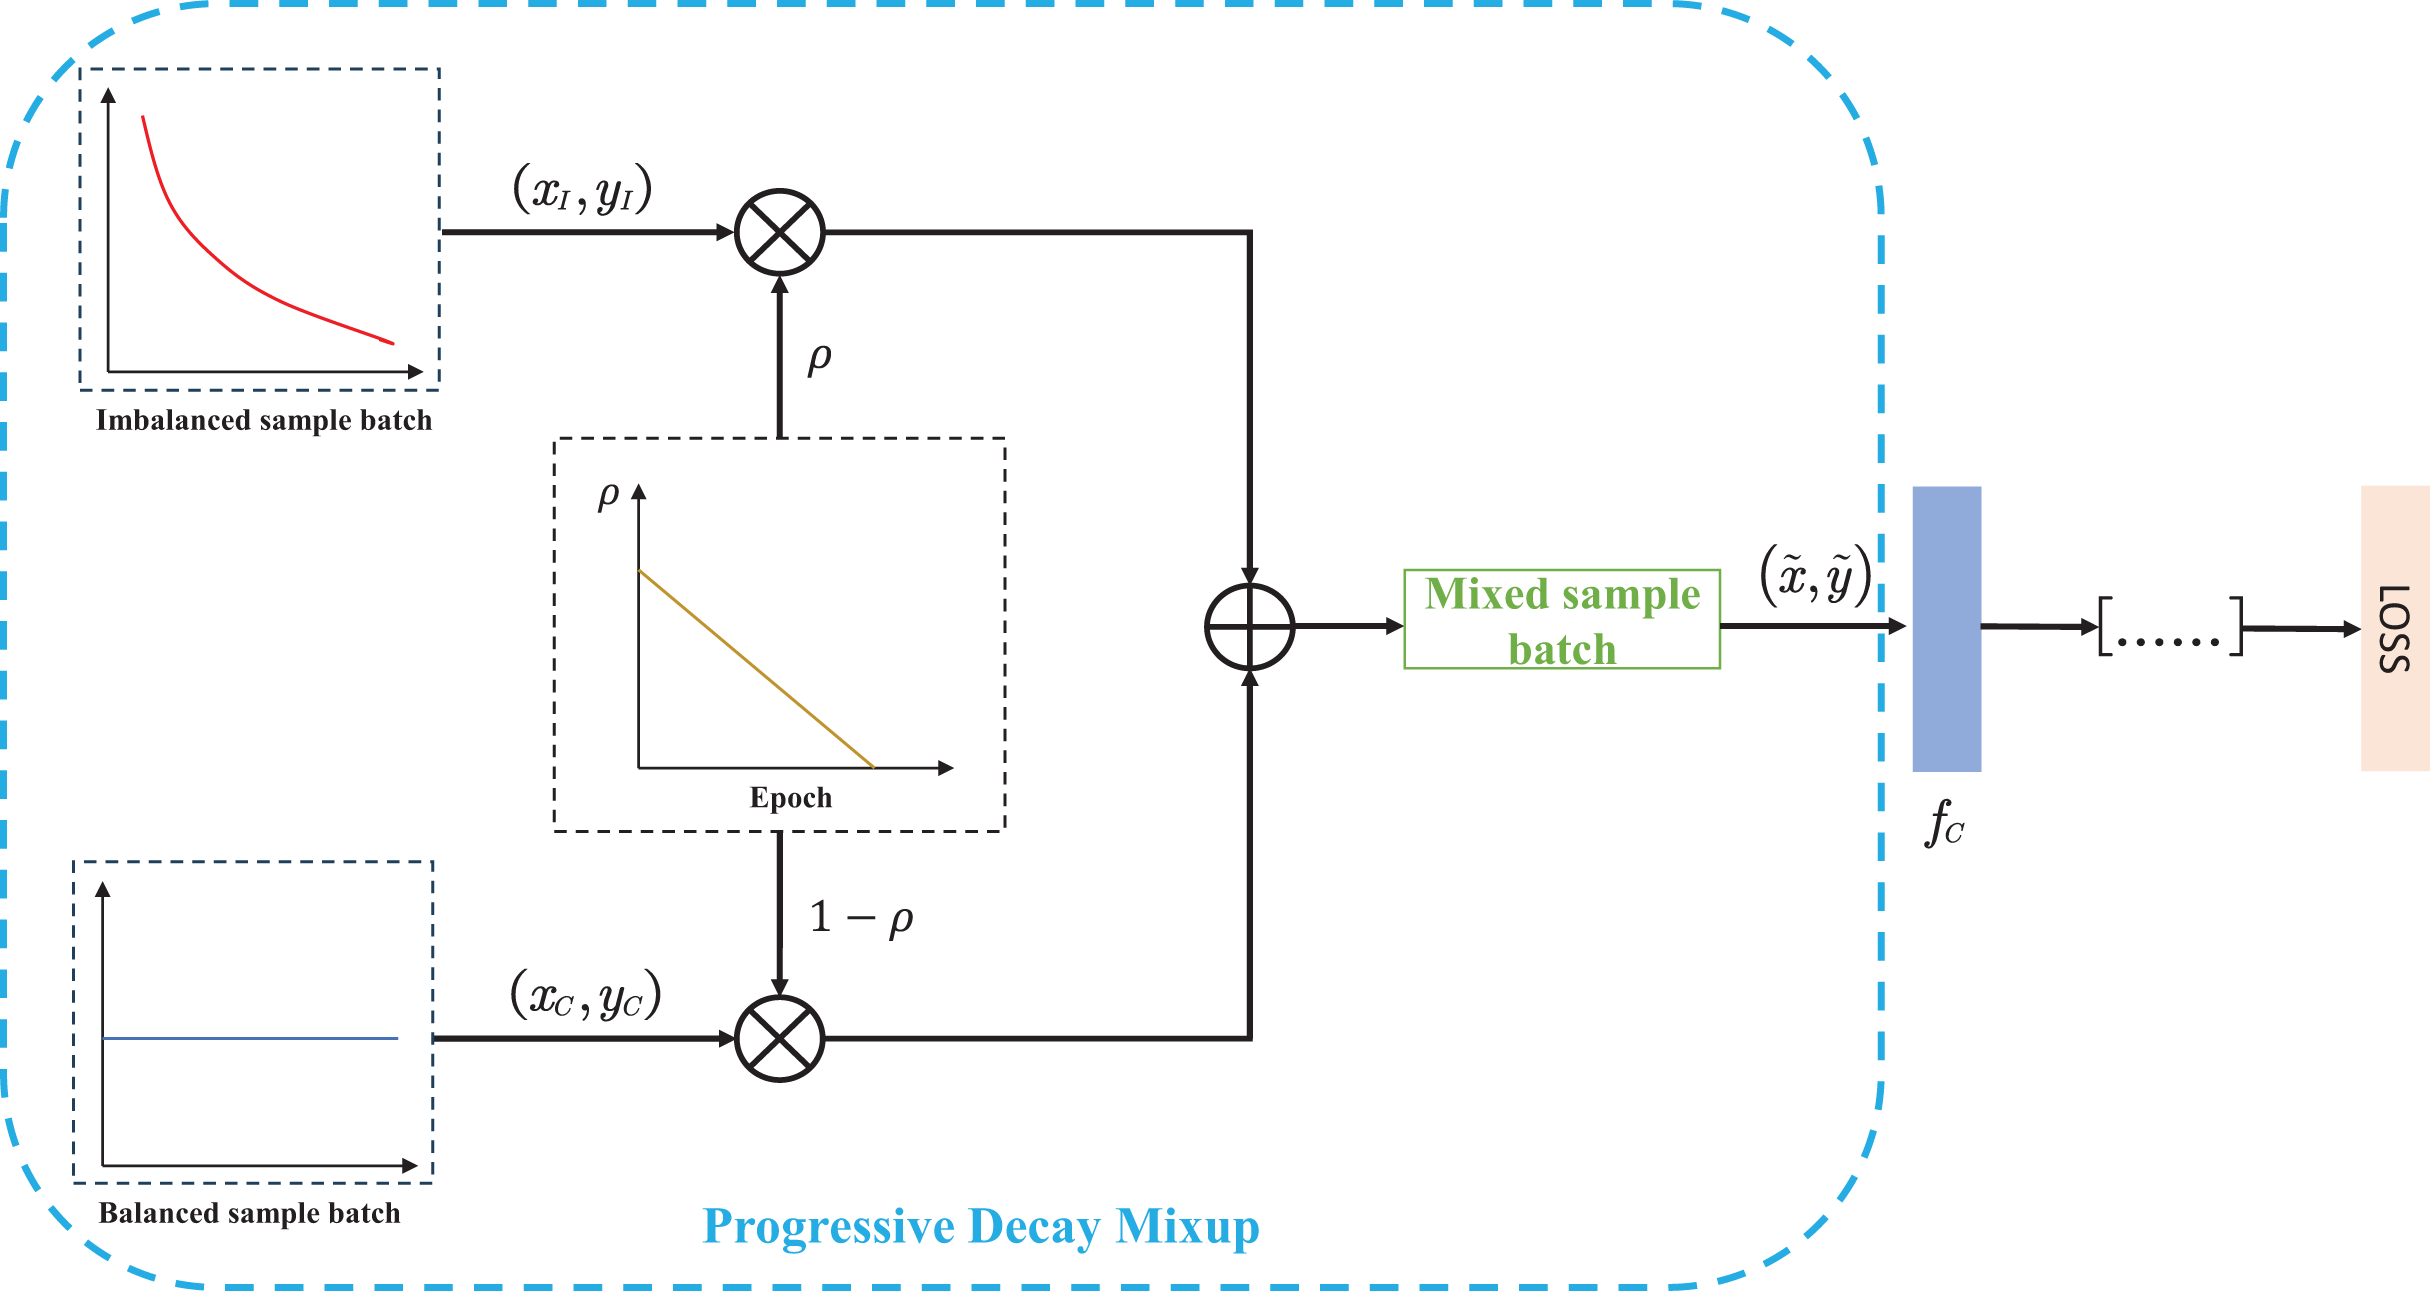
The proposed decay mixing strategy abandons the random mixing factor and thus eliminates the control of hyperparameter . More importantly, the proposed strategy can adaptively adjust the weights according to the specific training epochs. During the training process, the two sampling branches coordinate with each other to create mixed samples with different label distributions by adjusting the mixing weights of each training epoch. At the early stage of training, imbalanced sample batches occupy the main weights, and it helps the model quickly establish the basic representation. As the mixing factor decays, the samples from the balanced batches dominate the mixing weights in the later training period, which can strengthen the learning of tail classes.
Experiments
In this section, we introduce the image recognition datasets used in this experiment, which are CIFAR-10/100 (Krizhevsky & Hinton, 2009), CINIC-10 (Darlow et al., 2018), Fashion-Mnist (Xiao, Rasul & Vollgraf, 2017), Tiny-ImageNet (Li, Karpathy & Johnson, 2017), and ImageNet-LT (Olga et al., 2015). Then we illustrate the partitioning method of the long-tailed distribution and construct the long-tailed version of the above datasets.
Datasets introduction and long-tailed settings
CIFAR-10/100 (Krizhevsky & Hinton, 2009): The CIFAR dataset is a classic image classification dataset, which can be divided into CIFAR-10 and CIFAR-100 subsets according to the different numbers of categories. Both CIFAR-10 and CIFAR-100 include 50,000 training samples and 10,000 testing samples, and the size of images is 32 32.
CINIC-10 (Darlow et al., 2018): the CINIC-10 dataset consists of 270,000 images, which is 4.5 times the size of the CIFAR-10 dataset. It is built on two datasets, ImageNet (Deng et al., 2009) and CIFAR-10. The CINIC-10 dataset is divided into three equal subsets (training, validation, and testing), each containing 90,000 images. Due to its ample number of samples, it is possible to construct the long-tailed distribution while ensuring a sufficient number of samples for each category. In our experiments, we use the training set and the validation set for training and testing, respectively.
Fashion-Mnist (Xiao, Rasul & Vollgraf, 2017): the Fashion-Mnist is a clothing image dataset with a training set of 60,000 samples and a testing set of 10,000 samples. The samples in the dataset are divided into 10 classes and each sample is a 28 28 grayscale image.
Tiny-ImageNet (Li, Karpathy & Johnson, 2017): the Tiny-ImageNet dataset is a common visual dataset with images derived from the ImageNet dataset. The dataset contains 200 categories, where each category is assigned 500 images for training, 50 images for validation, and 50 images for testing. In our experiments, we only use the training set and validation set.
ImageNet-LT (Olga et al., 2015): the ImageNet-LT dataset is a long-tailed variant of the large-scale ImageNet dataset, which was created by sampling 1,000 classes according to a Pareto distribution with = 6. Its sampling leads to significant class imbalance, with head classes exceeding 1,280 samples and tail classes having fewer than 5. The ImageNet-LT dataset contains approximately 115,000 images in total and is widely used as a benchmark for evaluating performance under extreme class imbalance.
Long-tailed Settings: before training, we preprocess the above dataset to construct the long-tailed version of the dataset by adjusting the sample number. The long-tailed datasets are created based on an exponential decay function (i.e., ). denotes the sample number of class , and indicates the sample number of the most frequent class. C is the number of categories. The imbalance ratios (i.e., ) we used in the experiments are 10, 50, and 100, where is the sample number of the rarest class.
Implementation details
In the data preprocessing stage, we apply usual data augmentation strategies, including random crop and random horizontal flip. We train the model by using the mini-batch gradient descent with momentum 0.9 and weight decay 0.0002, and the batch size is set to 128. By following the work of Cao et al. (2019), we set the initial learning rate to 0.1 and adopt a warm-up learning rate schedule in the first 5 epochs. The number of training epochs is 300, and we decay the learning rate at the epoch and epoch by 0.01, respectively. For CIFAR-10, CIFAR-100, and Tiny-ImageNet datasets, we use ResNet-32 as the backbone network. For CINIC-10 and Fashion-Mnist datasets, we adopt ResNet-18 for all experiments. For ImageNet-LT dataset, we use ResNet-50 as the backbone and train the model for 200 epochs.
Experiment results
We verify the classification performance of the proposed method on the above datasets. Moreover, we compare the proposed method with the vanilla method, rebalancing strategies, and some novel Mixup-based techniques. To ensure the fairness of the experiment, all methods are set with the same random seeds. The comparison methods are as follows: (1) CE: Cross-entropy loss. (2) Focal loss (Lin et al., 2017): Reweighted cross-entropy loss. (3) DRW, DRS (Cao et al., 2019): Deferred re-weighting and deferred re-sampling. (4) LDAM-DRW (Cao et al., 2019): Label-distribution-aware margin loss integrate with re-weighting. (5) Mixup-based data augmentations: Mixup (Zhang et al., 2017) and other variants such as Remix (Chou et al., 2020), Balanced-Mixup (Galdran et al., 2021), Label-Occurrence-Balanced Mixup (Zhang et al., 2022a). For Balanced-Mixup, we follow the two sets of parameter settings and in its original article (Galdran et al., 2021). The experimental settings of CUDA are adopted as specified in the original article (Ahn, Ko & Yun, 2023).
The top-1 classification accuracies of the above methods on long-tailed CIFAR-10 and long-tailed CIFAR-100 are reported in Table 1. We discover that the proposed method achieves better classification performance than other compared methods on both long-tailed CIFAR-10 and long-tailed CIFAR-100. For example, we get 78.80% top-1 accuracy for long-tailed CIFAR-10 with , which is 2.83% higher than that of Label-Occurrence Balanced Mixup, and we get 43.90% top-1 accuracy for long-tailed CIFAR-100 with , which is 2.20% higher than that of Balanced-Mixup ( ).
| CIFAR-10 | CIFAR-100 | |||||
|---|---|---|---|---|---|---|
| Methods | 10 | 50 | 100 | 10 | 50 | 100 |
| CE | 86.94 | 77.36 | 70.99 | 56.95 | 43.83 | 39.01 |
| Focal (Lin et al., 2017) | 87.20 | 76.80 | 71.71 | 56.51 | 44.17 | 38.37 |
| DRW (Cao et al., 2019) | 87.37 | 77.98 | 74.07 | 57.17 | 44.54 | 39.39 |
| DRS (Cao et al., 2019) | 87.11 | 77.40 | 74.06 | 56.70 | 44.12 | 38.48 |
| LDAM-DRW (Cao et al., 2019) | 87.24 | 79.36 | 74.66 | 56.29 | 45.07 | 40.56 |
| CUDA (Ahn, Ko & Yun, 2023) | 87.56 | 77.96 | 74.89 | 59.09 | 46.74 | 38.56 |
| Mixup (Zhang et al., 2017) | 88.01 | 78.75 | 73.05 | 58.21 | 44.60 | 40.04 |
| Remix (Chou et al., 2020) | 88.25 | 79.28 | 72.11 | 58.13 | 45.22 | 40.66 |
| Balanced-Mixup ( ) (Galdran et al., 2021) | 88.42 | 79.39 | 74.38 | 59.15 | 46.25 | 40.11 |
| Balanced-Mixup ( ) (Galdran et al., 2021) | 88.56 | 79.28 | 74.96 | 59.66 | 46.84 | 41.70 |
| Label-Occurrence Mixup (Zhang et al., 2022a) | 88.82 | 81.25 | 75.97 | 59.51 | 47.16 | 40.66 |
| Ours | 88.83 | 83.33 | 78.80 | 60.52 | 50.04 | 43.90 |
The top-1 accuracies of the involved methods on long-tailed CINIC-10 and long-tailed Fashion-Mnist are shown in Table 2. It can be found that the proposed method still achieves better performance under most imbalanced settings. Specifically, we get 66.66% top-1 accuracy for long-tailed CINIC-10 with , which is 3.78% higher than that of Label-Occurrence Balanced Mixup. For long-tailed Fashion-Mnist with , we get 92.00% top-1 accuracy, which is 1.04% higher than that of Balanced-Mixup . The top-1 accuracies of the compared methods on long-tailed Tiny-ImageNet are reported in Table 3. Building upon these results, our propose method also demonstrate strong performance on the large-scale ImageNet-LT dataset, achieving a top-1 accuracy of 43.21%, which exceeded that of Mixup by 1.36%, as shown in Table 4. Although Mixup alleviates class imbalance to some extent, it still fails to sufficiently improve the performance on tail classes. In contrast, the dual-sampler strategy proposed in our approach enables more effective learning under long-tail distributions, significantly enhancing its applicability in real-world scenarios. The trend of experimental results is basically consistent with other datasets, which further confirms the wide applicability of the proposed method.
| CINIC-10 | Fashion-Mnist | |||||
|---|---|---|---|---|---|---|
| Methods | 10 | 50 | 100 | 10 | 50 | 100 |
| CE | 77.79 | 66.90 | 61.46 | 92.90 | 89.62 | 87.88 |
| Focal (Lin et al., 2017) | 77.45 | 66.21 | 60.79 | 92.81 | 89.07 | 88.44 |
| DRW (Cao et al., 2019) | 77.89 | 67.14 | 61.05 | 92.47 | 90.08 | 88.53 |
| DRS (Cao et al., 2019) | 77.79 | 66.95 | 61.04 | 92.58 | 89.94 | 88.51 |
| LDAM-DRW (Cao et al., 2019) | 78.21 | 69.42 | 64.92 | 92.76 | 91.90 | 91.48 |
| CUDA (Ahn, Ko & Yun, 2023) | 78.65 | 65.53 | 61.06 | 92.41 | 90.52 | 88.65 |
| Mixup (Zhang et al., 2017) | 79.70 | 68.37 | 63.35 | 93.96 | 90.49 | 89.11 |
| Remix (Chou et al., 2020) | 79.35 | 68.42 | 63.45 | 93.73 | 90.23 | 89.54 |
| Balanced-Mixup ( ) (Galdran et al., 2021) | 78.53 | 67.72 | 62.86 | 93.75 | 91.07 | 89.55 |
| Balanced-Mixup ( ) (Galdran et al., 2021) | 79.31 | 67.69 | 61.52 | 93.83 | 90.96 | 89.73 |
| Label-Occurrence Mixup (Zhang et al., 2022a) | 79.41 | 68.65 | 62.88 | 93.28 | 92.68 | 93.28 |
| Ours | 81.92 | 73.06 | 66.66 | 93.99 | 92.00 | 90.47 |
| Tiny-ImageNet | |||
|---|---|---|---|
| Methods | 10 | 50 | 100 |
| CE | 36.23 | 25.15 | 22.06 |
| Focal (Lin et al., 2017) | 35.73 | 25.26 | 21.79 |
| DRW (Cao et al., 2019) | 36.92 | 25.26 | 22.26 |
| DRS (Cao et al., 2019) | 36.92 | 25.03 | 22.37 |
| LDAM-DRW (Cao et al., 2019) | 34.14 | 24.71 | 21.49 |
| CUDA (Ahn, Ko & Yun, 2023) | 38.64 | 24.89 | 22.34 |
| Mixup (Zhang et al., 2017) | 39.61 | 28.19 | 25.00 |
| Remix (Chou et al., 2020) | 40.72 | 28.12 | 25.03 |
| Balanced-Mixup ( ) (Galdran et al., 2021) | 39.56 | 26.96 | 23.69 |
| Balanced-Mixup ( ) (Galdran et al., 2021) | 40.49 | 28.19 | 24.61 |
| Label-Occurrence Mixup (Zhang et al., 2022a) | 37.77 | 23.98 | 19.25 |
| Ours | 42.60 | 30.88 | 25.55 |
| Methods | ImageNet-LT |
|---|---|
| CE | 38.72 |
| Mixup (Zhang et al., 2017) | 41.85 |
| Balanced Mixup (Galdran et al., 2021) | 42.26 |
| Ours | 43.21 |
The proposed method is an improved version of Mixup in the long-tailed distribution scenario. To intuitively demonstrate that the proposed method is superior to Mixup, we present their confusion matrices on long-tailed CIFAR-10 with , and the specific visual confusion matrices are shown in Fig. 3. There into, “airplane”, “automobile” are head classes, and “ship”, “truck” are tail classes. It can be seen from the two confusion matrices that the proposed method can significantly improve the classification performance of tail classes.
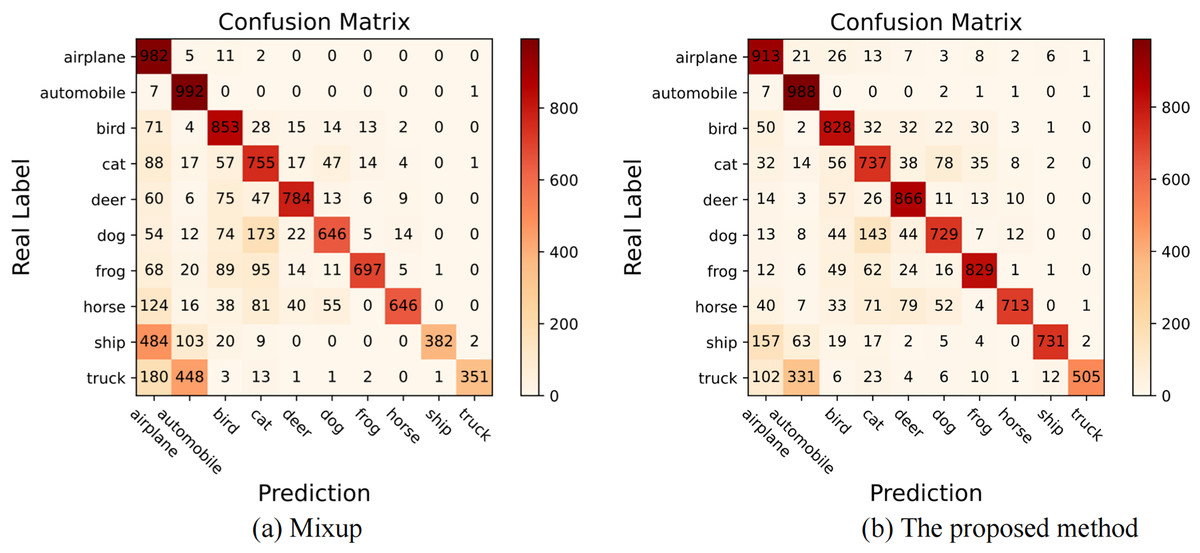
Figure 3: The visualization of confusion matrices on long-tailed CIFAR-10 with the imbalance ratio of 100.
(A) When the Mixup operation is carried out under long-tailed distribution, the correct classification number of tail classes is low due to insufficient representation of tail classes. (B) When the proposed method is applied, the correct classification number of tail classes is significantly increased, while the number of misclassifications is obviously reduced. It denotes that our method improves the overall classification level by improving the performance of the tail classes.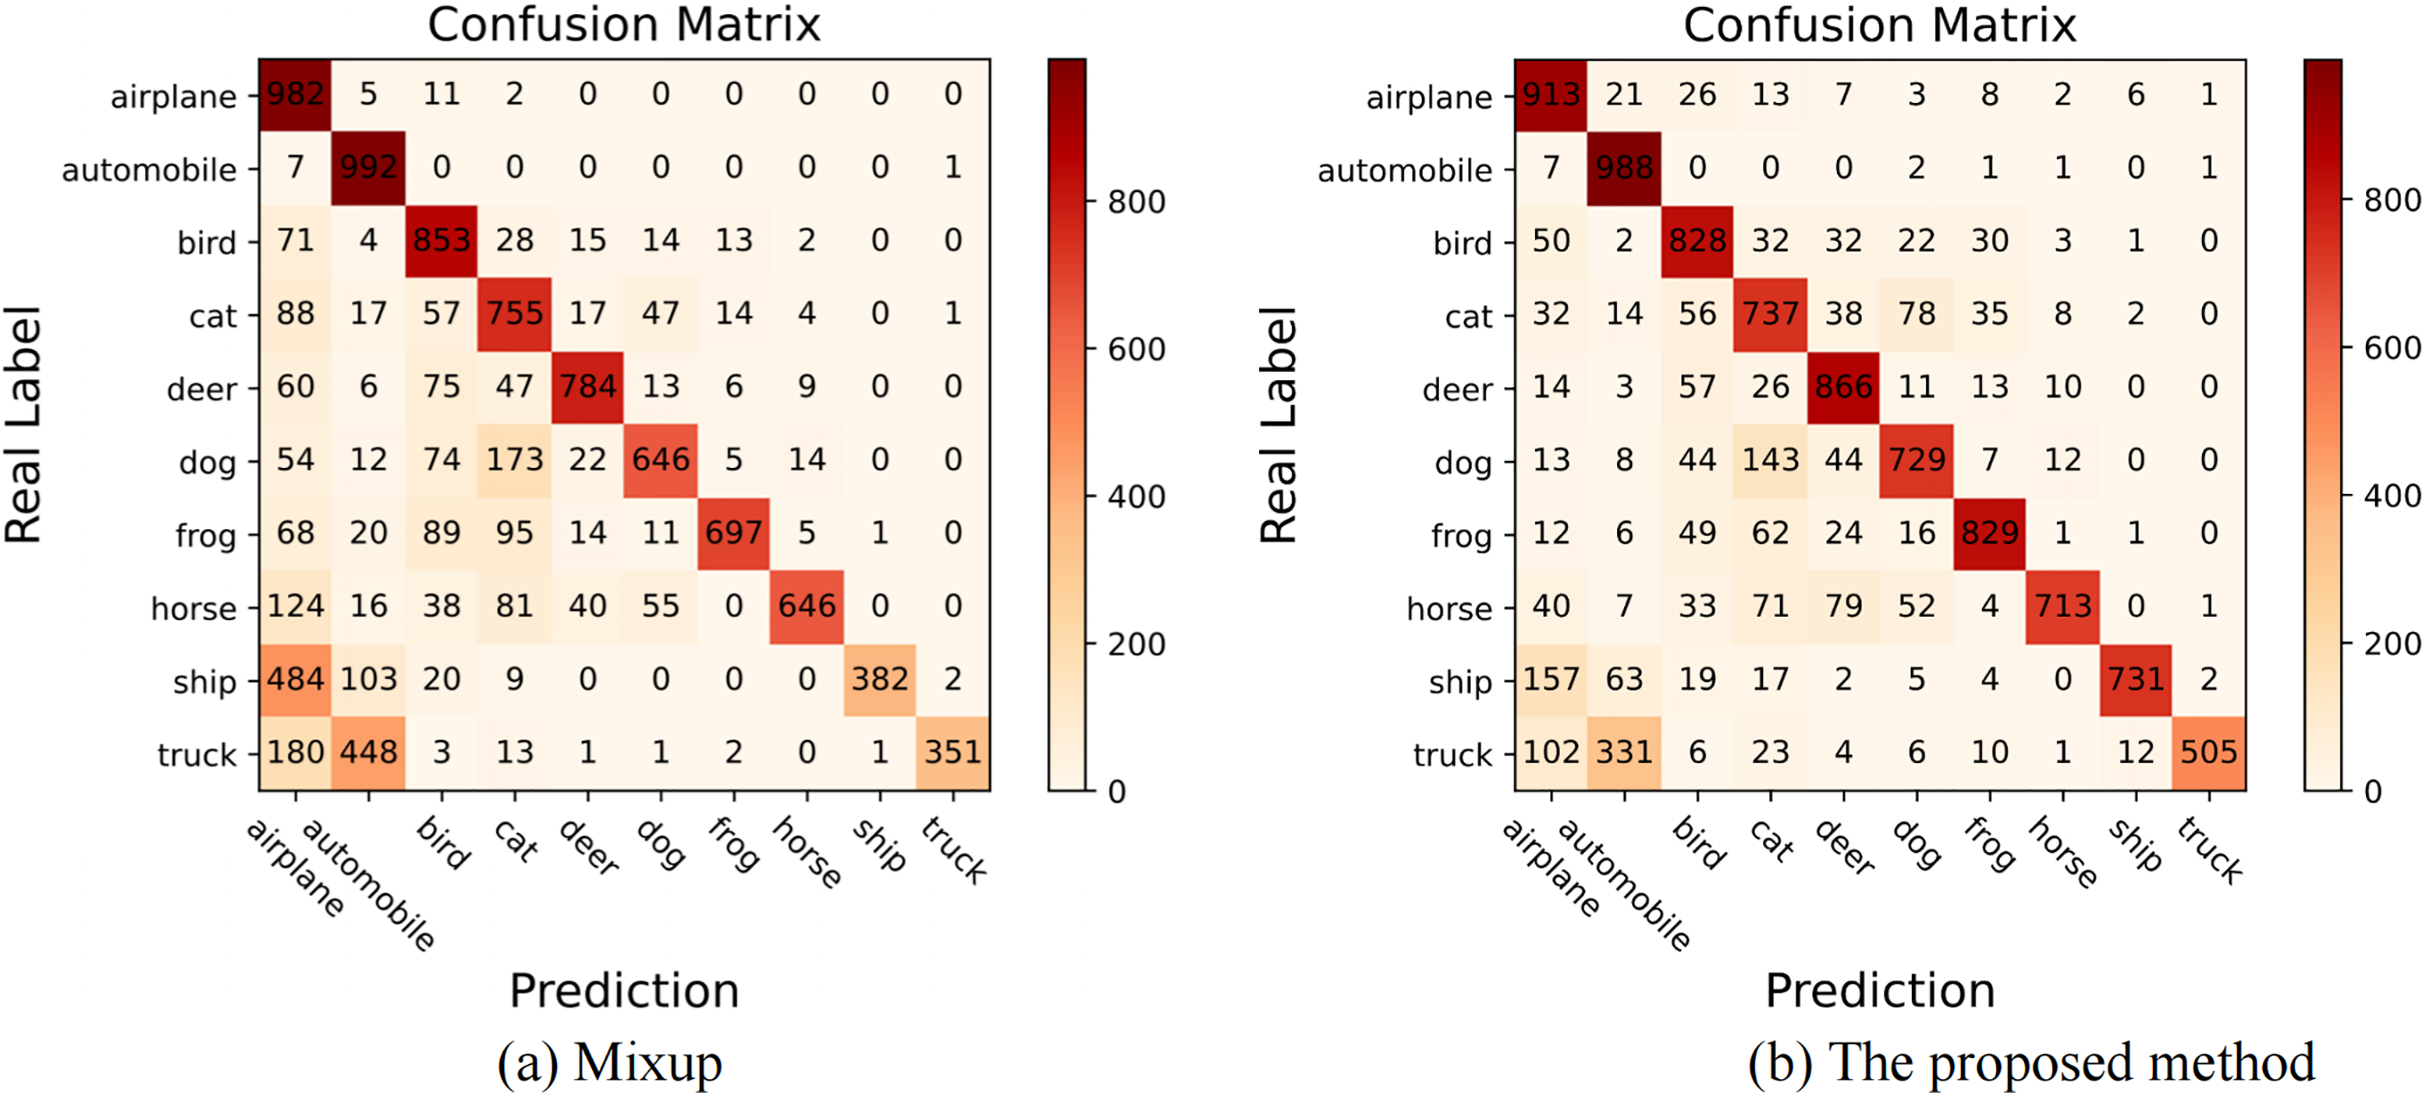
Discussions
Analysis of weighting factors
The proposed method adopts a linear decay factor to adjust the mixing weight of the two sample batches in the mixing process. To further illustrate the applicability of the adopted mixing strategy, this section conducts comparative experiments on different mixing factors. Referring to the work of Zhou et al. (2020), different weighting coefficient strategies (including parabolic decay, cubic decay, linear decay, equal weight, and beta distribution) are used in the comparative experiments. The weighting strategies are shown in Fig. 4. The comparison experiment uses the above weighting schemes in the long-tailed CIFAR-10/100 datasets, and the experimental results are shown in Table 5.
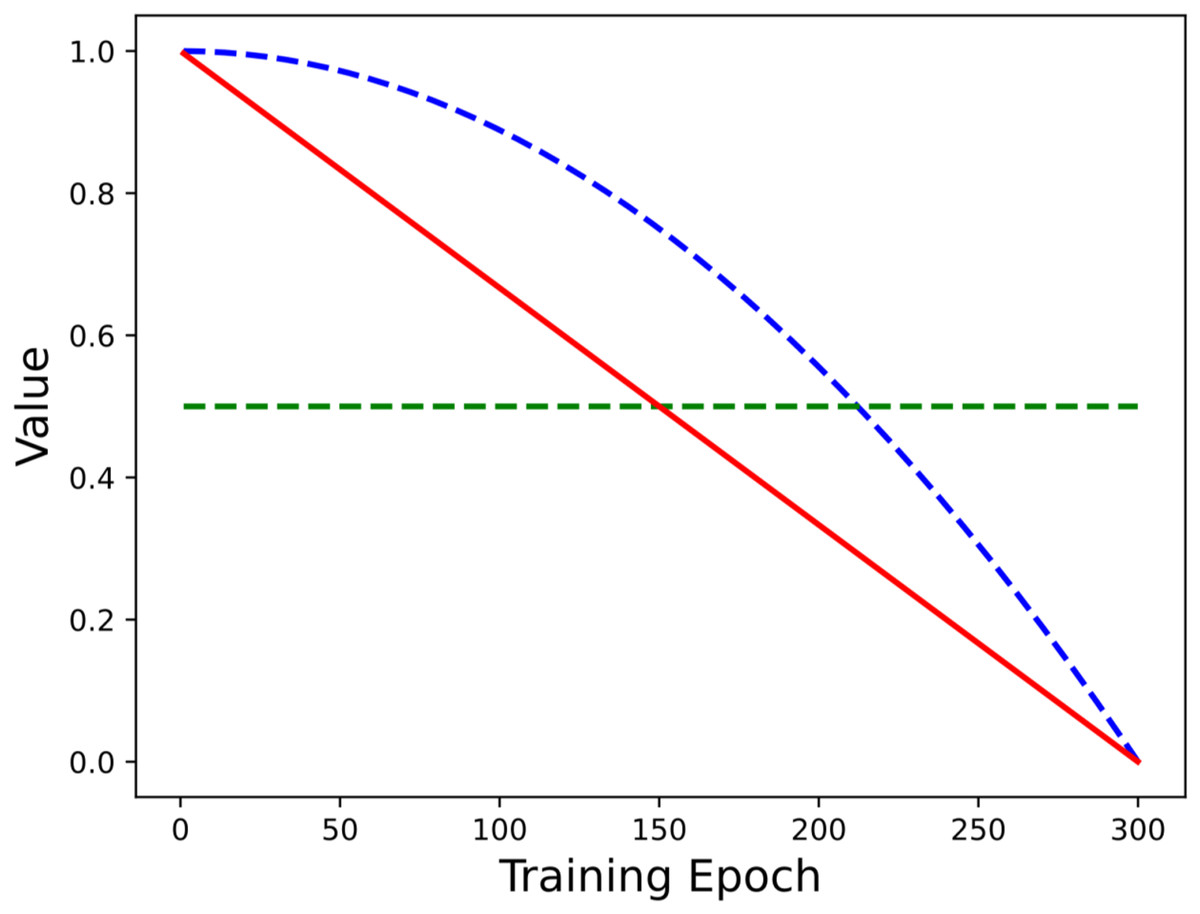
Figure 4: The coefficients of different weighting strategies change with the number of epochs.
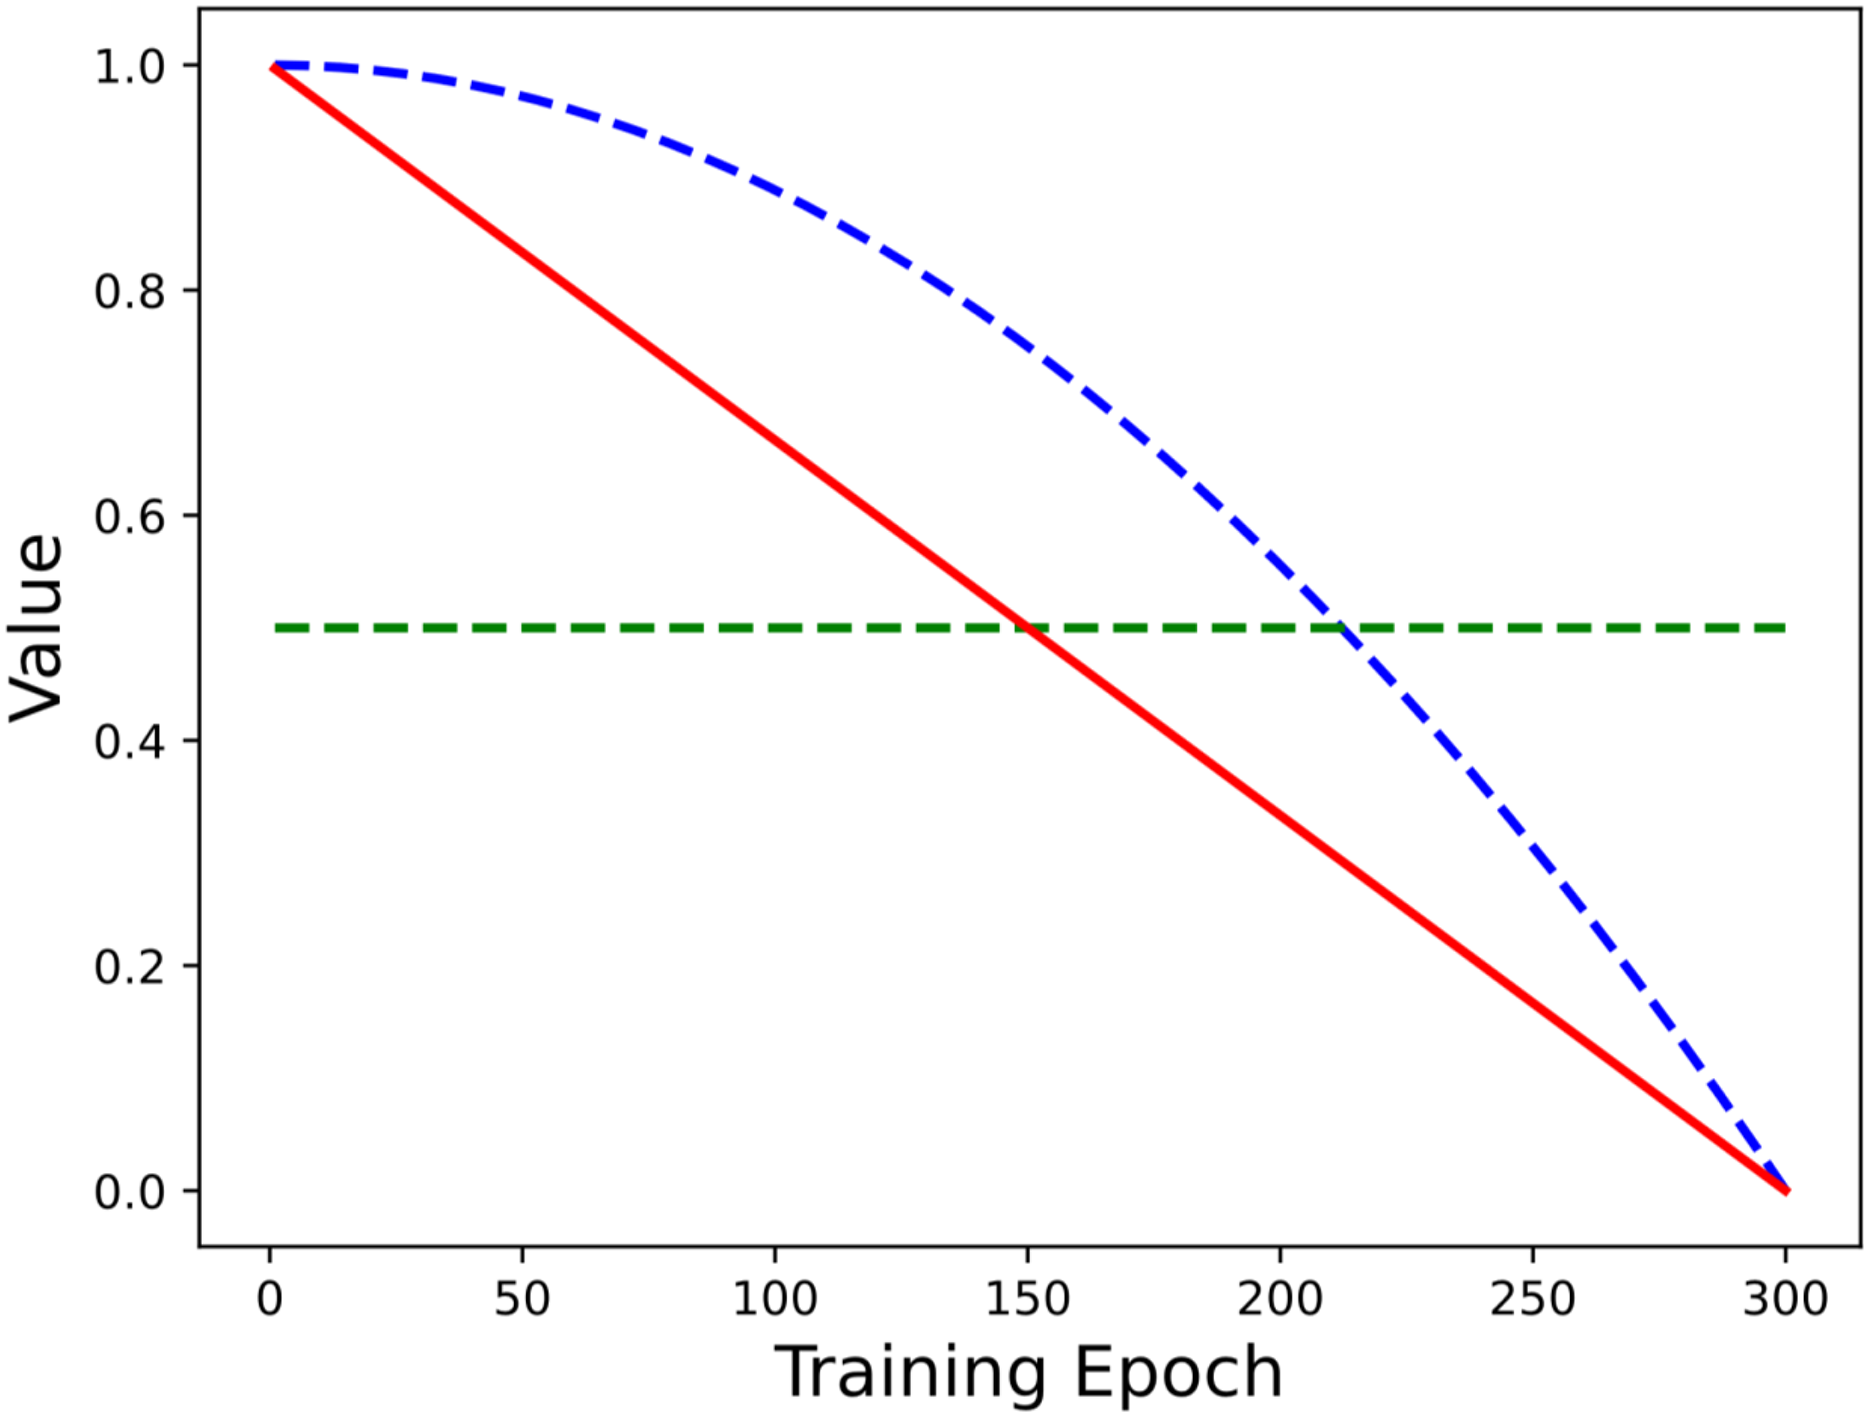
| CIFAR-10 | CIFAR-100 | |||||
|---|---|---|---|---|---|---|
| Methods | 10 | 50 | 100 | 10 | 50 | 100 |
| Equal weight ( ) | 83.34 | 75.16 | 69.83 | 51.63 | 42.77 | 38.73 |
| Parabolic decay (Zhou et al., 2020) | 87.83 | 80.40 | 74.73 | 58.77 | 45.50 | 39.95 |
| Cubic decay | 76.76 | 68.64 | 62.39 | 36.62 | 31.09 | 26.18 |
| Radom weight ( ) | 88.96 | 80.82 | 76.68 | 59.88 | 47.09 | 41.30 |
| Ours | 88.83 | 83.33 | 78.80 | 60.52 | 50.04 | 43.90 |
As can be seen from Table 5, the model of linear decay strategy has the highest classification accuracy under different imbalance ratios, while that of equal weight has the lowest accuracy. Compared with the equal weight method, the top-1 accuracy of long-tailed CIFAR-10 and long-tailed CIFAR-100 datasets with is improved by +8.97% and +5.17%, respectively. This shows that the proposed linear decay strategy has a better fit with the double sampler, and the representation learning and classifier learning are established by dynamically adjusting the label distribution of the mixed samples during the training process, so the model achieves the expected performance of classification. However, the equal weight factor loses the ability to adjust the mixing weight to some extent, and cannot be effectively combined with the double sampler. It can even damage the performance of the model, and the final performance is lower than the benchmark level.
According to the motivation in “Proposed decay mixing strategy” section, the purpose of decay mixing strategy is to help model learn the basic fundamental representations in the initial training phase while preventing overfitting. Then we gradually transition to classifier learning to strengthen the model’s focus on tail classes. To validate our motivation, we show the accuracy of the model in different training epochs under different weighting factors. In Fig. 5, the experimental results of long-tailed CIFAR-10 and long-tailed CIFAR-100 with are shown from left to right.
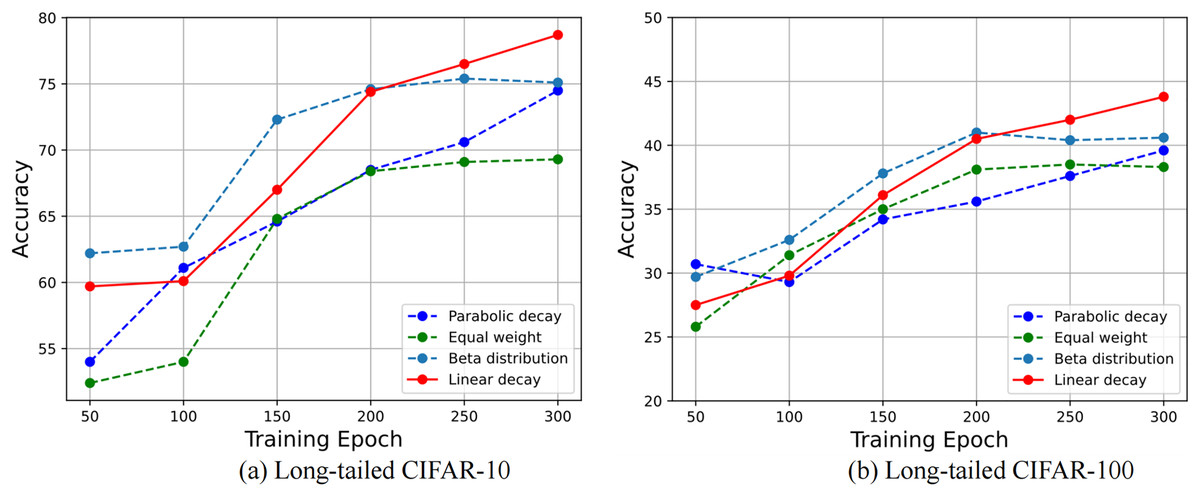
Figure 5: The graph of accuracy variation under different weight coefficient strategies.
The experimental datasets based on (A) long-tailed CIFAR-10 and (B) long-tailed CIFAR-100 with the imbalance ratio of 100.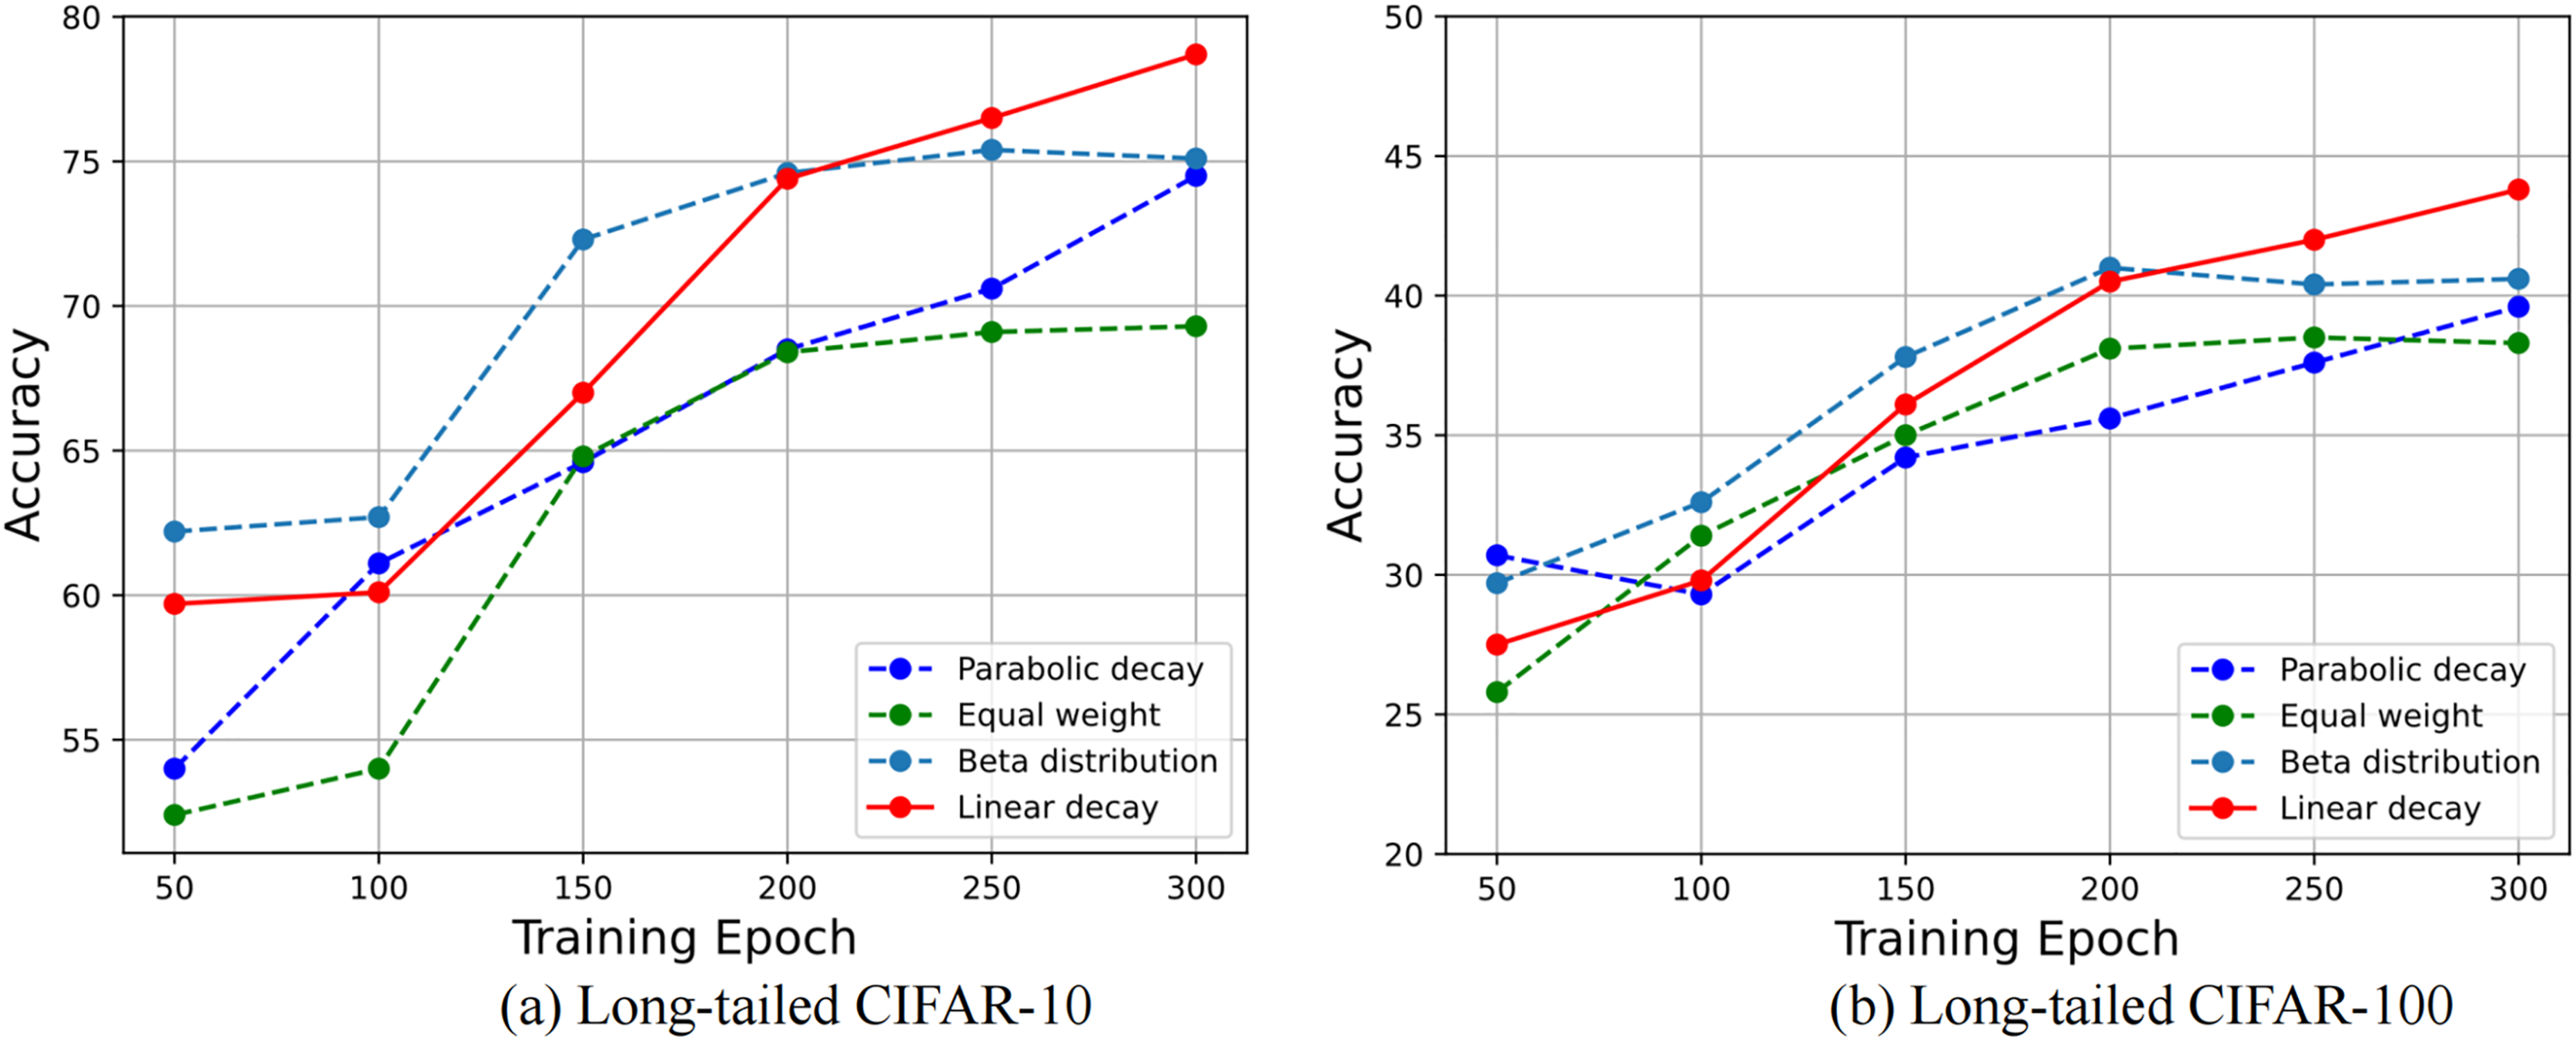
As can be seen from Fig. 5, the random weights follow the practice of Kabra et al. (2020) and sample from , and it obtain a relatively good classification accuracy. The proposed linear decay trend is in good agreement with the expected training process. In the early stage of training, the imbalanced batch occupies a large mixing weight to establish the basic representation ability of the model. At this time, the classification accuracy of the model does not improve obviously. With the increase of the training epochs, the branch of the class-balanced sampling dominates the mixing process, and the training attention of the model turns to tail classes.
In the process of gradual convergence, the classification accuracy is significantly increased, and the final classification accuracy exceeds the random weight. However, the parabolic decay strategy does not quickly transition to the rebalancing learning in the late training epochs, and the performance is lower than ours. It can be seen that a reasonable weight decay strategy is important for the mixing of double sampler samples, and an inappropriate mixing strategy will even injure the learning effect of the model.
Ablation studies
To prove the rationality of instance-based sampling combined with class-balanced sampling, this section firstly sets different control groups for the selection of sampler, namely ours (instance-based sampling) and ours (class-based sampling), which means sampling only with instance-based sampling or class-based sampling, respectively. As a Mixup-based approach, we still use the regular Mixup as one of the comparison groups. In addition, in order to eliminate the influence of decay strategies on experimental results, a new control group Label-Occurrence Balanced Mixup is set up in this section, which is the state of the art for long-tailed problem based on Mixup. It adopts two class-balanced sampling to obtain two balanced sample batches, and the is used to generate the mixing factors. The above comparative experiments are trained on the long-tailed CIFAR-10/100, and the relevant results are shown in Table 6.
| CIFAR-10 | CIFAR-100 | |||||
|---|---|---|---|---|---|---|
| Methods | 10 | 50 | 100 | 10 | 50 | 100 |
| Mixup (Zhang et al., 2017) | 88.01 | 78.75 | 73.05 | 58.21 | 44.60 | 40.04 |
| Ours (instance-based sampling) | 86.99 | 78.17 | 73.06 | 56.08 | 43.12 | 38.63 |
| Ours (class-based sampling) | 88.65 | 81.94 | 77.15 | 58.84 | 46.26 | 39.92 |
| Label-Occurrence Mixup (Zhang et al., 2022a) | 88.82 | 81.25 | 75.97 | 59.51 | 47.16 | 40.66 |
| Ours | 88.83 | 83.33 | 78.80 | 60.52 | 50.04 | 43.90 |
As can be seen from Table 6, the performance of the classifier obtained by using only instance-based sampling or only class-based sampling is inferior to that of the double sampler method, which indicates that the single sampling property cannot fit well with the decay mixing strategy. When the two sample batches have similar class distributions, the decay mixing factor cannot adjust the label distribution to guide model training. Moreover, compared with the Label-Occurrence Balanced Mixup, the proposed method still obtains a superior effect, which certifies that the double sampler method with different sampling properties can receive better performance.
Analysis of sampler order
The proposed method has regulations on the order of the two data batches (i.e., balanced sample batch and imbalanced sample batch). In the early stage of training, imbalanced sample batches from instance-based sampling occupy a higher mixing proportion to ensure the model’s representation learning. With the increase of training epochs, the mixing factor decreases linearly, and the mixing weights are dominated by the balanced sample batches. In the later stage of training, the model gradually switches to classifier learning for tail classes. Regarding representation learning and classifier learning, Zhou et al. (2020) have made a detailed explanation. To further illustrate the effect of the sampler order, we reverse the original sampler order (i.e., reversed sampler), that is, the balanced sample batches have a higher mixing weight in the early stage of training, and the imbalanced sample batch dominates the mixing weight in the late stage of training. Experimental comparison results are shown in Table 7.
| CIFAR-10 | CIFAR-100 | |||||
|---|---|---|---|---|---|---|
| Methods | 10 | 50 | 100 | 10 | 50 | 100 |
| Ours (reversed sampler) | 86.33 | 75.36 | 72.26 | 57.18 | 42.04 | 37.82 |
| Ours | 88.83 | 83.33 | 78.80 | 60.52 | 50.04 | 43.90 |
As can be seen in Table 7, our method performs much better than the reverse sampler. This just confirms the mainstream view that premature application of rebalancing techniques can impair representation learning and thus reduce classification performance. In comparison, our method successfully applies the idea of decoupling learning to Mixup data augmentation and achieves good performance.
Comparison with bilateral-branch network
The proposed mixing decay strategy is motivated from the bilateral-branch network (BBN), but there are clear distinctions between the two approaches. The practice of BBN is to construct two network branches and mix the predicted scores of the network branches, while the proposed method is the mixing of the input data. As a Mixup-based data augmentation, the proposed method gets rid of the inherent network architecture of BBN, and the weights of the labels are adjusted by the linear attenuation coefficient to guide the model training. To verify the advance of the proposed method, this section compares the classification performance of the proposed method with that of BBN in long-tailed CIFAR10/100, and the experimental results are shown in Table 8. Furthermore, Dual-branch Network with Bilateral Mixup (DBN-Mix) (Baik, Yoon & Choi, 2024) is a method that integrates the dual-branch network with Mixup. To further validate the superiority of our approach, we incorporate it with BBN and conduct a comparative analysis against DBN-Mix.
| CIFAR-10 | CIFAR-100 | |||||
|---|---|---|---|---|---|---|
| Methods | 10 | 50 | 100 | 10 | 50 | 100 |
| BBN† (Zhou et al., 2020) | 88.32 | 82.18 | 59.12 | 47.02 | 42.56 | |
| Ours | 78.80 | |||||
| DBN-Mix† (Baik, Yoon & Choi, 2024) | 90.87 | 86.82 | 62.37 | 50.39 | 45.07 | |
| Ours + BBN | 92.55 | 84.23 | 83.98 | 62.45 | 50.52 | |
It can be seen from the experimental results in Table 8, the accuracy of our method is higher than that of the classical BBN under the long-tailed CIFAR-10 and long-tailed CIFAR-100. Although BBN has a significant improvement, this comes at the expense of additional model parameters, because the two-branch network means the doubling of model parameters, which requires more training time, resulting in low training efficiency. The proposed method effectively avoids this problem, because it does not involve the modification of the overall model architecture, and it guides the training by adjusting the label proportion of the mixed samples. Compared with the BBN, our method improves the classification performance without increasing the extra model parameters. Meanwhile, in comparison to DBN-Mix, our BBN-integrated approach still demonstrates superior performance by enabling more effective model training adjustments.
Comparison of methods using F1-score
Due to the extreme class imbalance in long-tailed classification tasks, accuracy is often insufficient to fully capture a model’s effectiveness. Therefore, we adopt the F1-score, which combines both precision and recall to provide a more comprehensive evaluation of classification performance. As shown in Table 9, our proposed method consistently outperforms the listed Mixup-based approaches across all evaluated imbalance ratios ( = 10, 50, 100) on both long-tailed CIFAR-10 and long-tailed CIFAR-100 datasets. In particular, on long-tailed CIFAR-100 with = 10, our approach achieves an F1-score of 64.38%, outperforming Balanced-Mixup by 5.04%. These gains confirm our method’s novel fusion of oversampling and progressive decay mixing, critically advancing tail-class representation learning.
| CIFAR-10 | CIFAR-100 | |||||
|---|---|---|---|---|---|---|
| Methods | 10 | 50 | 100 | 10 | 50 | 100 |
| CE | 84.07 | 68.14 | 59.33 | 52.61 | 31.74 | 27.15 |
| Focal (Lin et al., 2017) | 83.46 | 67.84 | 59.41 | 51.18 | 32.68 | 27.75 |
| DRW (Cao et al., 2019) | 85.42 | 69.24 | 58.24 | 51.61 | 31.54 | 29.15 |
| DRS (Cao et al., 2019) | 86.91 | 64.85 | 59.33 | 54.61 | 40.25 | 31.87 |
| LDAM-DRW (Cao et al., 2019) | 87.43 | 68.82 | 68.70 | 54.33 | 40.69 | 33.05 |
| CUDA (Ahn, Ko & Yun, 2023) | 88.96 | 79.62 | 75.48 | 58.36 | 41.67 | 36.21 |
| Mixup (Zhang et al., 2017) | 84.67 | 71.18 | 62.41 | 46.08 | 37.15 | 26.76 |
| Remix (Chou et al., 2020) | 85.05 | 67.64 | 61.94 | 47.36 | 37.31 | 26.46 |
| Balanced-Mixup ( ) (Galdran et al., 2021) | 90.24 | 80.68 | 73.75 | 58.69 | 41.58 | 36.43 |
| Balanced-Mixup ( ) (Galdran et al., 2021) | 90.67 | 80.77 | 75.14 | 59.34 | 42.74 | 31.80 |
| Label-Occurrence Mixup (Zhang et al., 2022a) | 89.48 | 81.02 | 76.42 | 59.71 | 40.01 | 34.55 |
| Ours | 91.18 | 82.46 | 76.59 | 64.38 | 43.61 | 38.31 |
Conclusion
This work proposes a Mixup-based data augmentation technique called progressive decay Mixup for long-tailed image classification. The method integrates Mixup augmentation with re-sampling to provide a balanced sample distribution for mixing. In addition, we design a decay mixing strategy to dynamically adjust the mixing weights during the training process. Through the above practices, we provide a more complete form of the Mixup augmentation for long-tailed distribution. Experiments illustrate that our method has achieved good results on long-tailed CIFAR-10/100, long-tailed CINIC-10, long-tailed Fashion-Mnist, long-tailed Tiny-ImageNet and ImageNet-LT.