ENeTAMIB: an attention-inception-based model for accurate and explainable skin disease diagnosis
- Published
- Accepted
- Received
- Academic Editor
- Consolato Sergi
- Subject Areas
- Artificial Intelligence, Computer Vision, Data Mining and Machine Learning, Data Science
- Keywords
- Dermatology, Drug eruptions, Basal cell carcinoma, Deep learning, XAI, Healthcare, Attention module
- Copyright
- © 2025 Alamri et al.
- Licence
- This is an open access article distributed under the terms of the Creative Commons Attribution License, which permits unrestricted use, distribution, reproduction and adaptation in any medium and for any purpose provided that it is properly attributed. For attribution, the original author(s), title, publication source (PeerJ Computer Science) and either DOI or URL of the article must be cited.
- Cite this article
- 2025. ENeTAMIB: an attention-inception-based model for accurate and explainable skin disease diagnosis. PeerJ Computer Science 11:e3242 https://doi.org/10.7717/peerj-cs.3242
Abstract
Dermatology has evolved dramatically as a result of explainable artificial intelligence (XAI), especially in the early diagnosis and identification of skin diseases. The study and understanding of dermatology has long been crucial to the medical field because skin diseases are challenging to detect because of their intricate classifications. Although the accurate identification of skin diseases is a complex process, even for the most experienced dermatologists. Deep learning’s evolution into dermatological and diagnostic processes promises potential solutions to the limitations of conventional techniques, which often depend on clinical examinations. This research developed a novel architecture based on an attention module and inception blocks that works well for detecting 57 skin diseases. We make use of the dataset for cancer and skin diseases, although it only has 888 samples. To evaluate the proposed model, the dataset is preprocessed, normalised, and enhanced using augmentation techniques to improve the skin samples and avoid overfitting. Experimental results demonstrate that the proposed model 98.63% accurately detects skin diseases with a 0.062 validation loss, and a 0.0027 standard deviation. The proposed model also achieved 98.61%, 98.91%, and 98.69% macro precision, recall, and F1-score. The proposed model is compared with the most recent state-of-the-art studies in the literature, primarily from the last 2 years, 2023 and 2024. In addition, five-fold cross-validation and statistical analysis (paired t-tests) demonstrate consistent performance and statistically significant improvements. Exploring the use of the proposed XAI models in a smart healthcare environment will consider gradient weighted class activation mapping (Grad-CAM), outperforming local interpretable model agnostic explanations (LIME) for trustworthiness and cohesion. The research we conducted ensures dependability and objectivity in AI-driven decisions in a trustworthy healthcare system. Grad-CAM highlighted the important regions of the skin to improve knowledge of the predictions. The saliency maps might show the forecasts for the artificial intelligence model as a heatmap.
Introduction
Dermatology encompasses a wide range of diseases affecting the skin, the largest organ of the body. Researchers often classify these ailments as either cancerous or non-cancerous. Uncontrolled skin cell growth contributes to skin cancer (Heibel, Hooey & Cockerell, 2020). Ultraviolet radiation exposure is the main cause, as it damages DNA and disrupts cellular function. Environmental factors such as pollution, hazardous chemicals, immune system disorders, and genetic predisposition are additional concerns. Melanoma, basal cell carcinoma, and squamous cell carcinoma are the three primary forms of skin cancer (Miligi, 2020). Although melanoma originates in mature cells that proliferate slowly and remain unchanged, it begins in precancerous cells and has the potential to disseminate rapidly. The incidence of skin disease is increasing worldwide as a result of lifestyle decisions, ozone contamination, and insufficient exposure to sunlight. These diseases pose significant challenges, including high medical costs and difficulties in identification and treatment, highlighting the need for improved diagnostic and preventive strategies (Zaidi, Fisher & Rizos, 2020). Although non-cancerous skin problems are rarely life-threatening, they may considerably diminish an individual’s quality of life. Typical instances include chronic inflammatory conditions such as arthritis and psoriasis. Atopic dermatitis, often known as eczema, is marked by inflammation and irritation of the skin and is frequently linked to allergies, hereditary factors, or dysbiosis of the skin microbiota. Despite the invisibility of these lesions, timely intervention is essential, as neglect may lead to blindness, scarring, and further complications (Mohapatra et al., 2020). Because malignant and benign skin lesions have very different causes, symptoms, and treatments, it is important to be able to tell them apart for accurate diagnosis and treatment. Melanoma and other skin cancers need prompt and aggressive intervention, including surgery, radiation, or targeted therapy. Timely diagnosis is essential and often relies on methods such as biopsy and physical examination (Ahmed, Qadir & Ghafoor, 2020; Razmjooy et al., 2020).
Skin conditions rank as the fourth most prevalent cause of nonfatal skin problems. They are a significant public health concern in both developed and under-developed countries. There are many things that can make these disorders more likely to happen, such as family history, environmental factors, exposure to ultraviolet radiation, tanning habits, and alcohol use. Melanoma is a kind of cancer that mostly affects individuals of Caucasian descent (Tizek et al., 2019; Fletcher et al., 2020). In women, it mostly impacts the lower extremities, but in males, it primarily affects the thoracic region. However, it may also occur in other regions of the body. Despite the higher survival percentage of early-detected invasive skin cancer, it remains a significant societal issue. Melanoma may sometimes metastasise to distant regions of the body via the lymphatic or circulatory systems. This form of skin cancer is the most prone to metastasising to other regions of the body (Wells et al., 2018). To prevent fatalities, using computer-assisted techniques to precisely classify skin blemishes into distinct groups is beneficial. Diagnosing skin cancer is challenging, and physicians may use many methodologies. A proficient dermatologist initiates a series of examinations to establish a diagnosis (Goyal et al., 2020).
Recent years have seen much study in this domain using deep learning feature extractors and machine learning methodologies (Chan et al., 2020). There are still many problems in this area, such as the fact that different skin lesions have similar colours and shapes; it is hard to tell the difference between unhealthy and healthy lesions. Considering these issues, skin cancer detection and multiclass classification may achieve greater accuracy. This article presents a novel, automated technique that uses images captured with a dermatoscope to categorise dermatological conditions into several classifications. The attention module, the inception block, and EfficientNet methods form the foundation of the new approach. It is quite effective in detecting skin cancer.
Objectives
This research rapidly detects skin cancer using images captured with a dermatoscope. Early detection of skin cancer by physicians enhances the likelihood of timely intervention and halting disease progression. It also evaluates the efficacy of proposed model in comparison to the most advanced medical deep learning models. This research classifies various forms of skin cancer using dermoscopic images.
To develop and implement baseline model using two inception and inception modules for multi-class skin disease classification based on dermoscopic images. To enhance model performance by integrating architectural components, and transfer learning for better feature extraction and class discrimination.
To address the limited and imbalance dataset problems, we use augmentation and synthetic minority overampling technique.
To rigorously evaluate the model using k-fold cross-validation, performance metrics (accuracy, precision, recall, F1-score), and statistical significance testing (paired t-tests) to ensure robustness and meaningful improvement over baseline models.
To improve model transparency and clinical trust by applying explainable artificial intelligence (XAI) techniques such as gradient weighted class activation mapping (Grad-CAM) and local interpretable model agnostic explanations (LIME), and by testing the model on an external dataset (HAM10000) to assess generalizability.
Contributions
The study has following main contributions:
This research developed a novel architecture based on an attention module and inception blocks that works well for detecting 57 skin diseases. The main structure of the model is EfficientNet-B2, and it has an inception module, an attention module, global average pooling, and fully connected layers, which improved feature identification and led to better accuracy in classification compared to basic models like Visual Geometry Group-16 (VGG16) and Residual Neural Network 50 (ResNet50).
For evaluating the proposed model, the augmentation approaches improved the skin samples and prevented overfitting. After augmentation, the performance improved by a large margin. The balanced data provides CI [0.9822–0.9905] and 0.1041 validation loss.
XAI techniques such as Grad-CAM, saliency maps, and LIME provide the model’s decision-making capabilities. The regions of the image that are crucial to the model’s evaluation are highlighted in a heat map produced by GRAD-CAM, which shows their ability to generalise and provide visual justification for predictions. Saliency maps provide more accurate possibilities and are more complicated, which may significantly affect the design.
The proposed model is compared with the most recent state-of-the-art studies in the literature, primarily from the last 2 years, 2023 and 2024. In addition, five-fold cross-validation and statistical analysis (paired t-tests) demonstrate consistent performance and statistically significant improvements.
The remainder of the article is structured as follows: The literature review is covered in ‘Literature Review’, the proposed methodology is demonstrated in ‘Materials and Methods’, the experimental results are explained in ‘Results and Discussion’, and the conclusion is presented in ‘Conclusion and Future Directions’.
Literature review
The study examined many deep learning techniques for differentiating among diverse skin conditions. One technique included extracting features from several skin cancer photos and then inputting that data into machine learning models. Biological fields extensively used machine learning techniques for problem identification and data classification. Researchers invested significant effort in developing computer-aided design (CAD) tools to enhance the efficiency of skin disorder detection. According to CNN, the method had a success percentage of 96.7% (Vellela et al., 2023). Swetha, Shrivastava & Parvathi (2024) presented an image-based automated method for classifying skin lesions into many categories and assessed the efficacy of different models. The authors have devised a technique using transfer learning in deep convolutional neural networks to classify skin lesions into several categories. This study evaluated the skin cancer classification efficacy of ResNet50, ResNet101, ResNet152, Xception, and MobileNet using their respective pre-trained models. This study used the HAM10000 dataset, which catalogues seven different types of skin tumors using 10,015 microscopic images. The accuracy rates were 83.69% for the group, 91.48% for Top2, and 96.19% for Top3. Arshed et al. (2023) sought to evaluate the precision of skin cancer classification using the Vision Transformer (ViT) with pre-trained convolutional neural network (CNN) models. Utilising approaches like fine-tuning, data enhancement, and transfer learning yielded exceptional outcomes. The CNN-based transfer learning models attained an accuracy of 92.14 percent, a precision of 92.61 percent, a recall of 92.14 percent, and an F1-score of 92.17 percent; however, the ViT model surpassed all of these metrics.
The major purpose of the improved fusion block (IFB) function was to increase the performance of the integrated network. In the development and testing of the model, the authors used both publicly available datasets and custom dataset (Skin Disease). The experimental findings indicate that the best settings for ResNet101V2 are HAM10000, achieving a success rate of 86% for ISB, 90% for IFB, and 92% for fully fused network (FNN) (Gairola et al., 2024). To enhance the classification accuracy of the imbalanced skin lesion dataset, the authors devised a two-stage generative adversarial network (GAN)-based data augmentation technique. The suggested method separates the acquisition of general knowledge from that of specific courses to avoid mode collapse in minority classes. Alongside using Freeze-D for stabilisation during class instruction, they used self-supervised learning to optimise the utility of each sample. The spatial-temporal graph autoregression network (STGAN)-based system excels in classification, with a sensitivity of 88.85%, an accuracy of 90.23%, an F1-score of 89.48%, and a specificity of 98.34% (Su et al., 2024). The objective is to categorise diverse skin defects with a Swin Transformer model and convolutional neural networks. This paradigm is data-agnostic since it depends on end-to-end linking. Furthermore, it tackles the problem of class imbalances by using a weighted cross-entropy loss. The suggested method of categorising skin flaws using multiclass data also examines essential factors to provide an effective and pragmatic learning process (Ayas, 2023).
Jiang et al. (2024) employed a pixel-level mosaic imaging spectrometer to acquire multispectral images of tumors prior to standardising and calibrating reflectance. Subsequent to the manual identification of regions, the following stage included exporting the spectral data for further study. A success rate of 91.82% on the test set demonstrates the efficacy of the new strategy. This study identified a new approach for categorising skin tumors. It used interpretable artificial intelligence (AI) and deep learning. The fundamental purpose of data reinforcement was to enhance the learning capacity of deep learning models like ShuffleNet and Xception. Integrating attributes from the average pooling layer of each model enhanced their accuracy. The fusion procedure, although more time-consuming, enhanced accuracy as well. Since then, the optimal butterfly optimization algorithm (BOA) approach has developed into a feature selection algorithm. The analyses using two publicly available datasets, HAM10000 and ISIC2018, attained accuracies of 99.3% and 91.5%, respectively (Ahmad et al., 2023). To ascertain the most efficient technique for diagnosing skin diseases, we used the SqueezeNet model. The last task was to segment the dermoscopy images with the DenseUnet model (Radhika & Chandana, 2023).
Ahmed, Mou & Hossain (2024) introduced an innovative method for skin cancer classification by integrating four distinct types of finely tuned layers with the Xception deep learning model. They used the publicly available ISIC-2018 skin cancer dataset to train the proposed classifier. After data augmentation, the collection comprises 21,000 photos, categorised into seven groups with 3,000 images per category. The suggested model attained an F1-score of 95.14% for accuracy, 95.00% for precision, 95.14% for recall, and 95.14% for seven-class categorisation. This multi-layered system allows for the classification of skin lesions in images into seven distinct types: basal cell carcinoma, actinic keratoses, dermatofibroma, benign keratosis, vascular, melanocytic nevi, and melanoma. By conducting research on the HAM10000 dataset, which comprises a variety of phrases, they evaluated the proposed CNN-based diagnostic technique. The suggested diagnostic system performs better than most existing systems based on certain measures, such as precision (84%), recall (82%), F1-score (81%), and accuracy (95%), according to the study’s findings.
The objective of this investigation was to classify two datasets, PH2 and HAM10000, of skin lesion images and to suggest hybrid techniques that are based on hybrid features for the efficient evaluation of dermoscopy images. This rectified the discrepancies in the datasets and enhanced the compatibility of the images with all algorithms. They classified the PH2 and HAM10000 datasets by employing MobileNet and ResNet101 models that had completed training. In the early phases of skin lesions detection, the hybrid approaches SVM-MobileNet, SVM-ResNet101, and SVM-MobileNet-ResNet101 outperformed pre-trained CNN models due to the effectiveness of the handcrafted features that extract the hue, texture, and shape characteristics. The subsequent step in the development of an accurate feature was to combine the features from the ResNet101 and MobileNet models with those that were manually generated. The final phase involved the training of an artificial neural network (ANN) to classify objects with exceptional precision by utilising the modified ResNet101 and MobileNet features. The accuracy, sensitivity, precision, and specificity of the HAM10000 dataset were 98.4%, 94.46%, 93.44%, and 99.43%, respectively, as a result of the integration of ANN, MobileNet, and hand-crafted features. The PH2 data set also achieved a perfect score on all metrics by employing the same methodologies (Ahmed et al., 2023).
The previously constructed and evaluated DSCC_Net model enabled the classification of skin malignancies as basal cell carcinoma (BCC), melanoma (MEL), squamous cell carcinoma (SCC), or melanocytic nevus (MN). The prevalence of these skin cancer types is on the rise and is having a global impact on populations. The sluggish and inadequate testing procedures and facilities, in conjunction with the inability to diagnose skin cancer early, have led to numerous fatalities (Tahir et al., 2023). In order to overcome these constraints, this investigation introduces a novel deep learning-based approach to the detection and planning of skin cancer management. It has achieved a score of 94.2% on ISIC-2019 and 96.4% on Kaggle, indicating that the model is highly accurate (Subhashini & Chandrasekar, 2024). Beginning with a serial-based approach to combine the most advantageous attributes results in an accuracy of 87.5%. They subsequently recommended a threshold serial fusion method, which yielded an 89% success rate. Additionally, the system’s proposed deep learning models necessitated an extended training period (Khan et al., 2024). Two and four convolution layers, in addition to a versatile attention module, comprise the proposed model. A balanced HAM10000 dataset and the test results of the proposed model were presented following the completion of the training on the original dataset. On the HAM10000 dataset, the training method achieved accuracy rates of 85.73% for training, 70.90% for validation, and 69.75% for testing (Alhudhaif et al., 2023). In terms of dermoscopy image diagnosis and skin lesion distinction from the ISIC 2019 dataset, hybrid models that were based on combined CNN features have demonstrated promising results (Alshahrani et al., 2024).
The target classes for the proposed model were the seven unique types of cutaneous lesions observed in the HAM10000 dataset. The preprocessing phase employed resampling algorithms to balance the data and eliminate artefacts (Raghavendra et al., 2023). The authors developed a system that employs digital image processing to automatically classify eight distinct skin malignancies into distinct stages. The coronavirus optimization algorithm (CVOA) model was employed to select control parameters for an enhanced Canny edge detector during the preparatory phase. The objective of this modification was to facilitate the identification of the injured region by emphasising its immediate environs and the margins of the potentially damaged zone (Purni & Vedhapriyavadhana, 2024). This research introduced a multistage and multiclass framework that was dermoscopy-based and CNN-based in order to identify skin lesions. The initial endeavour to train a CNN to distinguish between normal and malignant images commenced with the creation of a 26-layer CNN. The model achieved an impressive classification rate of 93.4%, and the training procedure lasted approximately 11 min and 41 s (Ali et al., 2023). With regard to cutaneous lesion categorisation, the authors recommend employing an efficient DCNN methodology. Houssein et al. (2024) employed two extensive datasets of dermatoscopic images: ISIC-2019 and HAM10000. The deep learning framework that underpins the proposed unified CAD model was capable of segmenting and classifying cutaneous lesions.
Mushtaq & Singh (2024) was to developed a comprehensive classification system for early-stage multi-class skin cancer carcinoma classification by utilising the Hair Removal Image Processing Technique and the Ensemble Visual Geometry Group-16 (EVGG-16), a Convolution Neural Network. The primary concept was to apply three distinct initialisations to the same VGG-16 model and subsequently combine the outcomes. The experimental results indicate that the VGG-16 model obtains an F1-score of 86%, with an average accuracy of 87%. The proposed Ensemble Visual Geometry Group-16 (EVGG-16) model achieves an average accuracy of 88% and an F1-score of 88% in the absence of the hair removal image processing method. However, the same model achieves an F1-score of 88% and an accuracy of 88% after employing the hair removal image processing procedure. The diagnostic accuracy of the proposed technique was 96.47% when assessed on 3,672 categorise photographs obtained from a variety of sources (Hameed et al., 2020). Abd El-Fattah et al. (2023) developed a novel model for skin disease photos from low-resolution images using an enhanced deep super-resolution generative adversarial network. Furthermore, Nawaz et al. (2025) conducted a systematic evaluation of five deep learning models for skin cancer inquiry and detection. A multi-model feature fusion strategy has been developed by the authors in the Efficient Global-Vision AttentionNet for the purpose of identifying multi-class skin lesions. Skin lesion classification relies on capturing both local feature patterns and long-range correlations; their method does both (Saeed et al., 2025).
The purpose of Vaghela et al. (2025) was to elucidate the predictions of the DL models, which were inherently ambiguous, utilizing XAI, which is based on LIME. Abbas et al. (2025) suggested a deep learning model that can rapidly identify chickenpox, measles, and monkeypox through the use of transfer learning. The VGG16 model has been experimentally shown to be capable of detecting and predicting skin problems based on this information. The relevance ratings of each input were determined in this investigation by employing layer-wise relevance propagation. The symptoms that have been identified offer valuable information that could facilitate the rapid identification of skin diseases and the selection of suitable treatments. Another study (Mayanja et al., 2023) has suggested that the potential to enhance dermatological diagnostic accuracy and reduce the number of errors is present in the wake of recent advancements in machine learning (ML) and XAI. In order to improve patient care and healthcare delivery, dermatologists and technology professionals are collaborating to improve the precision, efficiency, and accuracy of skin disease identification. SkinSage XAI classifies skin lesions by employing sophisticated, XAI-based methodologies. The Customized HAM10000 is the foundational data set, that have been selected for variation. The Inception v3 model employs gradient-weighted class activation mapping and local interpretable model-agnostic explanations algorithms to facilitate classification. These algorithms offer unambiguous visual representations of model results (Munjal et al., 2024).
Materials and Methods
This study specifies the proposed approach and processing phases for the classification of fifty-seven skin diseases. Figure 1 is a detailed flowchart demonstrating the methodology. This study encompasses the dataset, image preprocessing, augmentation techniques (including cropping, rotation, zooming, flipping, and contrast adjustment), and the proposed ENeTAMIB model architecture for classification challenges. The subsection represents the detailed explanations of each step of the proposed methodology.
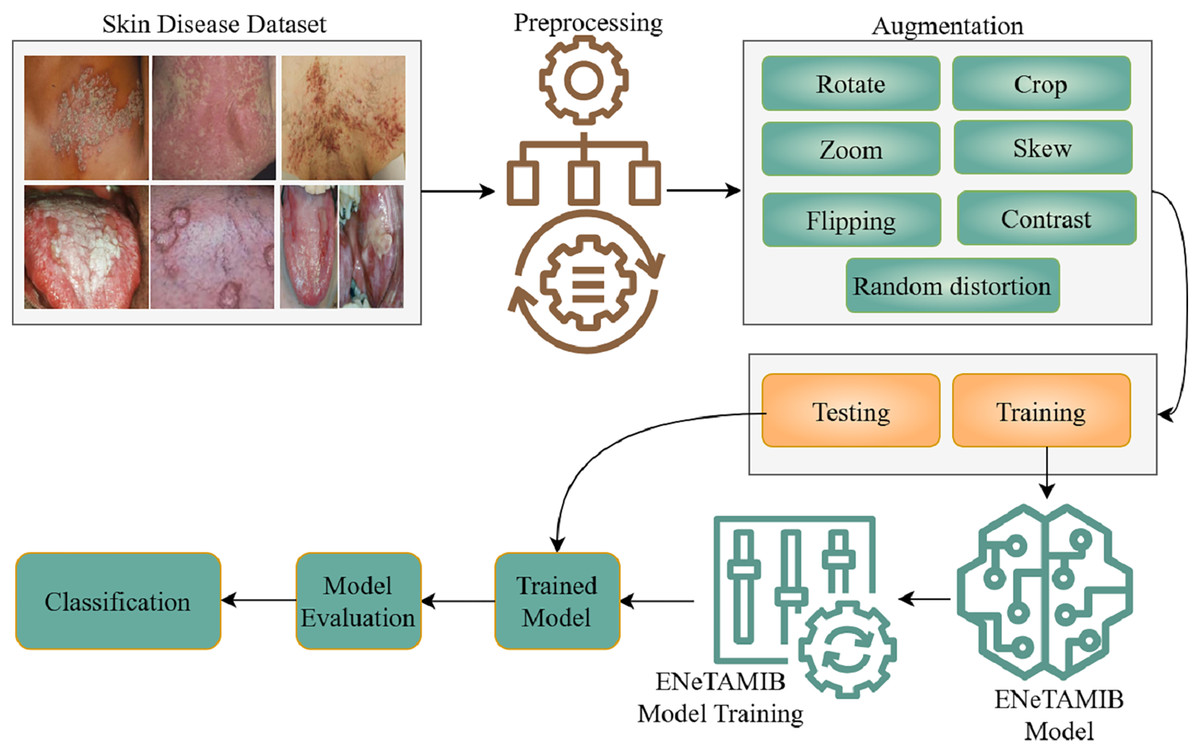
Figure 1: Detailed flowchart demonstrating the methodology for multi-class skin diseases.
Data collection for 57 skin diseases, resized it into fixed resolution, then performed some augmentation techniques to enhance the data, split the data into two subsets and design the ENeTAMIB model for the skin disease detection. The model is evaluated using different metrics.
Dataset description
This study used the Skin Diseases and Cancer dataset, freely available at Mendeley (Mafi et al., 2023). The term “skin diseases” refers to a wide range of conditions impacting the biggest organ in the body, from everyday skin disorders to more serious and even deadly diseases. Dermatological disorders, such as sun damage, inherited traits, or environmental factors, may cause the excessive growth of skin cells. Melanoma, basal cell carcinoma, and squamous cell carcinoma are major threats to world health because of their frequency and metastatic potential. But millions of people deal with harmless skin problems like acne, eczema, and psoriasis, which may harm their quality of life and, if left untreated, can cause serious complications. This collection has 978 unique images of skin diseases and cancer, including 90 from primary sources and 888 from secondary sources.
Skin image preprocessing
Image preprocessing entails converting raw image data into a format that is both comprehensible and operational. It facilitates the improvement of essential attributes vital for computer vision applications while removing undesirable distortions. The first stage of preprocessing is crucial before supplying data to deep learning models. The optimal performance of deep learning algorithms relies on the consistent scale of images (Zghal & Derbel, 2020). To modify the proportions of images, we use the resize() function in OpenCV. We use a fixed size (150 width, 150 height, and three channels) for the experiments.
Skin image augmentation
Augmentation is a collection of strategies that can increase the volume of available data in current datasets. Augmentation is a beneficial way to shrink deep learning models, which might help prevent overfitting or improve performance when the initial dataset is not enough for training. An individual’s capacity to prevent overfitting is only one of the many advantages of augmentation (Han et al., 2020). A substantial sample is essential for the effective functioning of machine learning and deep learning models. To enhance the efficacy of the model, we augment its current data set. This statement essentially suggests that modifications might enhance the model’s performance. Collecting data and categorizing it for machine learning models may be costly and labor-intensive. Medical professionals can identify cost-saving opportunities by improving information through data enrichment initiatives. Skin disease samples taken from the augmented dataset are shown in Fig. 2. The total number of samples before and after using the augmentation is presented in Table 1. The techniques are shown below:
Image flipping is the simplest kind of augmentation technique. As the name implies, it creates a new version of the image by flipping it. has a horizontal image reflection. Conversely, it flips images horizontally from right to left. It can be oriented either horizontally or vertically.
A common technique for data augmentation is image rotation. We may broaden the variety of our training data and strengthen our model by changing the viewpoints of the images.
We use image cropping to emphasize specific areas of an image. This technique is especially effective in scenarios like item identification when the objective is to have the model identify things independently of their location within the image.
The horizontal flip function can flip an image horizontally, while the vertical flip feature can flip it vertically. Most augmentations allow for the parameter p, which controls the probability of using the augmentation.
The dimensions of the image may be altered by the scaling technique. Image shear involves relocating a segment of an image while keeping the other portions intact.
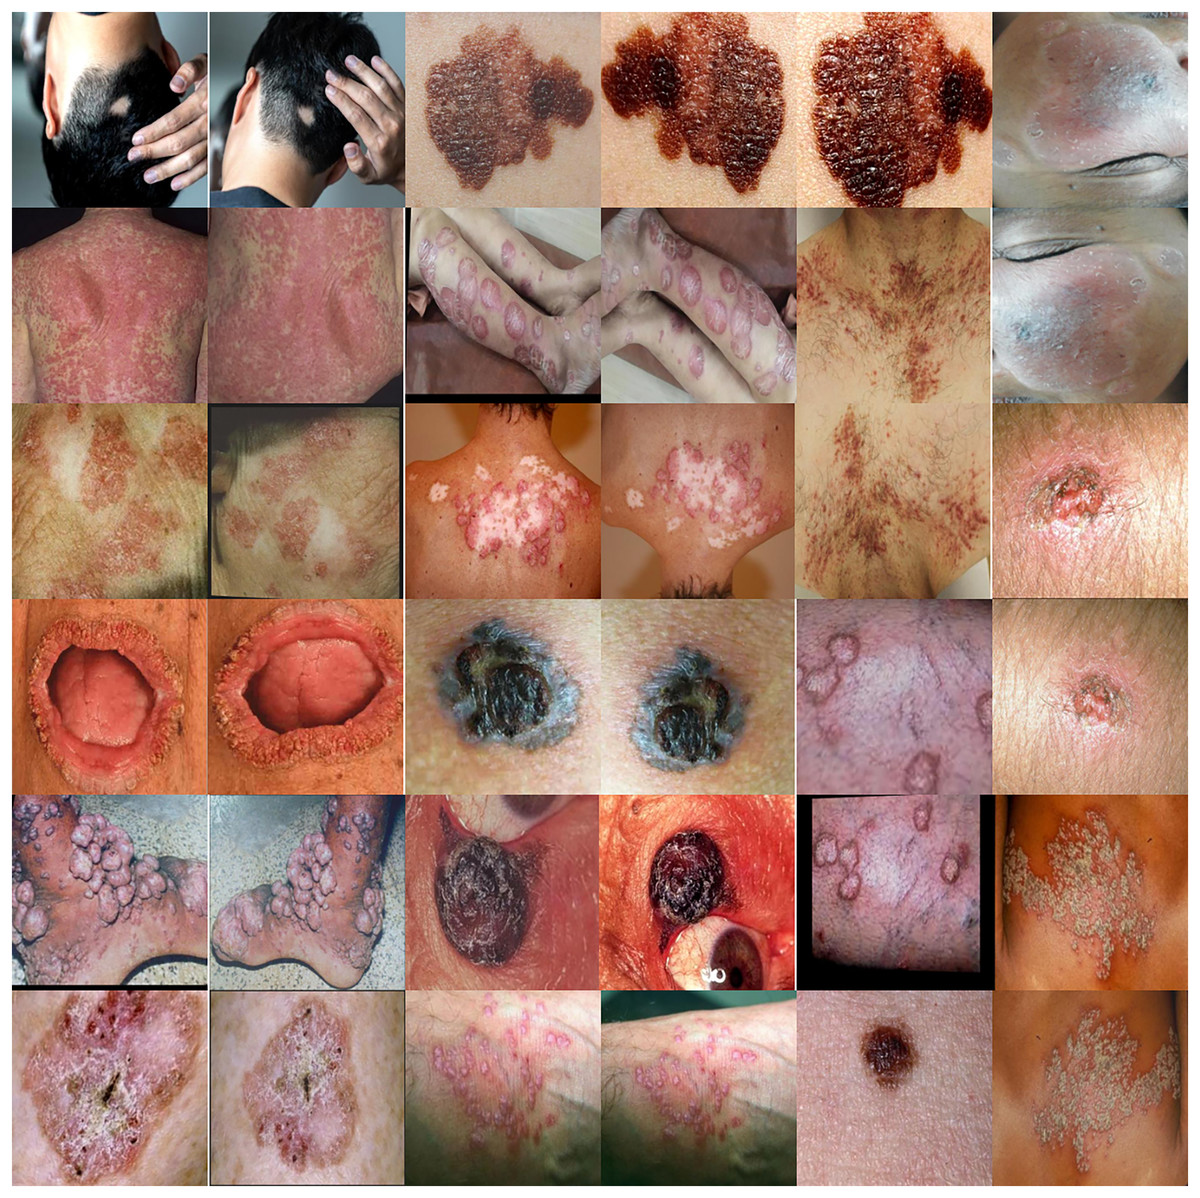
Figure 2: Skin disease samples taken from the augmented dataset shows various techniques such as rotate, flip, zoom, distortion and skew.
| Class label | Original | Augmented 5 k | Augmented 10 k | Class label | Original | Augmented 5 k | Augmented 10 k |
|---|---|---|---|---|---|---|---|
| ‘Acral lentiginous melanoma’ | 50 | 268 | 609 | ‘Systemic lupus erythematosus’ | 11 | 66 | 128 |
| ‘Alopecia areata’ | 50 | 293 | 542 | ‘Mole’ | 11 | 61 | 121 |
| ‘Alopecia totalis’ | 44 | 247 | 502 | ‘Pagets disease’ | 10 | 53 | 119 |
| ‘Basal cell carcinoma’ | 30 | 161 | 335 | ‘Squamous cell carcinoma’ | 10 | 54 | 118 |
| ‘Hemangioma’ | 27 | 148 | 328 | ‘Pityriasis rosea’ | 10 | 51 | 117 |
| ‘Fordyce spots’ | 27 | 134 | 310 | ‘Pityriasis versicolor’ | 10 | 50 | 117 |
| ‘Androgenetic alopecia’ | 25 | 142 | 309 | ‘Vitiligo’ | 10 | 51 | 116 |
| ‘Granuloma annulare’ | 29 | 183 | 307 | ‘Linear scleroderma’ | 11 | 57 | 112 |
| ‘Herpes zoster’ | 28 | 174 | 297 | ‘Keratoderma’ | 10 | 47 | 107 |
| ‘Epidermolytic Hyperkeratosis’ | 27 | 172 | 292 | ‘Nevus sebaceus’ | 10 | 44 | 107 |
| ‘Arsenicosis’ | 26 | 151 | 287 | ‘Psoriasis’ | 10 | 66 | 105 |
| ‘Drug eruptions’ | 25 | 130 | 283 | ‘Pemphigus vulgaris’ | 11 | 50 | 101 |
| ‘Dariers disease’ | 23 | 153 | 264 | ‘Chromoblastomycosis’ | 10 | 65 | 101 |
| ‘Bowens disease’ | 22 | 151 | 241 | ‘Nevus spilus’ | 9 | 52 | 93 |
| ‘Oral lichen planus’ | 20 | 109 | 233 | ‘Tinea barbae’ | 8 | 39 | 91 |
| ‘Impetigo contagiosa’ | 22 | 112 | 227 | ‘Pityriasis lichenoides chronica’ | 7 | 36 | 81 |
| ‘Malignant melanoma’ | 22 | 122 | 226 | ‘Malignant acanthosis nigricans’ | 6 | 39 | 78 |
| ‘Livedo reticularis’ | 18 | 85 | 222 | ‘Striae distensae’ | 5 | 28 | 67 |
| ‘Lichen planus’ | 19 | 112 | 213 | ‘Tinea corporis’ | 6 | 28 | 65 |
| ‘Discoid lupus erythematosus’ | 20 | 108 | 213 | ‘Pyogenic granuloma’ | 5 | 19 | 57 |
| ‘Nevus of ota’ | 16 | 91 | 197 | ‘Tinea pedis’ | 6 | 34 | 53 |
| ‘Ichthyosis’ | 15 | 74 | 181 | ‘Tuberculosis verrucosa cutis’ | 4 | 23 | 51 |
| ‘Drug reactions’ | 15 | 85 | 174 | ‘Tinea Faciei’ | 3 | 19 | 34 |
| ‘Lupus vulgaris’ | 15 | 67 | 173 | ‘Melanoacanthoma’ | 2 | 11 | 28 |
| ‘Ecthyma’ | 15 | 101 | 173 | ‘Nevus’ | 2 | 11 | 27 |
| ‘Molluscum contagiosum’ | 17 | 88 | 157 | ‘Verruca’ | 2 | 16 | 27 |
| ‘Hypertrophic lichen planus’ | 15 | 93 | 156 | ‘Granulomatous diseases’ | 2 | 13 | 26 |
| ‘Trichoepithelioma’ | 11 | 74 | 142 | ‘Solitary mastocytosis’ | 2 | 11 | 22 |
| ‘Seborrheic keratosis’ | 12 | 69 | 138 |
Skin data splitting
In data splitting, we utilized train test split and cross validation two stage approaches to ensure the model robustness and reduced the overfitting risks. Initially, the entire dataset was divided into two subsets: 70% for training and 30% for testing. This set of combined tests was used to evaluate the final model to ensure that performance metrics reflected the model’s ability to reproduce untrained data. On the dataset, we performed five-fold cross-validation during training to tune the model parameters and improve the overall performance. During the fold cross-validation, the training dataset was divided into five different subsets. Each subset serves as a validation vector, and the remaining four subsets are used for training. This process was repeated five times, and the average of the five iterations provided the most accurate and reliable estimate of model performance.
Methodology
This work used EfficientNet-B2 as the backbone architecture, using transfer learning from ImageNet weights, deactivating the top layer of EfficientNet, and selecting a fixed input skin image size for the model. Transfer learning enables the model to operate more efficiently and provide superior and more precise results. During the setup, we suspend training on some levels of the backbone model after the first training session. This facilitates the identification of distinctive patterns within the data. The proposed ENeTAMIB architecture for the classification and detection of 57 skin diseases is illustrated in Fig. 3.
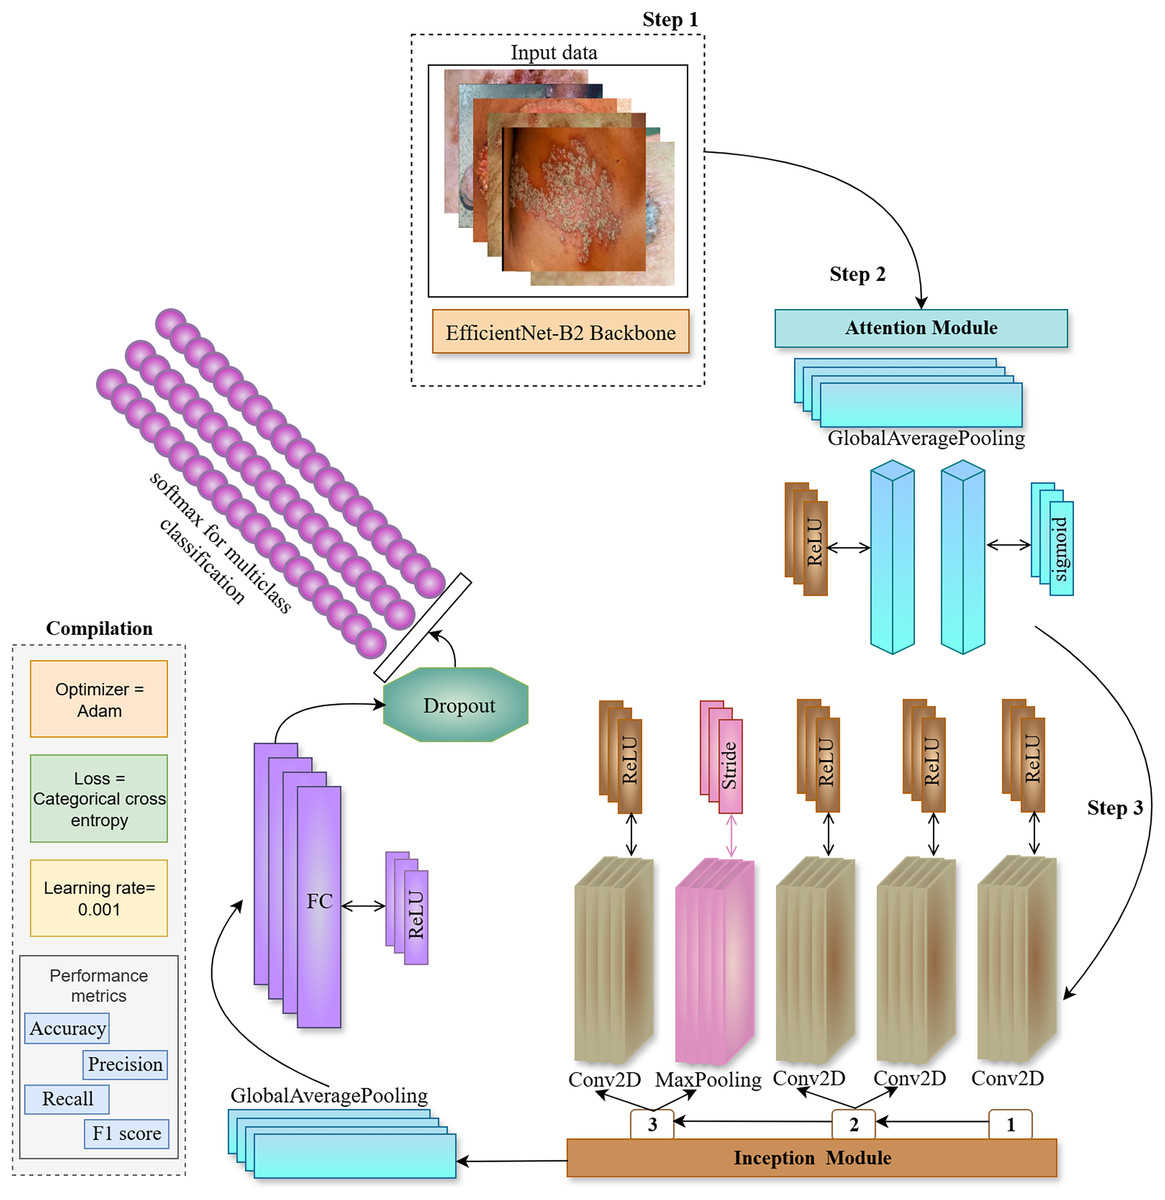
Figure 3: The proposed ENeTAMIB architecture for the classification and detection of 57 skin diseases utilises EfficientNet as a backbone, subsequently integrating an inception module, attention module, global average pooling, and fully connected layers to enhance the model’s performance.
In step 2, we construct an attention module including a global average pooling layer, a dense layer using ReLU activation, and a subsequent dense layer employing a sigmoid activation function. Subsequently, multiply them by the function variable. In the third step, we develop the Inception module function to integrate into the backbone architecture. Initially, we configure a Conv2D layer using a 1 by 1 filter with ReLU activation, followed by two further Conv2D layers, filter [1], (1,1) and filter [2], (3,3) again employing ReLU activation. Subsequently, we include a max-pooling layer with a stride of 1 by 1. The last layer in the Inception module is once again a Conv2D layer using ReLU activation. Variables 1, 2, and 3 are concatenated and returned to the function. Following the incorporation of attention and inception modules into the backbone architecture, we implement two-dimensional global average pooling inside the architecture. To enhance model efficiency, a fully linked layer and a ReLU activation layer are used with dropout. We then use the final classification layer, Softmax, for 57 skin conditions.
We employed Inception and Attention modules with the EfficientNetB2 backbone, to improve the feature representation capability of the proposed model. Inception and Attention components serve complementary roles in improving classification performance for multi-class skin diseases as represented in Algorithm 1.
| 1 Function Inception Module (x, ) |
| // Path 1: 1 × 1 Convolution |
| 2 |
| // Path 2: 1 × 1 → 3 × 3 Convolution |
| 3 |
| 4 ’) |
| // Path 3: 3 × 3 MaxPooling → 1 × 1 Conv |
| 5 ’) |
| 6 |
| // Concatenate all paths |
| 7 |
| 8 return output |
| 9 Function Attention Module (x) |
| // Global average pooling (channel-wise) |
| 10 |
| // Bottleneck dense layer |
| 11 |
| // Restore original dimensions with sigmoid |
| 12 |
| // Apply attention to input |
| 13 // Channel-wise |
| 14 return output |
The Inception module is designed to capture multi-scale spatial information by processing the same input through multiple parallel convolutional paths with different kernel sizes. In this work, three branches operate simultaneously: (1) a 1 1 convolution for dimensionality reduction, (2) a 1 1 convolution followed by a 3 3 convolution to extract mid-level spatial features, and (3) a 3 3 max pooling layer followed by a 1 1 convolution to retain contextual information while reducing spatial resolution. The outputs from all branches are concatenated along the channel dimension, allowing the network to learn features at multiple scales efficiently.
In parallel, the Attention module is introduced to help the network focus on the most informative channels. Specifically, we use a channel-wise attention mechanism inspired by the squeeze-and-excitation block. To summarize local features in channel analysis starts from the global average level. The feature passes through two fully connected layers with a threshold matrix to learn the nonlinear structure of the channel. The designed prediction weights are applied to the original feature maps by adding parameters, each weight is re-evaluated based on its learned value.
Activation functions are essential for neurones in a neural network to process inputs and produce outputs. Among the several activation functions used by contemporary deep learning models, the rectified linear unit (ReLU) is particularly notable. It excels in many neural network topologies and is user-friendly, which mostly accounts for its popularity. ReLU outputs the whole input if it is positive; else, it outputs zero. This characteristic not only preserves the non-linearity essential for comprehending intricate patterns but also mitigates issues such as the vanishing gradient problem that may occur in deeper networks. Due to its efficiency in facilitating model learning, ReLU is a favoured choice of this study.
In the proposed attention module, we use the sigmoid function. The sigmoid function was one of the earliest activation functions introduced to neural networks. The sigmoid’s smoothness and differentiability make it an excellent choice for backpropagation. Because its output may range from 0 to 1, it is quite helpful for the classification challenges. In the proposed model, the layers which are primarily used for image classification tasks such as disease diagnosis, the transition from convolutional feature extraction to final classification requires flattening or pooling of the feature maps. The global average pooling2d layer serves this purpose by computing the average value of each feature map like channel across its spatial dimensions. We did not used here traditional flattening,we used global average pooling that reduces each feature map to a single value. This approach provides better accuracy, reduces overhead, and increases the overall cost of maintaining the integrity of the training data. After the transformation, the network uses a convolutional layer of 64 neurons as the ReLU activation layer. This step accounts for the nonlinearity and allows the model to learn the baseline signals from the interacting variables. Finally, a dropout of 0.5 was used to remove half of the neurons in each training iteration. The regularization allows the network to learn a variety of features to avoid misclassification of any neural network. These features act as a transformation of the spatial distribution towards the population, resulting in a nonlinear representation and a high degree of variability in the dataset. A fundamental cost function is cross-entropy loss. It’s principal function is to facilitate the optimisation of classification models. The model includes a softmax activation function and a cross-entropy loss function. Employing this loss to train the proposed model enables the generation of a probability for each image over all 57 classes, facilitating classification into multiple categories.
Results and discussion
This section presents a comprehensive experimental examination of the various results attained by the proposed framework. The research used a multiclass dataset of 57 skin diseases and implemented several augmentation approaches to improve the dataset. The efficacy of the proposed methodology is evaluated and compared with other cutting-edge methodologies. Learning curves, Grad-CAM, and LIME are used to elucidate model decisions using explainable AI methodologies (Tjoa & Guan, 2021).
A simple but effective method of evaluating a model’s performance on two or more parameters is to use confusion matrix results (Hekler et al., 2019). In a table-like format, it displays the actual outcomes on one side and the predictions on the other. True positive (TP), true negative (TN), false positive (FP), and false negative (FN) are the four components that make up the matrix. These classifications provide a clear sense of the model’s strong and weak points. Accuracy is the the total number of (TPSD + TNSD) by the total number of (TPSD + FNSD + FPSD + TNSD) predictions. To go further, we use measurements like F1-score, precision, and recall. The number of these predictions (TPSD/(TPSD + FPSD)) is a measure of precision, which is significant in crimes where false positives are uncommon. Recall is the true positive standard deviation (TPSD) and divided by the TPSD + FNSD predictions. The F1-score is a performance metric that is especially helpful when data is not balanced. TPSD, true negative standard deviation (TNSD) refers to the true positive skin diseases + true negative skin diseases, while false negative standard deviation (FNSD), false positive standard deviation (FPSD) refer to the false negative skin diseases and false positive skin diseases. These notations are used in context of this study to calculate the performance of each metric.
(1)
(2)
(3)
(4)
For experimental setup, we used CoreTM, 10th generation 2.60 GHz CPU, 16 GB RAM, NVIDIA GeForce RTX 2060 GPU. Key parameters are illustrated in Table 2.
| Hyper parameters | Values |
|---|---|
| Input size | 150 150 |
| Loss | Categorical |
| Optimizer | Adam |
| Activation | Softmax |
| Batch size | 64 |
| Epochs | 100 |
| Validation split | 0.3 |
| Dropout | 0.5 |
| Learning rate | 0.001 |
Overall performance of proposed ENeTAMIB model
The performance of the proposed ENeTAMIB model using the original 5,000 images and 10,000 images is presented in Table 3. The results of the proposed model for the last ten epochs, along with training and testing accuracy, are presented. We fit the proposed models for 100 epochs to achieve optimal results and enhance model training. The model was learnt efficiently for 100 epochs.
| Last epochs | Training_acc | Testing_acc | Training_acc | Testing_acc | Training_acc | Testing_acc |
|---|---|---|---|---|---|---|
| 1 | 0.9855 | 0.4007 | 0.9840 | 0.9267 | 0.9944 | 0.9837 |
| 2 | 0.9903 | 0.4120 | 0.9883 | 0.9407 | 0.9957 | 0.9857 |
| 3 | 0.9936 | 0.4270 | 0.9889 | 0.9400 | 0.9949 | 0.9877 |
| 4 | 0.9887 | 0.4232 | 0.9914 | 0.9293 | 0.9937 | 0.9787 |
| 5 | 0.9952 | 0.3970 | 0.9863 | 0.9440 | 0.9894 | 0.9847 |
| 6 | 0.9871 | 0.3933 | 0.9914 | 0.9433 | 0.9921 | 0.9850 |
| 7 | 0.9839 | 0.4082 | 0.9894 | 0.9267 | 0.9930 | 0.9810 |
| 8 | 0.9887 | 0.4195 | 0.9894 | 0.9327 | 0.9873 | 0.9803 |
| 9 | 0.9855 | 0.4120 | 0.9871 | 0.9307 | 0.9936 | 0.9833 |
| 10 | 0.9855 | 0.4157 | 0.9900 | 0.9407 | 0.9933 | 0.9863 |
| Average | 0.9884 | 0.4109 | 0.9887 | 0.9355 | 0.9927 | 0.9836 |
| Std. | 0.0035 | 0.0106 | 0.0021 | 0.0065 | 0.0024 | 0.0027 |
| Entropy | 2.30257 | 2.30225 | 2.30258 | 2.30256 | 2.30258 | 2.30258 |
| MAD | 0.0028 | 0.0088 | 0.0017 | 0.0062 | 0.0018 | 0.0022 |
Note:
MAD, mean absolute deviation.
We also calculate the average of the last ten epochs, standard deviation, entropy, and mean absolute deviation for the proposed model. At last epochs, training accuracy using original data is 0.9855, and testing accuracy is 0.4157. The sample size for both sets is extremely small; the model typically receives one image per class for testing purposes. That was very low; that’s why the model achieved very low performance on original data. To overcome this data limitation, we used augmentation to enhance the dataset. For 5,000 enhanced images, the model achieved 0.9900 training and 0.9407 testing accuracy, which is somehow better than 0.4157. Again, we did experiments with 10,000 enhanced images to see the performance of the proposed model. The model achieved 0.9933 training and 0.9863 testing accuracy. We observed that the suggested model excels in handling a substantial image data set, as deep learning models excel in handling large datasets.
Learning curves of multi-class proposed ENeTAMIB model
An important technique in artificial intelligence, a “learning curve” depicts the correlation between a model’s performance and its training data or the progression of validation. Achieving this outcome requires only monitoring the model’s accuracy throughout training and validation while including additional training examples. All learning curves contain these essential elements: The training curve serves as an indication of the model’s performance throughout its learning process on the training dataset. The model initially exhibits superior performance due to the extensive data included in the training set. The validation curve illustrates the model’s efficacy on a separate validation dataset after training is completed. This feature enables us to evaluate the model using new, untested data. Figure 4A illustrates the accuracy plots for the proposed model using the original data. A significant disparity exists between the training and validation curves. Figure 4B illustrates the correctness of the proposed model with 5,000 improved images, demonstrating that the model has learnt perfectly. In Fig. 4C, it is evident that the curves first decline, followed by improvements after several epochs. Figure 4D illustrates the loss plots for the proposed model using the original data. A significant disparity exists between the training and validation curves. Figure 4E illustrates the correctness of the proposed model with 5,000 improved images, demonstrating that the model has learned perfectly. In Fig. 4F, it is evident that the curves first decline, followed by improvements after several epochs. The model achieved very low validation loss with the augmentation technique.
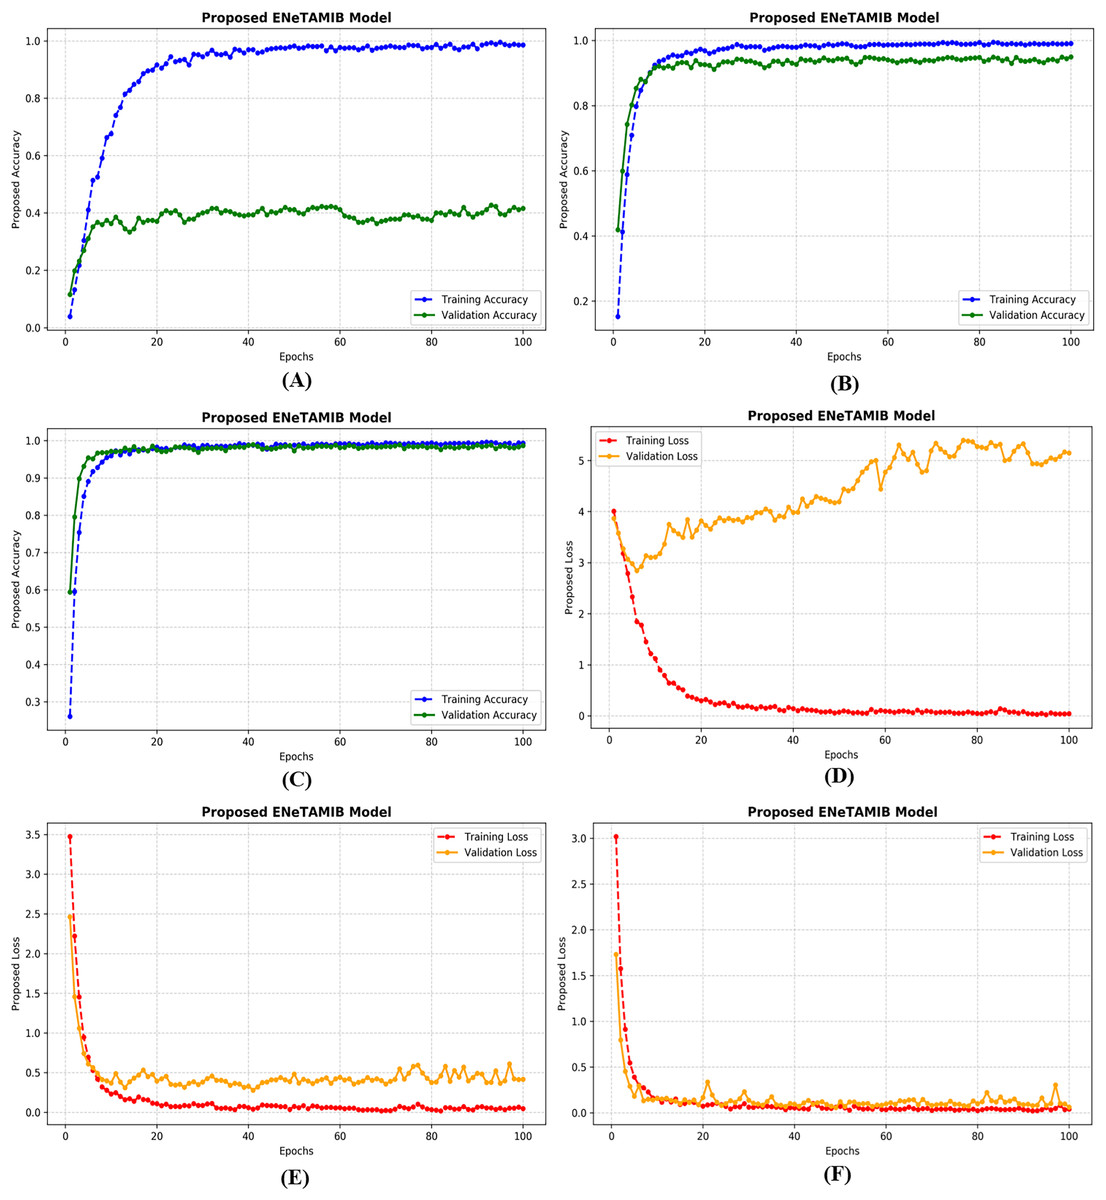
Figure 4: Training and validation accuracy of the proposed model for (A) original data, (B) 5k data, (C) 10k data, also training and validation loss for (D) original data, (E) 5k data, (F) 10k data.
Explainability using Grad-CAM visualization for the proposed ENeTAMIB model
Class activation mapping (CAM) enables the identification of certain regions in an image that are essential for addressing a particular classification challenge. Since its release by Zhou et al. (2016), it has rapidly gained popularity as a technique for interpreting predictions generated by deep learning convolutions. Initiatives are underway to elucidate and enhance comprehension of deep learning. Enhancing the interpretability of models is essential for several deep learning applications in medical imaging. The Grad-CAM approach is beneficial for analysing closely linked neural networks in detection or prediction tasks by offering both model insights and visual explanations. GradCAM’s comprehensive generalisation of CAM makes it superior to CAM.
Grad-CAM and LIME visualizations are included in this work because these play an essential role in bridging the gap between high-performing models and their adoption in clinical practice. However, their contributions must be critically evaluated beyond surface-level interpretability. LIME provides locally faithful explanations by approximating complex model behavior with interpretable surrogate models around individual predictions. This allows clinicians to understand which image regions influenced a prediction. However, LIME’s perturbation-based approach is inherently unstable: explanations can vary significantly across runs due to randomness in the sampling process. Moreover, it is model-agnostic and lacks a deep understanding of the image’s spatial structure, which is critical in dermatology. It may limits its reliability in high stakes diagnostic decisions where consistency and reproducibility are more essential.
On the other hand, Grad-CAM generates class-discriminative heatmaps by leveraging the gradients flowing into the last convolutional layers. It provides visual insight into what the model “sees” as important. While Grad-CAM is more stable and spatially coherent than LIME, it too has limitations. It is sensitive to architecture design and may produce misleading saliency in some cases. Moreover, it only explains where the model looked, not why a decision was made.
From a clinical perspective, while both methods enhance model transparency and offer visual clues that can build initial trust, they are not sufficient for clinical-grade reliability. True deployment requires further validation, integration with domain knowledge, and consistent interpret-ability across diverse populations and image qualities.
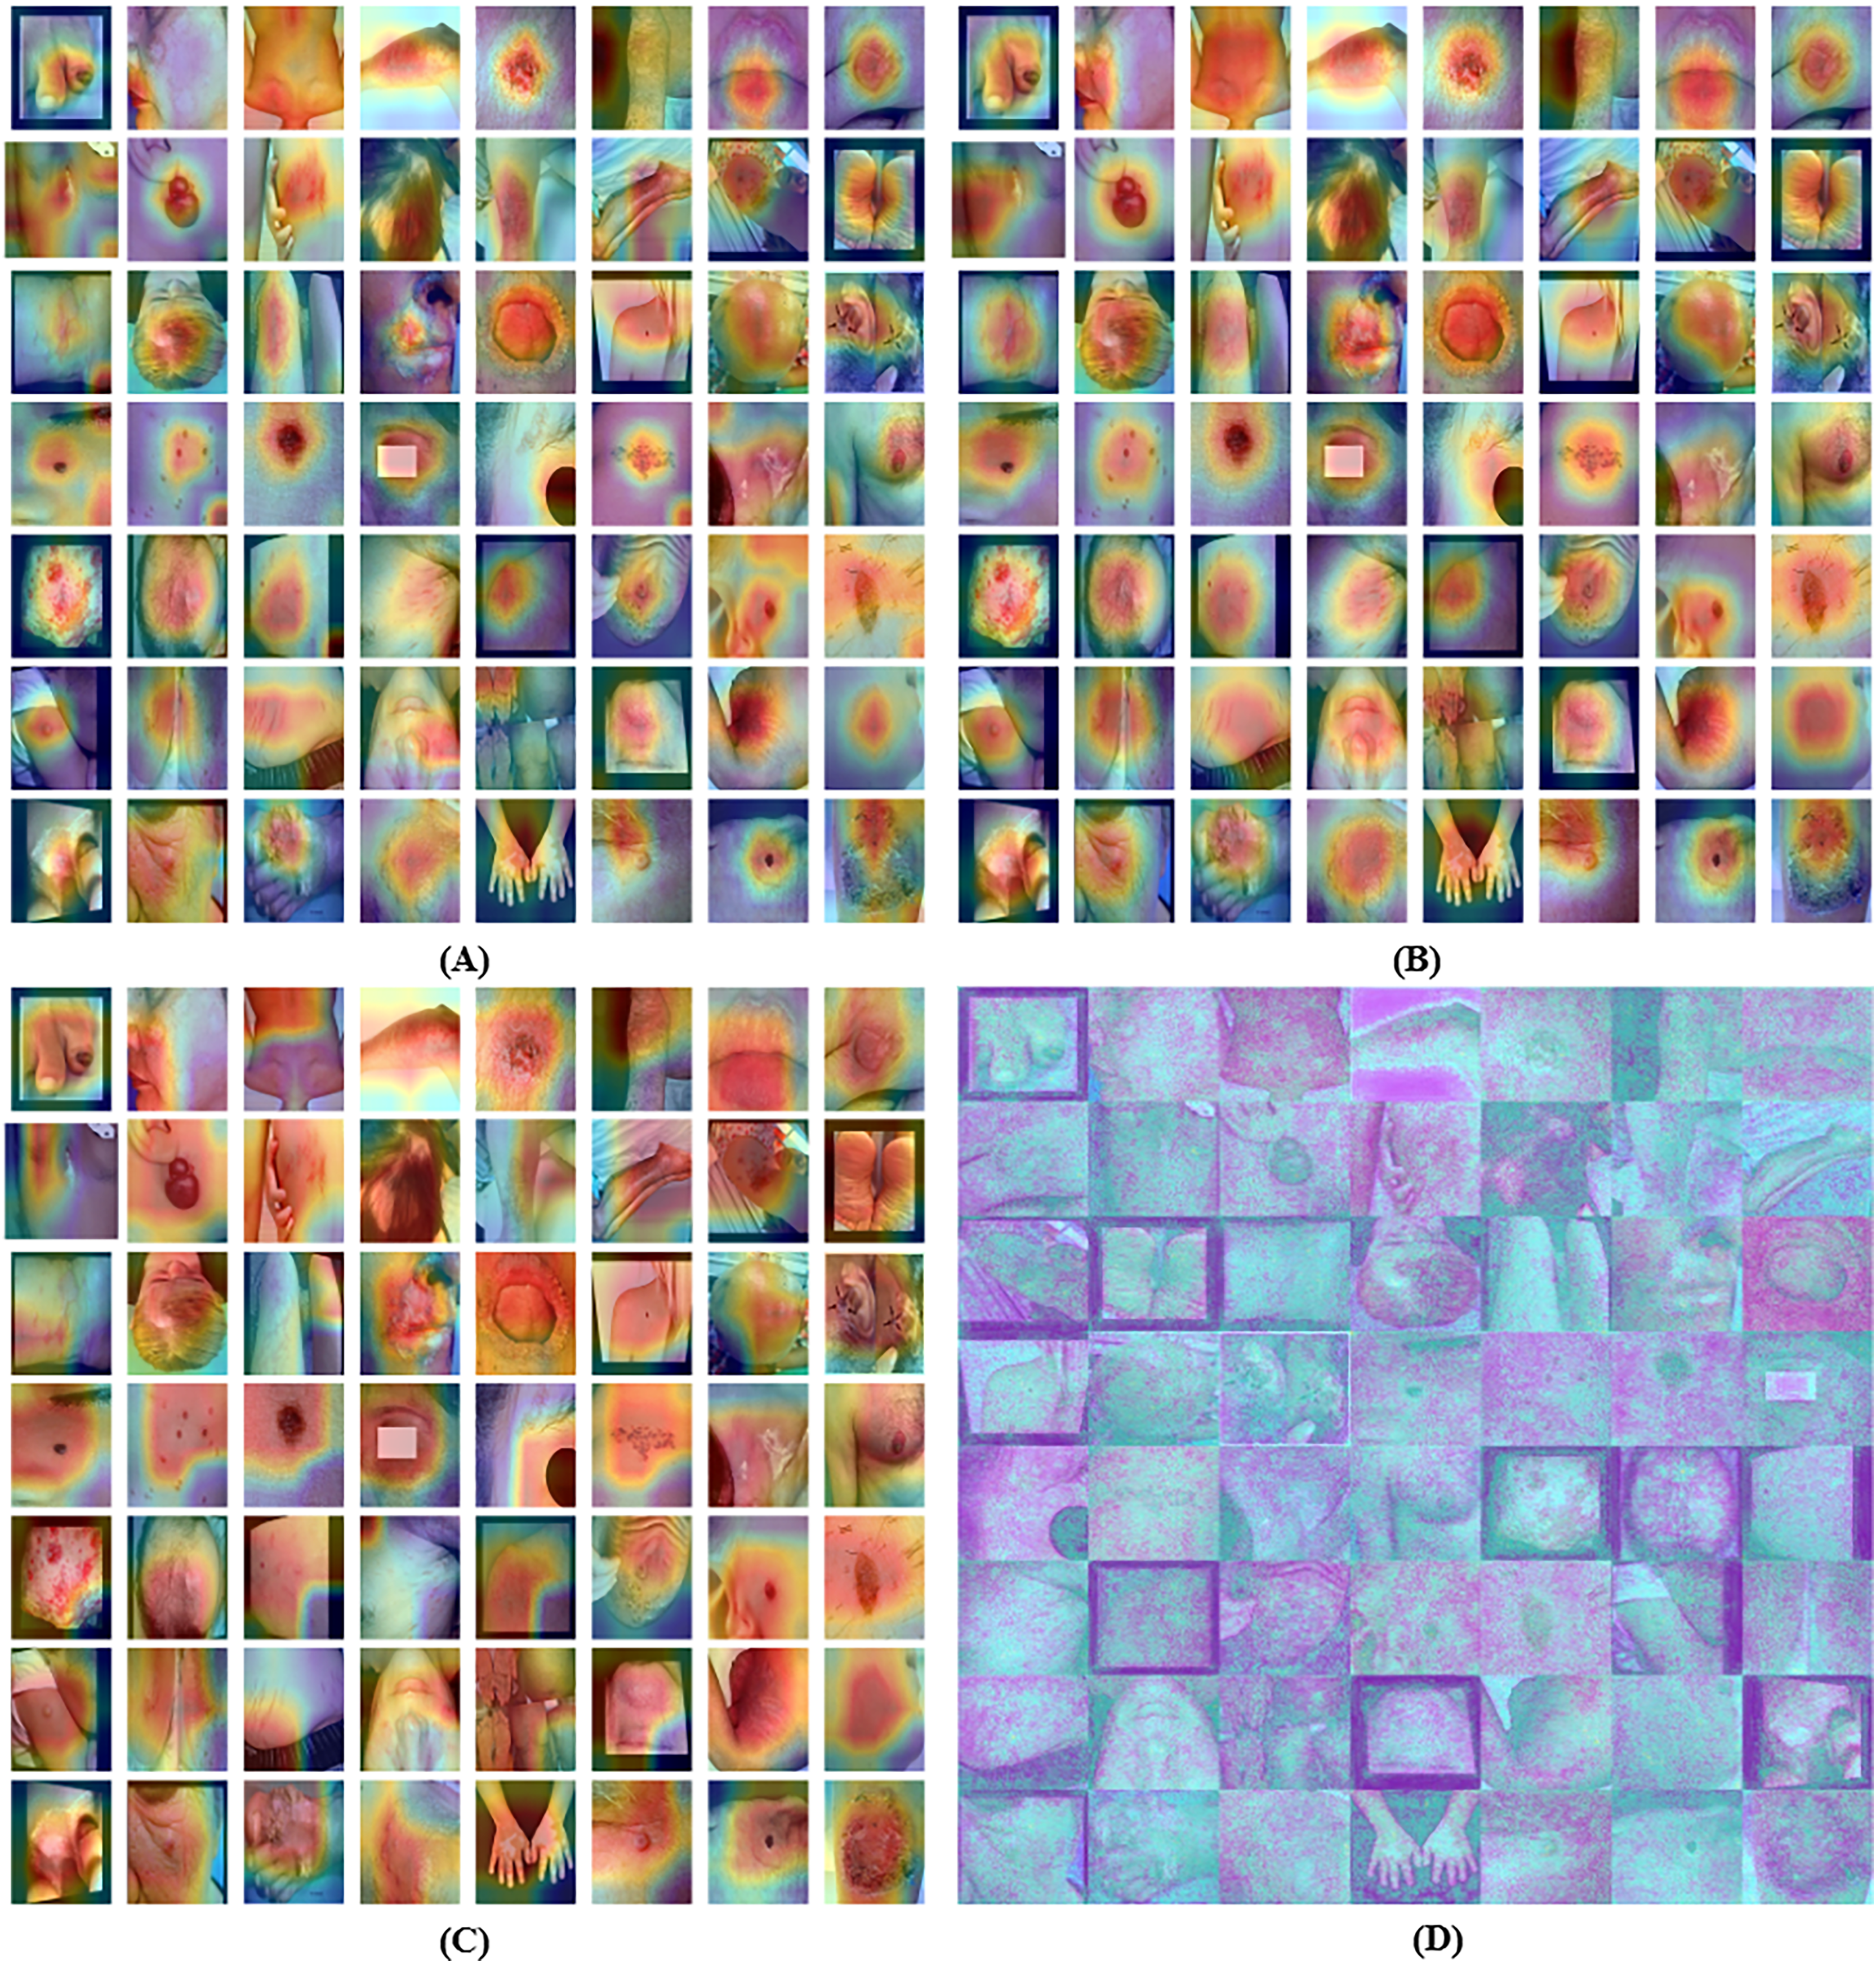
Grad-CAM visualization of 3rd last convolution layer for the proposed model is shown in Fig. 5A. GradCAM’s comprehensive generalisation of CAM makes it superior to CAM. Grad-CAM visualization of 2nd last convolution layer for the proposed model is shown in Fig. 5B. GradCAM’s comprehensive generalisation of CAM makes it superior to CAM. Grad-CAM visualization of last convolution layer for the proposed model is shown in Fig. 5C.
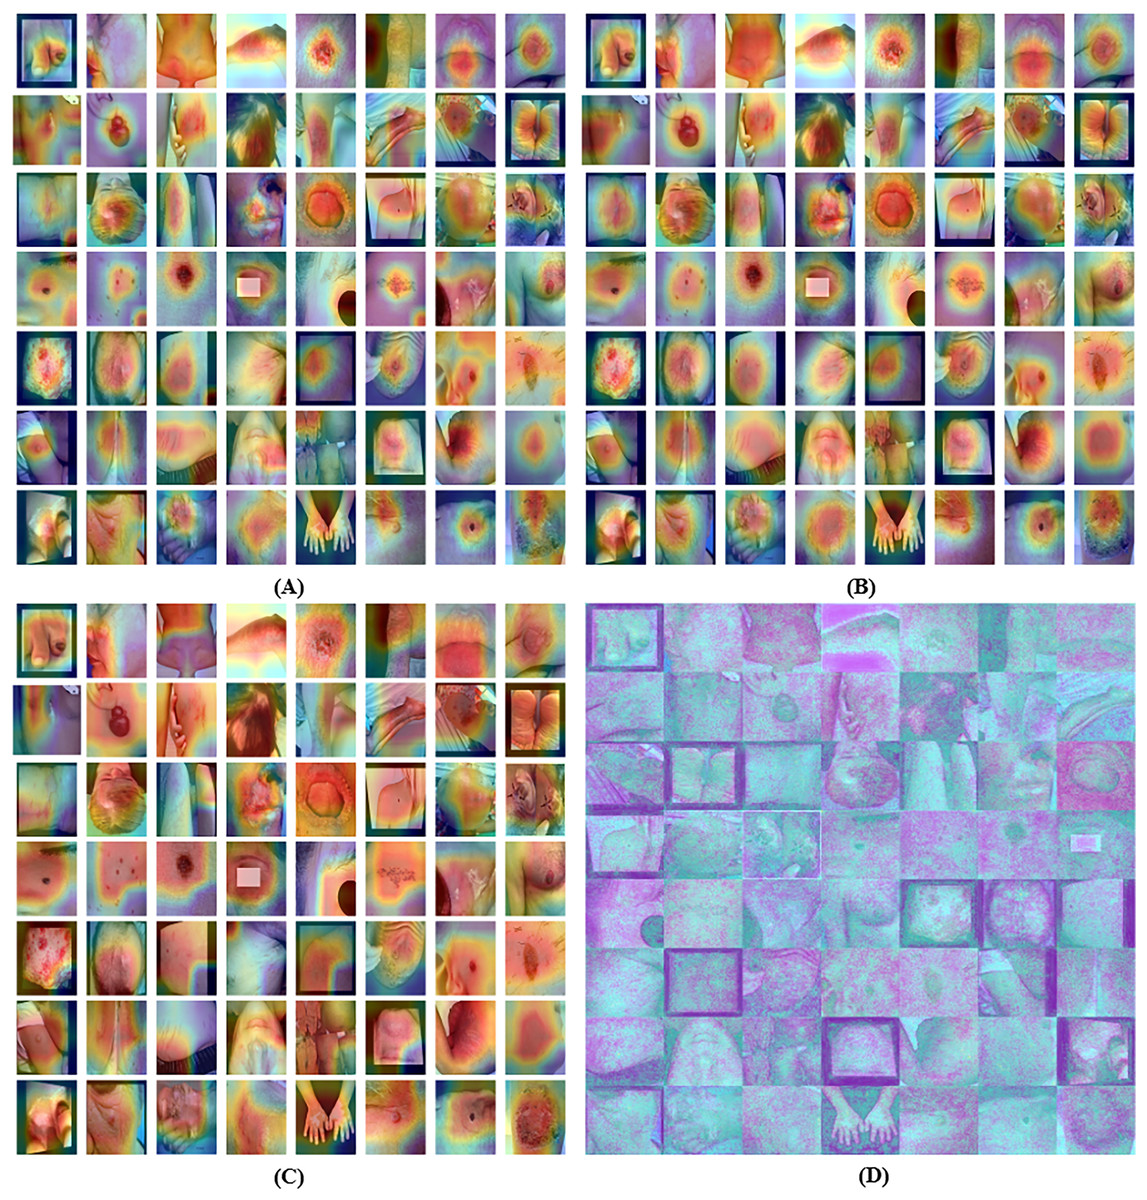
Figure 5: Grad-CAM visualization of the proposed model for (A) 3rd last convolution layer, (B) 2nd last convolution layer, (C) last convolution layer and (D) explainable visualization with saliency map.
Explainability using saliency maps
Numerous methods exist to correlate a network’s predictions with its input attributes in supervised learning. The saliency map is constituted by the variance of the class score across the input pictures. By instructing a machine learning model to analyses an image and identify its most significant components, one may generate a saliency map. The objective is to identify the pixels on which the model concentrates during prediction. This will provide insights into the model’s decision-making processes and its internal representations. To enhance the accuracy of a saliency map for a certain image, it samples analogous images, introduces noise, and then averages the saliency of the sampled images. The explainable proposed model visualization with the saliency map is represented in Fig. 5D.
The use of confusion matrix findings is a straightforward approach that proves to be very efficient when assessing the performance of a model on two or more variables, as seen in Fig. 6 for 57 variables. In a style similar to a table, it presents the actual results on one side and predictions on the other side. TP, TN, FP, and FN are all four aspects that come together to form the matrix. It is possible to have a thorough understanding of the model’s strong and weak areas by using these classifications.
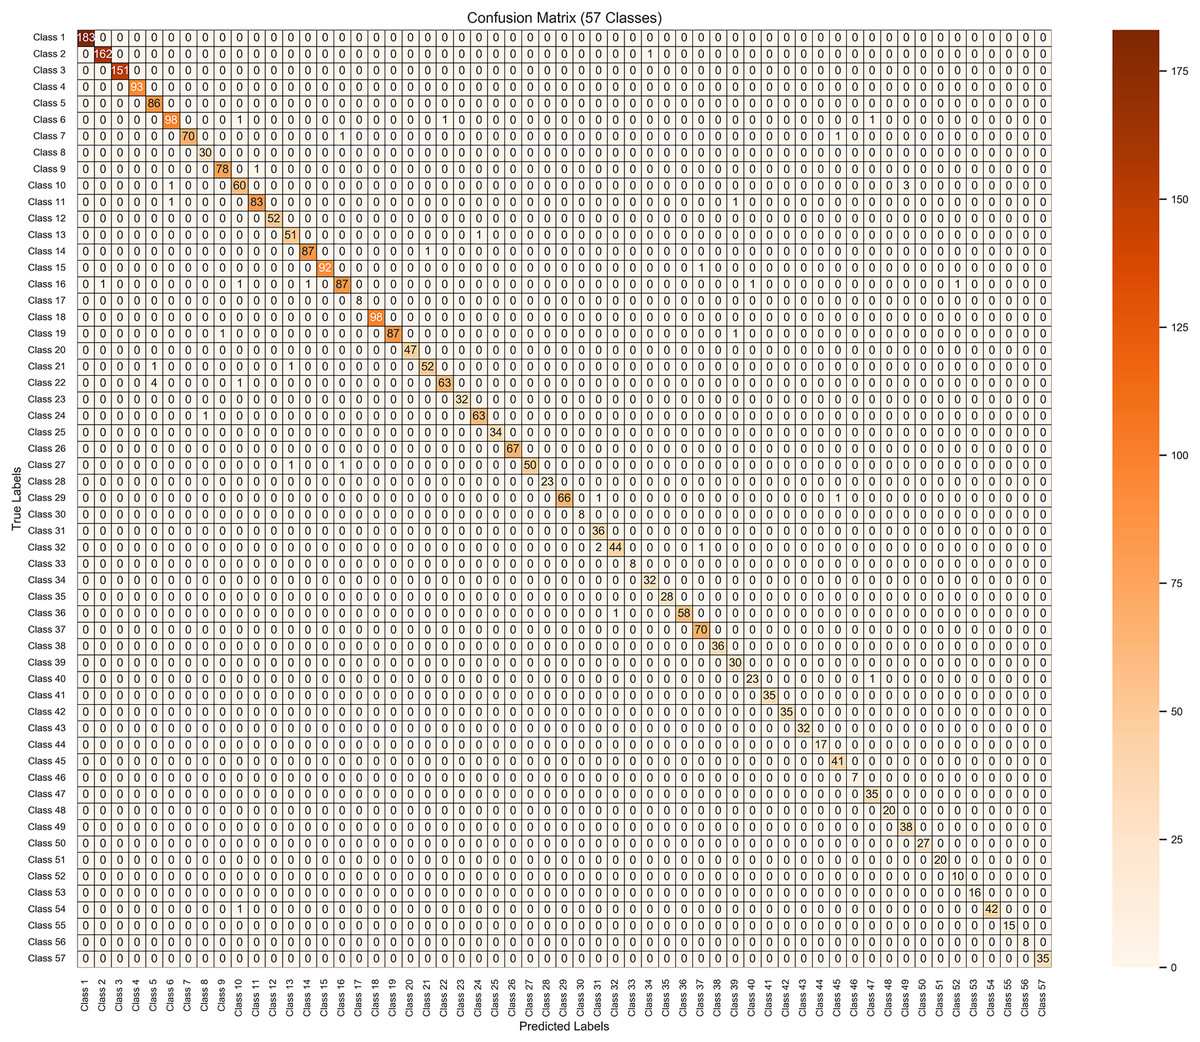
Figure 6: Results visualization of confusion matrix for the proposed model on 10 k enhanced dataset.
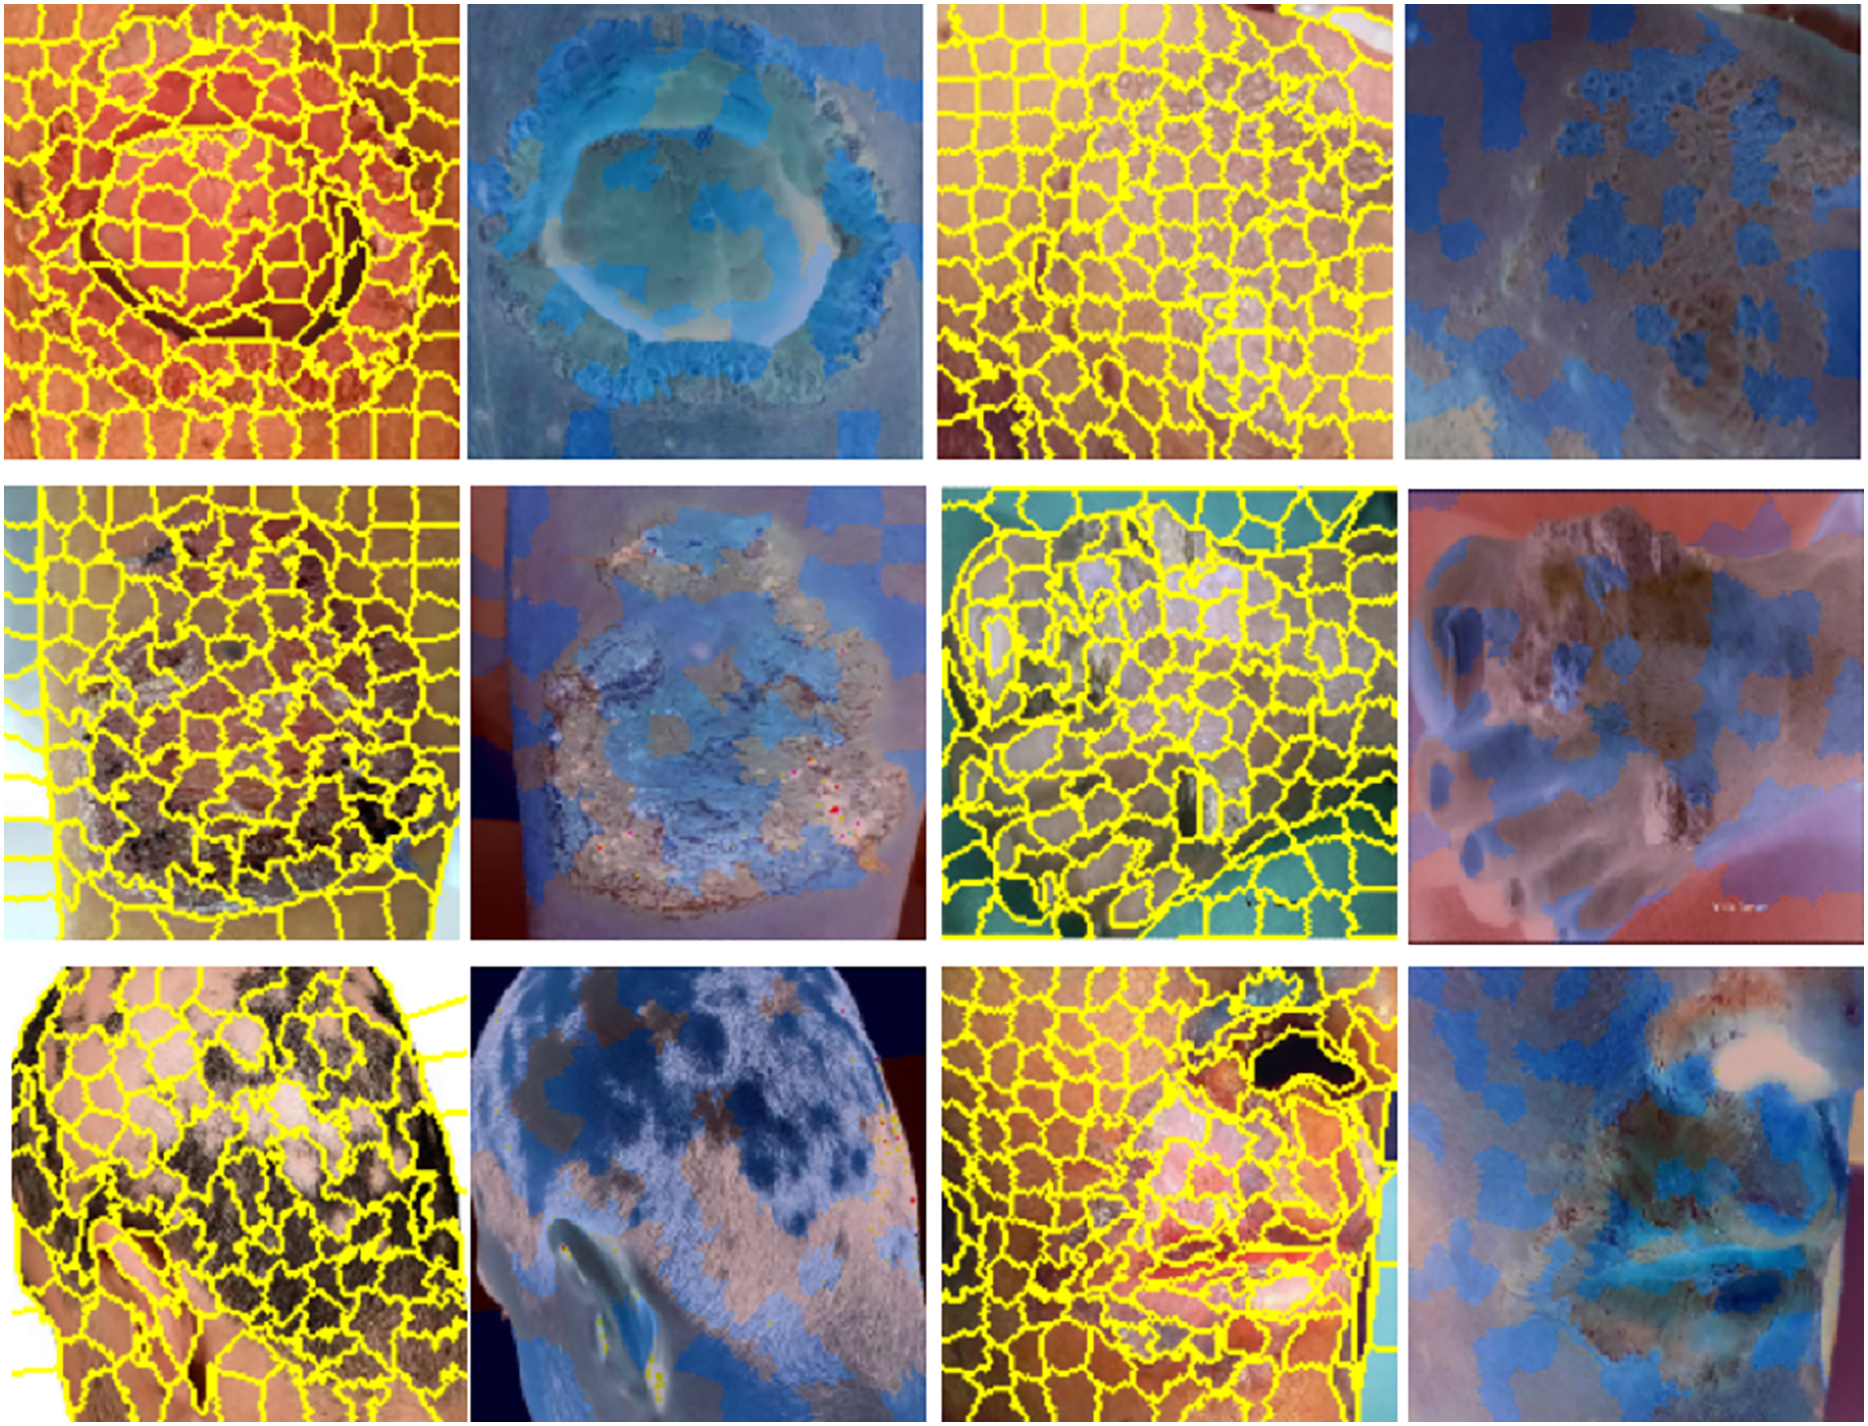
Results visualization of LIME, skin images in yellow indicate super-pixel segmentation and in blue indicate LIME heat-maps are presented in Fig. 7. A notable benefit of LIME is its simplicity. The LIME system is exceedingly intricate; however, its core principle remains straightforward and transparent. LIME seeks to clarify the behaviours predicted by the model in certain situations. Even the most basic models may effectively forecast their behaviour by focussing on a sufficiently limited decision surface.
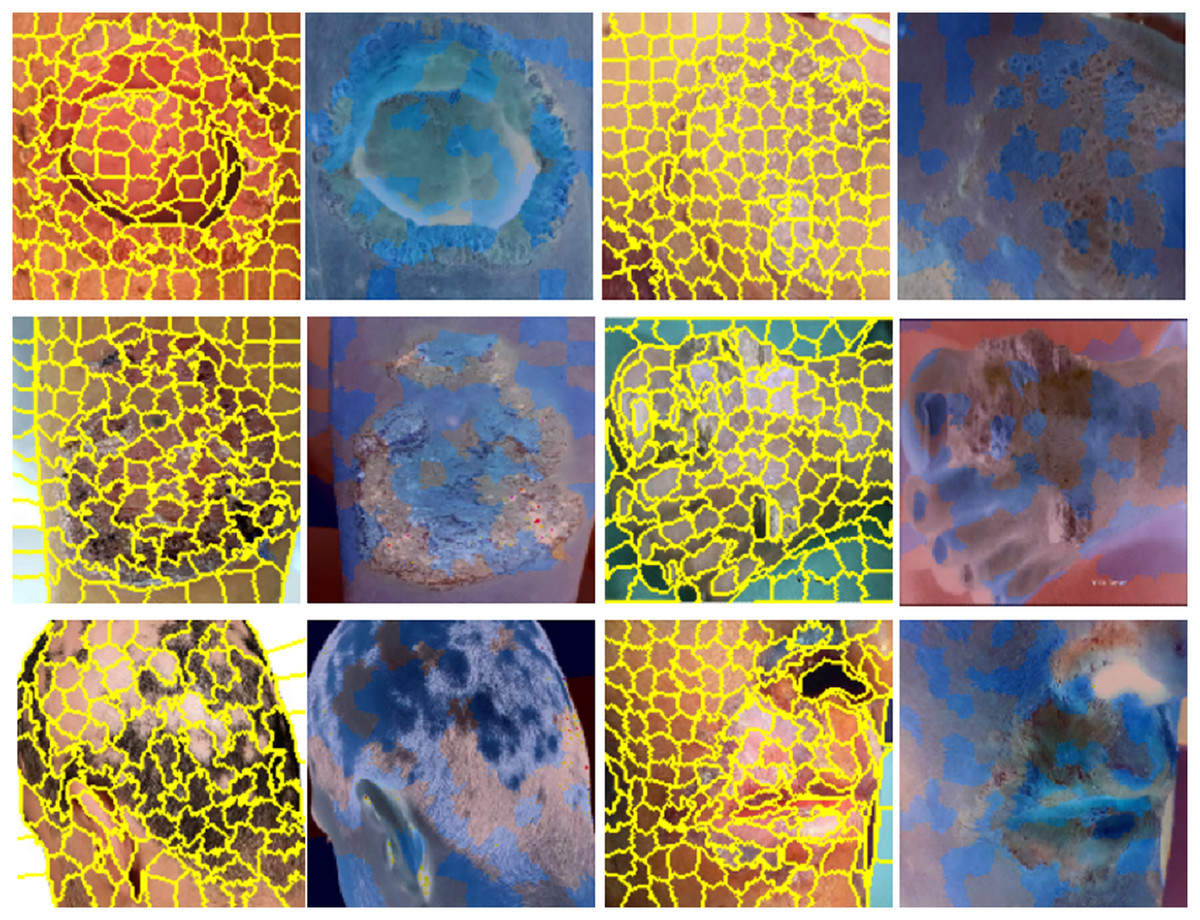
Figure 7: Results visualization, skin images in yellow indicate super-pixel segmentation and in blue indicate LIME heat-maps.
Multi-class classification performance of proposed ENeTAMIB model
The multi-class classification performance of the proposed ENeTAMIB model for 57 skin diseases is shown in Table 4. The proposed model attained a macro precision average of 0.9851, a macro recall average of 0.9891, and a macro F1-score average of 0.9869. Class label 0 attained a perfect 100% across every metric, whereas label 10 recorded a precision of 0.9881, a recall of 0.9765, and an F1-score of 0.9822. Label 20 attained an accuracy of 0.9811, a recall of 0.9630, and an F1-score of 0.9720. Label 43 got a perfect score of 100%.
| Class label | Precision score | Recall score | F1-score score | Class label | Precision score | Recall score | F1-score score |
|---|---|---|---|---|---|---|---|
| 1 | 1.0000 | 1.0000 | 1.0000 | 30 | 1.0000 | 1.0000 | 1.0000 |
| 2 | 0.9939 | 0.9939 | 0.9939 | 31 | 0.9231 | 1.0000 | 0.9600 |
| 3 | 1.0000 | 1.0000 | 1.0000 | 32 | 0.9778 | 0.9362 | 0.9565 |
| 4 | 1.0000 | 1.0000 | 1.0000 | 33 | 1.0000 | 1.0000 | 1.0000 |
| 5 | 0.9451 | 1.0000 | 0.9718 | 34 | 0.9697 | 1.0000 | 0.9846 |
| 6 | 0.9800 | 0.9703 | 0.9751 | 35 | 1.0000 | 1.0000 | 1.0000 |
| 7 | 1.0000 | 0.9722 | 0.9859 | 36 | 1.0000 | 0.9831 | 0.9945 |
| 8 | 0.9677 | 1.0000 | 0.9836 | 37 | 0.9722 | 1.0000 | 0.9859 |
| 9 | 0.9873 | 0.9873 | 0.9873 | 38 | 1.0000 | 1.0000 | 1.0000 |
| 10 | 0.9375 | 0.9375 | 0.9375 | 39 | 0.9375 | 1.0000 | 0.9677 |
| 11 | 0.9881 | 0.9765 | 0.9822 | 40 | 0.9583 | 0.9583 | 0.9583 |
| 12 | 1.0000 | 1.0000 | 1.0000 | 41 | 1.0000 | 1.0000 | 1.0000 |
| 13 | 0.9623 | 0.9808 | 0.9714 | 42 | 1.0000 | 1.0000 | 1.0000 |
| 14 | 0.9886 | 0.9886 | 0.9886 | 43 | 1.0000 | 1.0000 | 1.0000 |
| 15 | 1.0000 | 0.9892 | 0.9946 | 44 | 1.0000 | 1.0000 | 1.0000 |
| 16 | 0.9775 | 0.9457 | 0.9613 | 45 | 0.9535 | 1.0000 | 0.9762 |
| 17 | 1.0000 | 1.0000 | 1.0000 | 46 | 1.0000 | 1.0000 | 1.0000 |
| 18 | 1.0000 | 1.0000 | 1.0000 | 47 | 0.9459 | 1.0000 | 0.9722 |
| 19 | 1.0000 | 0.9775 | 0.9886 | 48 | 1.0000 | 1.0000 | 1.0000 |
| 20 | 1.0000 | 1.0000 | 1.0000 | 49 | 0.9268 | 1.0000 | 0.9620 |
| 21 | 0.9811 | 0.9630 | 0.9720 | 45 | 1.0000 | 1.0000 | 1.0000 |
| 22 | 0.9844 | 0.9265 | 0.9545 | 51 | 1.0000 | 1.0000 | 1.0000 |
| 23 | 1.0000 | 1.0000 | 1.0000 | 52 | 0.9091 | 1.0000 | 0.9524 |
| 24 | 0.9844 | 0.9844 | 0.9844 | 53 | 1.0000 | 1.0000 | 1.0000 |
| 25 | 1.0000 | 1.0000 | 1.0000 | 54 | 1.0000 | 0.9767 | 0.9882 |
| 26 | 1.0000 | 1.0000 | 1.0000 | 55 | 1.0000 | 1.0000 | 1.0000 |
| 27 | 1.0000 | 0.9615 | 0.9804 | 56 | 1.0000 | 1.0000 | 1.0000 |
| 28 | 1.0000 | 1.0000 | 1.0000 | 57 | 1.0000 | 1.0000 | 1.0000 |
| 29 | 1.0000 | 0.9706 | 0.9851 | Macro average | 0.9851 | 0.9891 | 0.9869 |
Comparison of proposed model with previous studies
This section analyses the proposed model with a literature review and contrasts the experimental results of our proposed model with those of the most existing models. In Table 5, a thorough comparison of the proposed model and the state-of-the-art models is conducted. We made comparison of current model with latest 2023 and 2024 literature cited in the study. We seen that three researchers in the literature used CNN model, and attained more than 95% accuracy without applying augmentation technique. Arshed et al. (2023) employed vision transformer for seven skin cancer and attained only 92.14% accuracy. Ayas (2023) also utilized swin like transformer and attained unsatisfactory performance. Ahmad et al. (2023) utilized shuffleNet model with augmeneted large number of images (36,000) for the experimentation and attained 91.5% accuracy. ShuffleNet after enhanced data, also got less accuracy. Another work (Radhika & Chandana, 2023) employed the Multi-class Skin Cancer Detection Network (MSCD-Net) for 25,331 skin images and attained 98.77% accuracy using four diseases. They got higher accuracy because the dataset has only four disease to for the classification. Alhudhaif et al. (2023) and Khan et al. (2024) used convolution support vector machine and in the article the number of images for the experimentation was not mentioned. They attained 89% accuracy via data augmentation for only seven disorders. All research referenced in Table 5 exhibited poor accuracy for multi-class classification, and some studies did not augment the dataset to increase the results. The proposed model has shown excellent performance in detecting 57 skin diseases and also offered explanations to elucidate its predictions. Here, we also performed experiments using the balanced training data. After applying Synthetic Minority Over-sampling Technique (SMOTE) to the training data, we achieved the same number of samples for each class. The proposed model achieved 98.63% accuracy and 0.1041 validation using balanced data.
| Ref. | Model | Images | Classes | Aug | Results |
|---|---|---|---|---|---|
| Vellela et al. (2023) | CNN | – | 2 | No | 96.7 acc |
| Swetha, Shrivastava & Parvathi (2024) | CNN | 10,015 | 7 | No | 96.19 acc |
| Arshed et al. (2023) | Vision Transformer | 7,140 | 7 | Yes | 92.14 acc |
| Su et al. (2024) | STGAN | 18,500 | 7 | Yes | 98.23 acc |
| Ayas (2023) | Swin transformer | 25,331 | 8 | No | 82.3 acc |
| Jiang et al. (2024) | CLM | 120 cases | 4 | No | 96.82 acc |
| Ahmad et al. (2023) | ShuffleNet | 36,000 | 7 | Yes | 91.5 acc |
| Radhika & Chandana (2023) | MSCDNet | 25,331 | 4 | Yes | 98.77 acc |
| Ahmed, Mou & Hossain (2024) | SCCNet | 21,000 | 7 | Yes | 95.20 acc |
| Alani et al. (2023) | CNN | 10,015 | 7 | No | 95 acc |
| Ahmed et al. (2023) | Hybrid model | 10,015 | 7 | No | 98.4 acc |
| Tahir et al. (2023) | DSCCNet | 8,012 | 4 | No | 94.17 acc |
| Subhashini & Chandrasekar (2024) | BGR-QNN | 3,297 | 2 | No | 96.45 acc |
| Khan et al. (2024) | CSVM | – | 7 | Yes | 89.0 acc |
| Proposed work | ENeTAMIB | 10,000 | 57 | Yes | 98.63 acc and 0.0629 loss |
| Proposed work (balanced data) | ENeTAMIB | 27,282 | 57 | Yes | 98.63 acc and 0.1041 loss |
Ablation study
We performed an ablation study because it is essential to validate the individual contribution and efficacy of the proposed model. This provides empirical evidence to support our design choices and performance claims, ensuring that improvements are not due to incidental factors. Here, in Table 6, the baseline EfficientNet+Inception+Attention framework achieved 97.07% accuracy with 0.1272 validation loss. When we removed the attention layer, the model achieved 95.10% accuracy and 0.1764 loss. Again, we also removed the Inception layer and achieved 94.43% accuracy and high validation loss. After, we fine-tuned the EfficientNet+Inception+Attention framework and fit it with only 20 epochs and achieved 98.07 accuracy and low validation, validating that the designed model is superior.
| Configuration | Validation accuracy | Validation loss |
|---|---|---|
| Baseline EfficientNet+Inception +Attention | 97.07 | 0.1272 |
| Remove attention | 95.10 | 0.1764 |
| Remove inception | 94.43 | 0.2411 |
| Fine tuned EfficientNet+Inception+Attention | 98.07 | 0.0979 |
Cross validation study
Cross-validation is a technique for evaluating models that entails their training on subsets of the available input data and their subsequent evaluation on the complementary subset of data. Cross-validation is employed to detect overfitting, which is the inability to generalize a pattern. Five-fold cross-validation was implemented. Table 7 presents the results using five-fold cross validation.
| Folds | Accuracy | Loss |
|---|---|---|
| 1 | 95.15 | 0.2055 |
| 2 | 94.86 | 0.2280 |
| 3 | 95.21 | 0.2001 |
| 4 | 96.50 | 0.1729 |
| 5 | 95.86 | 0.2218 |
Statistical tests
The paired statistical t-test is used to determine whether the performance difference between models is statistically significant or simply due to chance. The test produces, P-value if this value is less than 0.05, the difference is considered statistically significant at the 95% confidence level. This means that there is strong evidence that one model is superior to the other. If the P-value is greater than 0.05, it indicates that the difference in performance is not random and is not significant. Results for statistical tests and P values are shown in Table 8. We performed tests with the VGG16 and ResNet50 baselines with the proposed model and achieved significant results.
| Comparison model | Statistical t test | P-value | Conclusion |
|---|---|---|---|
| VGG16 vs ENeTAMIB | −30.3711 | 0.0000 | Significant |
| ResNet50 vs ENeTAMIB | −13.8054 | 0.0000 | Significant |
Confidence interval
A confidence interval (CI) provides a statistical range that estimates how reliable a performance metric such as accuracy is. The proposed model achieves 98.60% accuracy with a CI of [0.9818–0.9902]; as shown in Table 9, it means we are 95% confident that the true accuracy on unseen data falls within that range. CI is important in clinical settings, where consistent and dependable performance is critical. CI helps quantify uncertainty due to sample size or data variability and supports better decision-making when comparing models. The VGG16 base model achieved 73.93% accuracy with a CI of [0.7236–0.7550], and ResNet50 achieved 91.27% accuracy with a CI of [0.9026–0.9228]. In Eq. (5), represents the observed accuracy while z represents the standard value.
(5)
| Models | Accuracy | Confidence Interval 95% |
|---|---|---|
| VGG16 | 73.93 | [0.7236–0.7550] |
| ResNet50 | 91.27 | [0.9026–0.9228] |
| ENeTAMIB | 98.60 | [0.9818–0.9902] |
Experiments using balanced training data
Table 10 presents the results using balanced training data. We used SMOTE to balance the 57 skin diseases, and after SMOTE, we achieved the same number of images for each disease type for experimentation. We used the SMOTE only on training data, and test data remained unchanged. We used 100 epochs for model fitting with a batch size of 64. Here we show the results for the last 10 epochs, from the 91st to the 100th epochs, and mention them in the table from 1 to 10. The proposed model achieved 98.59% average accuracy with 0.0021 STD.
| Last epochs | Validation_acc | Validation_loss |
|---|---|---|
| 1 | 0.9870 | 0.0865 |
| 2 | 0.9833 | 0.1068 |
| 3 | 0.9843 | 0.0946 |
| 4 | 0.9887 | 0.0774 |
| 5 | 0.9893 | 0.0993 |
| 6 | 0.9890 | 0.1037 |
| 7 | 0.9877 | 0.1263 |
| 8 | 0.9880 | 0.1184 |
| 9 | 0.9853 | 0.1003 |
| 10 | 0.9863 | 0.1041 |
| Average | 0.9869 | 0.1017 |
| STD | 0.0021 | 0.0141 |
Experiments using the HAM10000 dataset
We also performed experiments using HAM10000 dataset, and the dataset was splitted using 70:30 ratio and fitted with the 20 epochs. It corresponds to a large collection of multi-source dermatoscopic images of common pigmented skin lesions. The dataset has actinic keratoses and intraepithelial carcinoma (akiec), basal cell carcinoma (bcc), benign keratosis-like lesions (bkl), dermatofibroma (df), melanoma (mel), melanocytic nevus (nv), Vascular lesions (vasc). Table 11 shows the results of the model using HAM10000 dataset.
| Label | Precision | Recall | F1-score |
|---|---|---|---|
| nv | 90.35 | 94.43 | 92.35 |
| mel | 59.80 | 53.89 | 56.69 |
| bkl | 68.73 | 63.94 | 66.25 |
| bcc | 70.08 | 57.79 | 63.35 |
| akiec | 54.95 | 51.02 | 52.91 |
| vasc | 78.05 | 74.42 | 76.19 |
| df | 62.86 | 64.71 | 63.77 |
Limitations
The proposed model presented promising results for skin disease classification; however, some limitations remain. First, image augmentation techniques and sampling techniques were applied to increase the training data size and address class imbalance; these methods only provide synthetic diversity. They do not fully replicate the real-world variability seen in clinical images, such as variations in lighting, skin tone, lesion location, or image quality. The proposed model may have difficulty to generalise effectively for diverse populations. Second, the skin dataset size remains relatively limited in terms of geographic, demographic, and device diversity. The skin dataset may not include sufficient examples from under-represented skin types or rare conditions, which can bias the model performance and lead to lower accuracy on unseen real-world data. Third, while we evaluate generalisations using an external dataset, the similarity of its format and collection protocol to that of the training data may constrain the evaluation and result in lower performance. A more reliable generalisation test would involve deploying the model on clinically sourced, multi-datasets. In addition, while explainability techniques were used to provide visual justification for predictions, they offer only a partial understanding of the model’s decision process and require expert interpretation.
Conclusion and future directions
It is a challenging task to classify the 57 multi-class skin cancers and diseases, particularly when the dataset has a limited number of samples. This study proposed a novel approach for the classification and detection of 57 skin diseases that utilises EfficientNet as a backbone and subsequently integrates an inception module, an attention module, global average pooling, and fully connected layers to enhance the model’s performance. To enhance the number of skin images in the dataset, we used augmentation techniques. We applied augmentation in two phases: in the first phase, we enhanced the dataset to 5,000 samples, and in the second phase, we enhanced the dataset to 10,000 samples. After augmentation, we received a satisfactory number of samples for the experimentation. Also, we addressed imbalance dataset issue, with the sampling technique. Through extensive evaluation including ablation studies, cross-validation, statistical testing, and interpret-ability methods, the proposed model has demonstrated competitive performance on dermatological dataset.
The experimental findings indicate that the proposed model attained an average accuracy of 93.55% with a standard deviation of 0.0065 and a mean absolute deviation of 0.0062 in phase one, and an accuracy of 98.36% with a standard deviation of 0.0027 and a MAD of 0.0022 in phase two. The proposed model attained a macro average precision of 98.51%, a macro recall of 98.91%, and a macro F1-score of 98.69%. The model achieved a 0.0404 training loss, a 0.0629 validation loss, and a 100% area under the curve (AUC) score. The five-fold cross-validation results showed that the model achieved 96.50% accuracy for the 4th fold with 0.1729 loss, and a statistical test ensured that the proposed model is superior to other pretrained models. We also set a 0.95 confidence interval and achieved 98.60% accuracy [0.9818–0.9902].
The proposed method surpassed current pretrained models in the literature, based on experimental results. The integration of Grad-CAM and LIME further enhances trust and transparency, which is crucial for adoption in real-world medical environments.
However, for clinical use, rigorous validation across multiple institutional datasets and diverse populations is necessary to ensure that the model performs consistently across patient populations and imaging modalities. Real-time processing on mobile devices or wearable may also be considered.
In future research, we will update the proposed model with advance modules, make the model more lightweight, expanding the model to handle multi-label conditions, integrating clinical metadata, and combining with dermatologist feedback loops could further improve diagnostic utility. Overall, this work contributes a strong foundation for building practical, interpretable, and scalable AI tools in dermatological care.