
Intrapartum cardiotocography trace pattern pre-processing, features extraction and fetal health condition diagnoses based on RCOG guideline
- Published
- Accepted
- Received
- Academic Editor
- Muhammad Asif
- Subject Areas
- Bioinformatics, Algorithms and Analysis of Algorithms, Artificial Intelligence, Databases, Programming Languages
- Keywords
- Cardiotocograph, Fetal heart rate, Uterine contraction, Electronic fetal monitoring
- Copyright
- © 2022 Al-yousif et al.
- Licence
- This is an open access article distributed under the terms of the Creative Commons Attribution License, which permits using, remixing, and building upon the work non-commercially, as long as it is properly attributed. For attribution, the original author(s), title, publication source (PeerJ Computer Science) and either DOI or URL of the article must be cited.
- Cite this article
- 2022. Intrapartum cardiotocography trace pattern pre-processing, features extraction and fetal health condition diagnoses based on RCOG guideline. PeerJ Computer Science 8:e1050 https://doi.org/10.7717/peerj-cs.1050
Abstract
Context
The computerization of both fetal heart rate (FHR) and intelligent classification modeling of the cardiotocograph (CTG) is one of the approaches that are utilized in assisting obstetricians in conducting initial interpretation based on (CTG) analysis. CTG tracing interpretation is crucial for the monitoring of the fetal status during weeks into the pregnancy and childbirth. Most contemporary studies rely on computer-assisted fetal heart rate (FHR) feature extraction and CTG categorization to determine the best precise diagnosis for tracking fetal health during pregnancy. Furthermore, through the utilization of a computer-assisted fetal monitoring system, the FHR patterns can be precisely detected and categorized.
Objective
The goal of this project is to create a reliable feature extraction algorithm for the FHR as well as a systematic and viable classifier for the CTG through the utilization of the MATLAB platform, all the while adhering to the recognized Royal College of Obstetricians and Gynecologists (RCOG) recommendations.
Method
The compiled CTG data from spiky artifacts were cleaned by a specifically created application and compensated for missing data using the guidelines provided by RCOG and the MATLAB toolbox after the implemented data has been processed and the FHR fundamental features have been extracted, for example, the baseline, acceleration, deceleration, and baseline variability. This is followed by the classification phase based on the MATLAB environment. Next, using the guideline provided by the RCOG, the signals patterns of CTG were classified into three categories specifically as normal, abnormal (suspicious), or pathological. Furthermore, to ensure the effectiveness of the created computerized procedure and confirm the robustness of the method, the visual interpretation performed by five obstetricians is compared with the results utilizing the computerized version for the 150 CTG signals.
Results
The attained CTG signal categorization results revealed that there is variability, particularly a trivial dissimilarity of approximately (+/−4 and 6) beats per minute (b.p.m.). It was demonstrated that obstetricians’ observations coincide with algorithms based on deceleration type and number, except for acceleration values that differ by up to (+/−4).
Discussion
The results obtained based on CTG interpretation showed that the utilization of the computerized approach employed in infirmaries and home care services for pregnant women is indeed suitable.
Conclusions
The classification based on CTG that was used for the interpretation of the FHR attribute as discussed in this study is based on the RCOG guidelines. The system is evaluated and validated by experts based on their expert opinions and was compared with the CTG feature extraction and classification algorithms developed using MATLAB.
Introduction
Cardiotocography entails a low-cost method of determining fetal status that is not evasive in its inauguration clinical practice use at the terminal end of the 1960s. The registration of the uterine contractions experienced by the mother and the fetal heart rate are conducted on an article trace termed as a cardiotocograph (CTG) (Nunes et al., 2013).
Labor complications can result in poor perinatal results, which can lead to detrimental consequences such as death. As a result, initial diagnosis and prognosis of pathological outcomes are required, which can assist reduce global rates of fetal morbidity and deaths. Simultaneously, it can also evaluate the appropriateness of intervention such as surgery in the form of a cesarean section. During labor, the fetus is monitored using human CTG analysis. Bad human perception, on the other hand, has resulted in significant variabilities between (inter) and within observers (intra). As a result, a growing collective of proof suggests the potential of CTG signals analysis that utilizes computer automation as a promising method to diagnose true perinatal complications. This is in addition to the forecasting of the commencement of pathological consequences that contain uncertainty and precision. Numerous fields involved the use of CTG and it is applied for many objectives, such as the identification of uterine constriction and the observation of fetal heart rate (FHR) throughout pregnancy (Bernardes et al., 1991). It is often used in the third trimester of pregnancy to assess fetal well-being and discover fetal distress early (Kovács, Torok & Habermajer, 2000; Georgoulas, Stylios & Groumpos, 2005; Ayres-de-campos et al., 2000; Krupa et al., 2011). Most of the current studies are focused on CTG classification based on FHR feature extraction using a computer vision approach to ascertain the optimal and suitable diagnosis and track fetal wellbeing throughout the pregnancy.
A device that monitors the condition of the fetal is also an enabler for the detection and accurate quantification of fetal heart rate patterns. This is accomplished by monitoring FHR with a Doppler ultrasound transducer and uterine contraction (UC) with a pressure transducer. Typically employed by obstetricians, the CTG is customarily used to measure the health condition of the fetus when the fetus is not available for direct examination. It aids the obstetrician in predicting possible complications and executing intervention measures before permanent damage to the fetus occurs (i.e., fetal distress, hypoxia, or congenital heart defect, and others) and leads to early detection of pathological cases (Al-Yousif et al., 2021). The most popular diagnostic method for a fetal status health check is via FHR recording (Ocak, 2013) by measuring the heart rate specifically per unit time known as beats per minute (b.p.m.) (Várady et al., 2003). Certain techniques involved employed the Fetal electrocardiography (FECG) that uses abdominal surface electrodes, photo plethysmography (PPG) that uses near-infrared (NIR) light, the Doppler ultrasound, the ultrasound-based cardiotocography (CTG) known as electronic fetal monitoring and fetal magnetocardiography (FMCG) (Peters et al., 2001). At present, a renowned technique used for CTG measurement is the ultrasound Doppler CTG due to its non-invasiveness (Peters et al., 2001; Kovács et al., 2011).
The CTG represents the maternal uterine contractions (UC) along with the constant FHR recording. In addition, CTG is also utilized for fetal surveillance purposes. This is because the status of the fetal can be detected by analyzing the variations in the pattern of the FHR, especially during contractions. As aforementioned, obstetricians referred strictly to the RCOG guideline for the monitoring of the FHR in making decisions about the condition of the fetal status. The RCOG is the most widely used guideline worldwide (Lees et al., 2015) Since there are new groups of FHR signals that are continuously being found, techniques using automation are being employed for baseline estimation, and have undergone continuous improvement for numerous years ensuing the failures of past techniques (Cookson, 2001).
Moreover, the variability in the FHR is a well-known function in diagnosing the wellbeing of the fetal condition. There persists a lack in finding a common consensus in defining FHR variability (FHRV) and the evaluation techniques to be used, despite its medical relevance clinically, and the extensive employment of fetal observation. The FHR variability is often found and calculated in the channels of the FHR signals that are without accelerations and decelerations, resulting in the difficulty determining it amongst the numerous and packed incidents (Wróbel et al., 2013).
FHR can be monitored throughout the 24th week of the pregnancy. The regular medical examination of the registered FHR diagram is extremely important clinically, and it has resulted in a significant reduction in prenatal and postnatal child mortality since its implementation (Cookson, 2001). Note that the clinicians’ experience and expertise are vital during FHR traces visual analysis. As previously stated, numerous methods for effective interpretation of FHR were proposed here (Wróbel et al., 2013). Notwithstanding the extensive utilization, disputes pertaining to the efficiency of the CTG CTG’s, interpretability, and management algorithms for abnormal or disturbing patterns persist (Warrick et al., 2006). The extensive utilization of heart rate variability (HRV) analysis is for autonomic nervous system (ANS) evaluation in cardiovascular studies is highly notable, as well as the applications in human well-being and lifestyle (Cookson, 2003).
The studies on the CTG by the computational and signal processing community have begun as early as 1970 in assisting CTG interpretation by medical practitioners based on the pattern of the CTG. Several approaches have been devised for this purpose, but none of them have been widely adopted for everyday use (Tarvainen et al., 2014; Devane & Lalor, 2005). However, due to the excessively loud environment, the fetal heart produces less acoustic energy. As a result, the disadvantages of signal processing must be addressed to improve fetal heart sound detection (Costa, Maria Antónia Moreira Nunes da, 2011; Zuckerwar et al., 1993; Talbert et al., 1986). This includes spurious maternal HR, spiky artifacts, and numerous missing values along with outliers that occurred in the FHR trace patterns during the recording of CTG, which further acted as noise. The noise remains in the CTG recordings since this form of noise is irremovable at the point of origin (Kovács, Torok & Habermajer, 2000; Georgoulas, Stylios & Groumpos, 2005) as aforementioned. Approximately 20–40% of data are missing during the recording of the FHR (Georgoulas, Stylios & Groumpos, 2006) that mostly contributed to the quality of data during acquisition, which further led to the misinterpretation of the FHR signals. This is because some of these artifacts can be mistakenly interpreted as either the deceleration or acceleration of fetal heart rate (Struzik & van Wijngaarden, 2001). Occasionally, important fetal signals or patterns might be mistakenly identified as an artifact instead and subsequently result as a false negative (FN) or false positive (FP) (Freeman Roger et al., 2012).
This is due to the failure caused by conventional filtering techniques in providing a suitable solution, which consequently has the potential in removing vital information from the FHR signal. Hence, suitable and robust pre-processing procedures along with reliable signal enhancement are needed for the removal of artifacts in FHR signals. This is to ensure that the FHR signals that represent significant features are extracted. Several methods employed for the pre-processing stage of the CTG include moving the average and linear interpolations, to remove the missing spikes and beats of the artifacts (Bernardes et al., 1991; Ayres-de-campos et al., 2000; Krupa et al., 2011; Al-Yousif et al., 2021; Guijarro-Berdiñas, Alonso-Betanzos & Fontenla-Romero, 2002).
Further to this, the CTG feature extraction is executed in a manner that ensures the pre-processing completion. This is followed by the FHR pattern classification for diagnosis purposes. There have been various methods used for the extraction of the FHR features to enhance efficiency (Krupa et al., 2011). Thus, some of these methods can be implemented with the classification of the FHR feature extraction to satisfy the demands of rule-based patterns. The goal of using classified FHR feature extraction is based on computer-controlled FHR feature extraction and cardiotocography (CTG) classification, which will support the decision of the obstetricians to analyze CTG with better interpretation and diagnosis. Therefore, in this study, a rule-based algorithm for intrapartum based on CTG pattern is employed for both feature extraction and classification purpose. This study presents a new methodology for improving the Features Extraction mechanism based on the classification approach. This article is organized as follows: a literature review about previous studies that is pertinent to this current research in “Literature review”. Then followed by explications on the materials and methods in “Materials and methods”, with its subsections. “Results” indicates the results of this current research, followed by a discussion on the research in “Discussion”. The conclusions of the article in “Conclusions”.
Literature review
The computerized analysis of the cardiotocography, and fetal heart rate is a relevant clinical application for fetal distress detection. Within this scenario, different digital signal processing techniques have been used to extract information from these signals, such as the authors (Nidhal, Ali & Najah, 2010) who presented an effective CTG-signal digitization approach. The pre-processing stage, image segmentation, signal extraction, and signal calibration are the four primary aspects of the suggested technique. The pre-processing stage includes median filtering and limited adaptive contrasts. The Otsu threshold technique is used to divide the CTG images via image segmentation. The correlation coefficient is used to determine the existence of any similarities between the conventional and CTG signals. The results of the experiments show the enhancement of the digitized CTG signals. However, a smaller number of samples were considered. An innovative diagnosis by computer-aided prototype is offered. The common-spatial patterns were used in the proposed model for the features. However, the method had employed the retrospective assessment procedure according to data-based multi-channel requirements. Furthermore, the model indicates various outcomes obtained through the utilization of diverse data division criteria such as the handling of similar methods as well as similar database (Cömert et al., 2019a). The following research trend highlighted the aspect as a review view, on the methodical survey launched on the aspect of fetal heart monitoring.
Meanwhile, a few instances of the studies focused on neonatal and perinatal medicine to highlight the efficacy of HRV in neonatology and the devices available to analyze it, as yet there exist a shortage of a thorough impression of the methodologies utilized in the assessment of FHRV (Chiera et al., 2020).
In addition, Castro et al. (2021) the spectral frequency bands described in intrapartum FHR investigations and to evaluate their efficacy in detecting fetal acidemia/hypoxia, investigation associated to the relatively low incidence of severe acidemia fetuses in this FHR database. Furthermore, a comprehensive review of the prevalent signal processing approaches proposed in the literature to enhance the analysis of FHRV was carried out, and consequently, the diagnosis of a healthy fetal condition is executed, regardless of the recording technology. This is because the assessment of FHR tracings permits clinician subjectivity and has poor specificity for newborn outcomes, this practice provides sufficient potential for professional bias to affect counseling on the timing and rationale for cesarean delivery. Moreover, the authors in Zizzo et al. (2020) had determined whether the measurements of the FHRV in the form of time domain and spectral domain parameters should encompass fetal movements containing fetal breathing movements. Nonetheless, there exist limitations resultant from a handful of included studies that are based on a low sample frequency.
Additionally, the researchers in Signorini et al. (2020) had evaluated the validity and performances of numerous machine learning approaches for the categorization of healthy babies vs fetuses afflicted by intrauterine growth restriction (IUGR), where achieved superior performance. The mean accuracy for all the 10 tests is 0.911, which is a nonlinear characterization of FHR and UC signals and a new windowed complexity analysis of the FHR signals based on entropy measurements. Nevertheless, the approach used entropy values to determine normal and suspicious/pathological groups proposed by Marques et al. (2020). The computer-based method was offered by Lobo Marques et al. (2019) for diagnostic assistance system, which was based on digital signal processing techniques to identify and segment changes in the FHR and the uterine tone signals automatically, where the diagnostic accuracy was increased by the use of an adaptive filter. However, their problem is that they also require a reference signal, and the QRS complex may suffer from interference with the parameter estimation, where the QRS Complex One single heartbeat is equivalent to the depolarization of the right and left ventricles (lower cardiac chambers) (lower heart chambers), the (Q-wave = initial negative deflection), the (R-wave = initial positive deflection, the S-wave = second negative deflection). The researchers (Alsaggaf et al., 2020) presented a method based on a triple filter as well as dual covers characteristic chosen approaches and machine learning models, in addition to models that were assessed according to a feature set of high dimension secured from a publicly available Czech Technical University source and database obtained from the University Hospital in Brno (UHB) intrapartum cardiotocography. Due to the various division criteria, this poses a considerably challenging issue. The sliding window determines the action principle of these levels and posits a statistical capacity on values in kernel-defined window size. There are three types of pooling strategies, notably the first being max pooling, the second being mean pooling, and the third being sum pooling.
The first type of pooling strategy is usually ideal for capabilities based on the convolutional neural network (CNN). The characteristic map of the sub-regions is extricated, for instance, 3 × 3 sub-region, which considers their highest value and removes other values completely, consequently achieving a classification accuracy of 88.58%.
Several machine learning algorithms are used to classify fetal heart rate signals, including the Legendre series-based neural network and the Volterra neural network (VNNs). Nevertheless, the results reveal that the Legendre series-based neural network indicated better performance (Cömert et al., 2019b).
The selection of feature and classification model on the extracted dataset was based on RCOG guideline. However, reduced features are needed during the performance of classification. Even though the proposed model is not found in Python-ML techniques, refereeing classification trends should be considered not solely based on models and parameter tuning (Alsayyari, 2019). A hypoxia disclosure by using an external CTG dataset where the evaluation outcomes consider both deep learning and ensemble learning was presented in Nandipati & XinYing (2020). However, the experimental results of deep learning were poor particularly, in the recall and f1 score.
In a study by Intan et al. (2019), their research had evolved a rectification approach for the identification and exclusion of the values that were not valid, to remake the FHR signal in the role of time series of episodes. However, the obtained accuracy was restricted because of a broad autocorrelation window that was performed in averaging the numerous adjacent intervals even in the existence of conflicts from fetal actions, though at the compromise of the assessment accuracy.
The study by Kupka et al. (2020) involved a performance analysis of the firefly algorithm to adapt the parameters of the extreme learning model and enhance its performance. Thus, the conducted results of the integration of the evolutionary firefly algorithm and extreme learning model presented better performance with the support of the vector machine and hidden Markov model. Akhavan-Amjadi (2020) presented significant dimensionality reduction techniques to contract the data size. Thus, this was to manipulate the machine learning algorithms to access the grid system stability. Meanwhile, Reddy et al. (2020) proposed an investigative technique of fetal heart rate exploration in their research. However, the composition was insufficient for developing an automatic technique capable of anticipating pH-associated classes with amazing classification execution due to the great likelihood of interference.
Furthermore, the higher dimensions boundary was not violated (Georgoulas et al., 2021). A predictive model for fetal hypoxia prognosis based on CTG effects is provided, which is based on an image-based time-frequency study and includes the incorporation of grayscale co-appearance and short-time Fourier transform. However, there is an absence of any convenient pH value for FHR signals recognition, in addition, there is a direct impact of the model’s behavior in terms of the manipulation of proceeding signal, classification approaches, and distinguishing pattern. Furthermore, image-based temporal frequency characteristics were solely used for FHR signal performance.
In a study by Cömert, Kocamaz & Subha (2018), the researchers had enhanced the effective recognition accuracy such as the distribution of Electrocardiography data through utilizing numerous Fourier-transform. They had also discovered the association with oscillations recognition; however, the proposed study did not augment any of the new techniques such as machine learning.
Moreover, another research by Erkuş, Purutçuoğlu & Purutçuoğlu (2019) found transfer learning as an innovative paradigm detection issue-resolving technique that is dependent upon a deep convolutional neural network, which is offered to assort Fetal Heart Rate signals by way of regular and irregular signals.
However, the proposed approach did not justify the reasons for the concentration on the last 15 min of the signals. In addition, Cömert & Kocamaz (2018) presented an innovative computer-aided diagnosis scheme to predict fetal hypoxia that is dependent on deep convolutional neural networks. Nevertheless, the proposed system did not execute any characteristic transformation. In a study by Zhao et al. (2019), the researchers had engaged in an investigation on Magnetomyography signals to classify uterine by using the k-nearest neighbor algorithm (KNN). Nonetheless, it was revealed that the receiver operating characteristic offered poor performance. However, the utilization of a parameter classification may boost the accuracy of the classifier. In another study by Babu & Kumar (2018), the researchers had presented a clustering with prototypes based on a fuzzy classifier, Nonetheless, the proposed method suffered in its inference mechanism where the standard of excellence of fetal rating approach that used automation which relied heavily on the human experts’ selection on the clarification on the fetal condition. In Jezewski et al. (2019), the researchers proposed a computer recognition technique based on the comparison between the ultrasound and transabdominal fetal electrocardiogram method. Nevertheless, the research did not recognize through the numerous kinds of dragging as well as, due to the limitation of USA device interval evaluation, which subsequently led to the probable error amidst the evaluation-interval. A study by Hayes‐Gill et al. (2020) reviewed human-based cardiotocography traces that explained that the mean square error enhancement has no significant presence statistically, as well as possesses a low sensitivity. There was a multivariate classification that was presented as a limitation. Furthermore, the study by researchers (Fergus, Selvaraj & Chalmers, 2018) had offered an automated investigation software equipment to calculate fetal heart rate and consequently enabled the Cardiotocography trace for uterine constrictions per hour set as fixed.
A study by Pasarica et al. (2017) utilized a support virtual machine algorithm for classification as well as the recognition of features that are genetic algorithm-based. The classifier training was considered challenging due to some slight issues associated with the fetal results, as well as an enormous deviation in fetal heart rate pattern. In addition to this, a study by the researchers (Warmerdam et al., 2018) had presented an automatic calculation approach of FHR variability. Nevertheless, there was a lack in the rationale of fetal heart rate variability in conjunction with the decisive standards in terms of evaluation. Moreover, in Romano et al. (2018) the researchers will reveal a reliable inter observation that was presented based on quadrant classifiers of fetal heart rate, although the various classification of the main limit had utilized cardiotocography.
Materials and Methods
This section focuses on the research methods: data preprocessing, feature extraction and classification algorithms using MATLAB source code development, and validation of obtained results. The study tasks in this section were implemented in five major steps to meet the research objectives, selection, and description of CTG datasets, enhancement of CTG datasets, FHR feature extraction, CTG classification, and validation techniques.
This section focuses on the research methods: data preprocessing, feature extraction and classification algorithms using MATLAB source code development, and validation of obtained results. The article tasks in this section were implemented in five major steps to meet the research objectives, selection and description of CTG Datasets, enhancement of CTG Datasets, FHR feature extraction, CTG classification and validation techniques.
Description of data sets
Table 1 displayed the FHR patterns as normally classified as reassuring, non-reassuring, or irregular. Furthermore, as indicated in Table 2, the FHR marks may be categorized as normal, suspicious, or pathological and are dependent upon the outcomes of the categorization.
| Baseline | Variability | Deceleration | Acceleration | |
|---|---|---|---|---|
| Reassuring | 110–160 b.p.m. | >=5 b.p.m. | None | present |
| Non-reassuring | 100–109 b.p.m. 161–180 b.p.m. |
<=5 b.p.m. for exceeding 40 min and less than 90 min | Early deceleration Variable deceleration Single prolong deceleration up to 3 min |
No acceleration with an already normal CTG is of dubious significance. |
| Abnormal | <100 b.p.m. >180 b.p.m. Sinusoidal pattern for more than 10 minutes |
<5 b.p.m. exceeding 90 min | Late deceleration A commonly found variable deceleration Single prolong deceleration exceeding 3 min |
| Category | Definition |
|---|---|
| Normal | A CTG with the entire four features ccategorized in the reassuring category |
| Suspicious | A CTG with features categorized under one of the non-reassuring categories, and the remainder of the features categorized under the reassuring category |
| Pathological | A CTG with features categorized under two or more of the non-reassuring categories or two or more features categorized under the abnormal category |
Various CTG trace patterns are depicted in Fig. 1. The proposed algorithm was tested utilizing three CTG data signal collectives in this study. The first collection of 50 CTG data for the one-hour duration was downloaded from (www.kaggle.com/datasets), This collection of 50 CTG data was adjusted (referred to as semi-synthetic signals) to include all baseline categories such as regular, bradycardia, and tachycardia baseline (Ayres-de-campos et al., 2000). The second set contains 50 CTG signals derived from the previous set (termed as synthetic signals). In some of the chosen CTG signals, modified semi-synthetic (S1–S50) and synthetic (S51–S100) signals are used to address all required aspects in CTG data, such as acceleration and deceleration (late and early deceleration). In a study by Al-Yousif et al. (2021), the researchers had obtained 50 clinical data samplings (S101–S150) in the third collection. The three sets of CTG signals were provided to two collectives of obstetricians based on Al-Yousif et al. (2021); the first collective included two experts (specialists 1 and 2), and the second group comprised of three specialists (comprising of specialists 3, 4, & 5). The computation of the following CTG signal parameters was executed by the obstetricians, which consists of baseline, uncertainty, acceleration, and deceleration, as well as to share their perceptions on the categorization of the CTG.
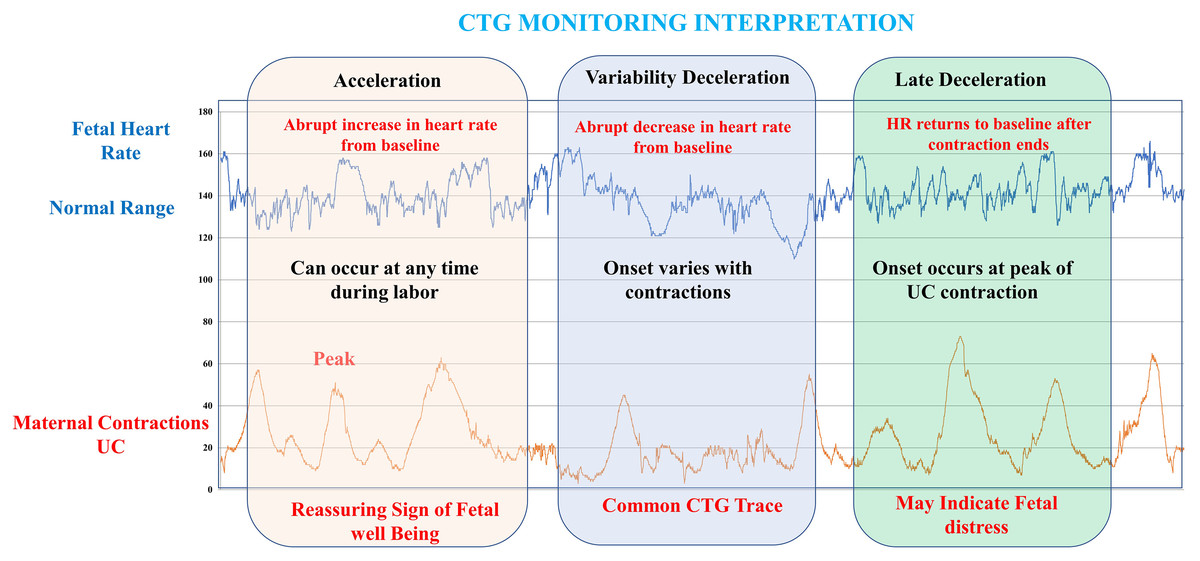
Figure 1: Information on various CTG trace patterns.
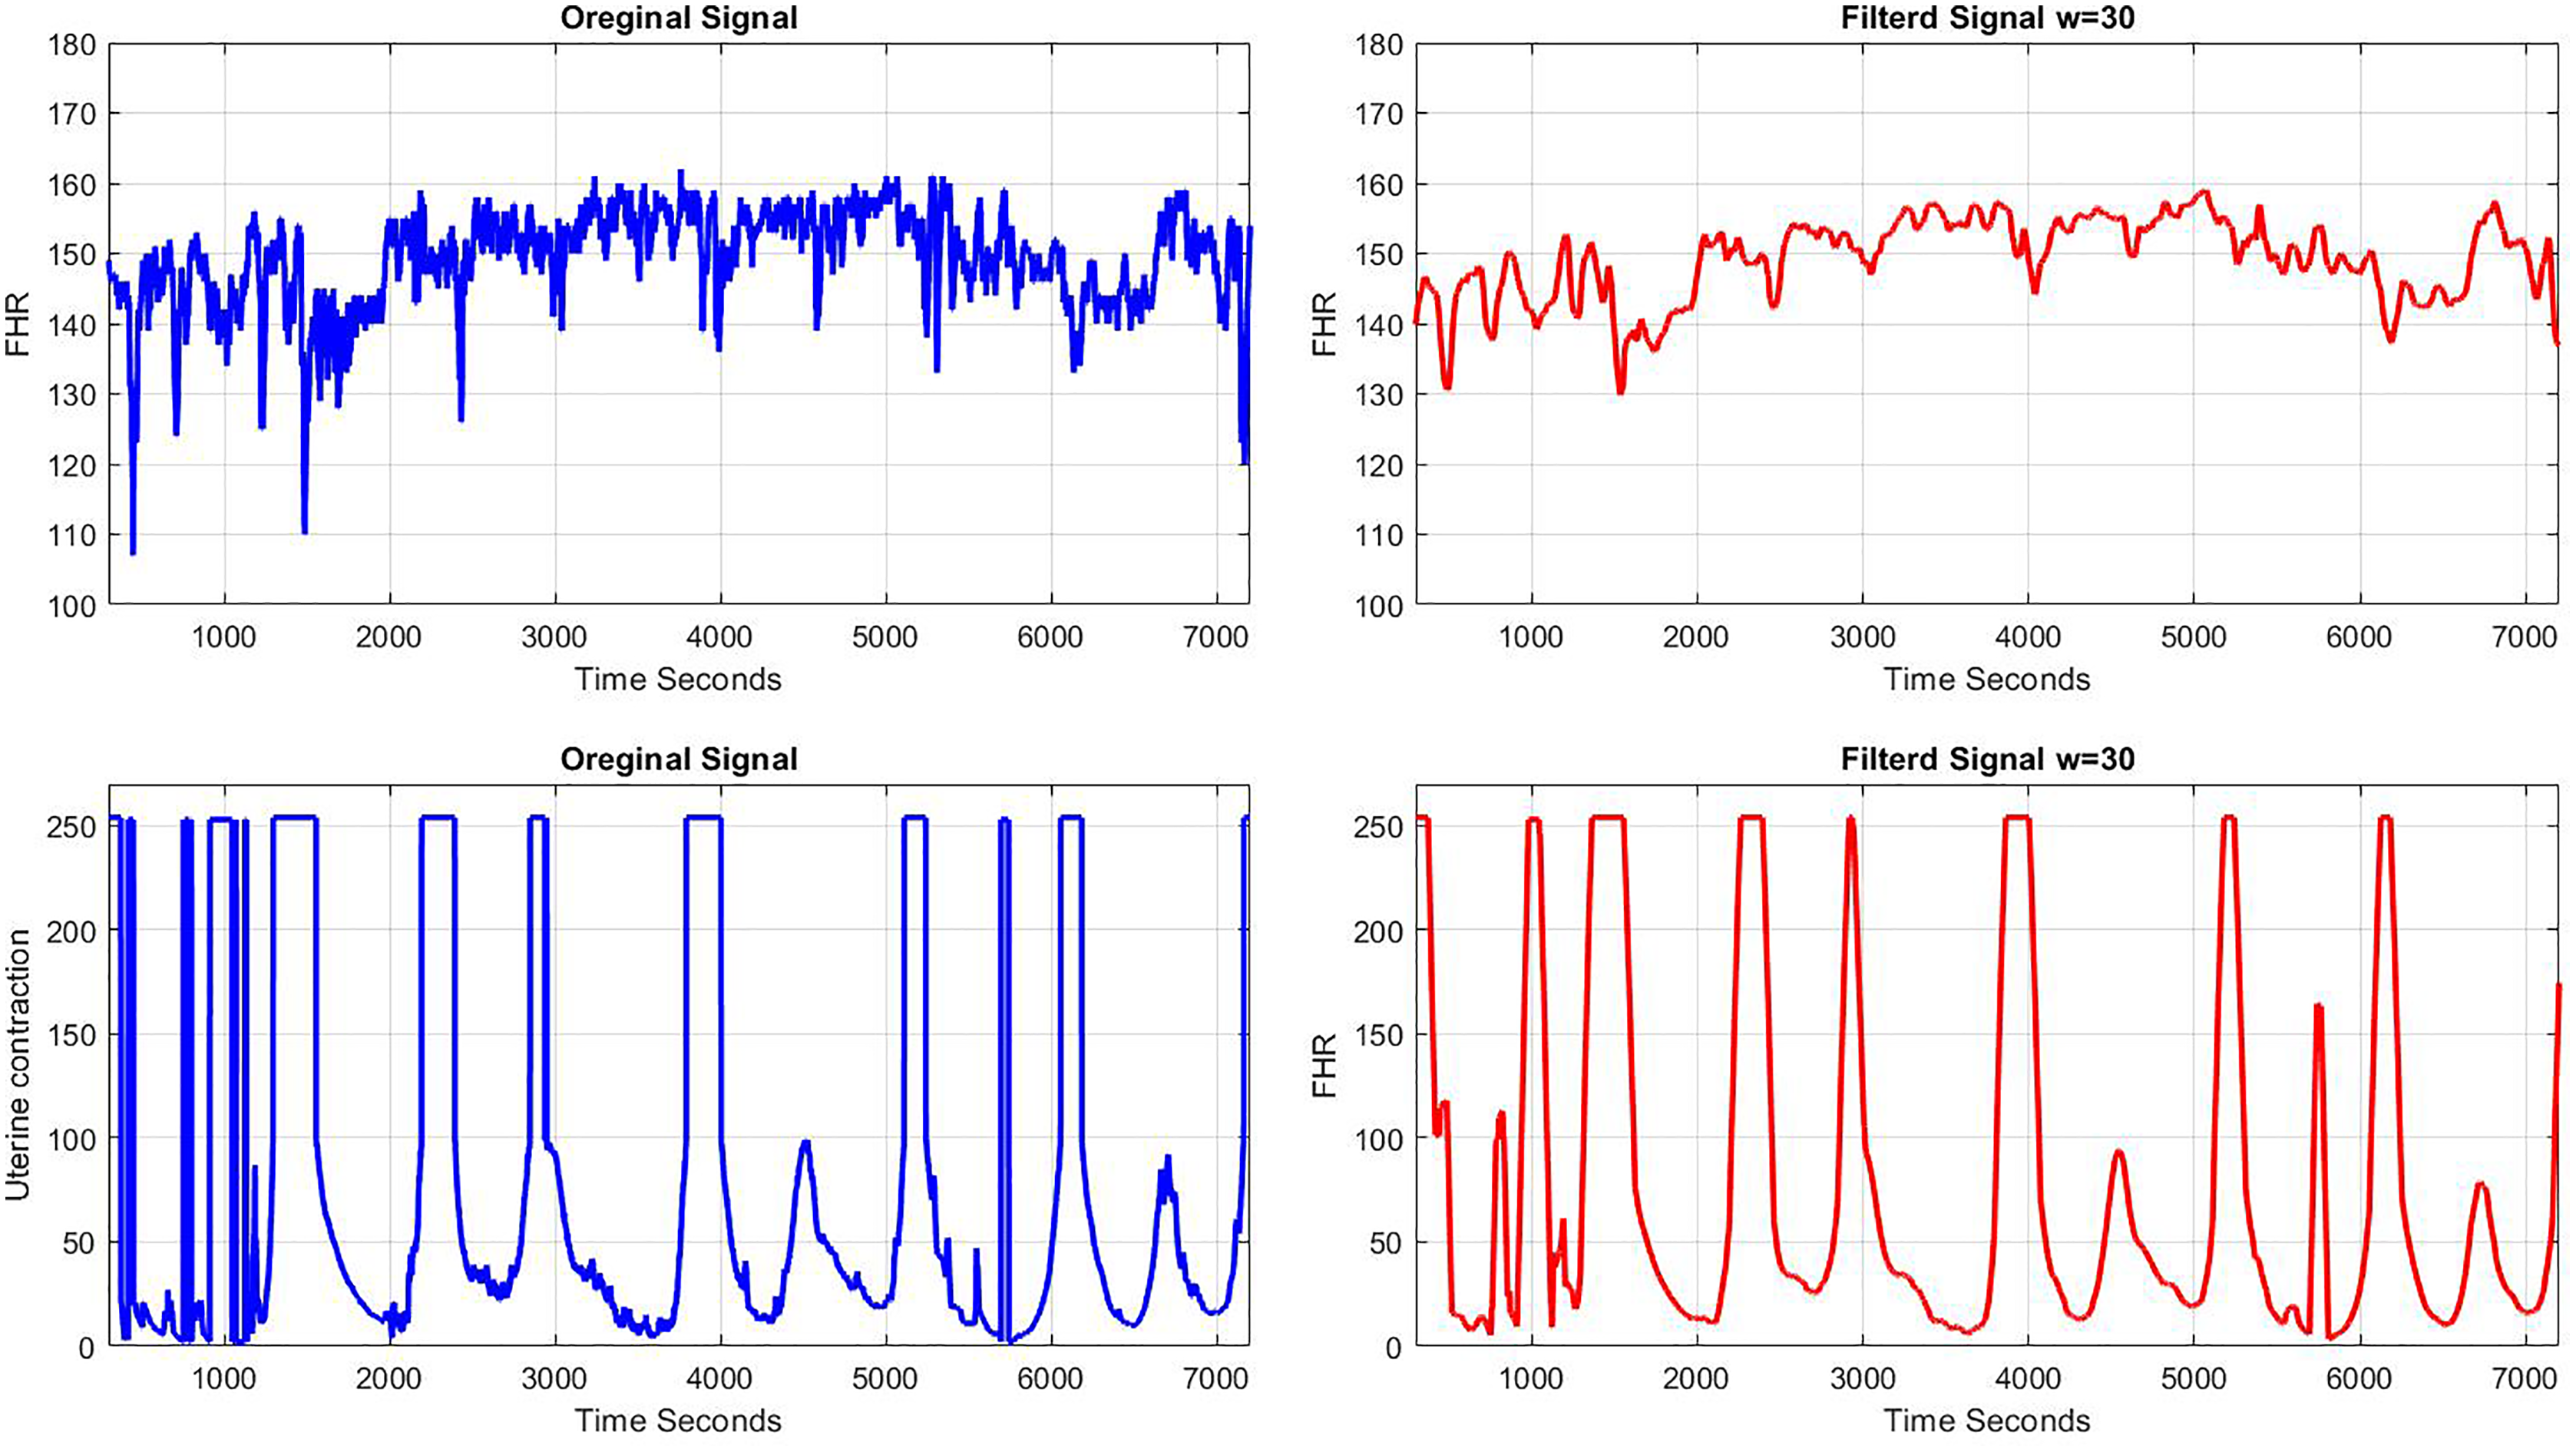
The collected computerized results were compared to the two groups of experts’ estimated results. In instances of fetal movements or when the transducer is used incorrectly while tracking and obtaining CTG data transmissions, CTG signals are noisy and include spiky objects. A sample is missing in the input signal, and the graph has collapsed to zero (missing beats). An if statement is employed by the signal condition-stage, in the MATLAB source code to remove the breakdown to zero. In the signal processing stage, the CTG signals are conditioned by eliminating spiky artifacts according to a technique specified by Al-Yousif et al. (2021). The technique identifies the initial stable FHR segments, which are defined as segments with lower than 10 b.p.m. difference among five consecutive samples. Linear interpolation between the first of those two signals and the beginning of a new FHR consistent segment is used in the event of the occurrence of the difference between five consecutive samples exceeding 25 b.p.m. Signal strength is measured by the number of interpolated points (Bernardes et al., 1991; Freeman Roger et al., 2012). The amount of values fewer than 50 b.p.m. is tallied to determine signal loss. In this study, a moving average filter was used to enhance CTG signals, and the appropriate value for the filter window size w is calculated in this section. The window size should be between 30 and 50 points, according to the statistics. In this study report, experts picked w = 30 for the moving average filter because it delivers the greatest visual depiction. As w exceeds 50, the shape of CTG data is distorted, and essential features such as uncertainty, accelerations and forms, and deceleration are lost (Bernardes et al., 1991). Using a moving average filter to remove spiky signals from the FHR and UC, much of the high-frequency noise that impairs contraction detection was removed (Bernardes et al., 1991; Garabedian et al., 2017). The use of the moving average filter in MATLAB source code to enhance the CTG dataset produced good results, allowing specialists to decipher the CTG datasets. The developed technique that uses algorithm as filters sifts out undesired spiky signals and adjusts for missing data, which might interfere with expert interpretation and extrication of CTG characteristics.
FHR feature extraction
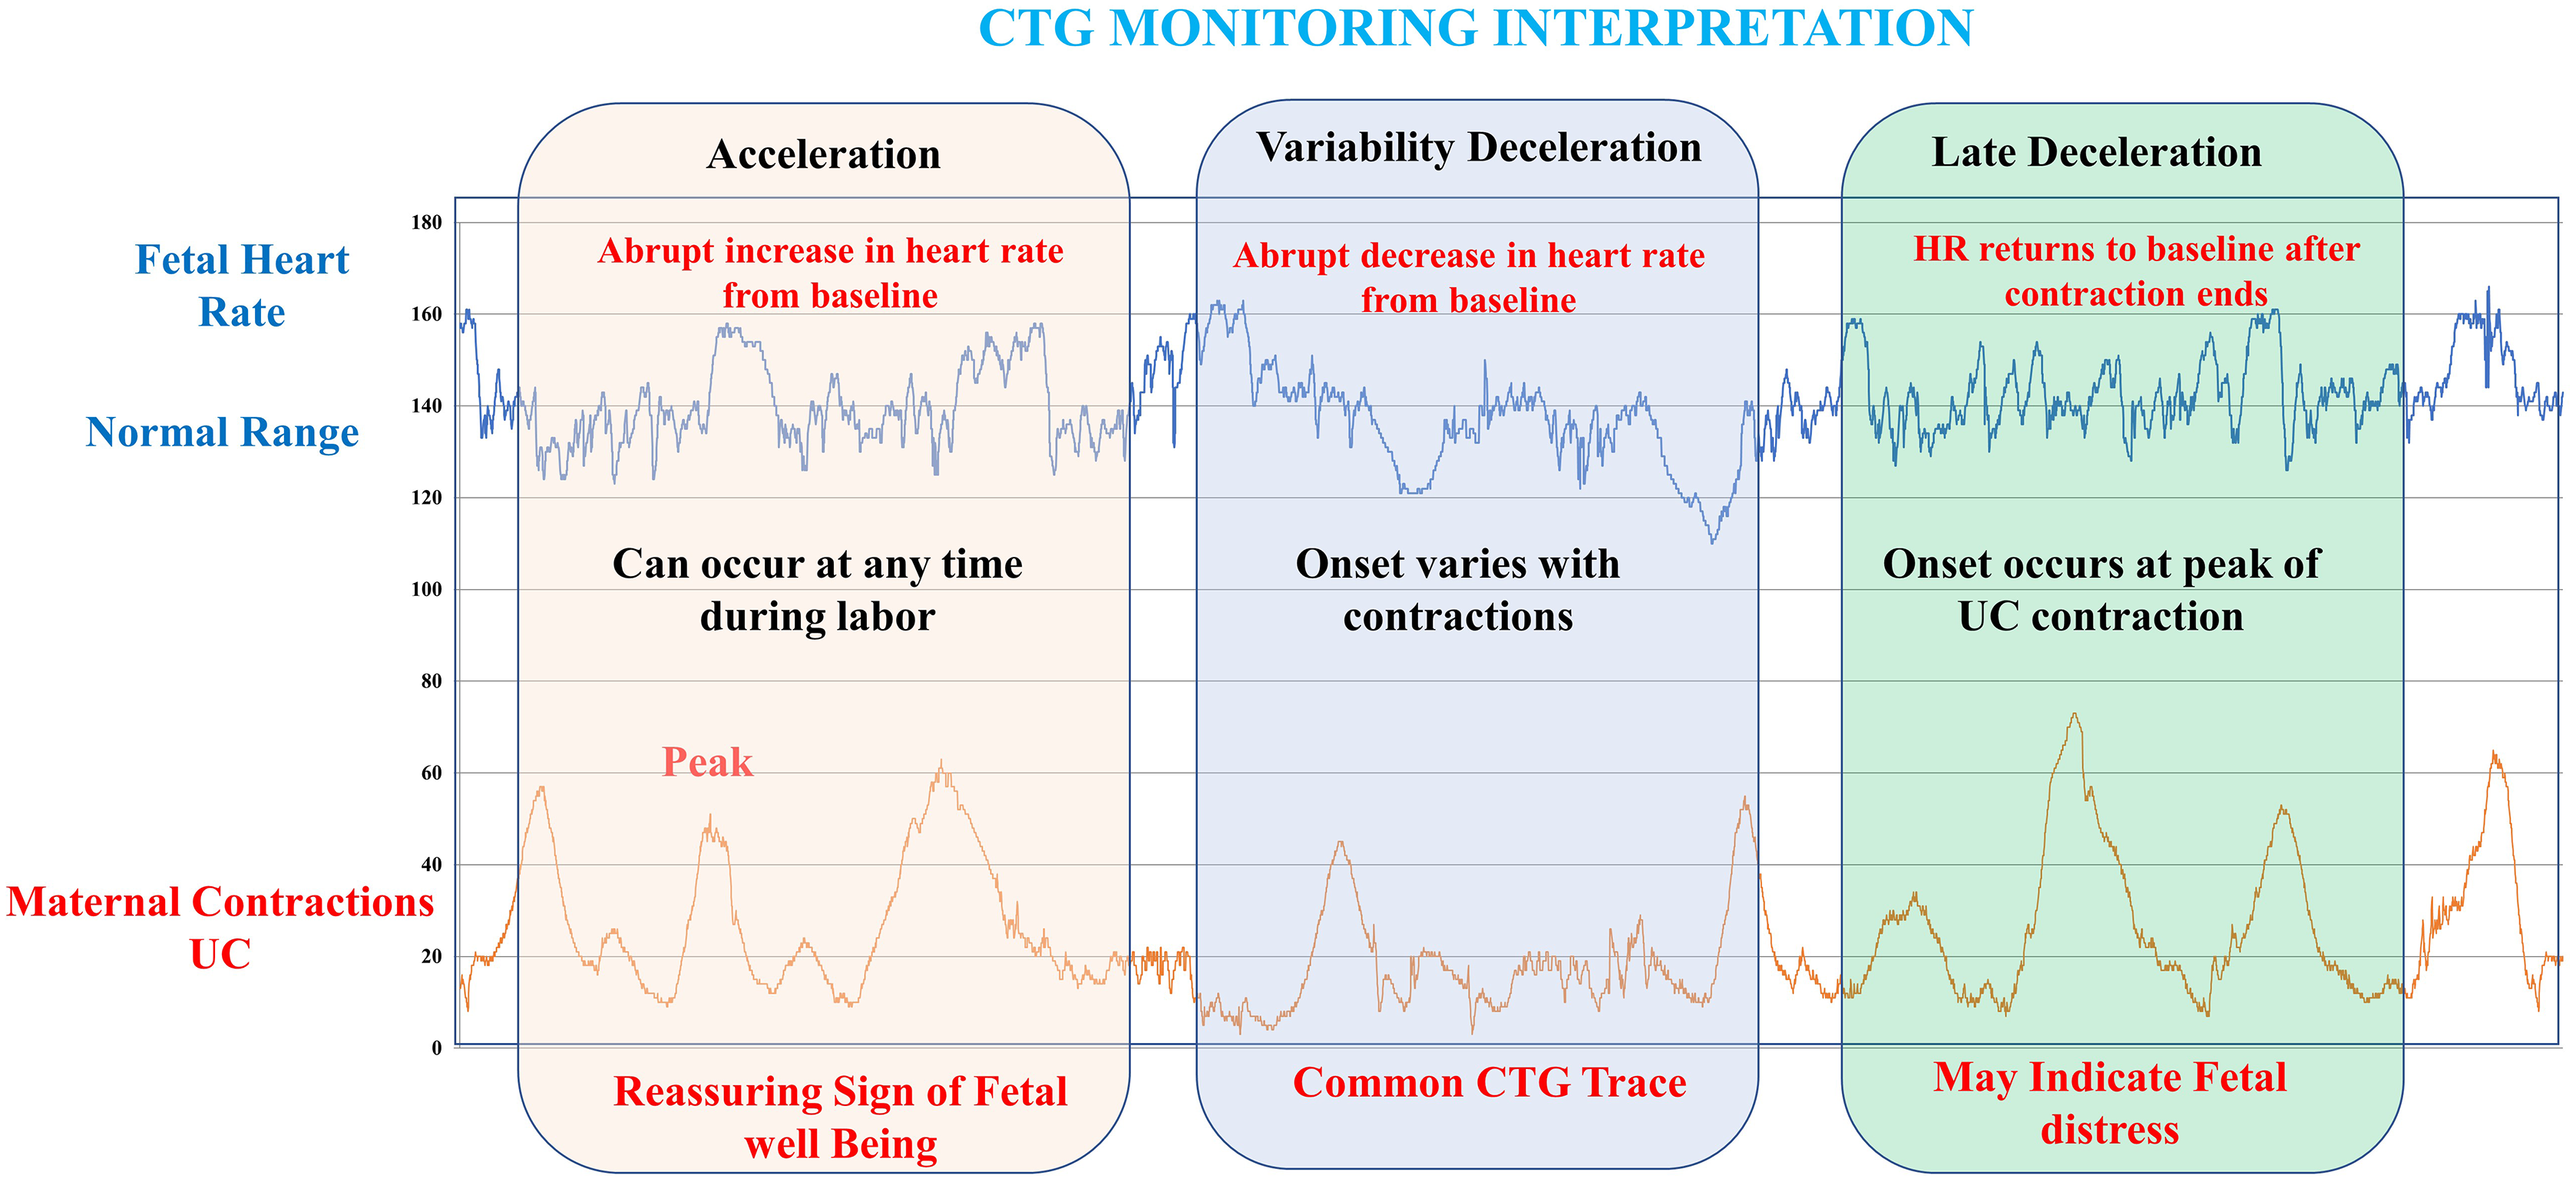
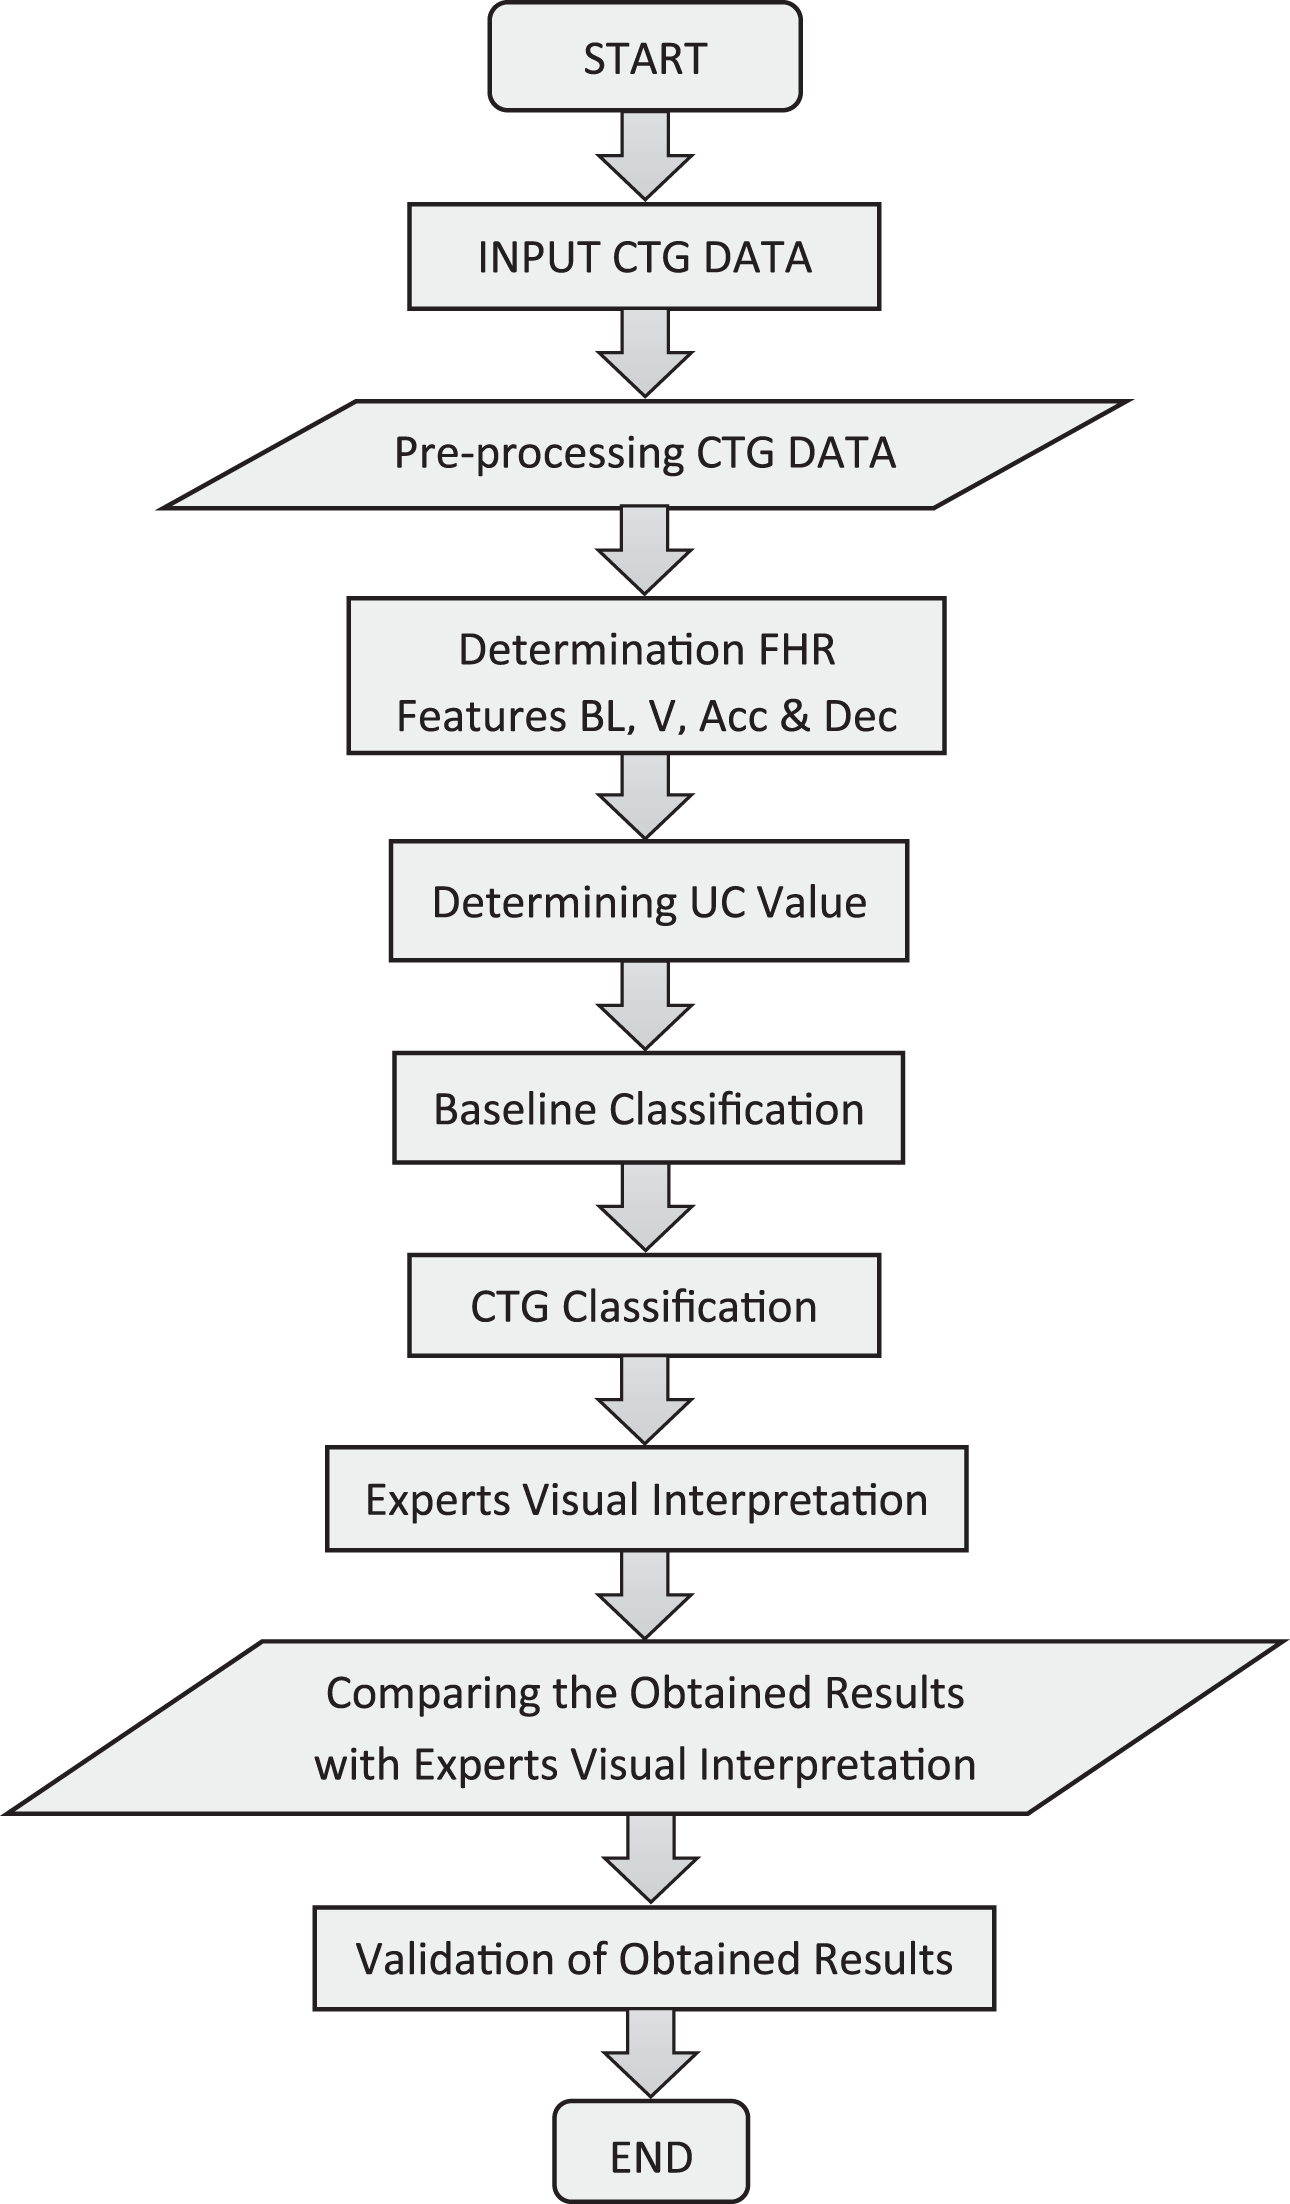
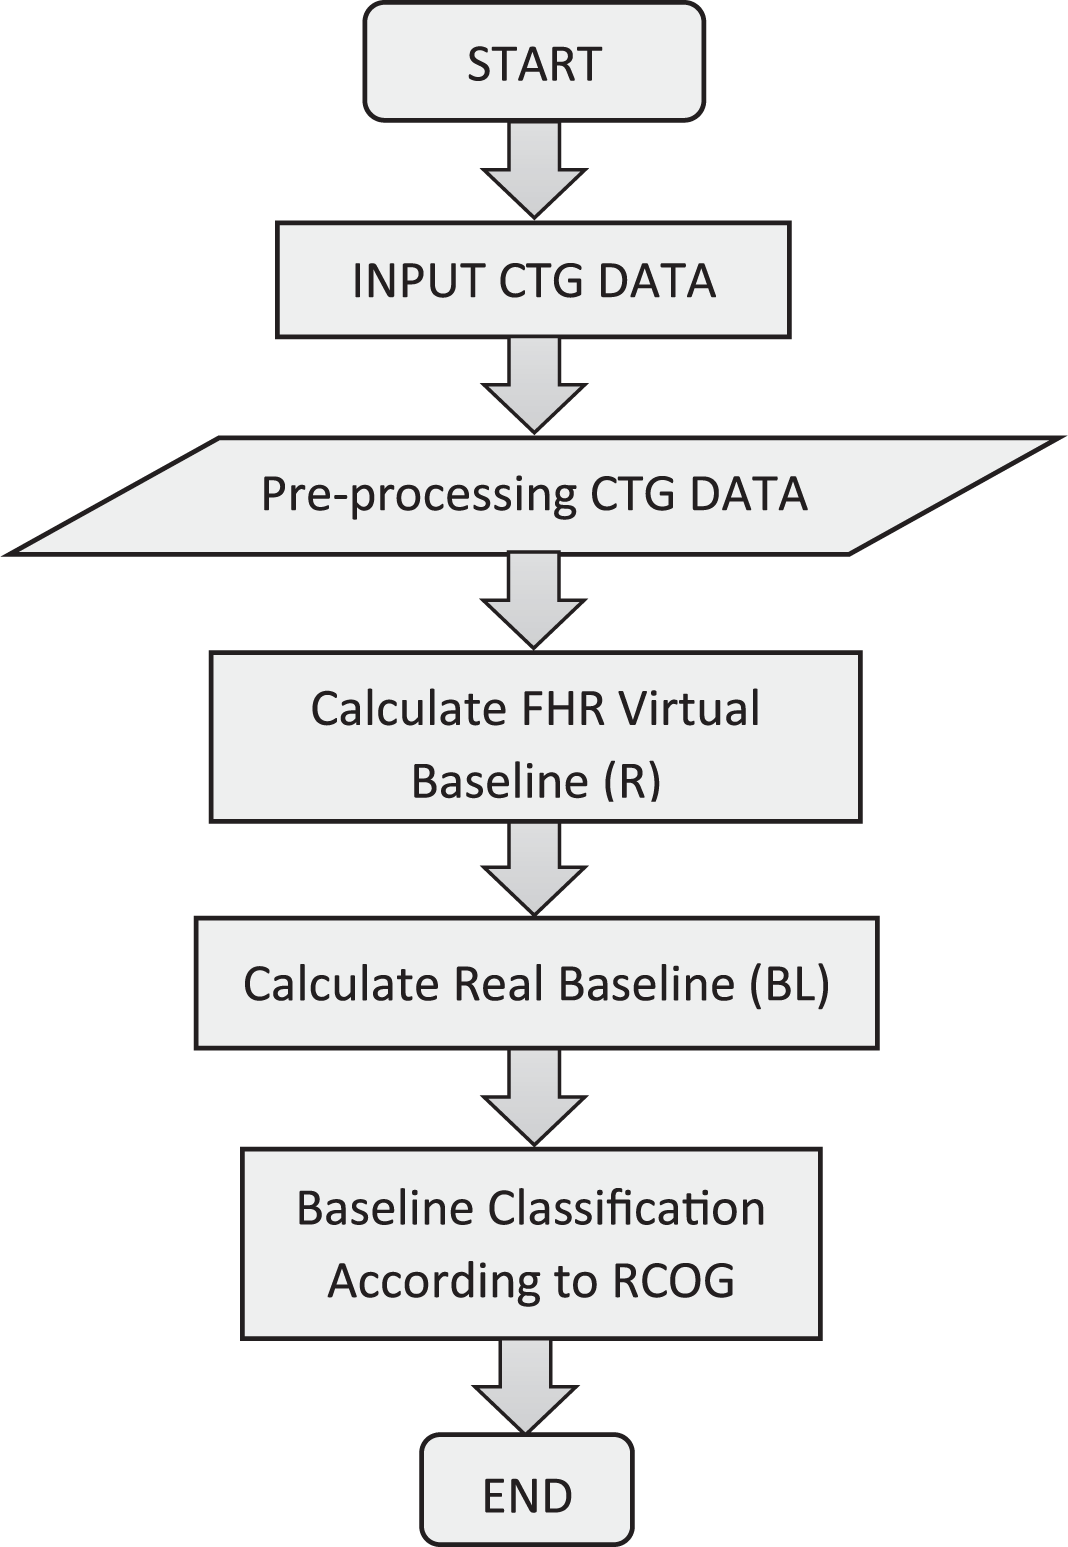
This section discusses the approaches used to extract the FHR and UC properties. One of the most critical processes in CTG signal analysis is feature extraction since it extracts all relevant information about the fetal condition and categorizes the CTG signal based on that information. Using EFM principles, numerous kinds of characteristics, like time and frequency domain and aspects according to morphology, have been obtained from the FHR signal (Várady et al., 2003). Figure 2 depicts an approach for obtaining FHR characteristics as well as a CTG classification scheme predicated on RCOG recommendations. The MATLAB source code and Excel file were used to design and implement all feature extraction and classification algorithms.
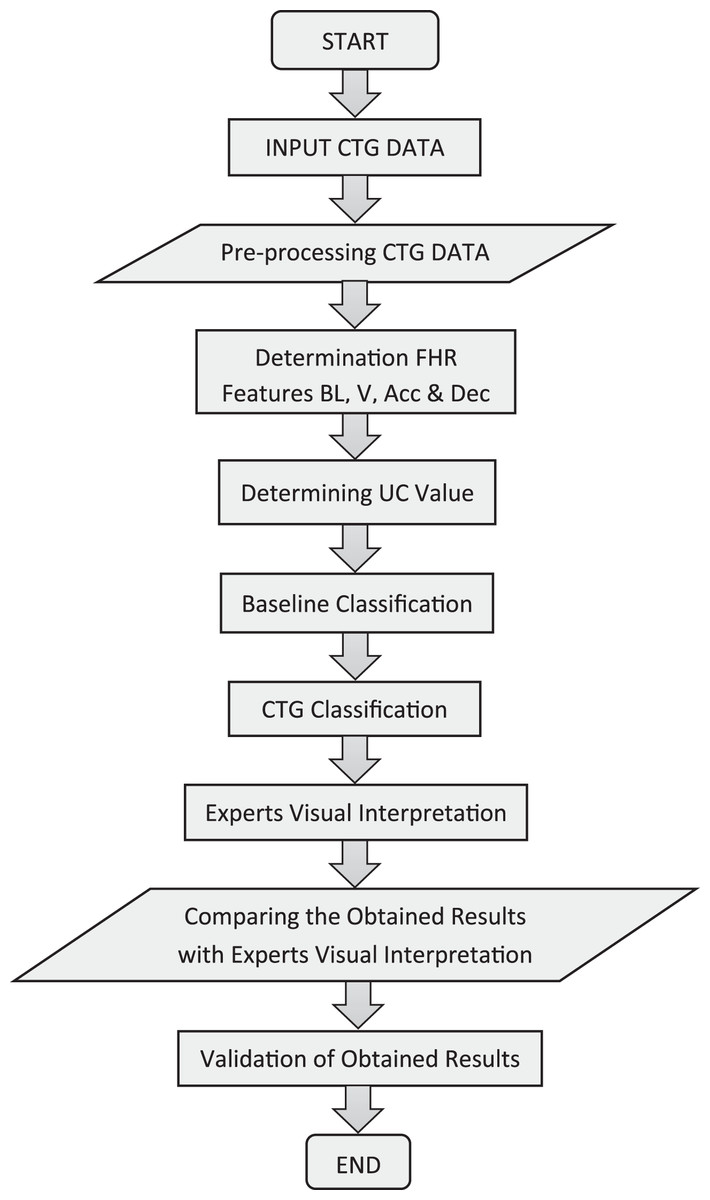
Figure 2: Overall procedures for feature extraction and classification system.
CTG morphological characteristics such as baseline, baseline variability, acceleration, and deceleration are the most significant set of variables generated from FHR signals. In regular practice, clinicians assess these FHR traits visually for estimation and diagnosis.
Method of baseline estimation
The baseline is the most significant characteristic of the FHR since it is the foundation for all other aspects. In the discipline of obstetrics, the baseline is a notional lineage created across the FHR tracing that spans additional locations in the FHR signal trace. Computerized baseline estimation, according to the research, is a huge challenge. There is presently no consensus on the optimal method for determining the optimum baseline value (Krupa, 2010). Therefore, a new approach for determining the baseline is presented and thoroughly developed, taking into consideration some of the aspects considered crucial by obstetricians during a visual inspection. Figure 3 depicts the technique used to measure the actual baseline. In this study, a virtual imaginary baseline R is used, that can be equated to the FHR signal mean value across a 30-min segment, as shown in Eq. (1):
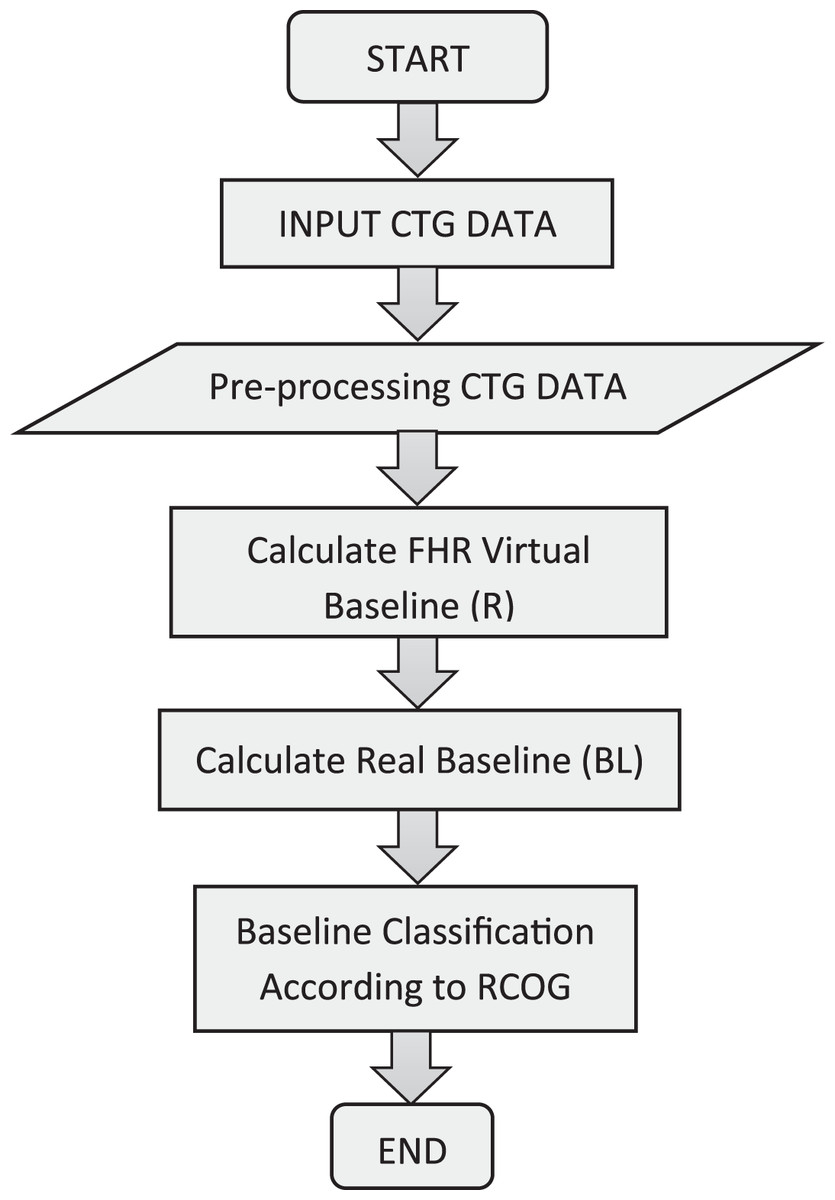
Figure 3: Baseline algorithm procedures.
(1) where the number of samples is N, and the CTG Signal is .
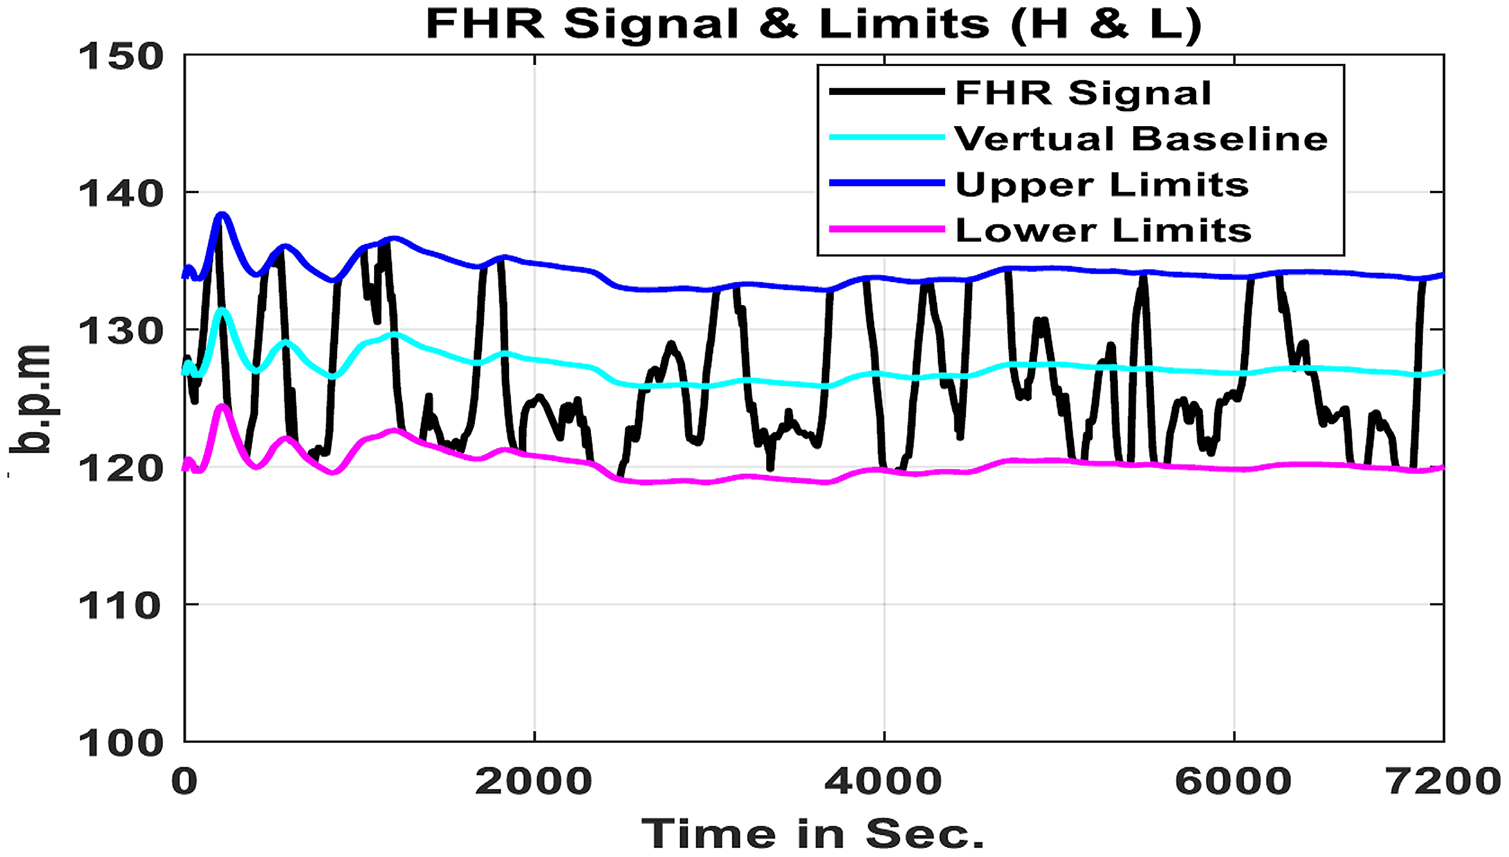
The true baseline BL is calculated using this virtual baseline as a reference. This work is based on the MATLAB source code and evaluates the limits of an FHR signal virtual imaginary baseline as well as restricting the input FHR signal minimum and maximum values to be collected in the evaluation under particular periods according to the descriptions of the RCOG framework as shown in Figure 4 (Garabedian et al., 2017).
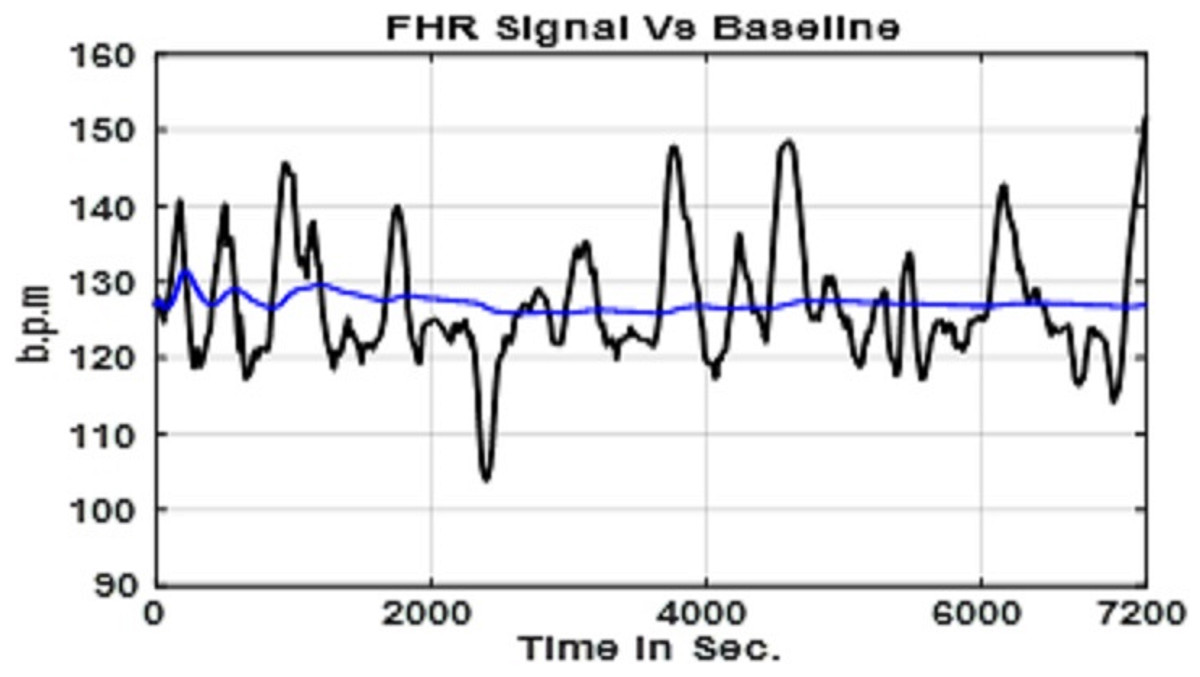
Figure 4: FHR signal with the virtual baseline value R.
The first step in the computation is to determine the value of (R), which is the mean of a 30-min section of the FHR signal. In the second stage of the computation, as indicated in the equation, the minimum (L) and maximum (H) limits of the FHR signal are calculated in the Eqs. (2) and (3).
(2)
(3)
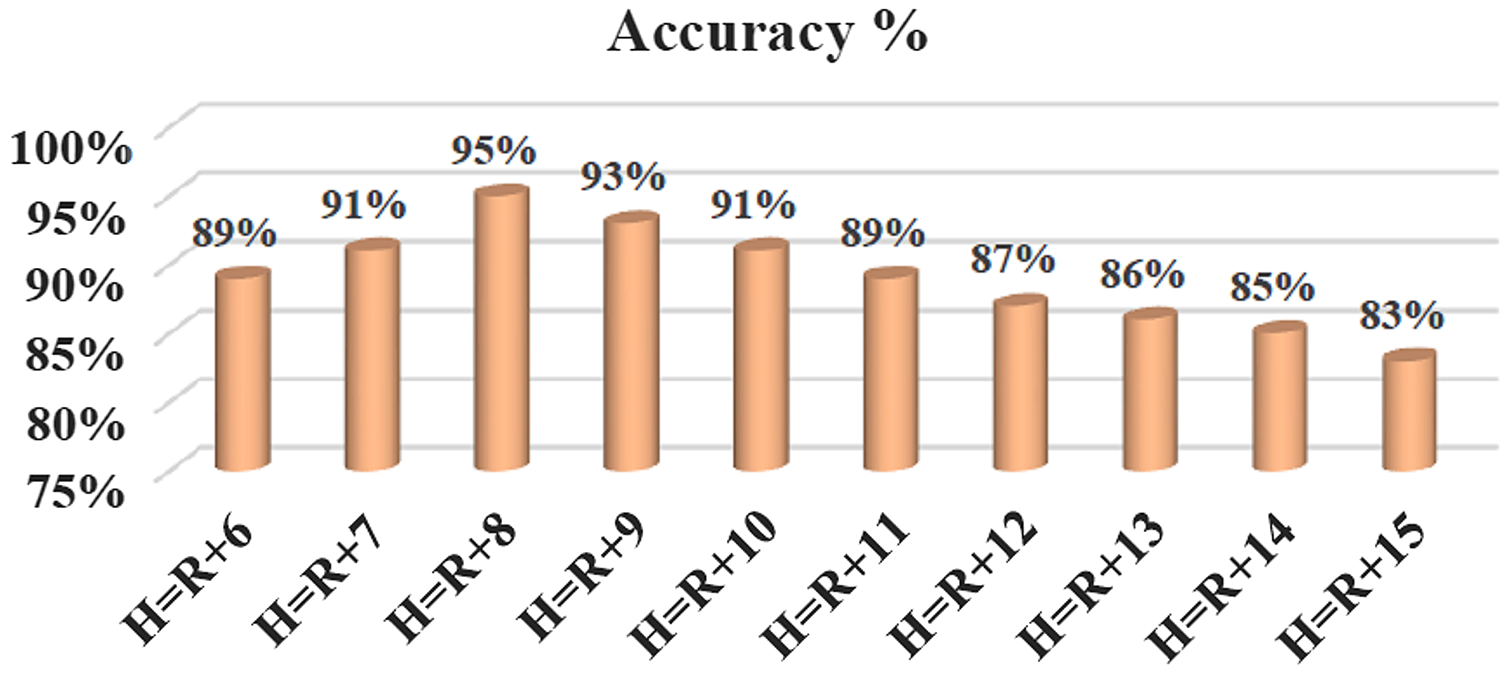
The b.p.m. value determined by the studies described in the following paragraphs is α. When the maximum and minimum limitations are established, any value above (H) or below (L) is disregarded. To calculate the real baseline BL, within the restrictions, the remainder FHR signal will undergo processing. The optimal value of (α) is determined by doing tests with various values of (α) ranging from 1 to 15 b.p.m., added and removed from the virtual baseline. A comparison is made between the collected findings to expert judgments to identify the most credible true baseline outcome; Tables 3 and 4 provide the virtual baseline outcomes for 15 chosen CTG data sets.
| Signals | Interpreted baseline (b.p.m.) | |||||||||
|---|---|---|---|---|---|---|---|---|---|---|
| Expert 1 | Expert 2 | Krupa (2010) | This work for different values of (W) | |||||||
| W = 5 | W = 10 | W = 20 | W = 30 | W = 50 | W = 70 | W = 100 | ||||
| S1 | 130 | 130 | 132 | 120 | 125 | 127 | 129 | 133 | 138 | 164 |
| S4 | 130 | 130 | 131 | 127 | 129 | 130 | 132 | 136 | 139 | 159 |
| S8 | 130 | 130 | 128 | 122 | 124 | 126 | 128 | 131 | 132 | 145 |
| S10 | 120 | 125 | 125 | 120 | 124 | 123 | 124 | 126 | 127 | 141 |
| S15 | 120 | 120 | 125 | 120 | 122 | 124 | 125 | 129 | 129 | 149 |
| S18 | 130 | 130 | 133 | 126 | 128 | 129 | 132 | 136 | 136 | 142 |
| S20 | 140 | 140 | 140 | 132 | 135 | 136 | 138 | 142 | 142 | 164 |
| S22 | 145 | 145 | 152 | 137 | 141 | 143 | 145 | 149 | 147 | 174 |
| S26 | 145 | 145 | 147 | 140 | 141 | 142 | 145 | 150 | 149 | 159 |
| S28 | 130 | 130 | 132 | 127 | 129 | 130 | 132 | 136 | 136 | 152 |
| S32 | 140 | 140 | 138 | 134 | 137 | 139 | 141 | 146 | 145 | 167 |
| S37 | 130 | 130 | 128 | 121 | 125 | 127 | 129 | 134 | 133 | 156 |
| S40 | 130 | 132 | 134 | 122 | 129 | 130 | 133 | 139 | 137 | 162 |
| S45 | 130 | 130 | 133 | 124 | 127 | 128 | 130 | 135 | 134 | 159 |
| S50 | 140 | 140 | 140 | 132 | 137 | 139 | 142 | 147 | 147 | 152 |
| No | Signals | Expert 1 | Expert 2 | Krupa (2010) | This work |
|---|---|---|---|---|---|
| 1. | S1 | 130 | 130 | 132 | 129 |
| 2. | S2 | 130 | 130 | 131 | 132 |
| 3. | S9 | 145 | 145 | 147 | 145 |
| 4. | S10 | 130 | 130 | 132 | 132 |
| 5. | S11 | 140 | 140 | 138 | 141 |
| 6. | S12 | 130 | 130 | 128 | 129 |
| 7. | S13 | 130 | 131 | 134 | 133 |
| 8. | S14 | 130 | 130 | 133 | 130 |
| 9. | S15 | 130 | 130 | 132 | 129 |
| 10. | S16 | 130 | 130 | 131 | 132 |
| 11. | S24 | 130 | 130 | 132 | 132 |
| 12. | S25 | 140 | 140 | 138 | 141 |
| 13. | S26 | 130 | 130 | 128 | 129 |
| 14. | S27 | 130 | 131 | 134 | 133 |
| 15. | S28 | 130 | 130 | 133 | 130 |
| 16. | S29 | 140 | 140 | 140 | 142 |
| 17. | S30 | 120 | 122 | 125 | 124 |
| 18. | S37 | 130 | 130 | 128 | 129 |
| 19. | S38 | 130 | 131 | 134 | 133 |
| 20. | S39 | 120 | 120 | 125 | 125 |
| 21. | S48 | 145 | 145 | 152 | 145 |
| 22. | S49 | 120 | 122 | 125 | 124 |
| 23. | S50 | 130 | 130 | 132 | 132 |
As indicated in Fig. 5, the ideal value of (α) is 8 b.p.m., which provides the best outcomes and has a 95% precision rate. The precision is established by comparing the measured actual baseline value to the average baseline value of the experts. The FHR signal limitations (H & L) determined from a truncated FHR signal are indicated in Fig. 6 (Alsaggaf et al., 2020; Krupa, 2010).
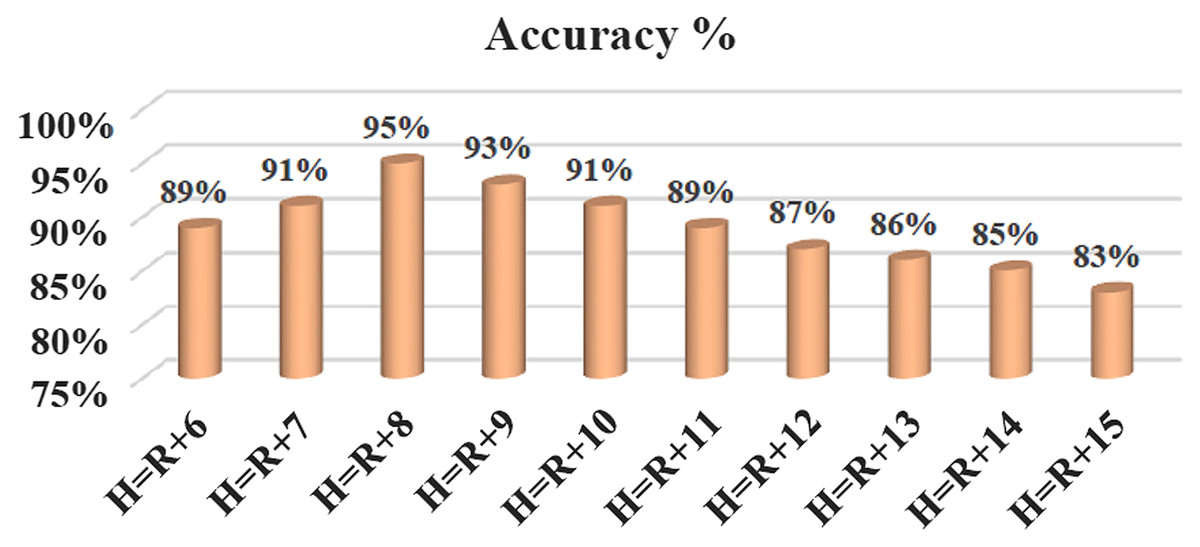
Figure 5: New signal limitations in terms of accuracy, where α = 1, 2, 3 … 15.
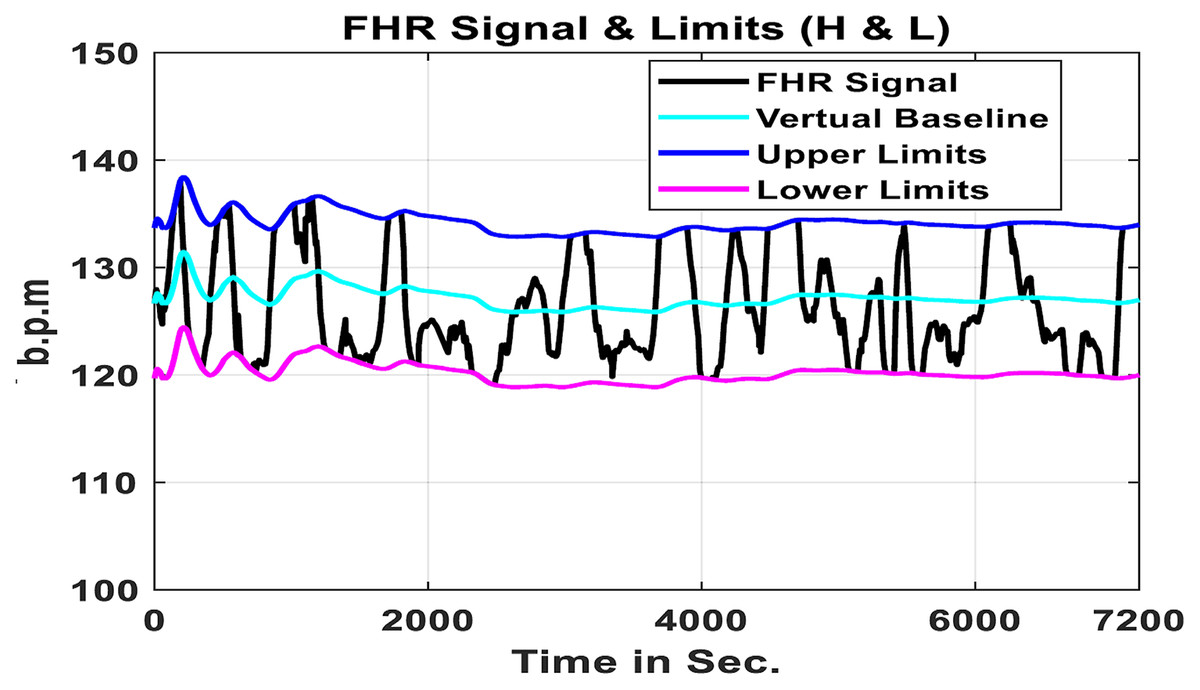
Figure 6: Limitations of algorithms.
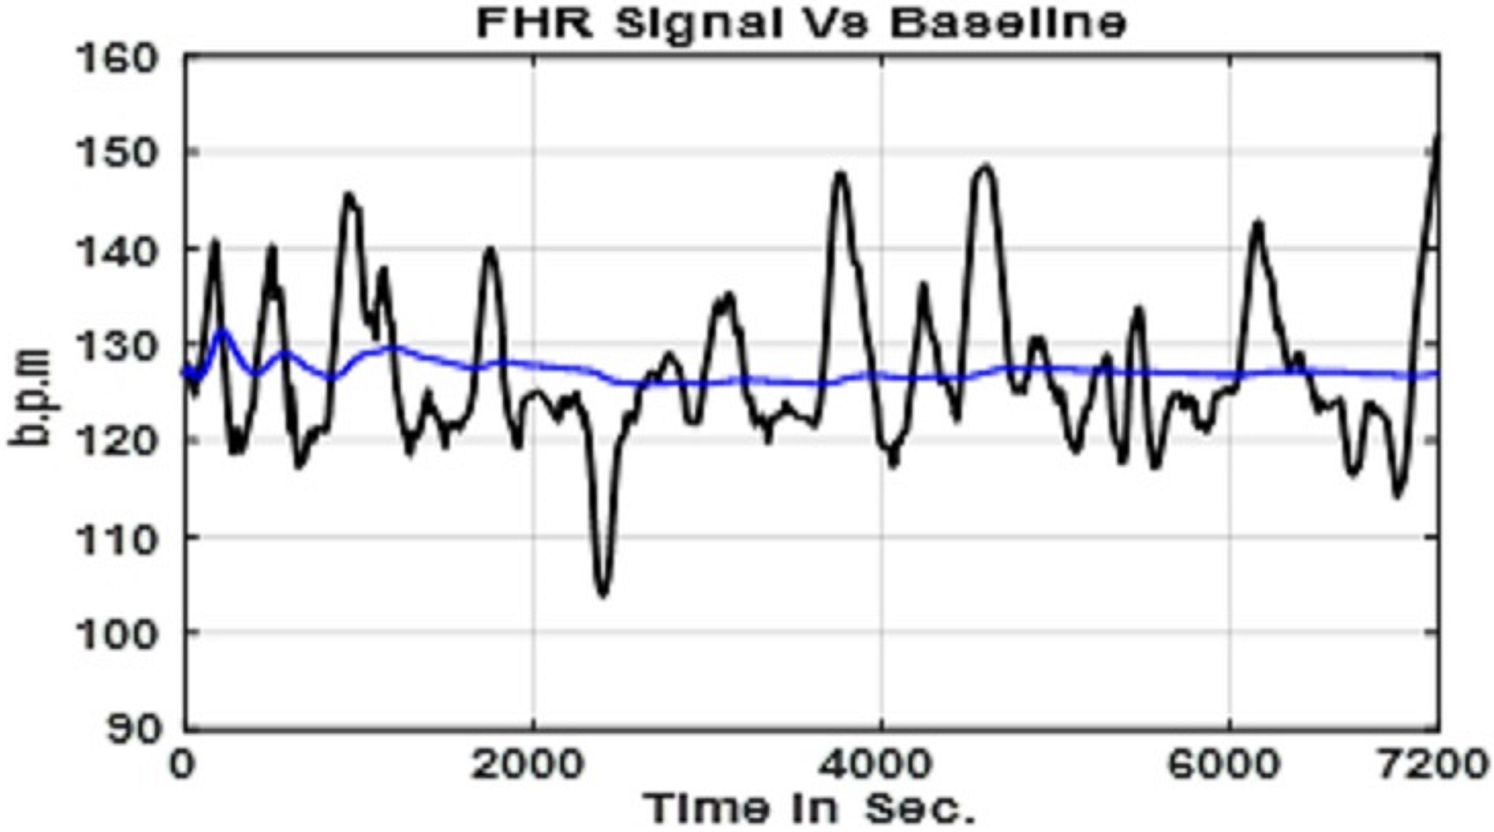
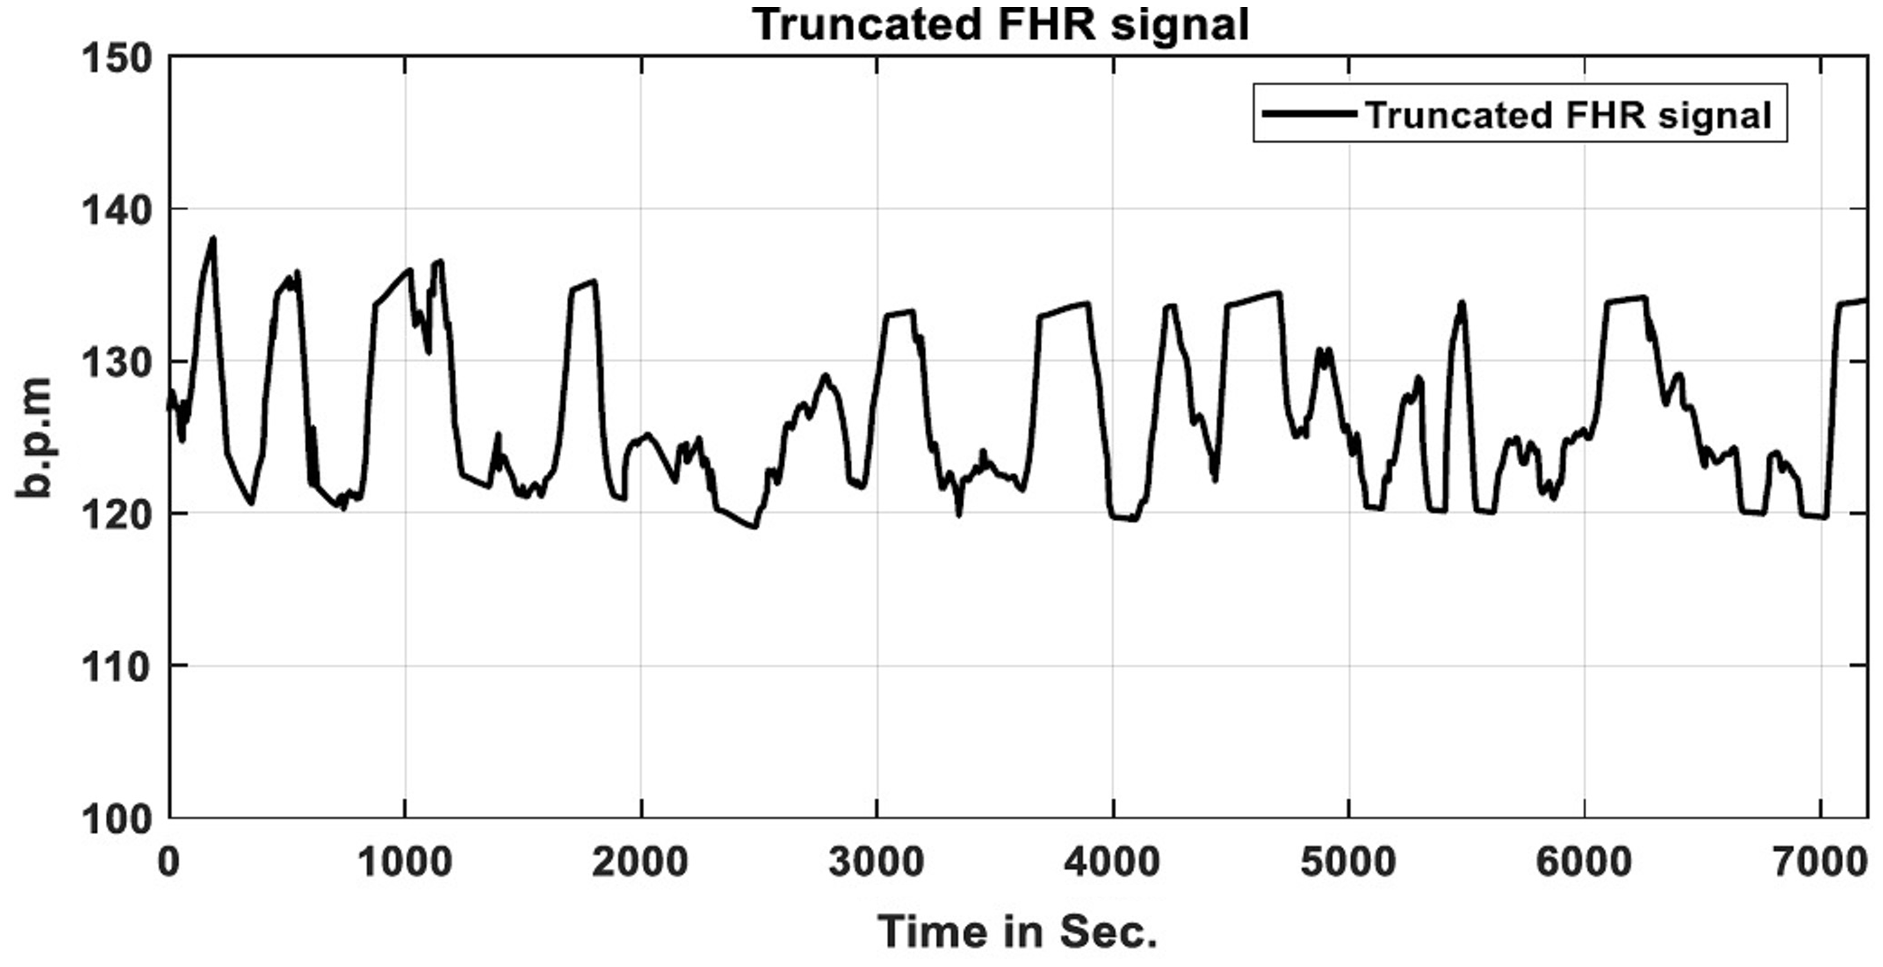
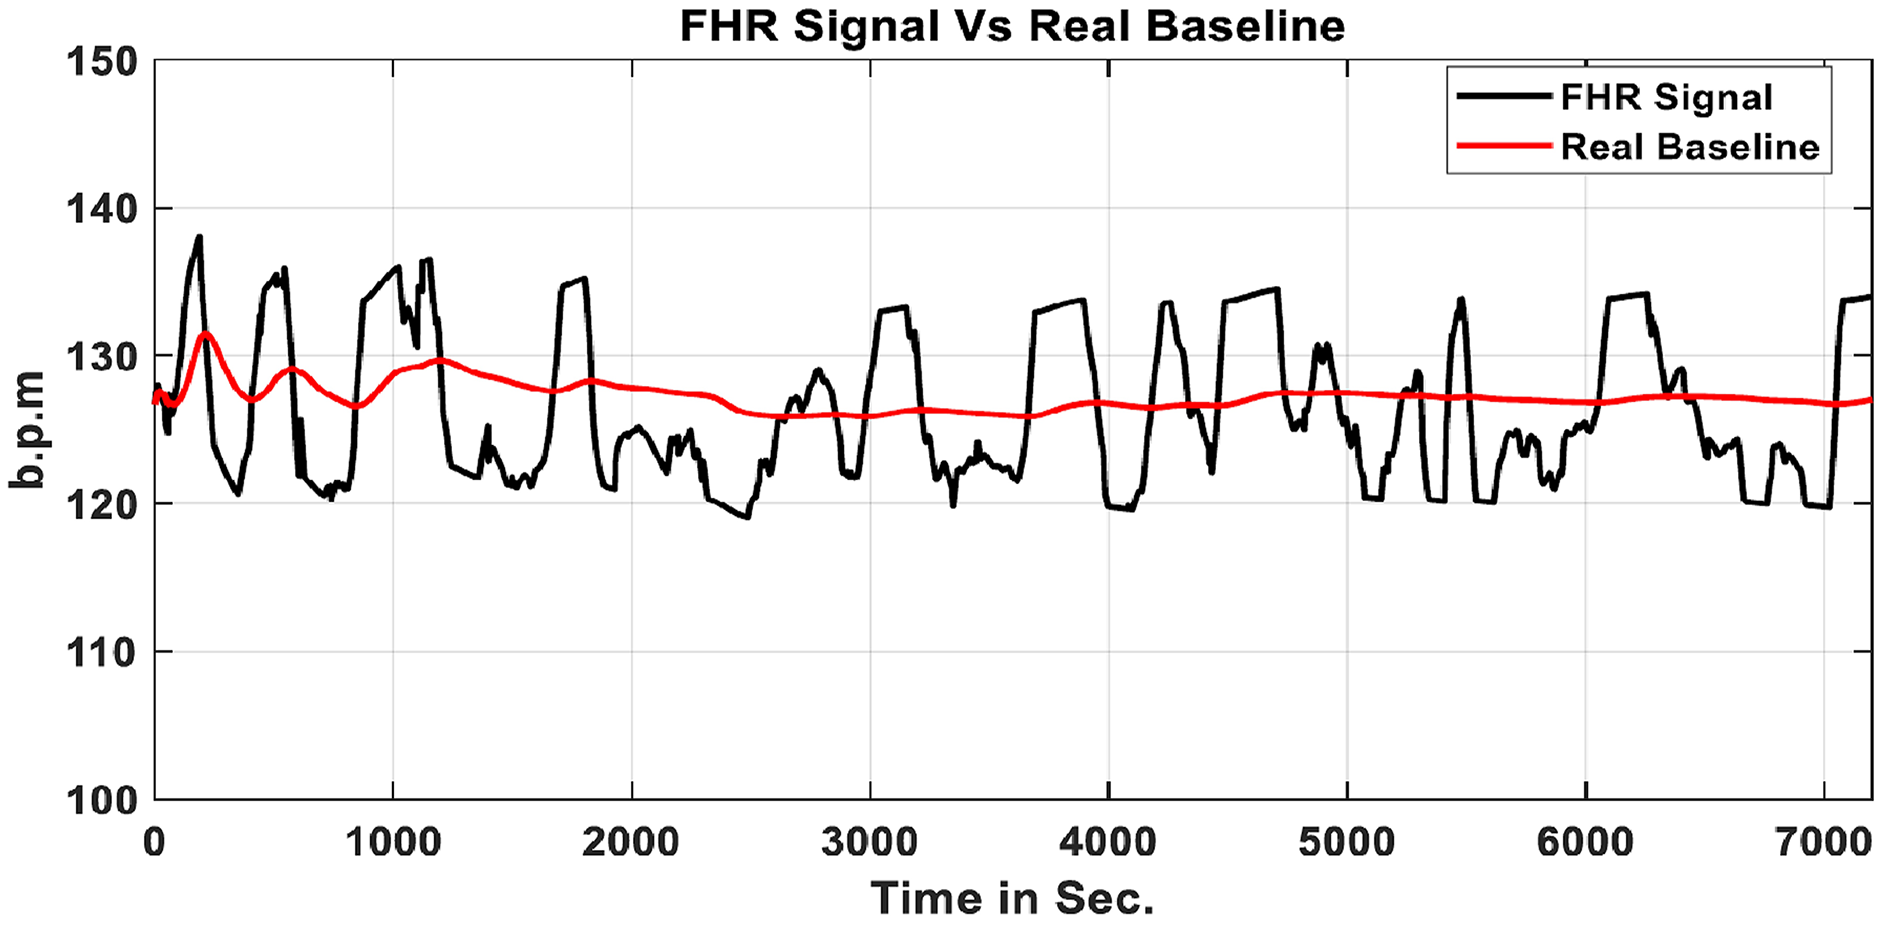
A truncated FHR signal with no acceleration or deceleration variations. According to the RCOG definition, the actual baseline may be computed using this processed FHR signal is shown in Fig. 7 (Cömert et al., 2019a). The developed algorithm calculates the baseline value and classifies it as reassuring, non-reassuring, or abnormal. The choice is made in line with the (RCOG) recommendations, as stated in Table 1. Figure 8 compares the FHR signal to a real baseline BL.
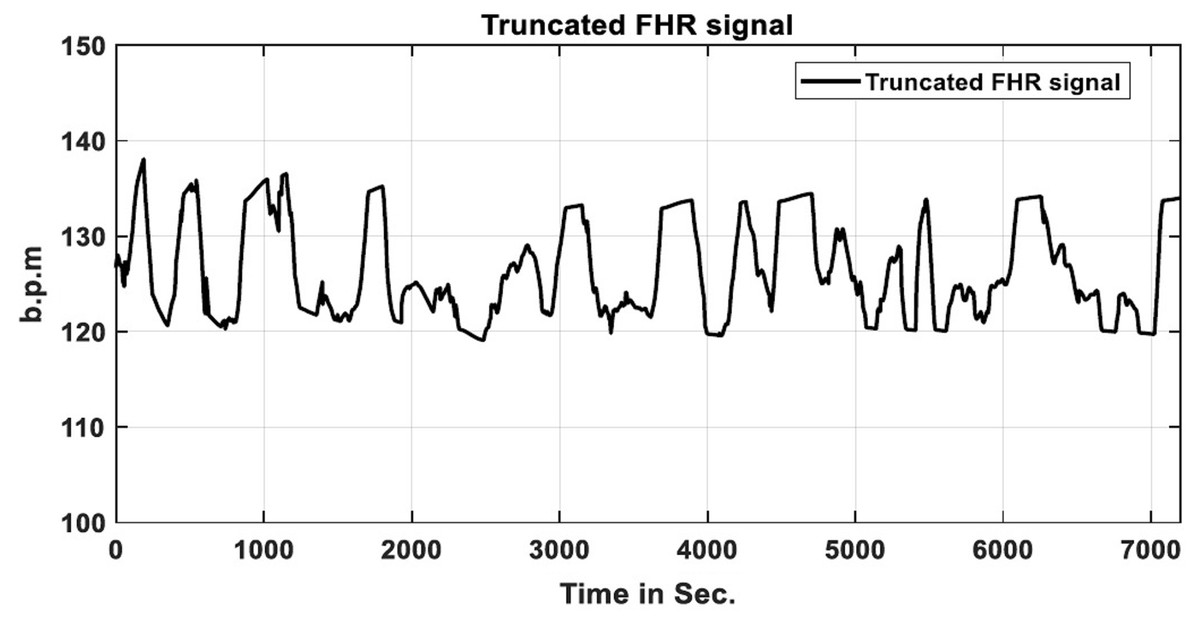
Figure 7: FHR signal that has been truncated.
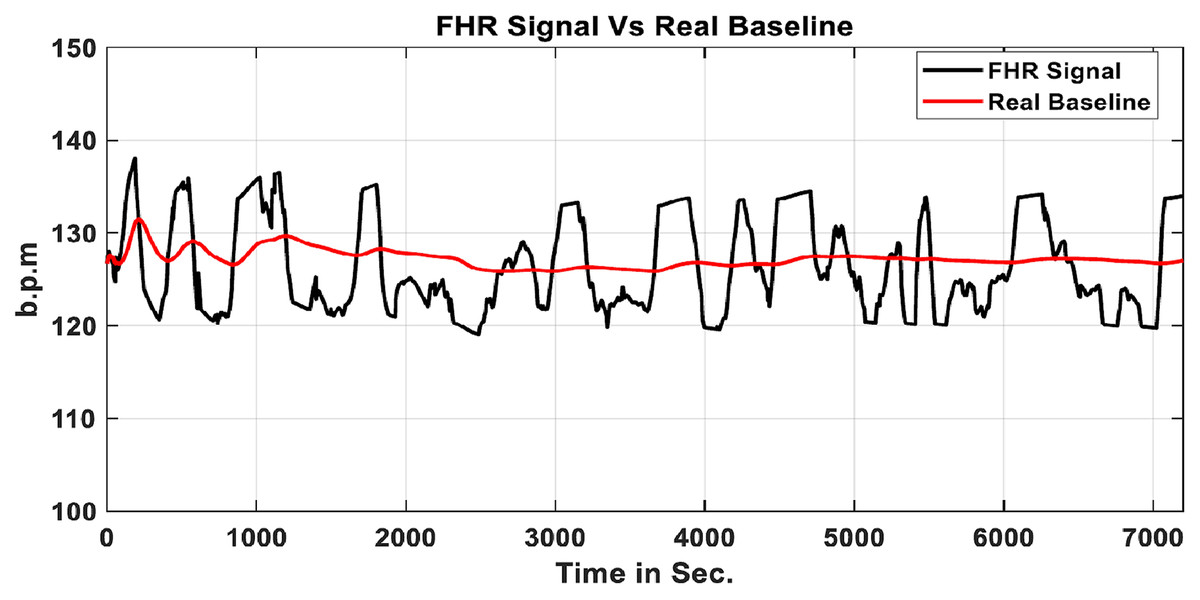
Figure 8: Real baseline BL & FHR signal.
Method of acceleration identification
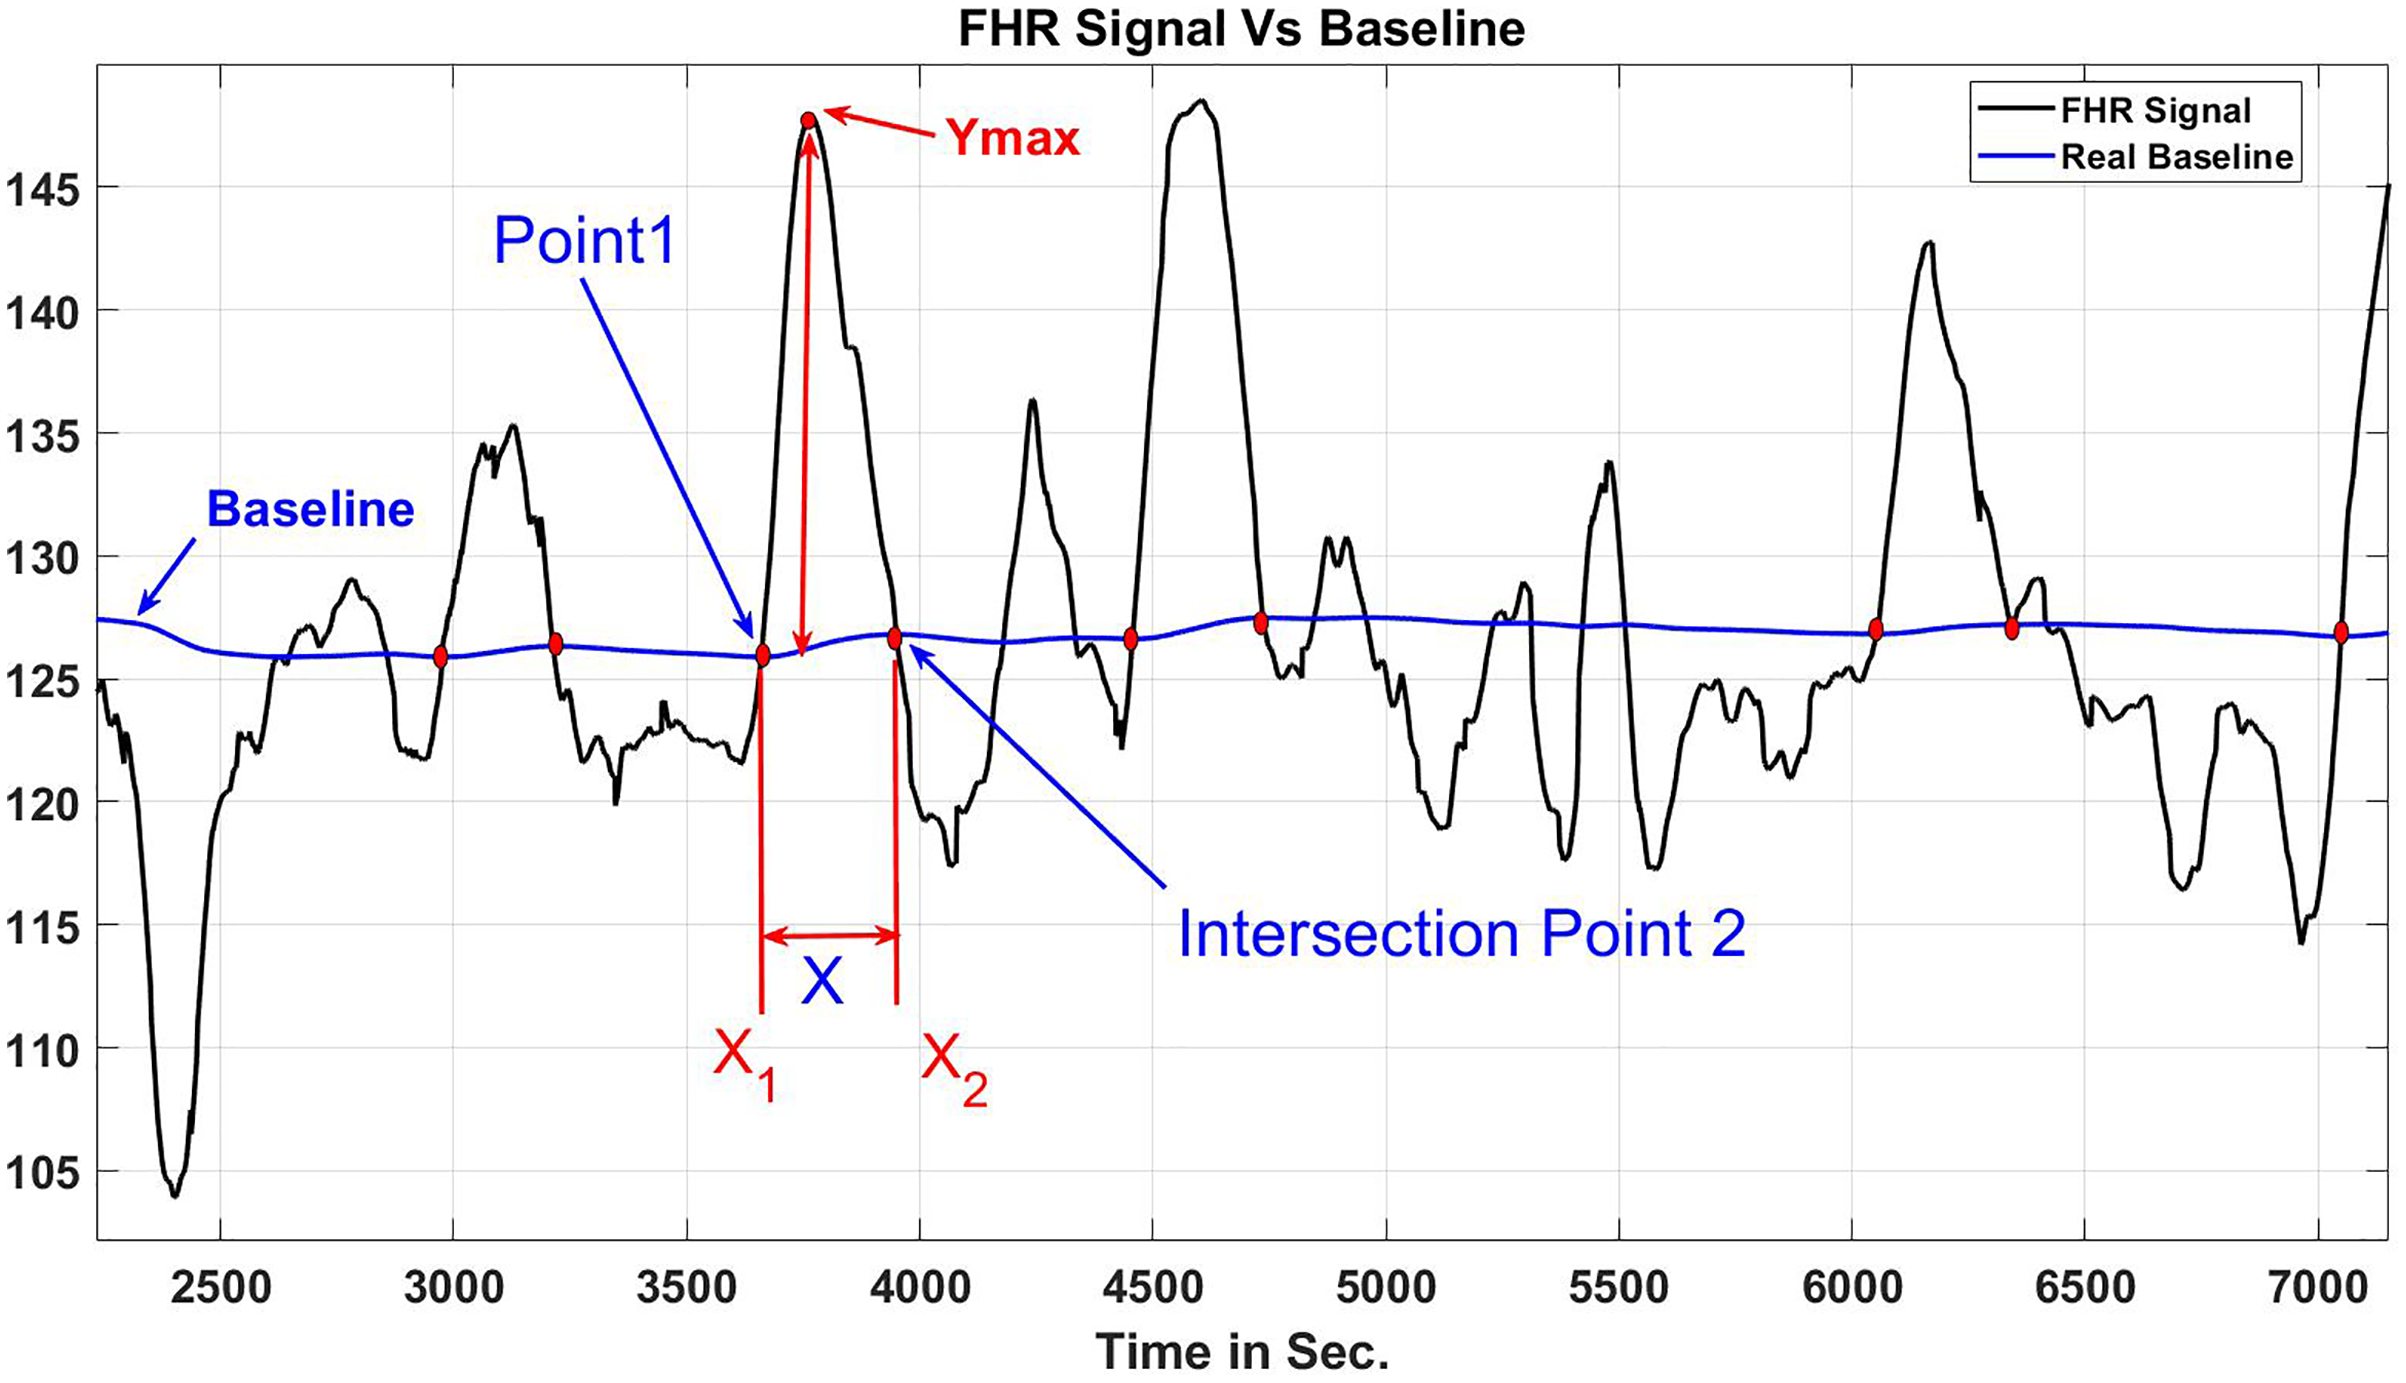
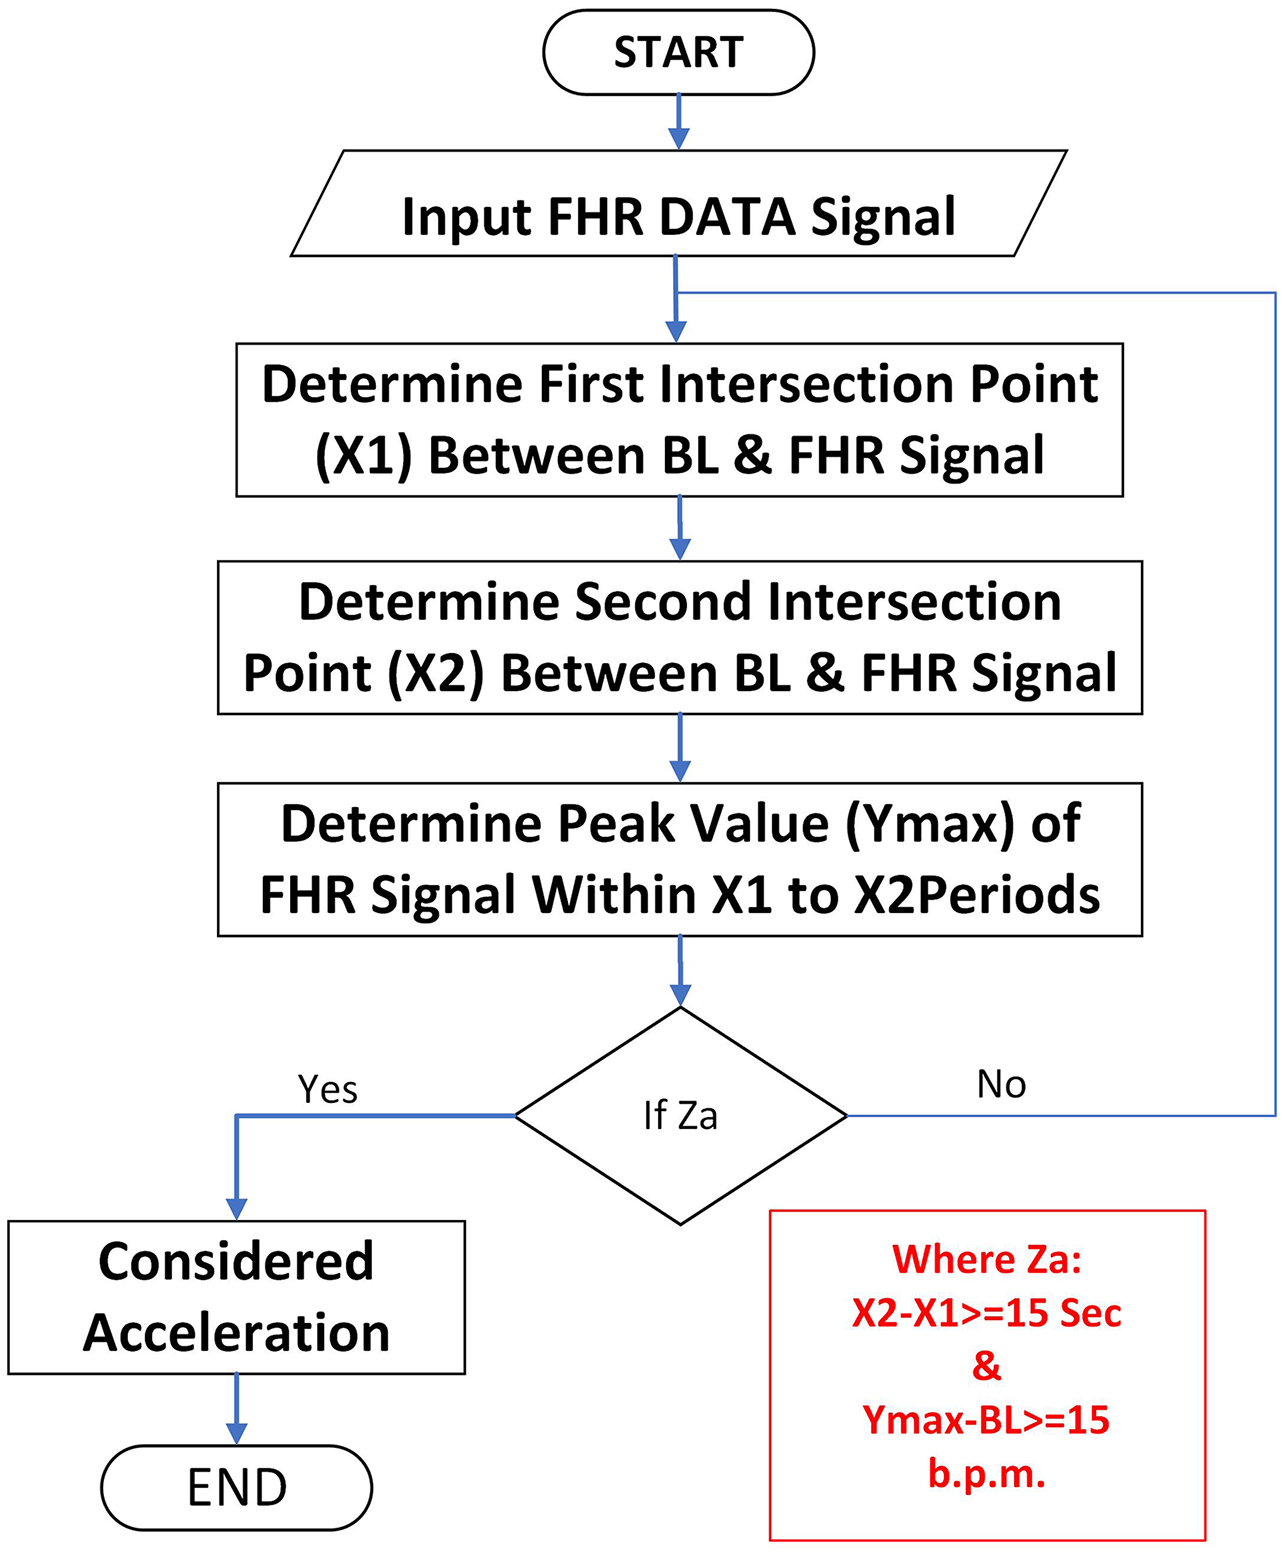
The RCOG Guideline defines FHR acceleration as an improvement in FHR of at least (15 b.p.m.) from the baseline that is sustained at that level or greater for at least 15 s, as indicated in Fig. 9. According to the RCOG description, the algorithm recognizes all accelerations in a 30-min FHR pattern recording. Figure 10 depicts the method for determining the acceleration.

Figure 9: When X and Y are at least 15 s and 15 b.p.m., respectively, transient increases in the FHR reflect acceleration.
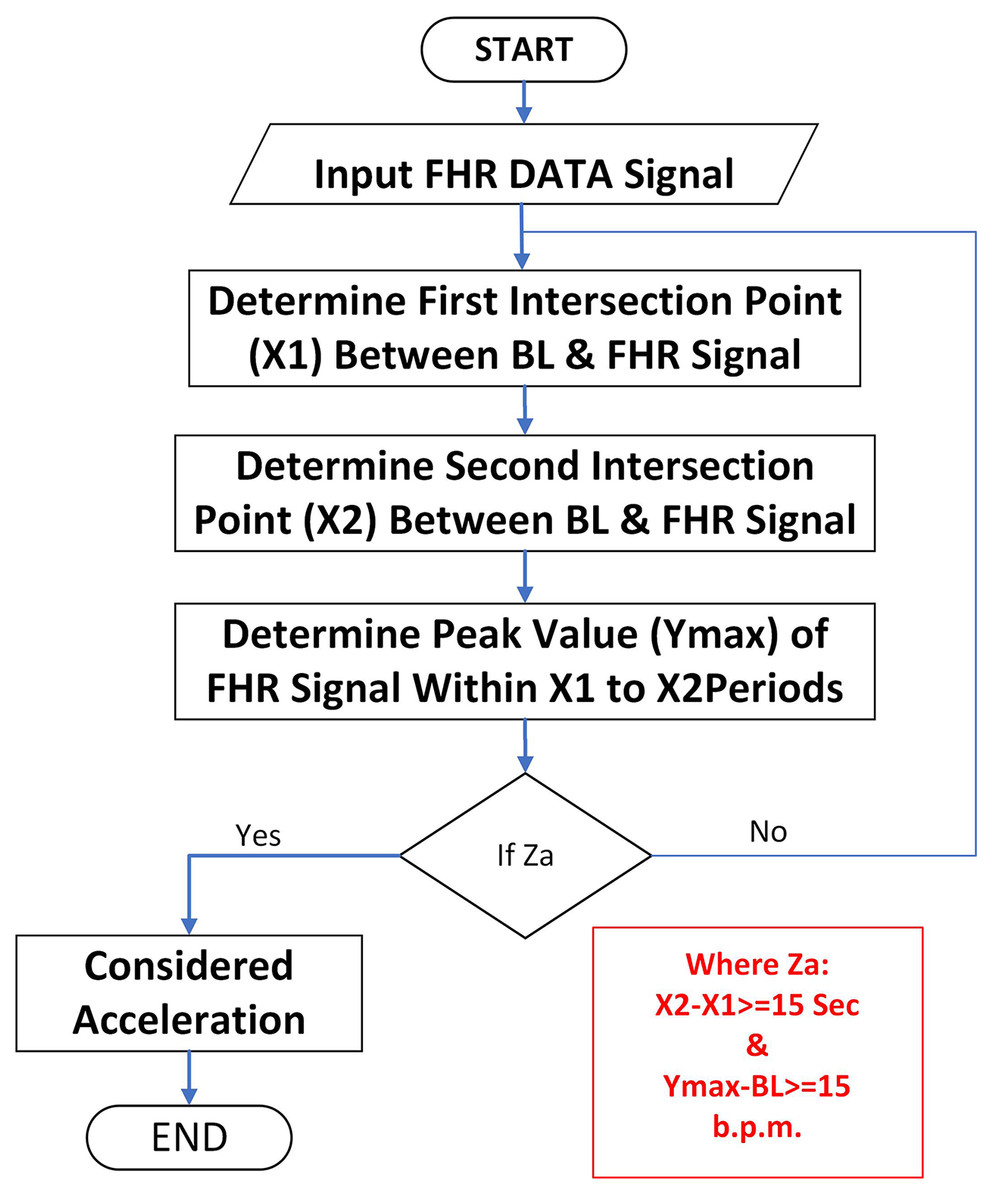
Figure 10: Algorithm for determining acceleration.
In this method, the FHR signal is smoothed using a moving average filter, which decreases the number of crossing points between the FHR signal and the (BL) to a bare minimum while retaining crucial information from the signal’s original shape. The technique used to calculate the intersection sites X1 and X2 in Fig. 9 is based on the agreement between the (X, Y) coordinates of every FHR signal and the real baseline locations. Another important component to examine is the maximum acceleration period (Xmax), which is the space in b.p.m. between BL and the FHR signal maximum point between X1 and X2. The applied algorithm, as illustrated in Figs. 10 and 11, is predicated on a modified peak detector code integrated within the MATLAB source code to calculate the FHR signal maximum value ( ) during a particular time frame and , in seconds. According to the RCOG standard, acceleration and should be at the minimal (15 s and 15 b.p.m., accordingly), as indicated in the Eqs. (4) and (5).
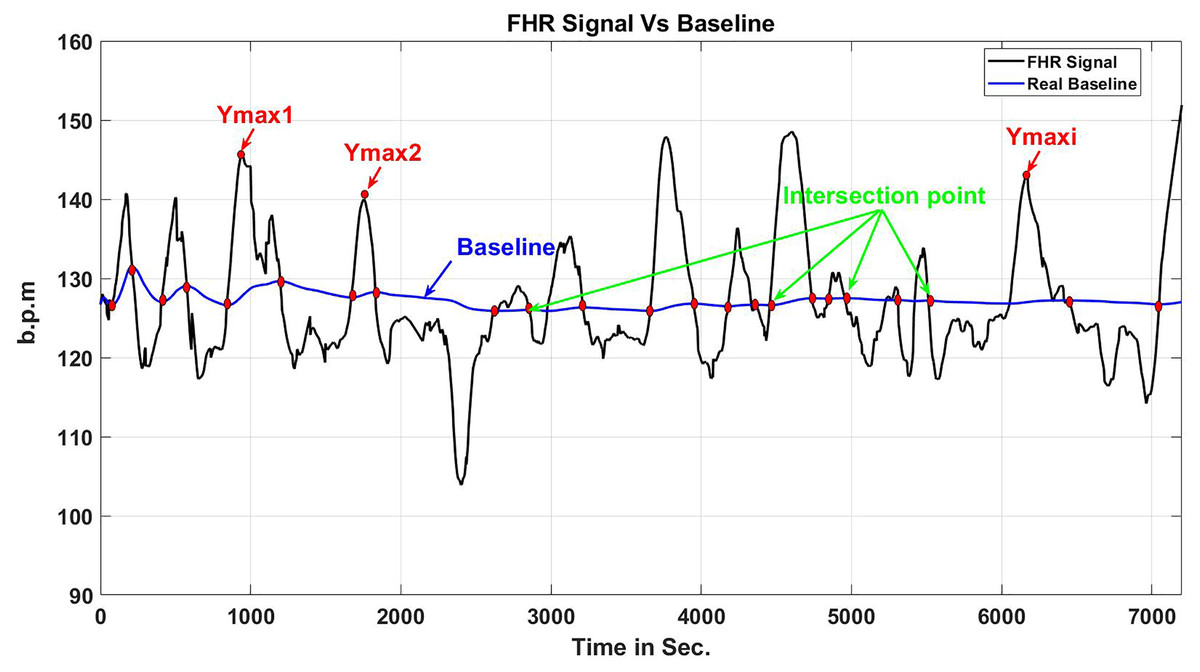
Figure 11: Periods of FHR acceleration and points where it intersects with the baseline.
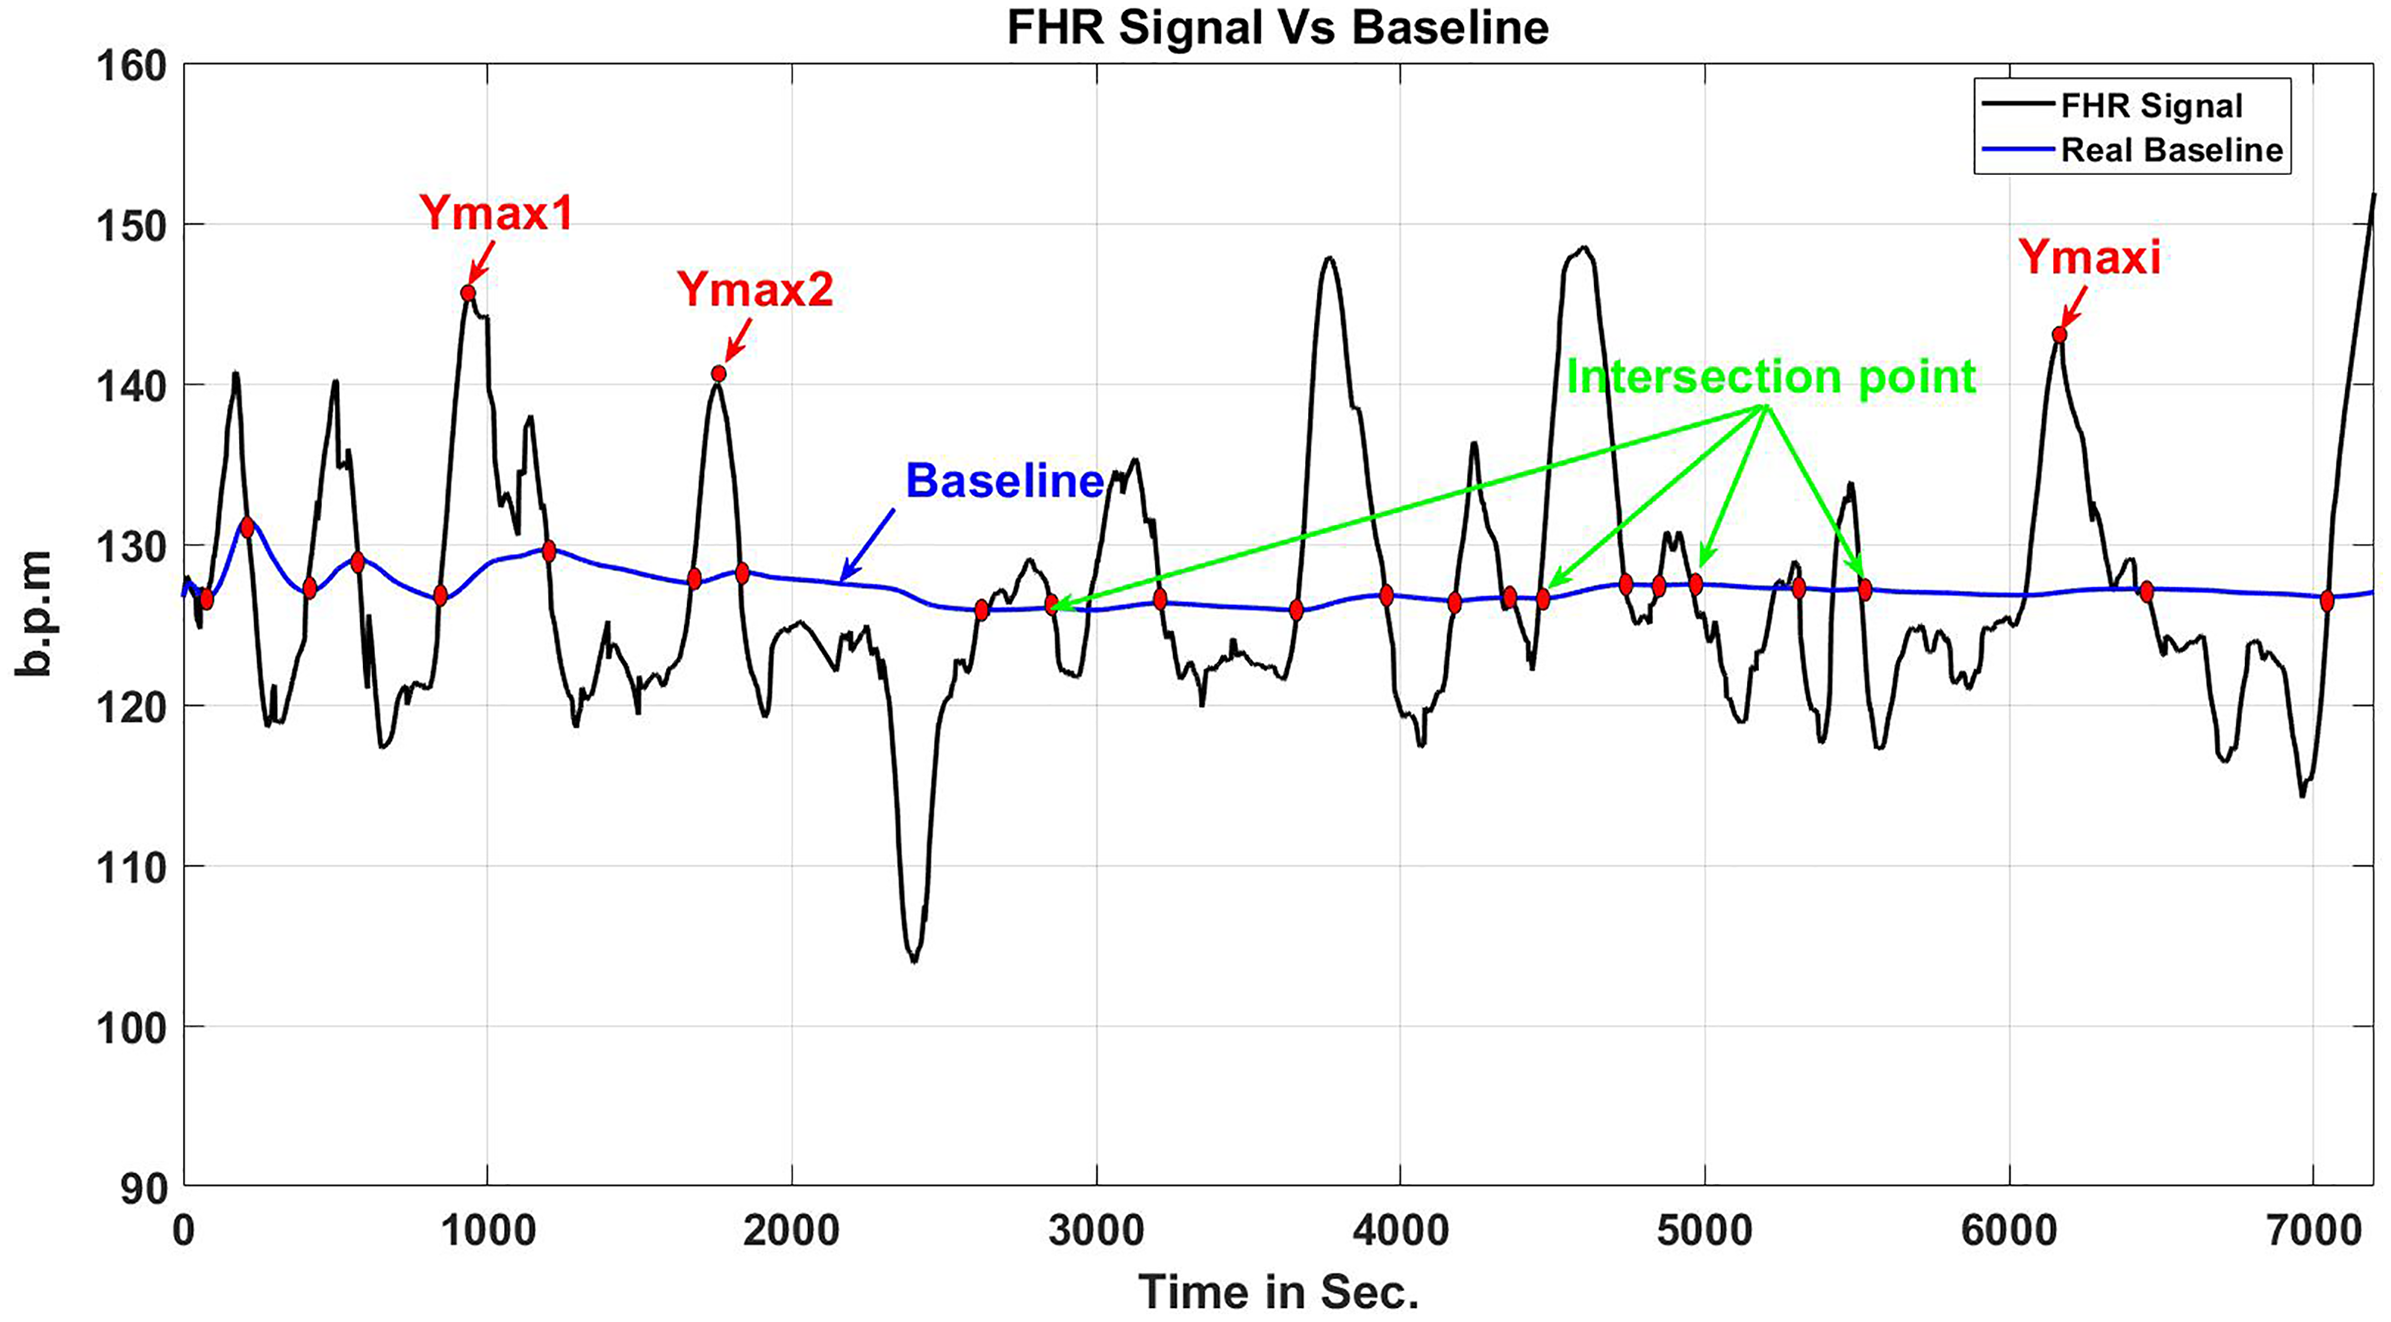
(4)
(5)
The condition (Z a) in Fig. 10 is true if ( ) is longer than (15 s) and ( ) is more than (15 b.p.m.). All relevant data, such as the length of ( and ) coordinates (position and magnitude), are retained in the recognition method for the acceleration transient duration in the FHR signal for future CTG categorization.
Method for estimating baseline variability
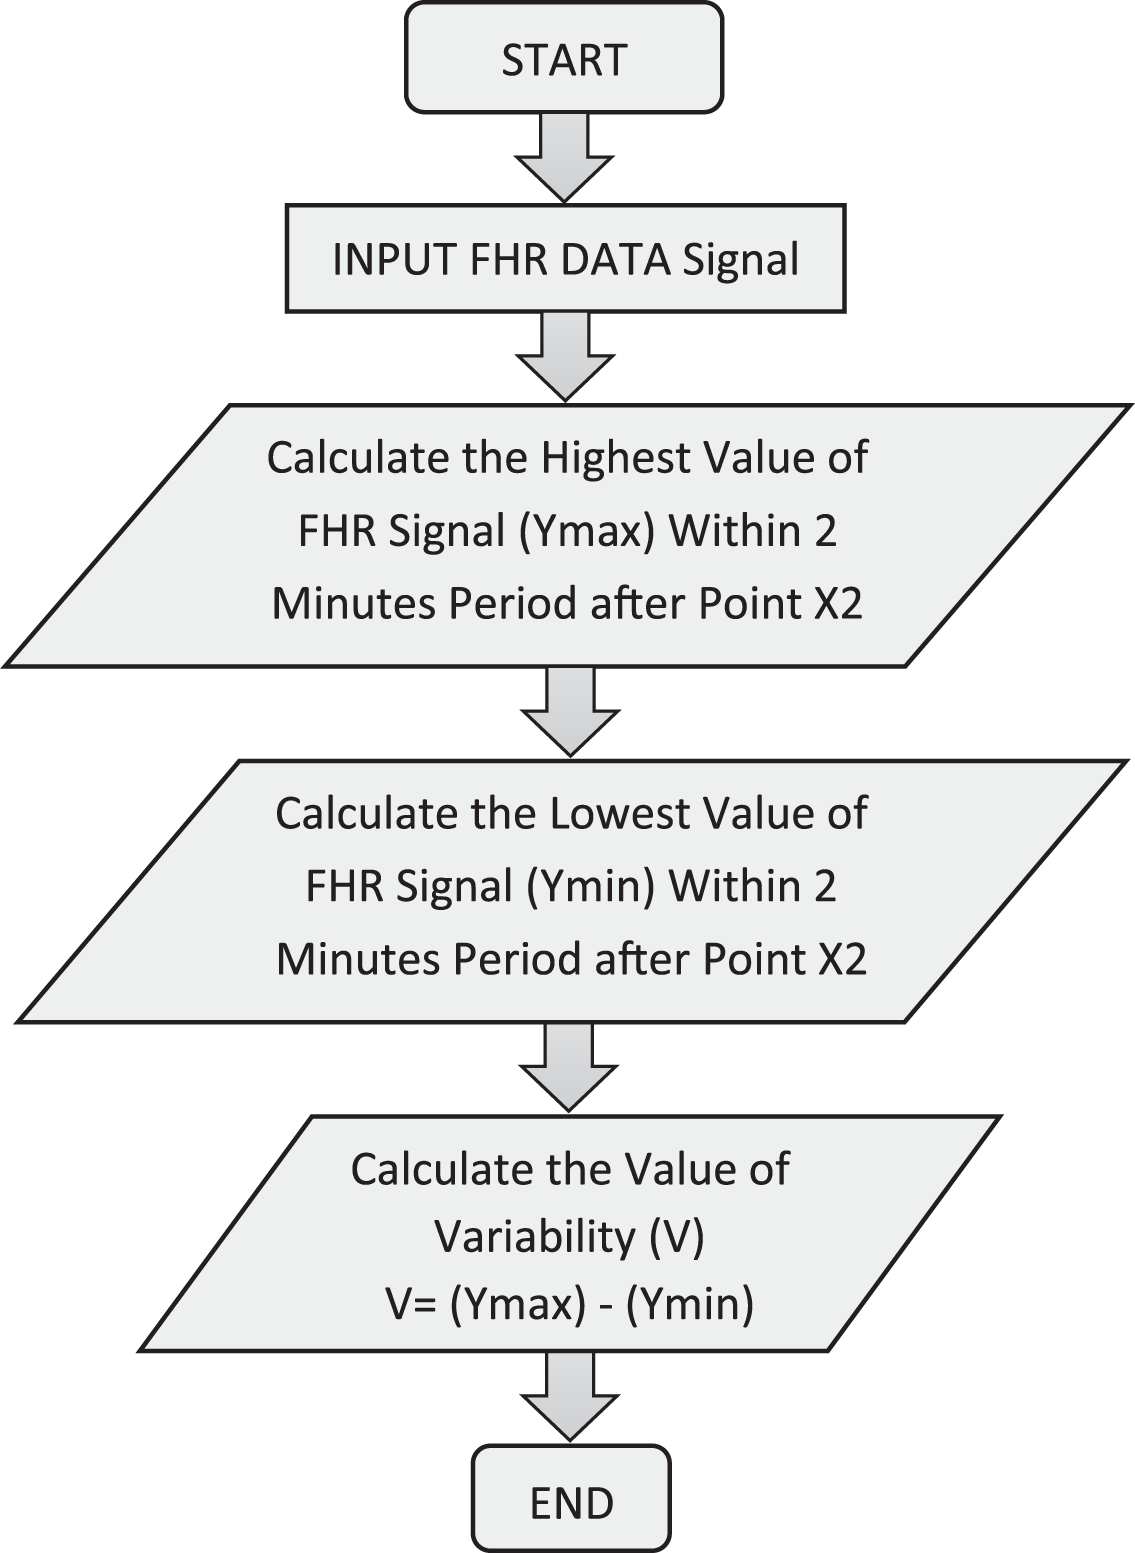
The method for measuring baseline variability is depicted in Fig. 12. This component of the algorithm computes the value of FHR variability (V) by starting with the RCOG guideline definition of baseline variability (see Table 1). Figure 13 illustrates the FHR signal’s fluctuation throughout 2 min. The baseline variability calculation is obtained by calculating the highest (Ymax) and lowest (Ymin) values of the FHR signal in a 2-min segment following the junction point of the BL and FHR signal (X2) after FHR acceleration occurs for 2 min. V is an abbreviation for baseline variability, which is measured as illustrated in Eq. (6):
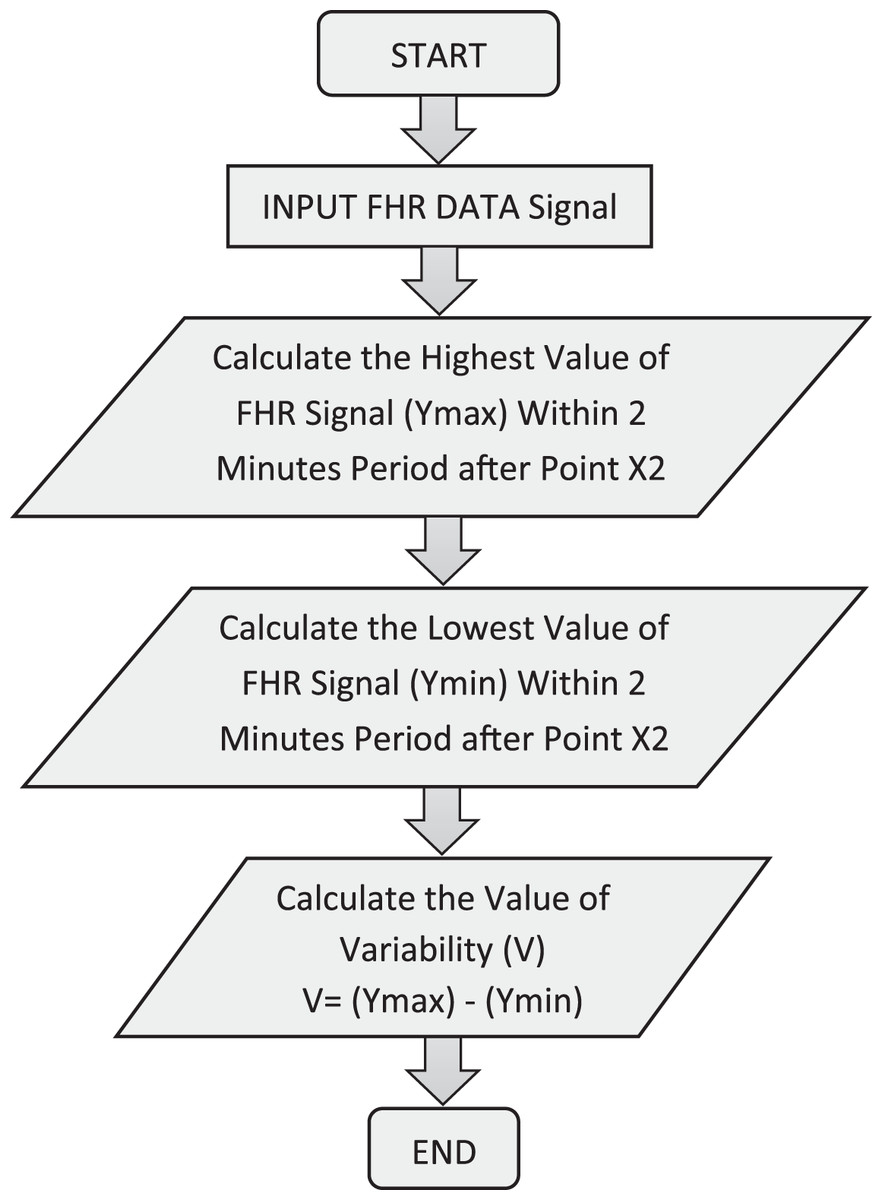
Figure 12: Calculation of FHR variability over a 2-min cycle.
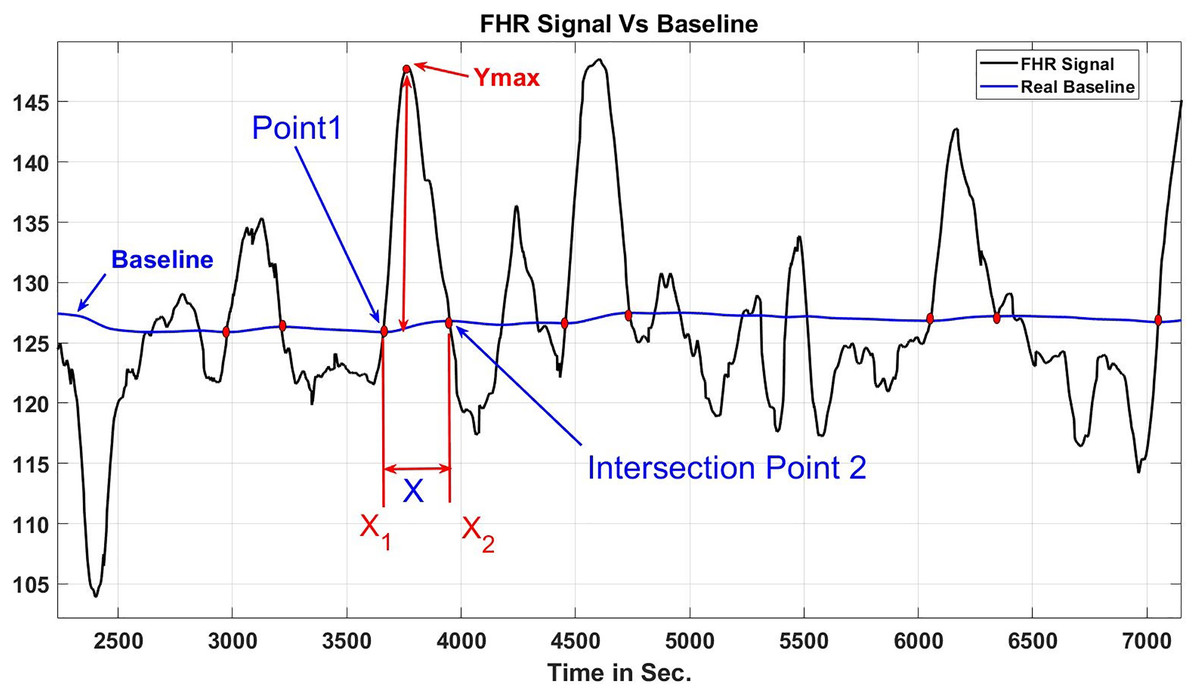
Figure 13: Variability time in 2 s.
(6)
Identification method for deceleration
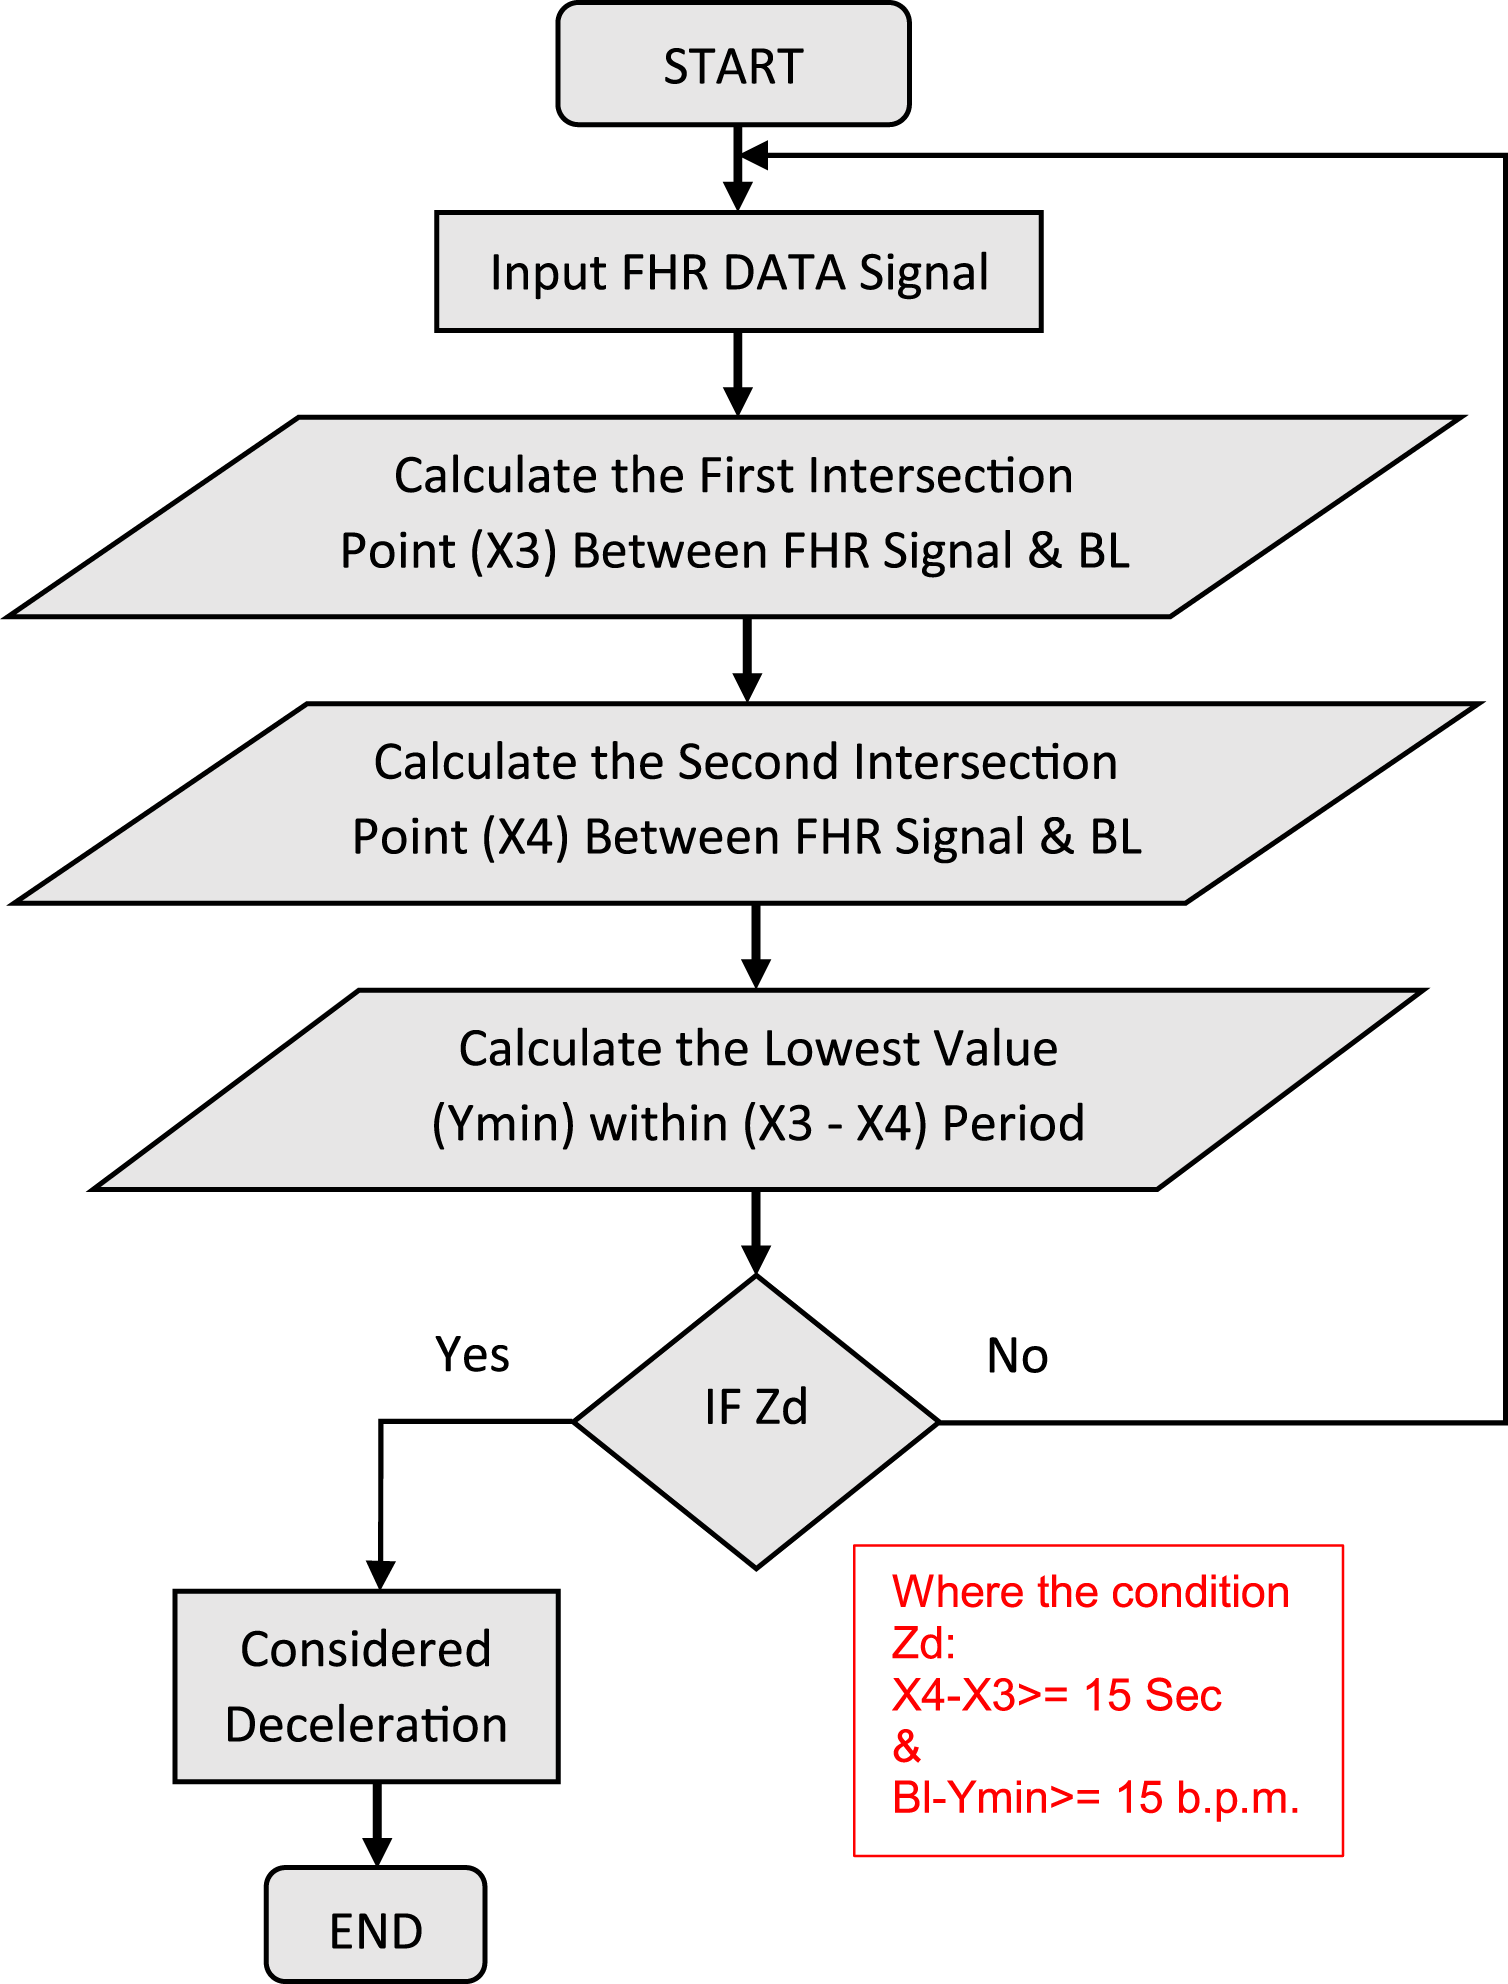
The RCOG guideline (Cookson, 2003) defines the deceleration pattern as follows: (Cookson, 2003) “Transient episodes of slowing of FHR below the baseline level of more than (15 b.p.m.) and lasting (15 s) or more”. Figure 14 demonstrates the procedure for categorizing decelerations. The algorithm distinguishes deceleration types in addition to recognizing deceleration patterns. Early decelerations are defined as a consistent, recurrent, and periodic decrease of FHR that occurs early in the contraction and returns to baseline at the termination.
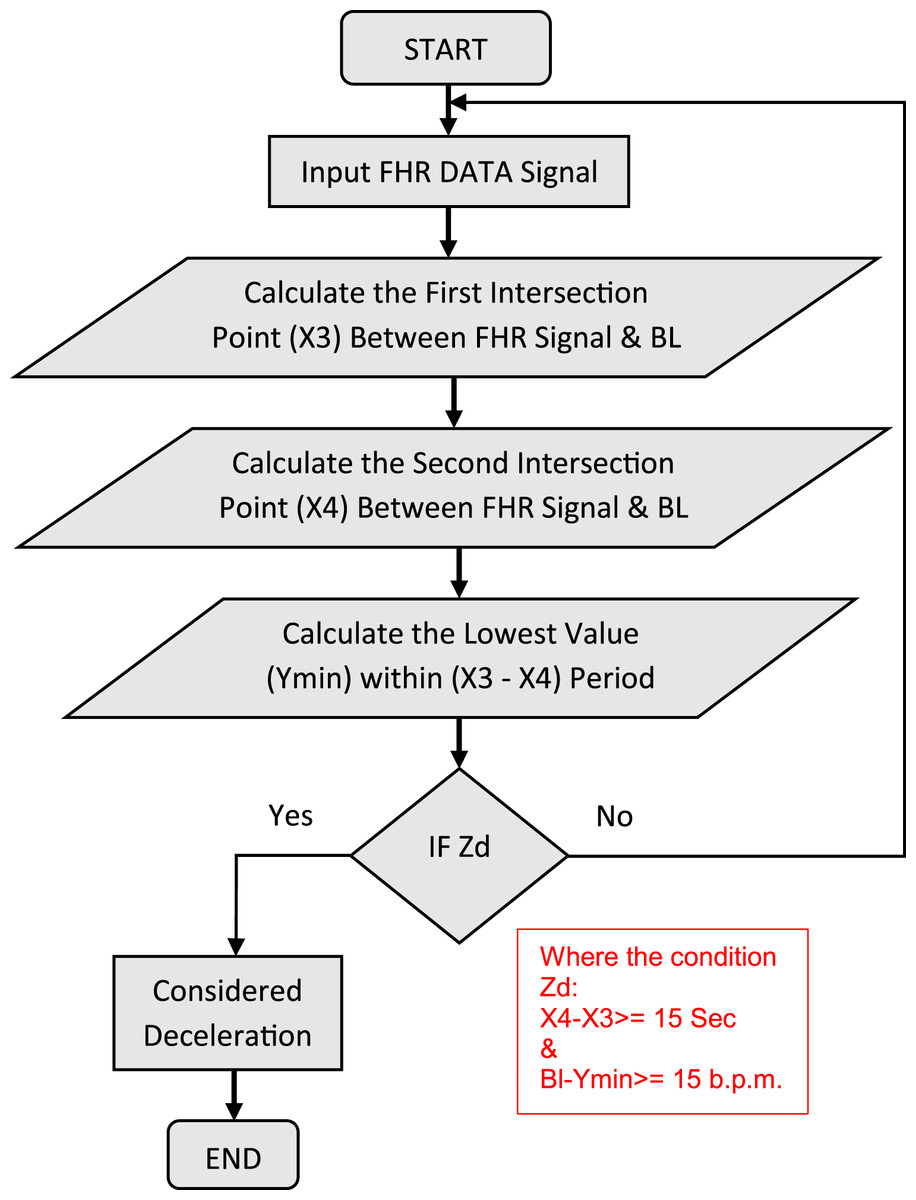
Figure 14: Procedure for detecting deceleration.
The secondary is the late decelerations are defined as a consistent, recurrent, and periodic decrease of FHR with the nadir longer than 20 s after the apex of the contraction and terminating after the contraction. If there was an on-accelerative track with a baseline variability with a value lower than 5 b.p.m., the concept would include decelerations with a value lower than 15 b.p.m. A deceleration pattern is seen in Fig. 15.
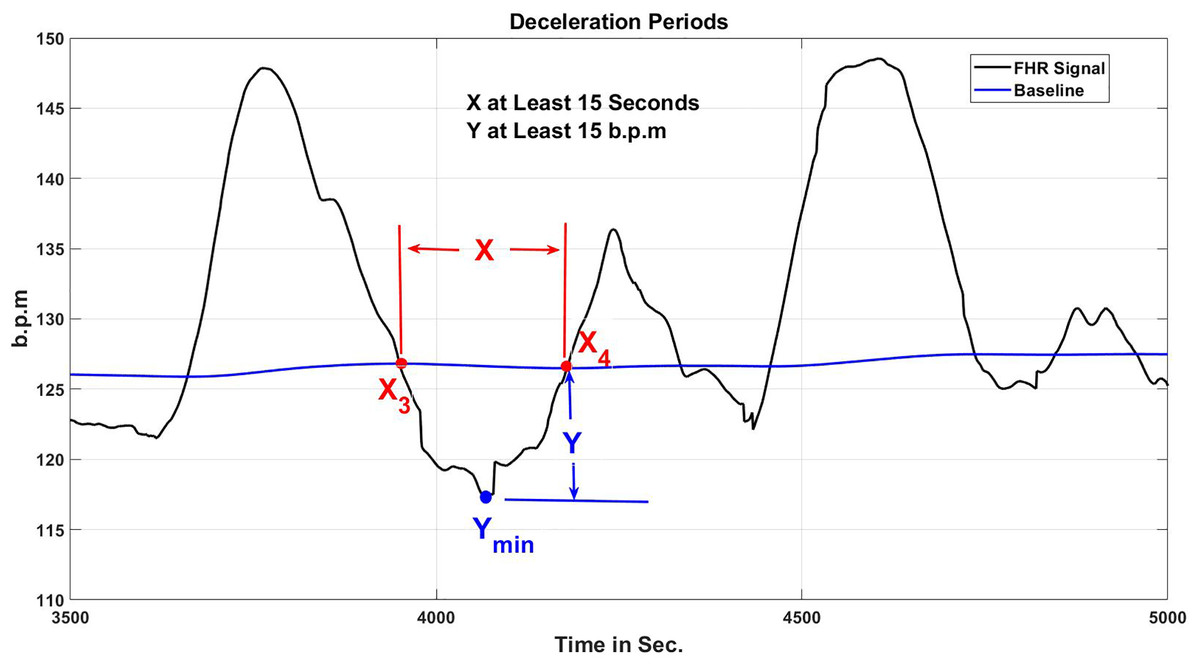
Figure 15: Periods of FHR deceleration and points where it intersects with the baseline.
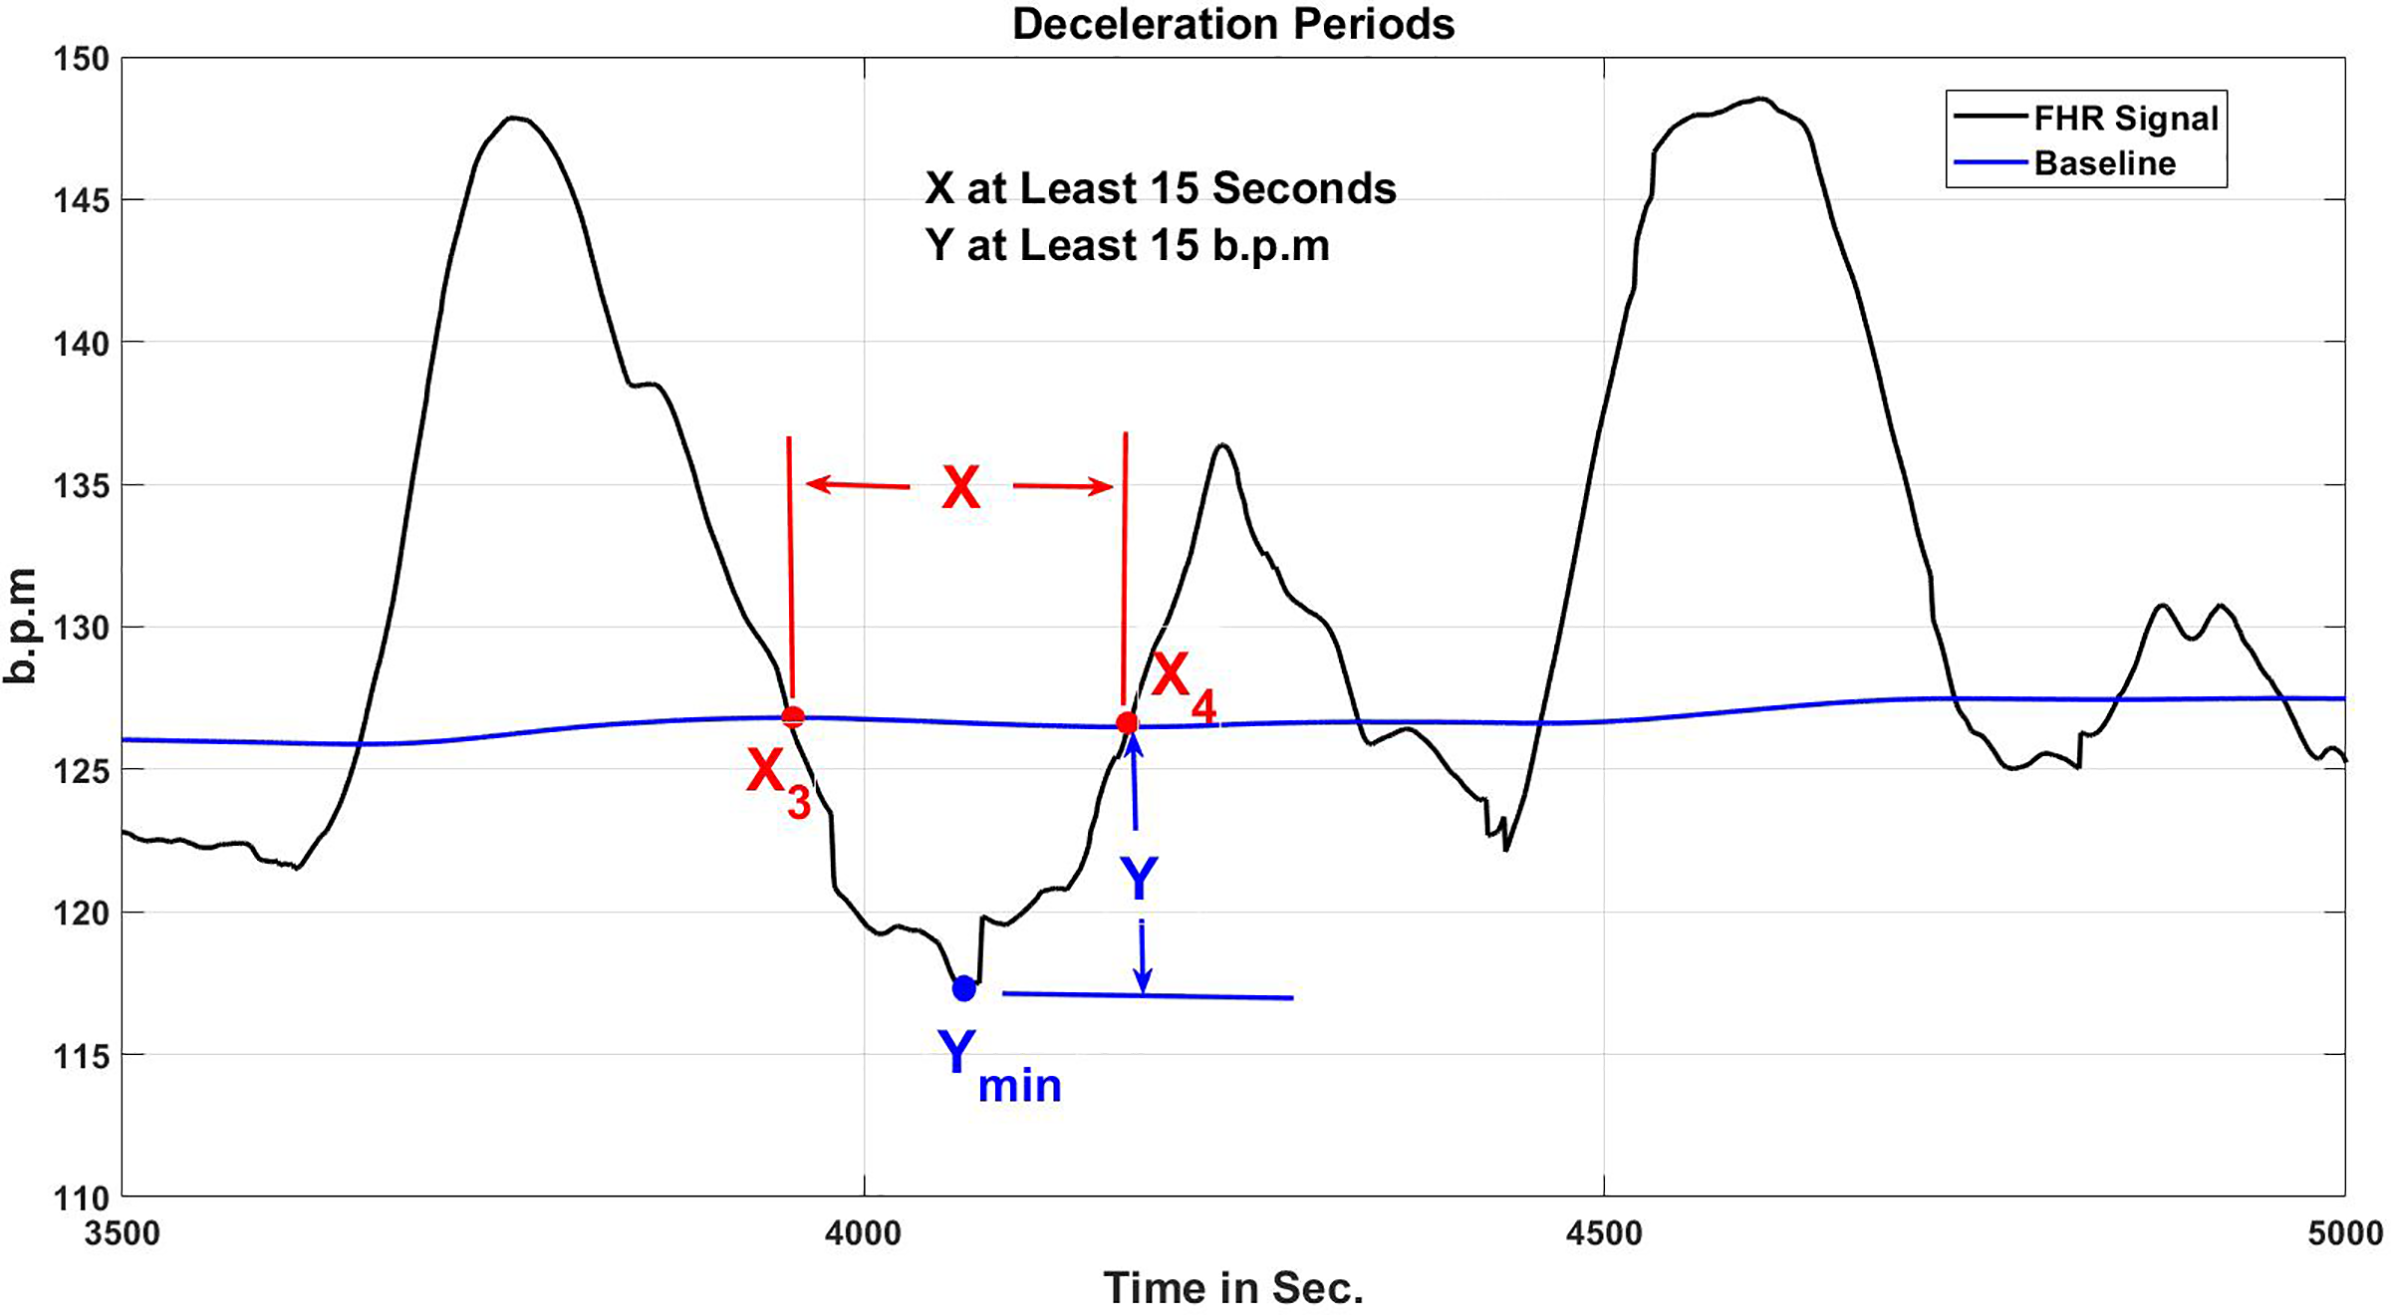
The & in the algorithm indicate the junction positions of the FHR signal and BL. Another factor to examine is the nadir (FHR signal minimal value) of the deceleration time, . According to the RCOG concept of deceleration, it is imperative that Y and X be at the minimal with value 15 b.p.m. and 15 s, accordingly, as indicated in the Eqs. (7) and (8).
(7)
(8)
The criterion ( ) in Fig. 14 is valid if ( ) and ( ) have the minimum value of 15 s and 15 b.p.m., accordingly. As indicated in Table 1, the quantity and kind of decelerations (Early or Late) in the FHR signal are retrieved and preserved for additional CTG categorization using the RCOG standards.
Estimation method for uterine contraction
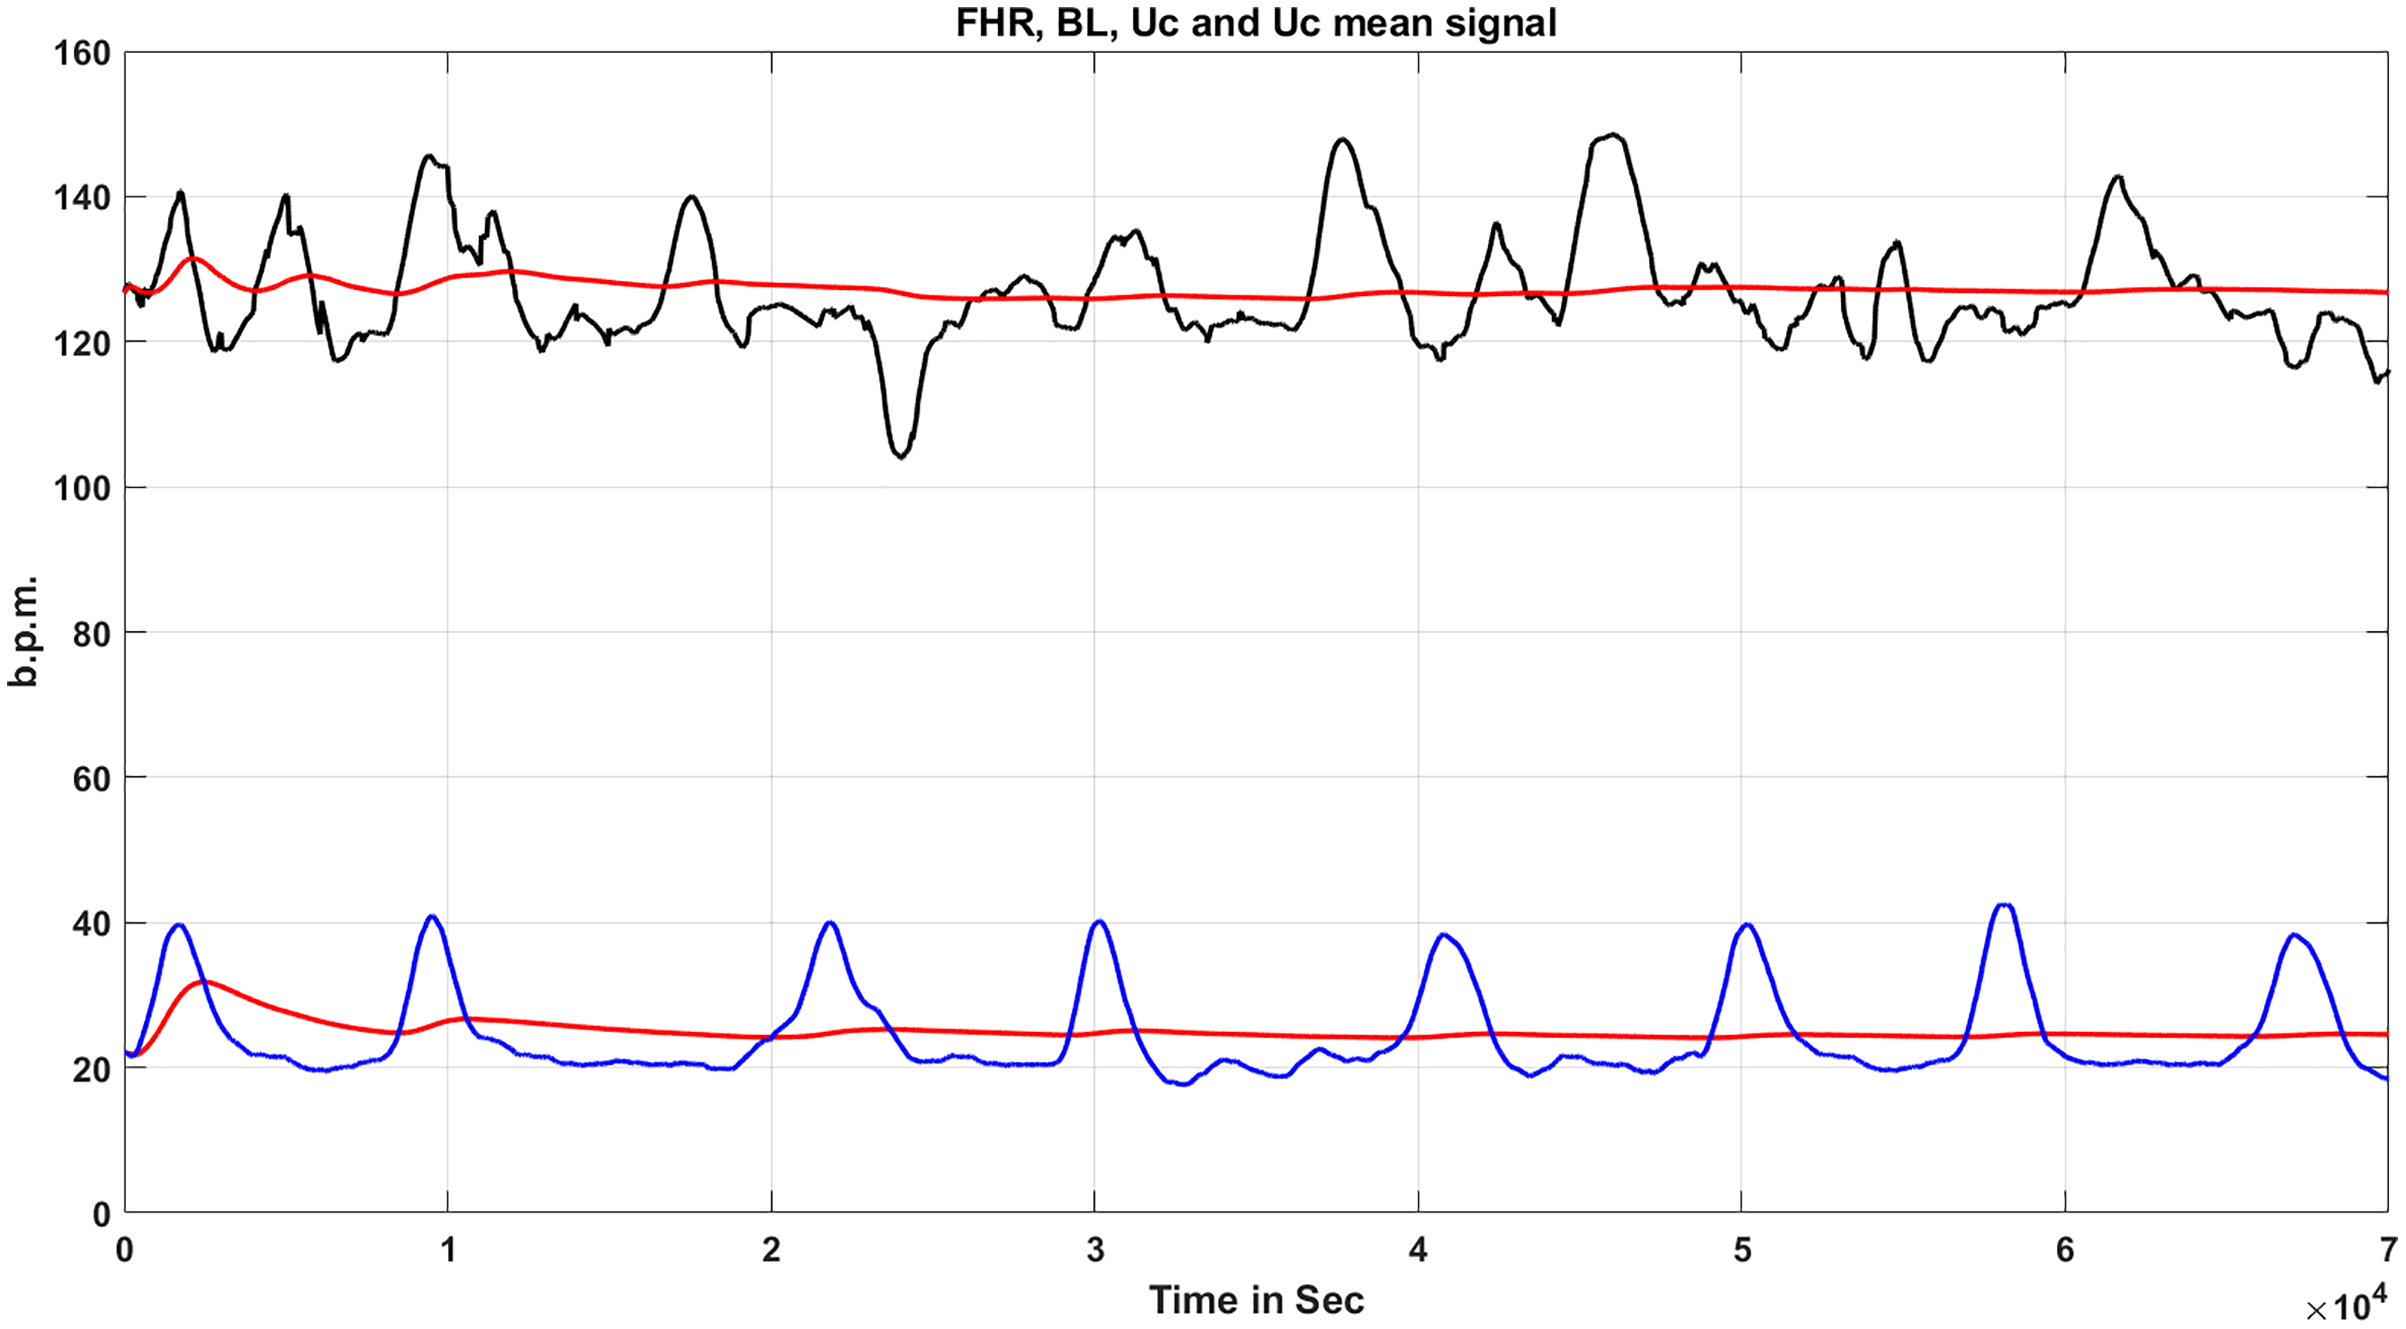
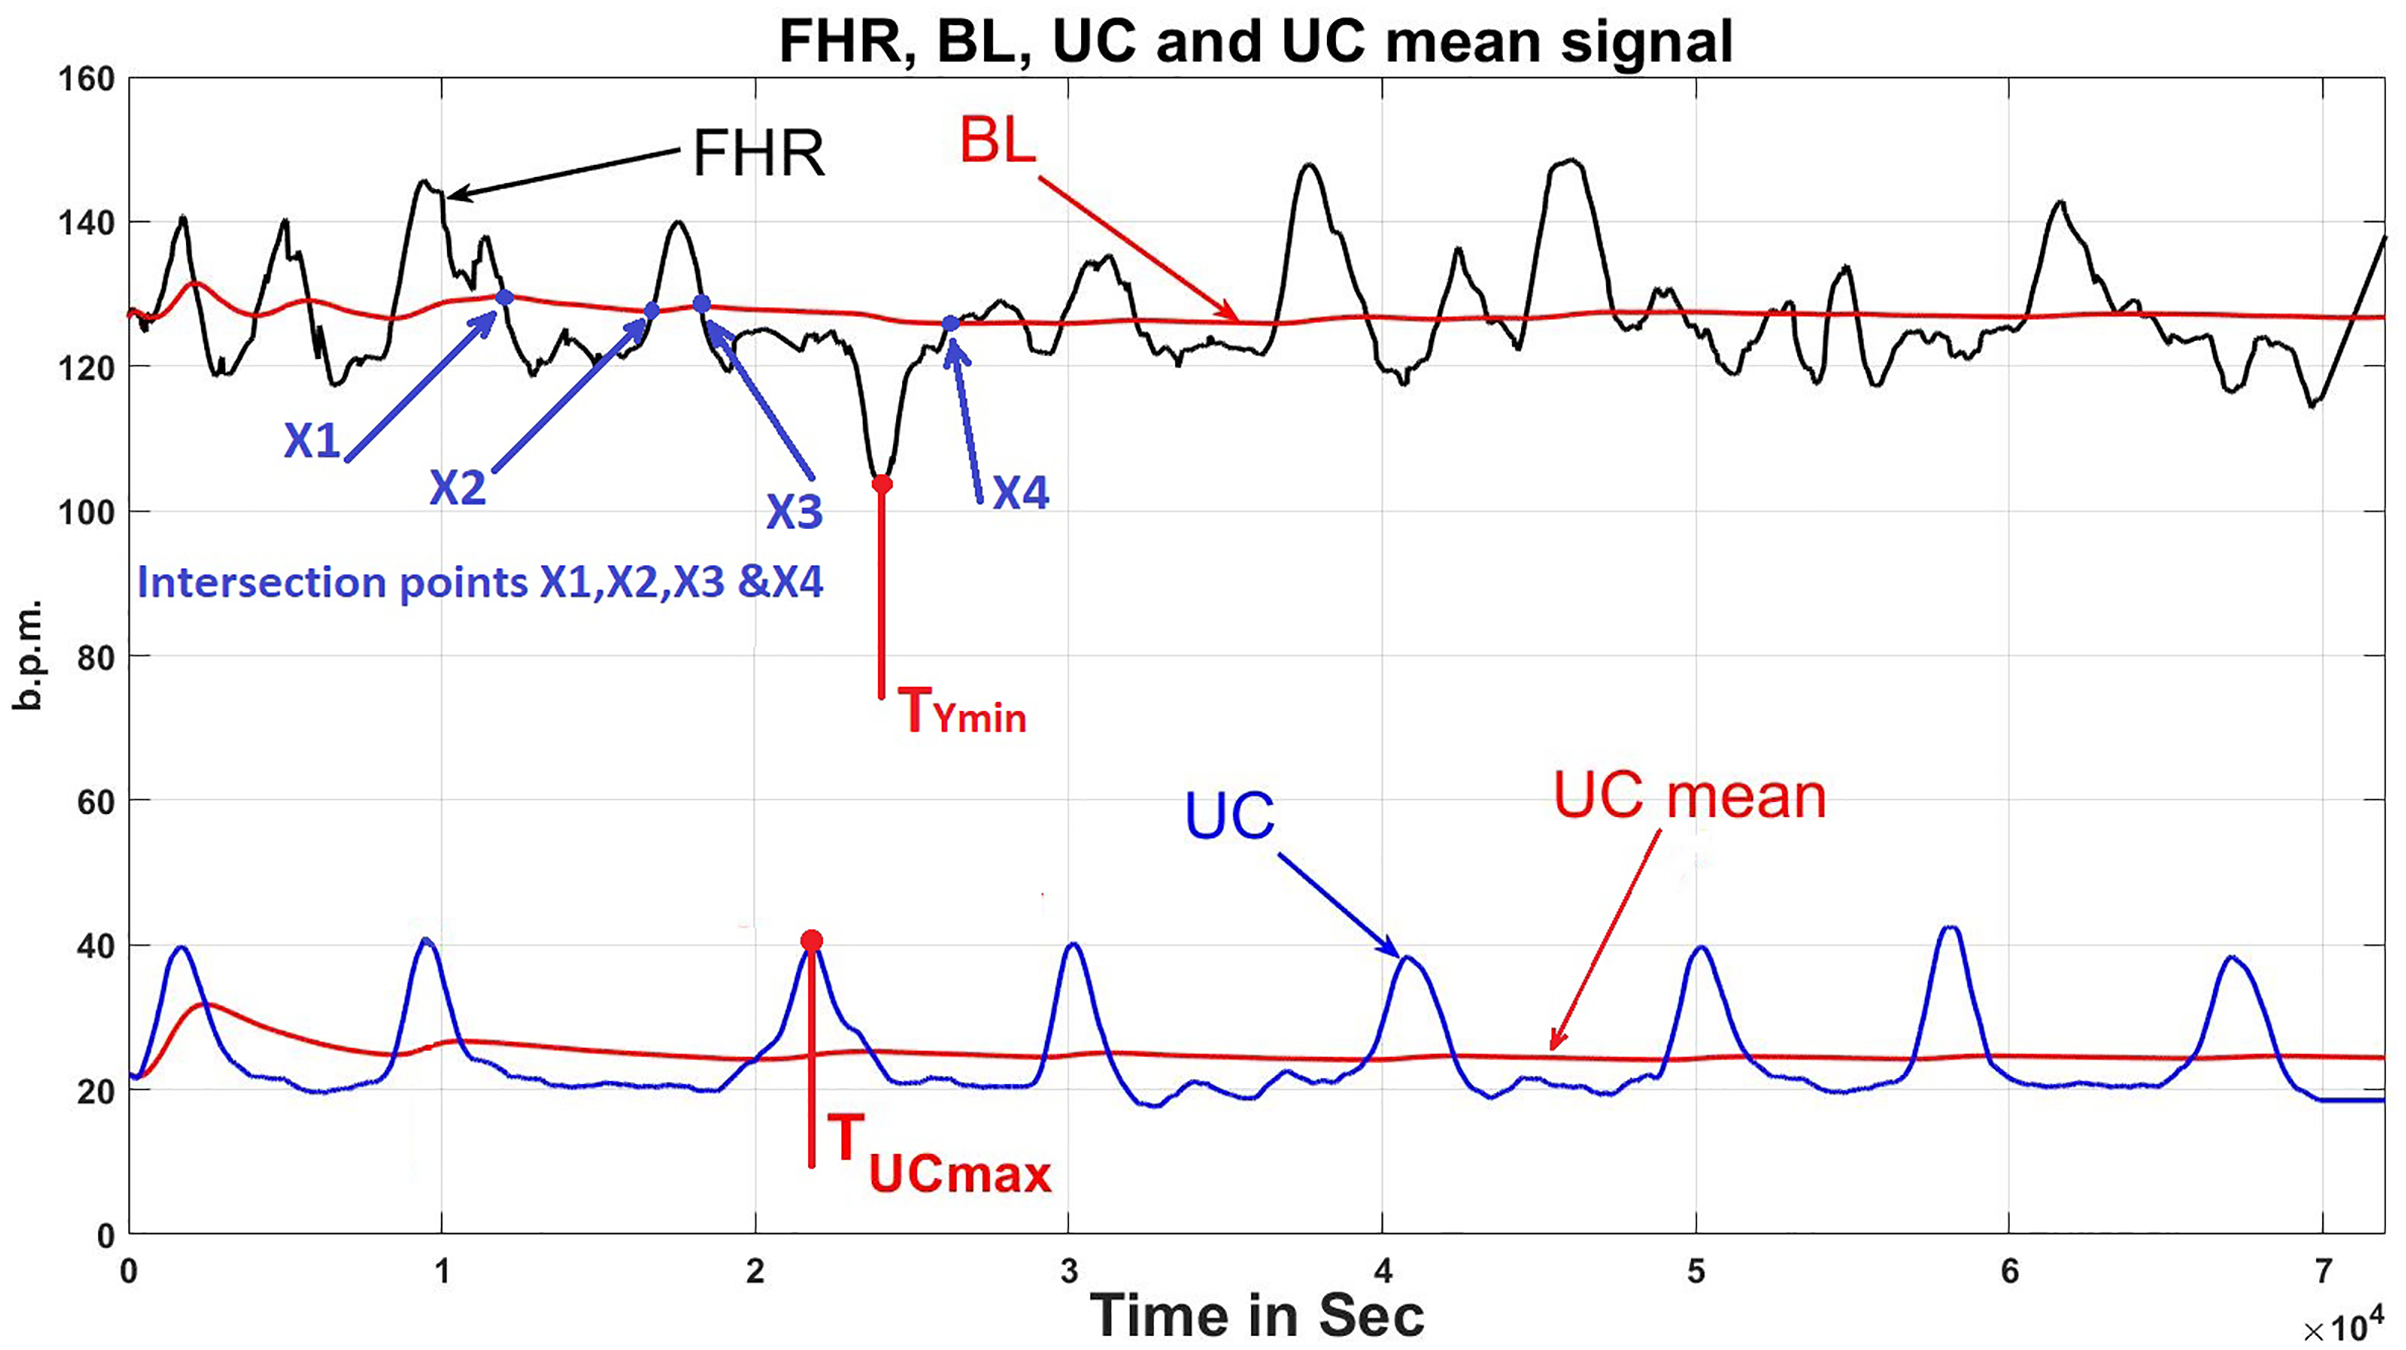
Uterine contractions (UC) are another aspect to consider, as seen in Fig. 16. The UC calculation algorithm is utilized to determine the value of , which is the benchmark for computing any type of deceleration in a CTG pattern, either late or early. The quantity of UC in the CTG signal, in addition to the values of , are retrieved and preserved for future CTG categorization using the RCOG criteria.
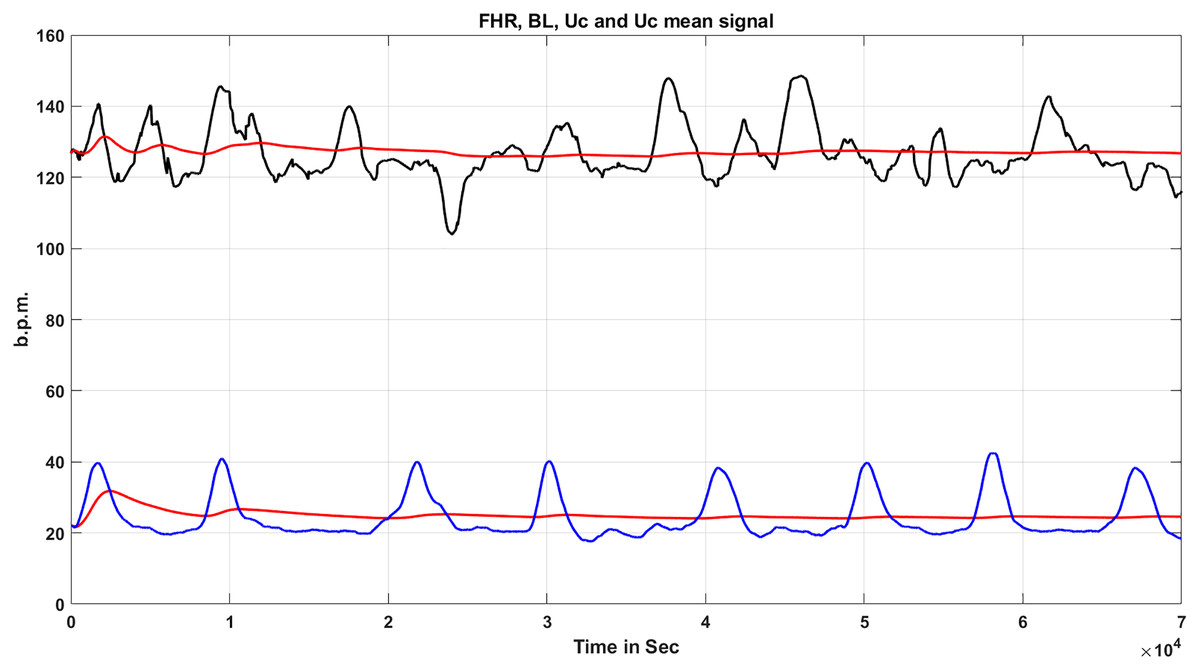
Figure 16: FHR signal & uterine contractions.
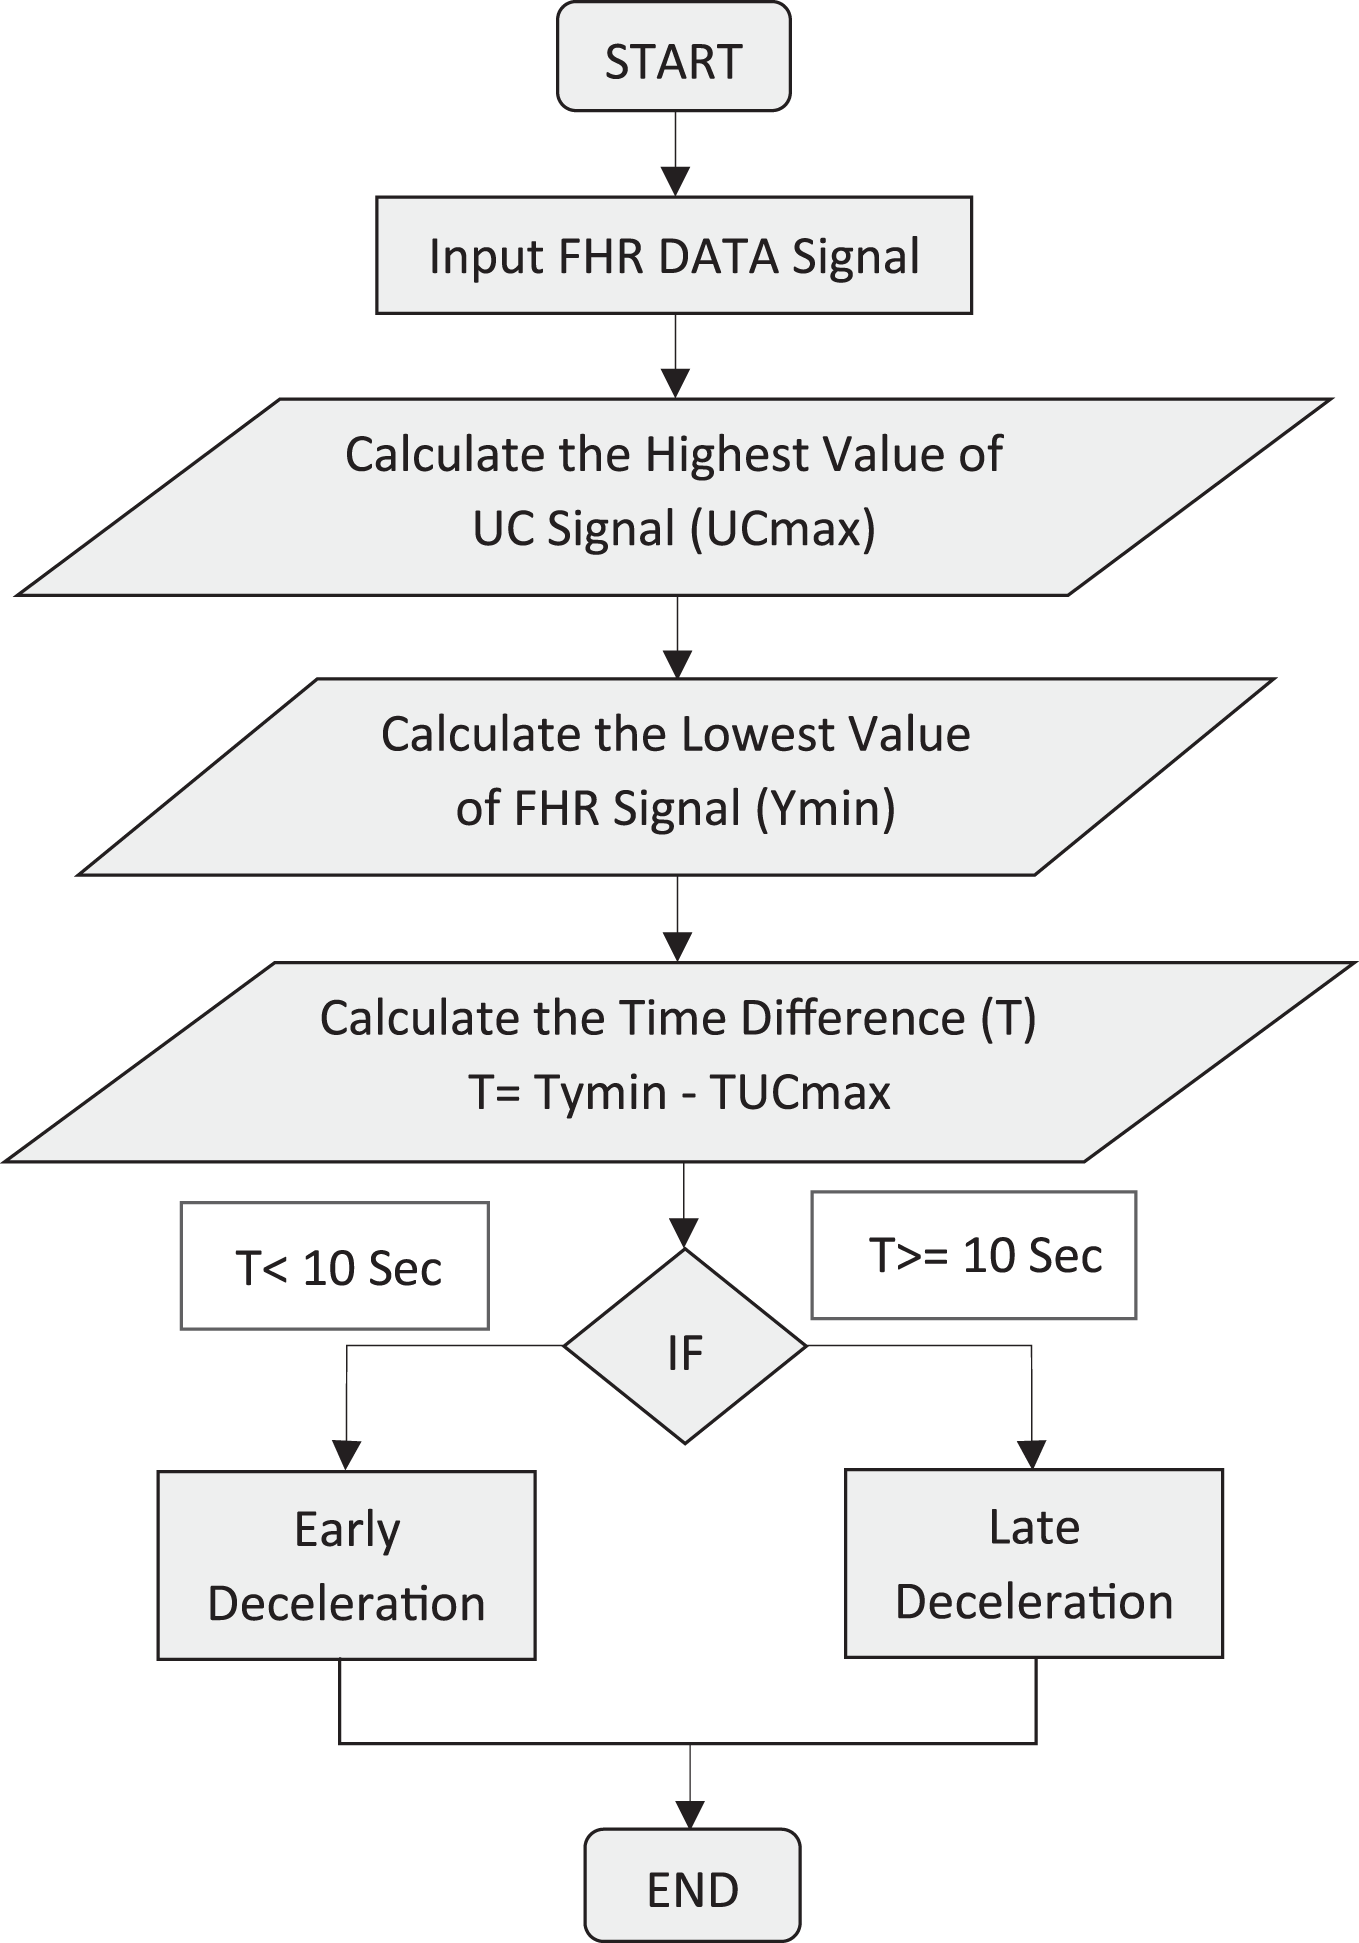
The method used to measure the various types of decelerations is depicted in Fig. 17. Furthermore, Fig. 18 indicates the method used to evaluate whether the deceleration is belated (late) or premature (early), first acquire the time ( ) for deceleration and the time for uterine contraction ( ) of ( ).
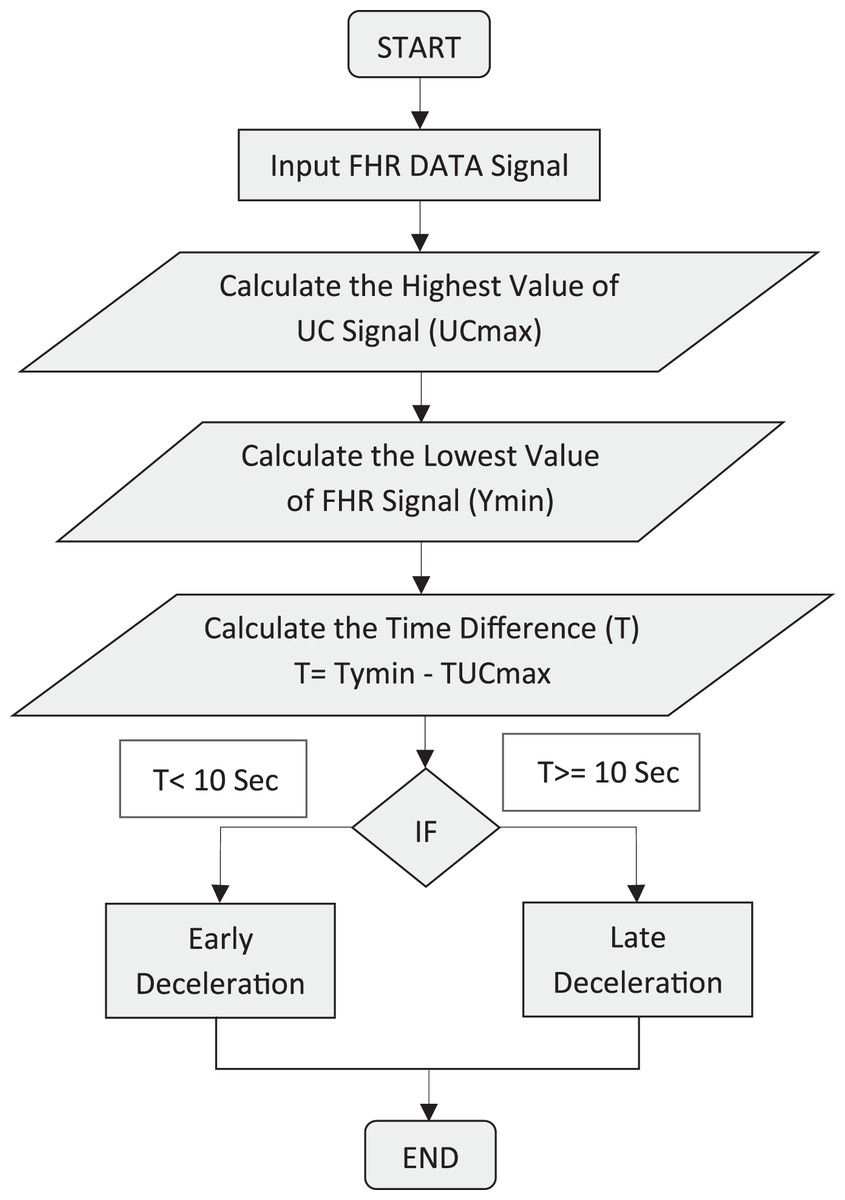
Figure 17: Identification of different modes of deceleration.
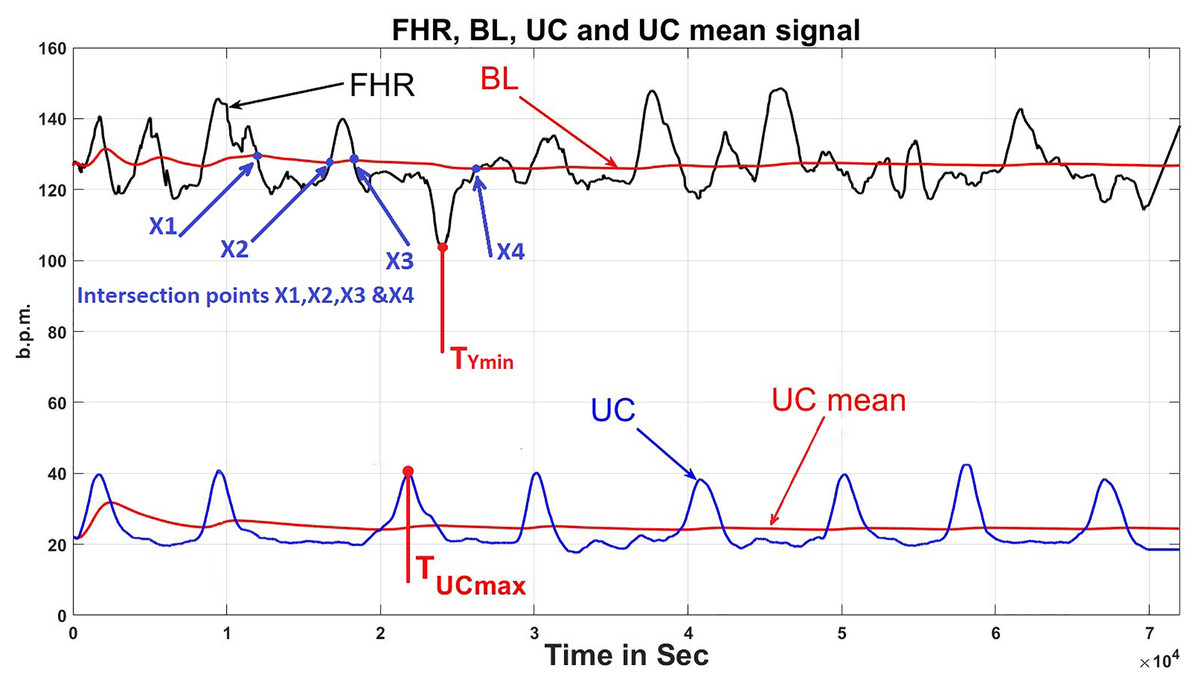
Figure 18: Deceleration time.
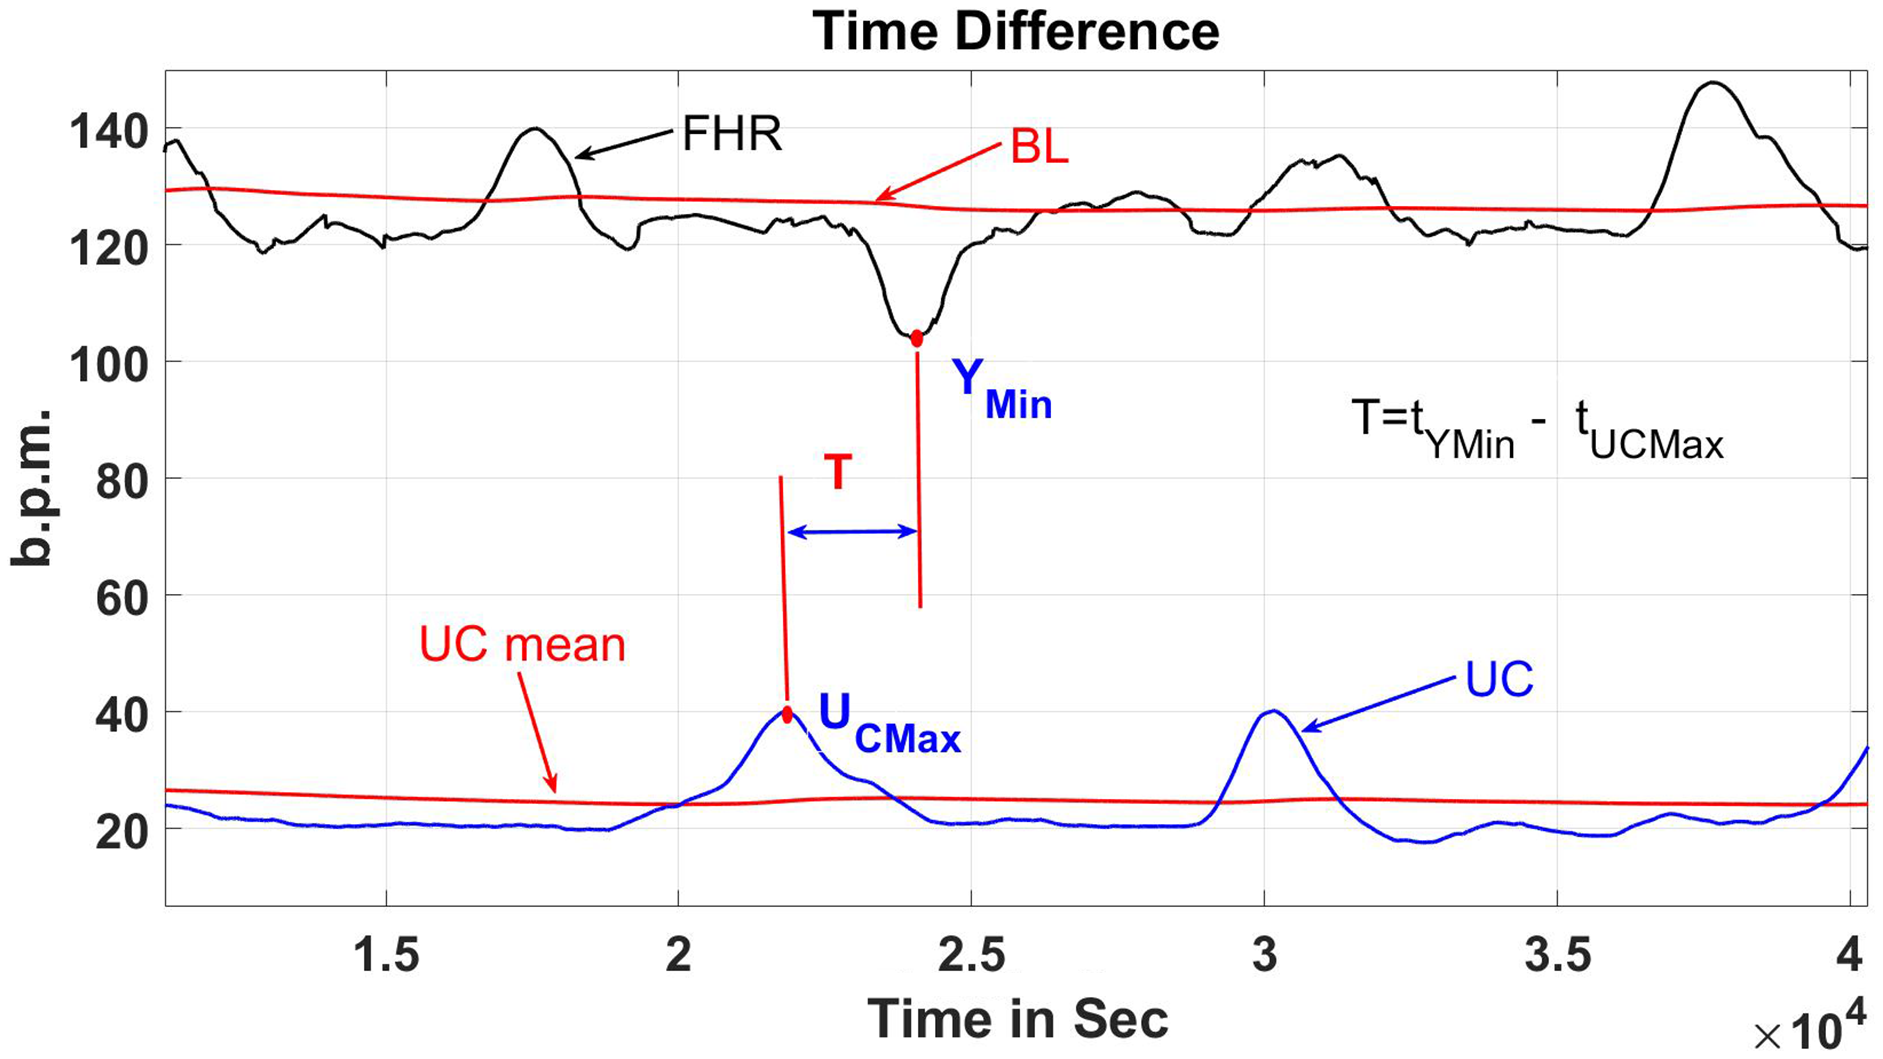
T is the time contrast in seconds between UC and FHR in the CTG signal is shown in Fig. 19 (deceleration vs uterine contraction time gap). Based on the RCOG recommendations, T is the variable for assessing the kind of deceleration, to ascertain if it is early or late deceleration. As stated in Eq. (9) below, if T is more than 10 s, the kind of deceleration is termed as late deceleration, and if T is less than 10 s, the kind of deceleration is termed early deceleration.
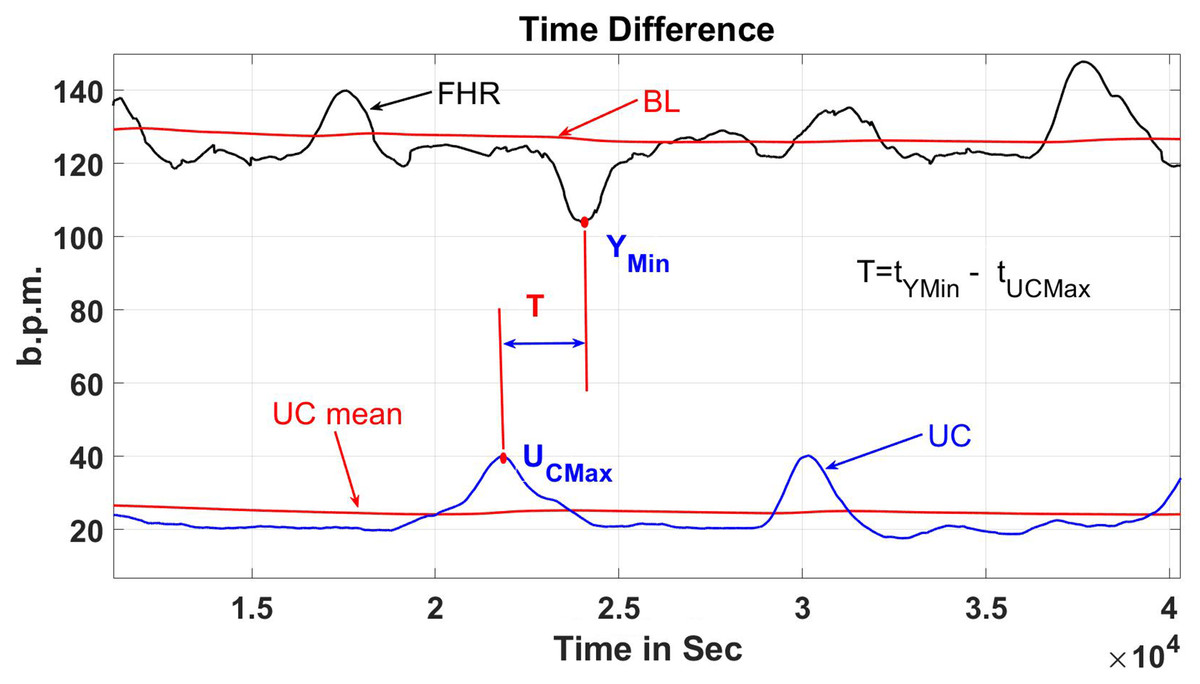
Figure 19: Deceleration vs uterine contraction time gap.
(9)
Algorithms for CTG classification
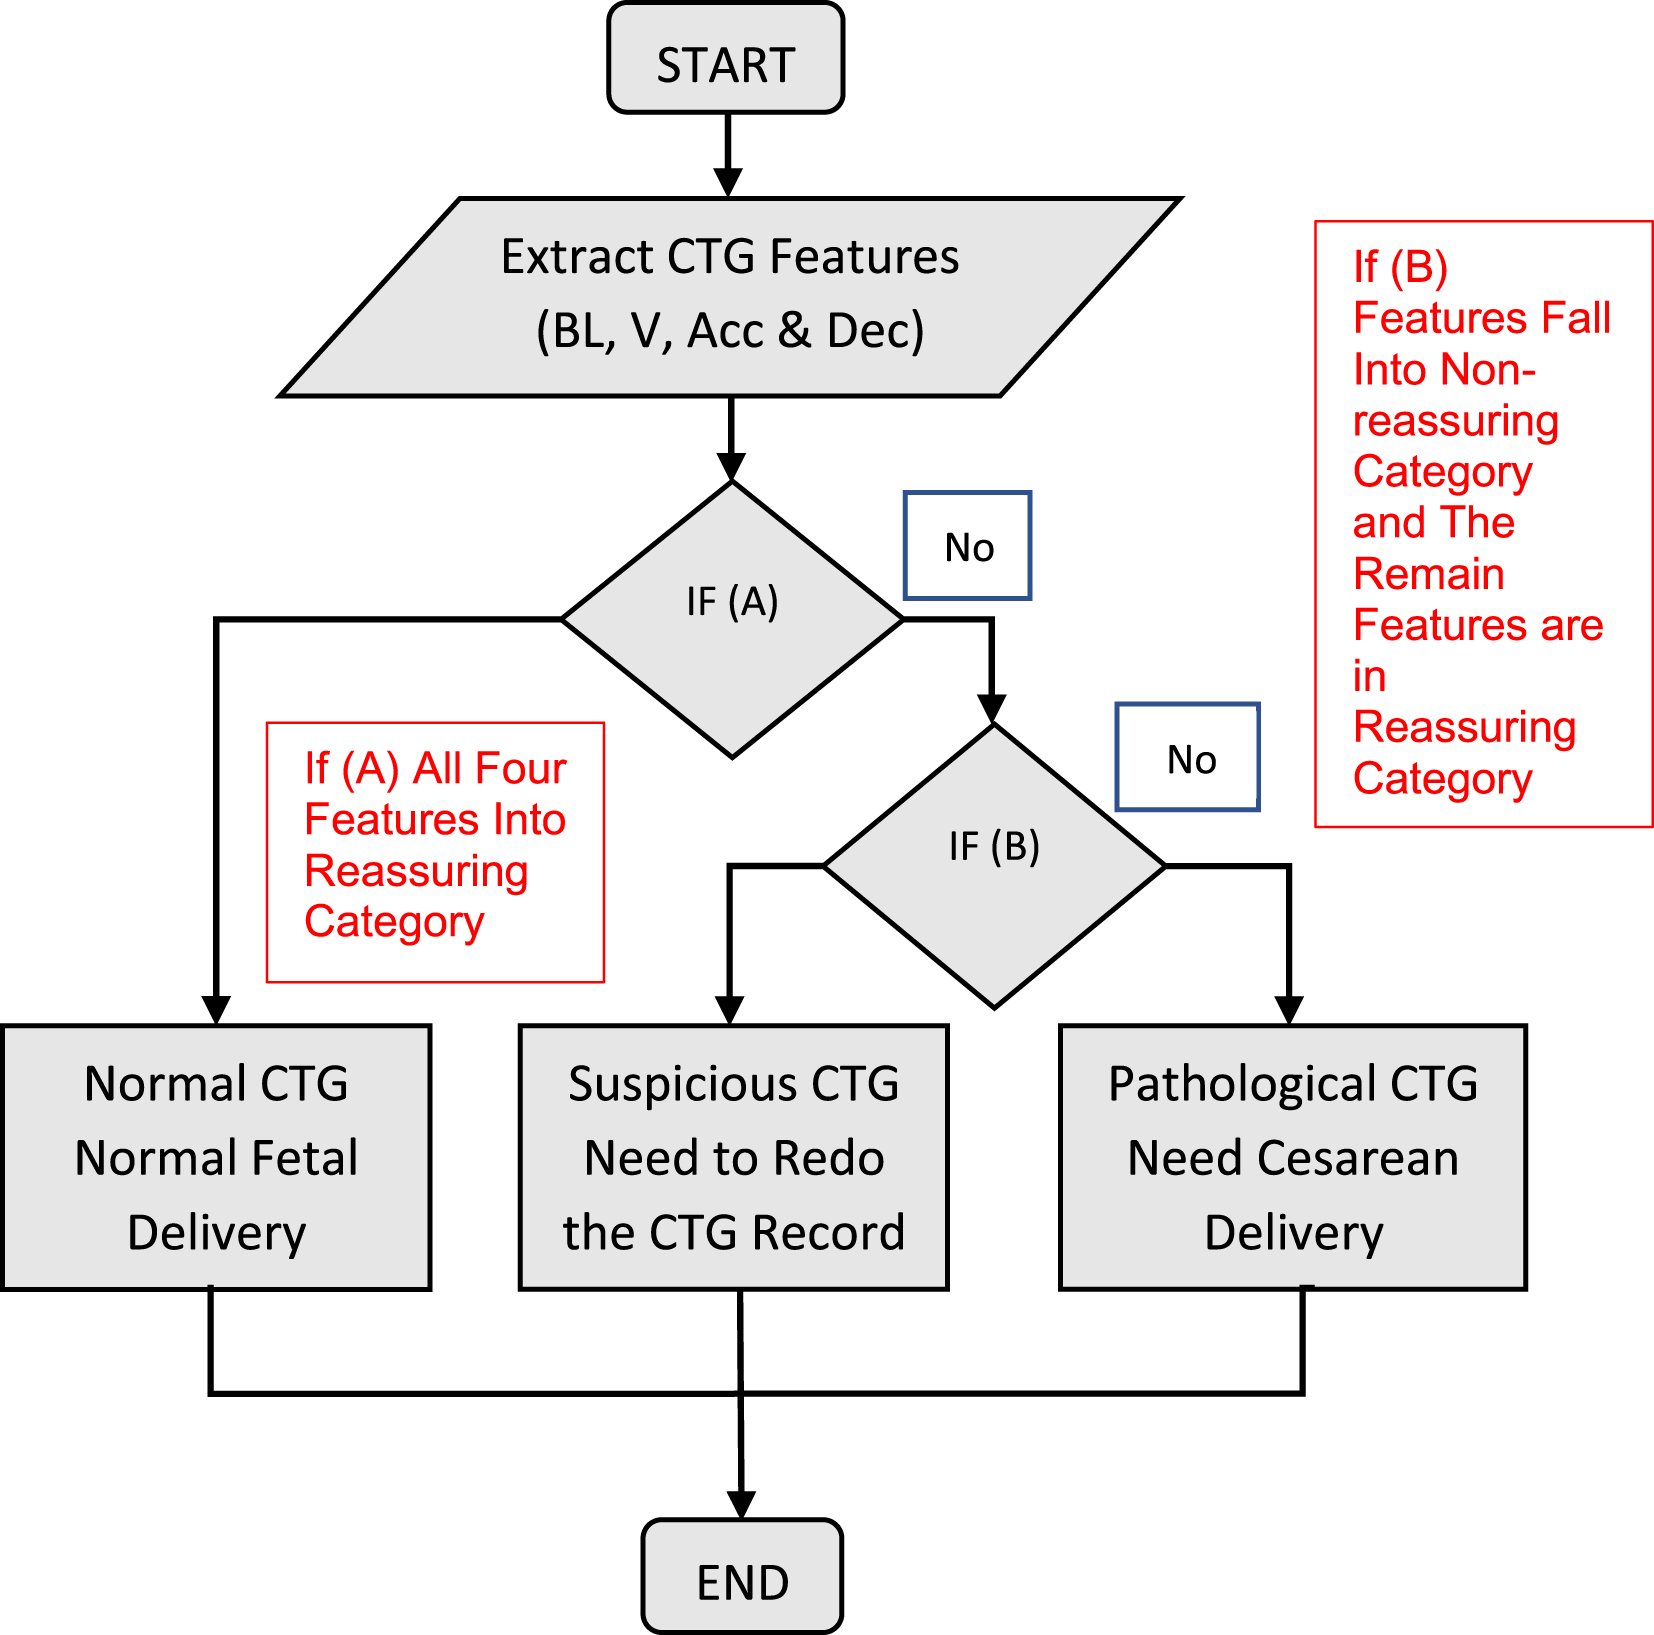
The developed classification technique imports the formerly compiled FHR characteristics (baseline, baseline variability, acceleration, and kind of deceleration) and UC data into the MATLAB rule-based functions. The cumulative score of the FHR signal is calculated using the data in Tables 2 and 3. For the CTG trace pattern classification, there are three conditions: If the entire CTG characteristics are in the reassuring category, then, condition (A) is met; and in instances when the entire CTG characteristics fall under the non-reassuring category, condition (B) is met, and when CTG characteristics fall under 2 or more than two non-reassuring categories, or one CTG characteristic fall under the abnormal category, condition (C) is met. Figure 20 depicts all stages of the operation. The proposed CTG Dataset classification algorithm is based on MATLAB source code. The recommended CTG Dataset classification algorithm is developed according to MATLAB source code. The RCOG standard categorization sets are employed in the MATLAB-based classification algorithm source code, as illustrated in Tables 1 and 2.
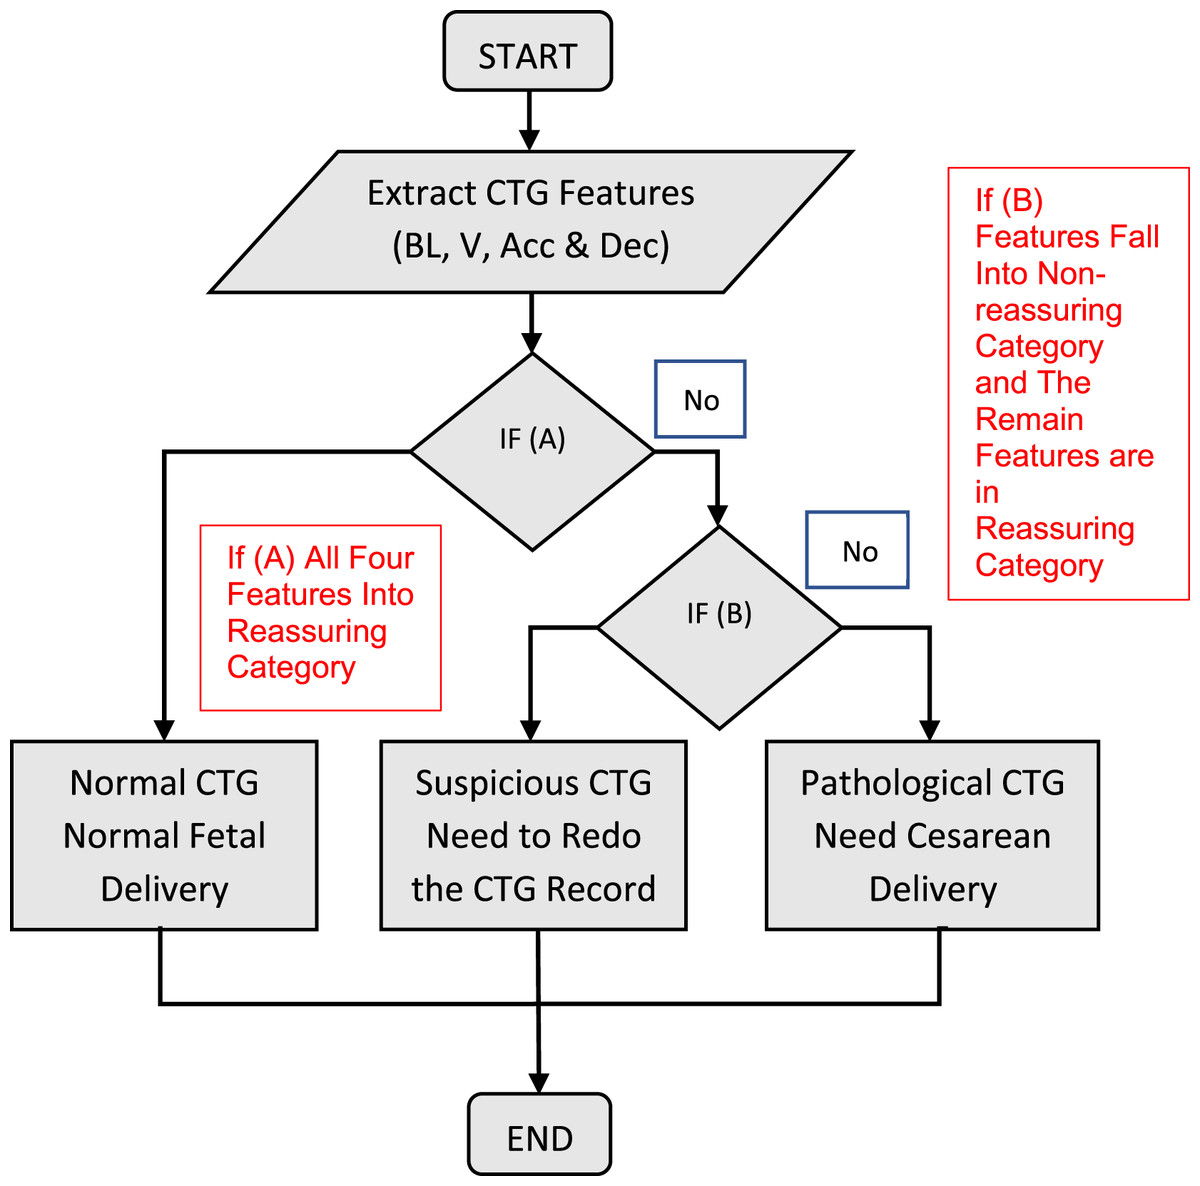
Figure 20: Procedure for classification in general.
The algorithm classified the input data (baseline, baseline uncertainty, acceleration, and deceleration) into the ensuing groups: If all the inputs are reassuring, the CTG categorization is “Normal.” The CTG form is “Suspicious” on the condition that any single input is in the Non-reassuring category and the remainder of the inputs fall under the Reassuring category; conversely, the CTG form is “Pathological.” To verify the acquired findings to guarantee the validity of the classification technique employed, the second algorithm was utilized.
Validation methods
Statistics is defined as a technique for generating fresh insights from a set of data. It has become a crucial aspect of biomedical science due to its capacity to cope with data gathering, presentation, investigation, and interpretation for the aim of reaching a conclusion. Statistics were used at different levels in this analysis, from data representation to validation. To assess the validity of the acquired classification outcomes, several statistical methodologies rely on a contrast between the test results and the interpretation of specialists in the field of biological signal processing. In this project, kappa statistics were used. Cohen’s kappa coefficient (Garabedian et al., 2017) is a statistical measure used to evaluate the inter-rater agreement between two categories. It purports to be exempt from any accord that happens by accident. In Eq. (10), the kappa value may be determined as follows (Garabedian et al., 2017).
(10)
Denotes the relative observed agreement, and denotes the hypothetical likelihood of chance agreement, both of which are calculated using the relationship in Table 5. This table illustrates how the K value is interpreted. The relative observed agreement is signified by , whereas the theoretical probability of chance agreement is signified by , and both are computed using the correlation in Table 5. The table shows the interpretation method for the K value.
| Value of k | Strength of agreement |
|---|---|
| <0.20 | Poor |
| 0.21–0.40 | Fair |
| 0.41–0.60 | Moderate |
| 0.61–0.80 | Good |
| 0.81–1.00 | Very Good |
Results
This section discussed the results obtained using the algorithms developed for feature extraction purposes which are based on the morphological method followed by the classification stage that complies with the guideline of RCOG. Results of the CTG attained were compared by five experienced obstetricians based on their visual interpretation of the CTG and this is adopted as the gold standard for the CTG interpretation. The FHR signal fundamental feature acts as the baseline along with several other features. The validity of feature extraction methods will be addressed after the algorithm’s validation. The output of the classifier is recorded and addressed near the end of the section.
Signal enhancement results
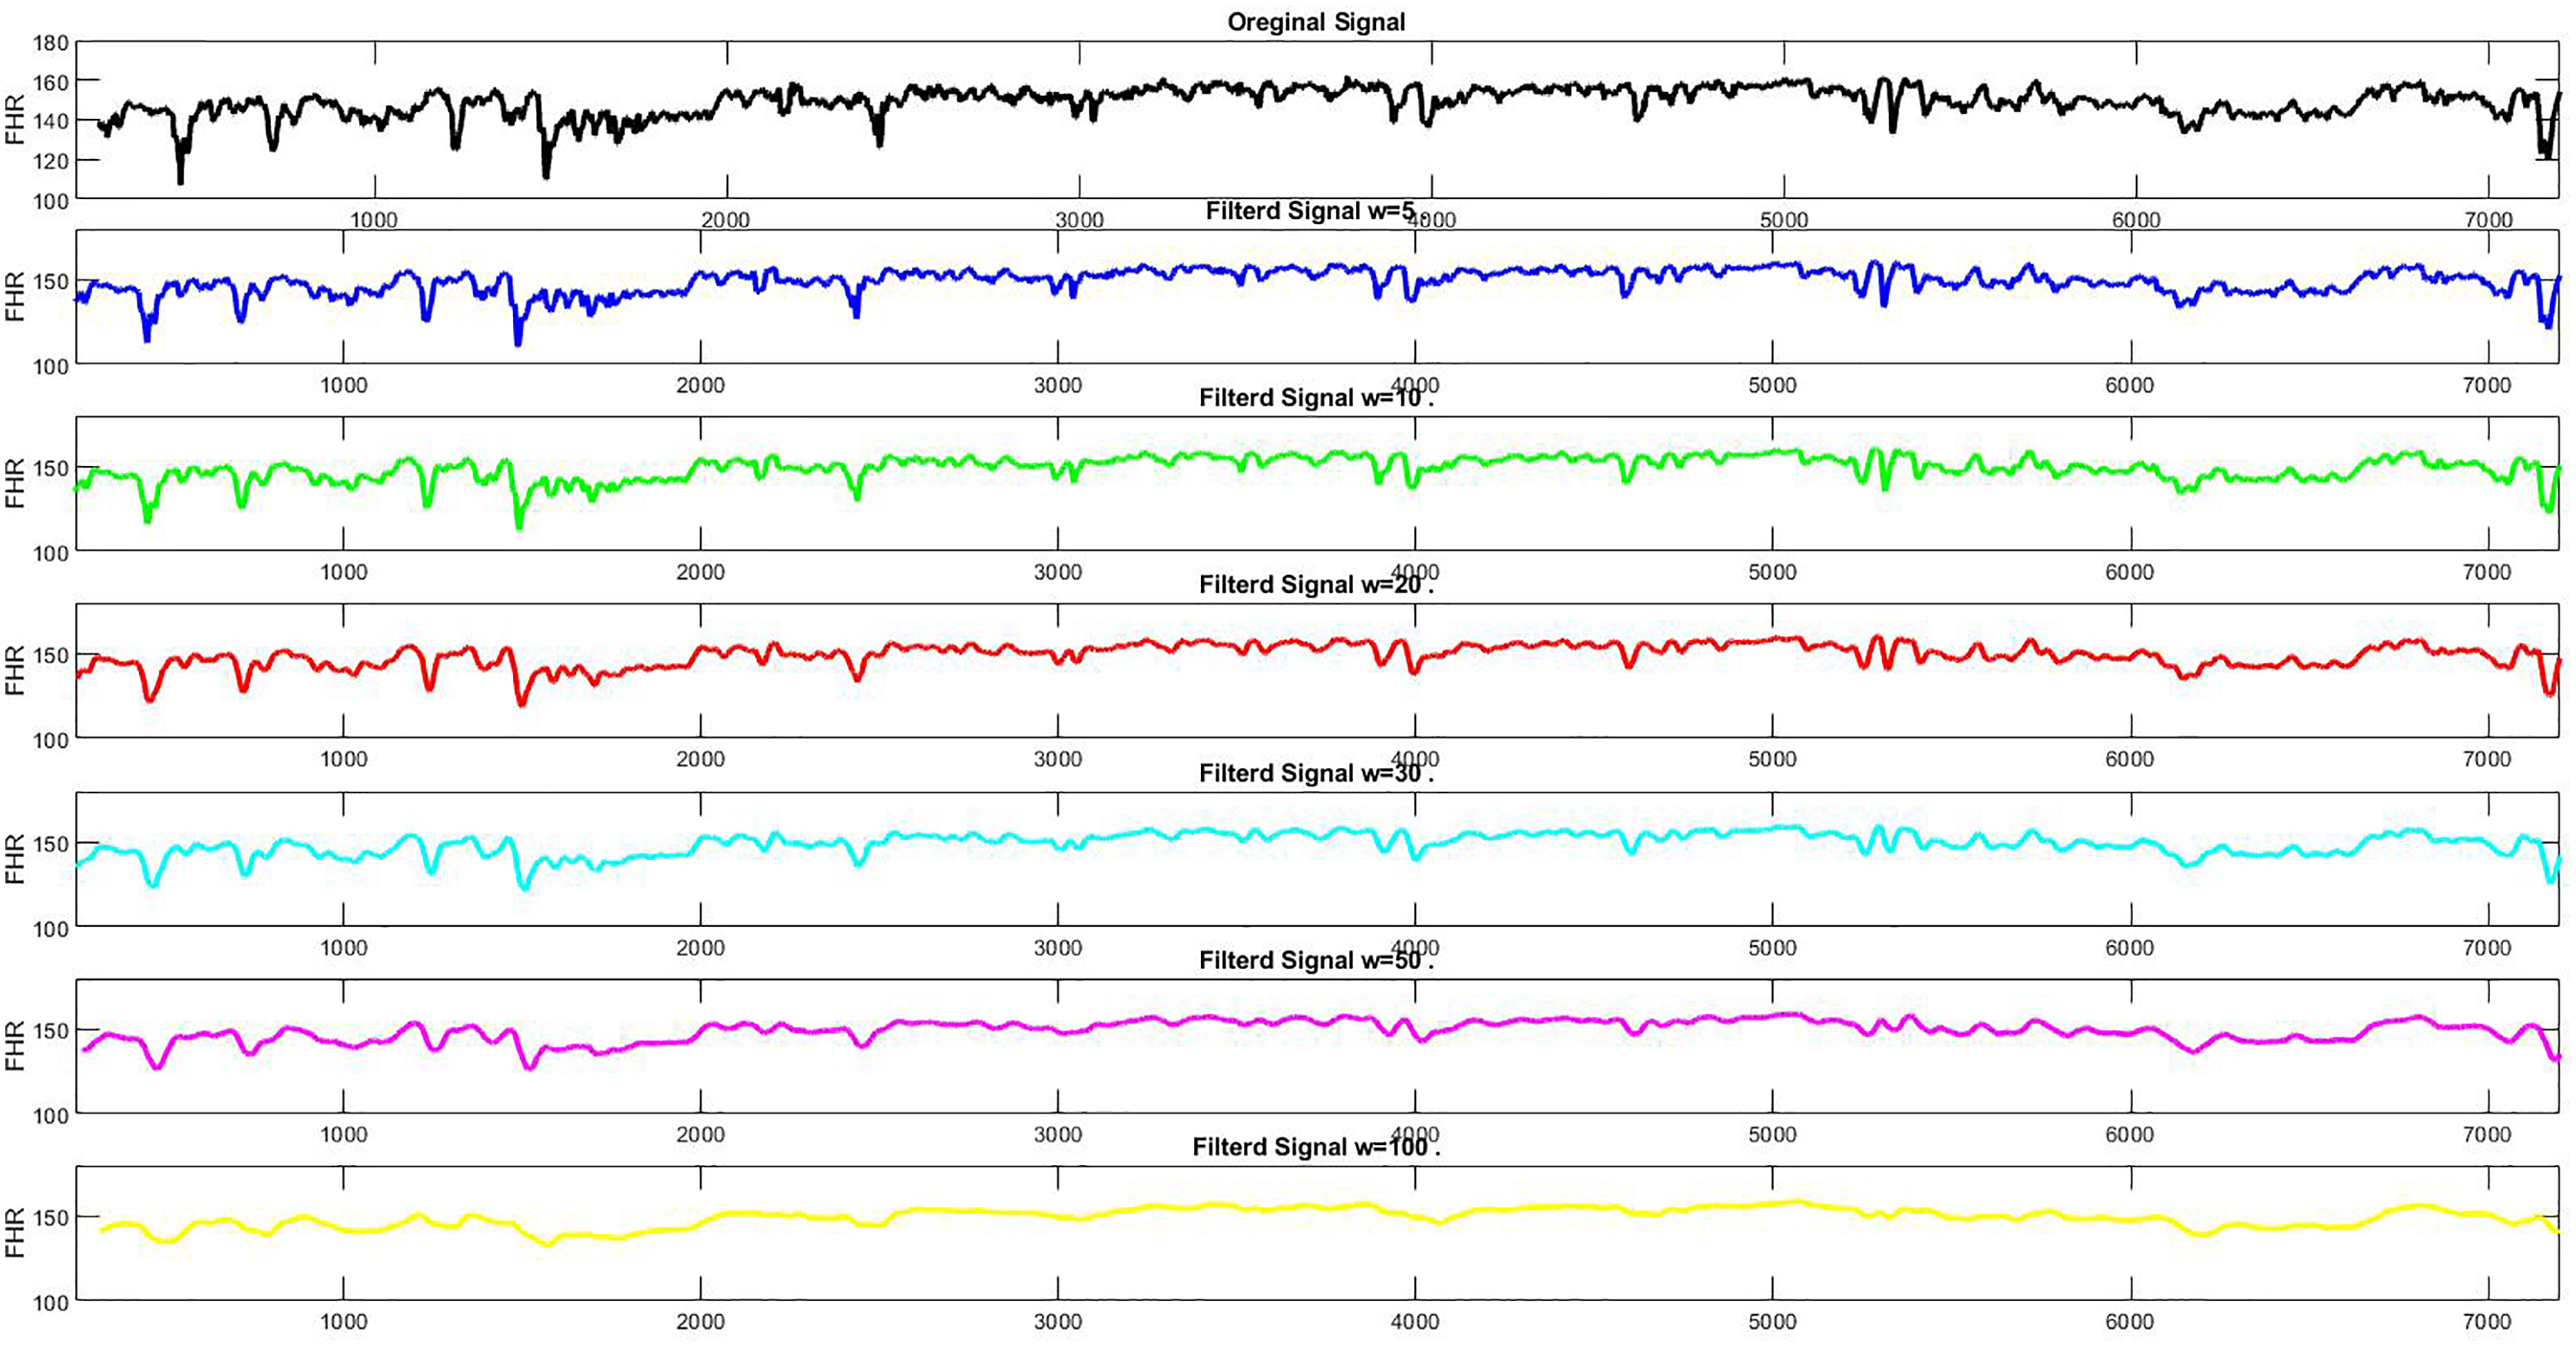
Enhancement of the CTG signals is done based on the moving average filter. Figure 21 illustrates the method used to attain the window size (w) ideal value of the filter. The appropriate window size values that gives the best CTG signal shape without losing valuable information are from 30 to 50 as shown in Fig. 21. As a result, the specialists select window size filter w = 30 as the moving average filter since this value has provided the most reliable visual interpretation. On the other hand, for w = 50 the CTG shape was distorted which may further lead to loss of data or important features that include accelerations and deceleration as well as the variability of the signals (Ayres-de-campos et al., 2000). Furthermore, the moving average filter is used to remove or eliminate spiky signals from the FHR as well as the UC signals, thus, eliminating the noise of most high-frequency signals that impairs contraction detection (Ayres-de-campos et al., 2000; Struzik & van Wijngaarden, 2001) Good results were obtained with the developed moving average filter based on MATLAB to enhance the CTG dataset, allow the interpretation of the CTG datasets by specialists. The utilized algorithm can reduce unneeded spiky signals as well as mitigating with missing data, which might interfere with specialist analysis and extraction of CTG characteristics. A sample of signals from CTG data prior to and ensuing the elimination of irrelevant signals (noise) are shown in Figs. 22A and 22B.
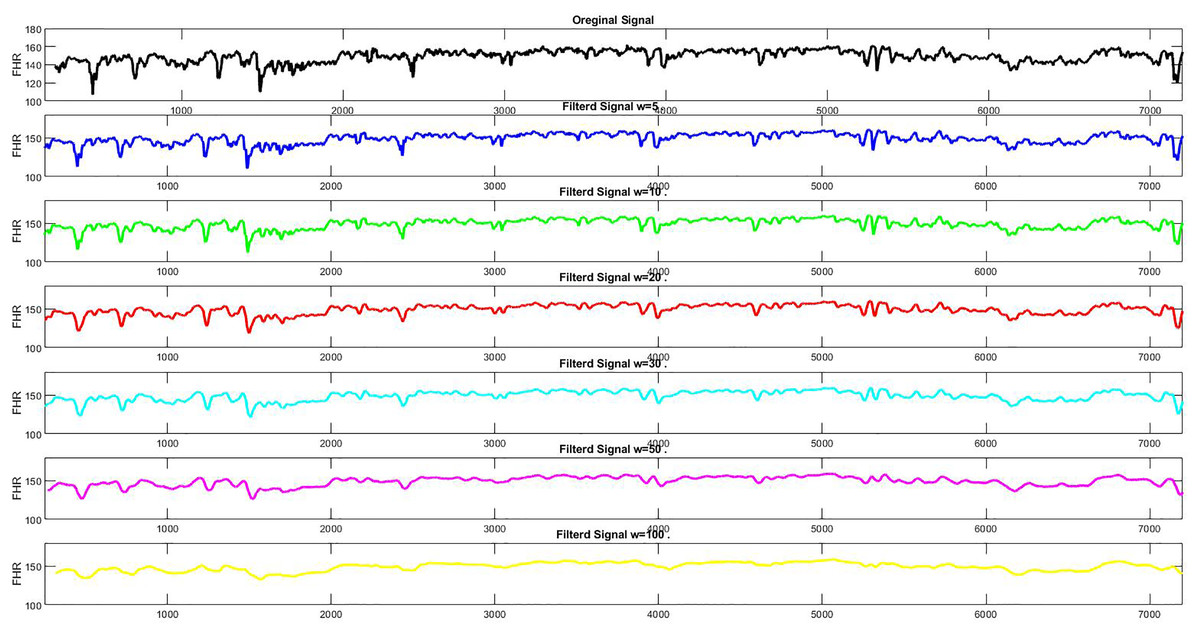
Figure 21: (A) The noisy FHR signal, (B) the denoised FHR signal with w = 1, (C) w = 5, (D) w = 10, (E) w = 20, (F) w = 30, (G) w = 50, (H) w = 100.
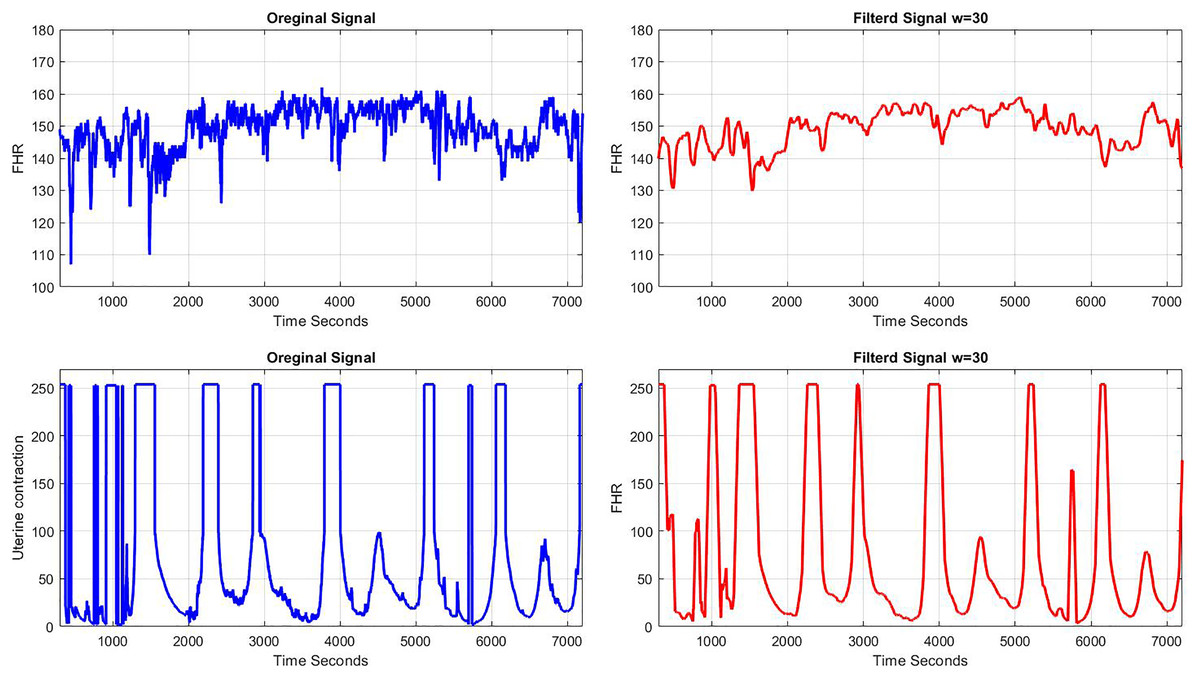
Figure 22: A sample of FHR and UC (A) before pre-processing, (B) after pre-processing.
Results of the baseline estimation
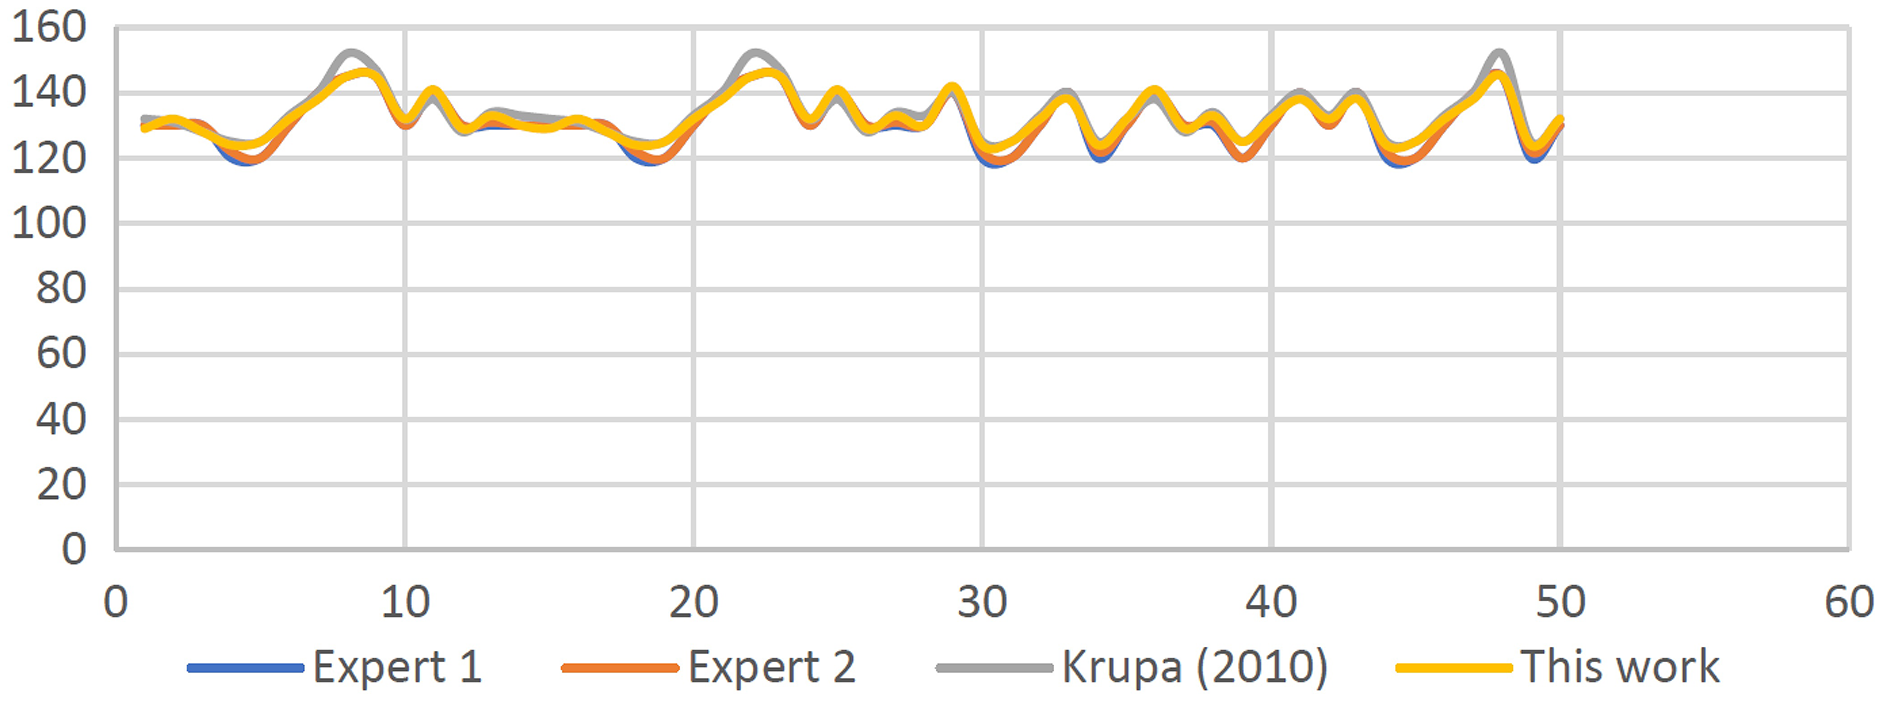
First, estimation of the first set of signals (S1–S50) vs the baseline is done using the developed algorithms. The results attained are shown in Fig. 23. As observed, slight differences are seen based on the results attained vs the results by researchers and expert panels. The discrepancies in the output values are between (+/−2) b.p.m. and within the acceptable range of the expert panels’ estimations.
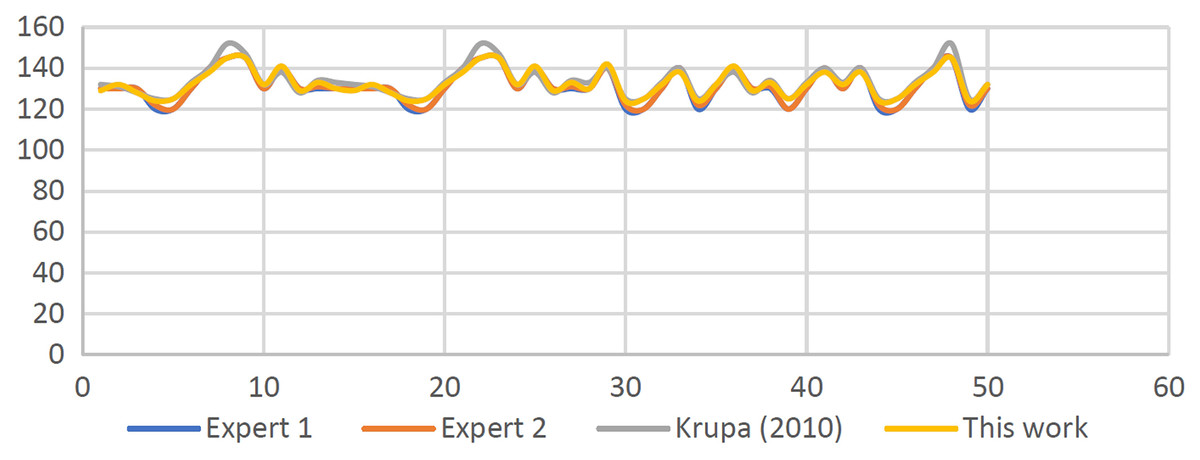
Figure 23: Comparisons between computerized baseline estimation and expert estimation.
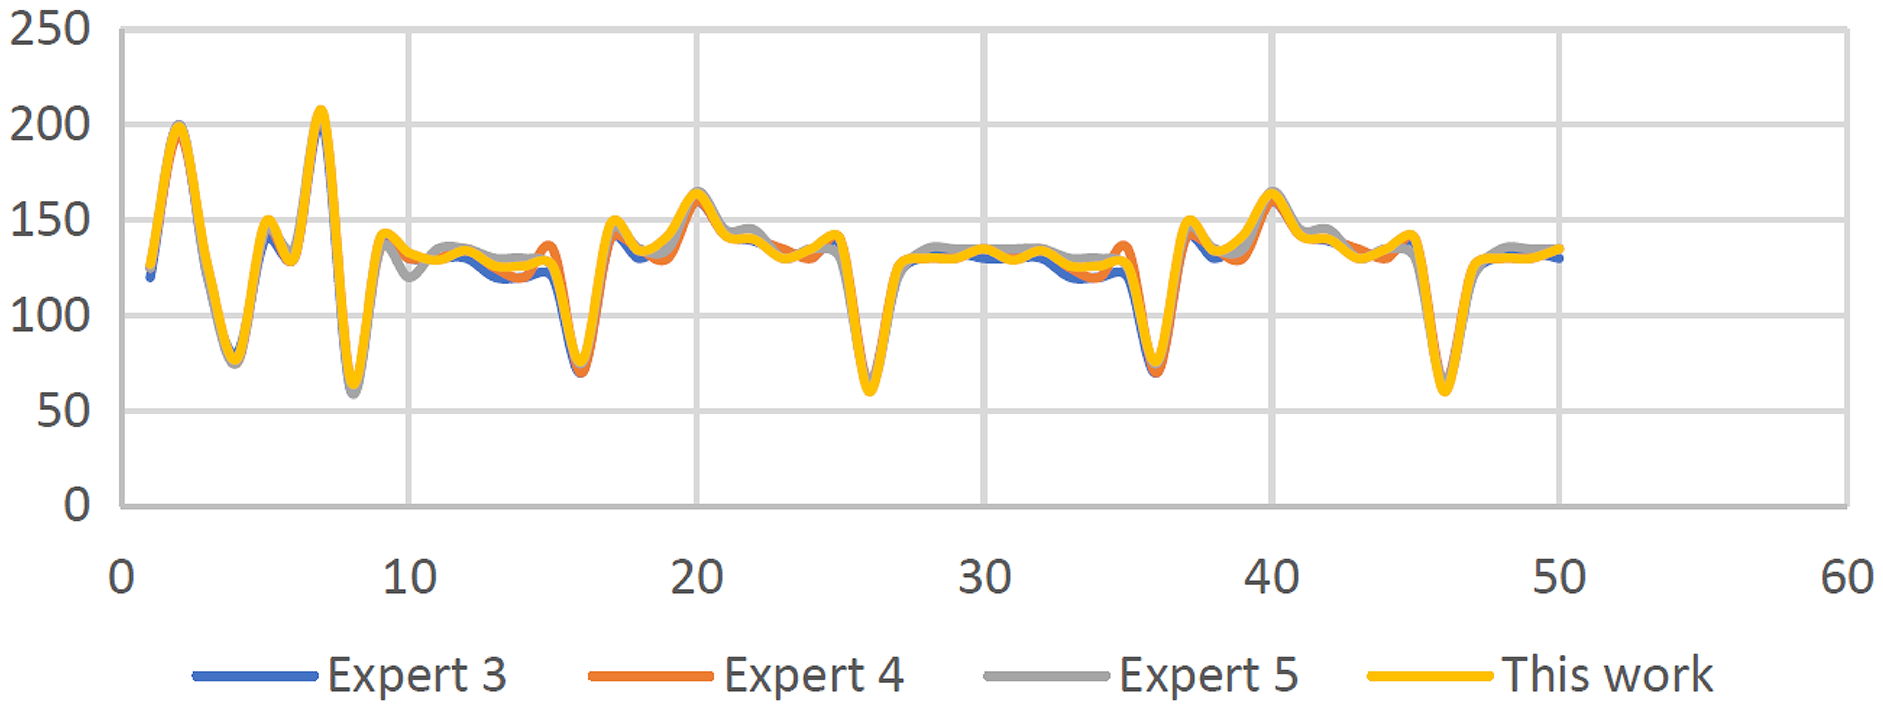
Next, the developed algorithm is tested using the second set of data signals namely (S51–S100). The same signals are given to three expert panels specifically Expert No 3, 4, and 5 to seek their expert visual interpretation. Further, obstetricians were required to estimate the baseline of the FHR samples. As seen in Fig. 24, once again a comparison is made between the computerized outputs with the results estimations a panel comprising of three experts. The results are within the allowed range of (+/−3) b.p.m. and are nearly identical to the estimates produced by the three expert panels except for signals S55, S60, S67, S73, S87, and S93, since these signals are representing irregular CTG signals.
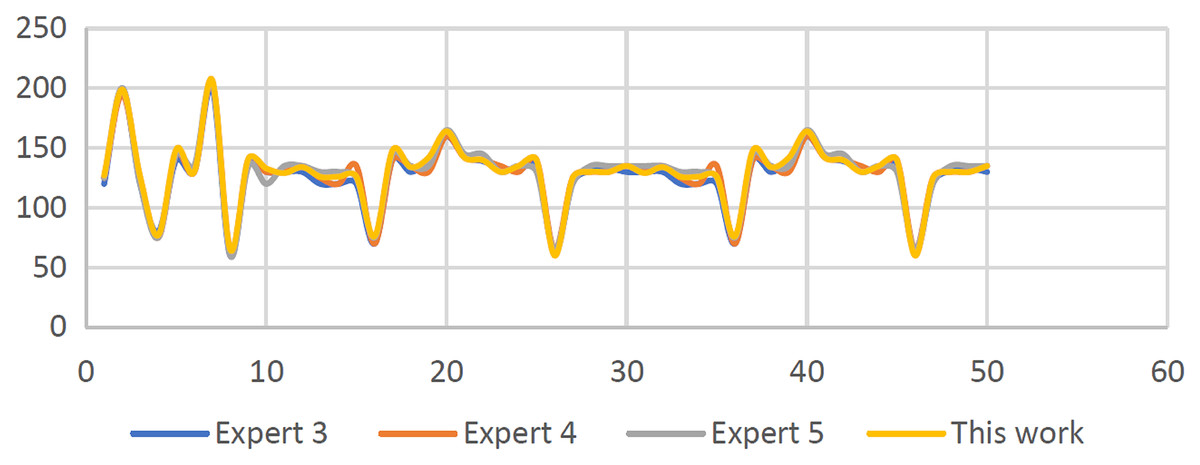
Figure 24: Baseline FHR results for synthetic CTG signals are computerized and visually estimated.
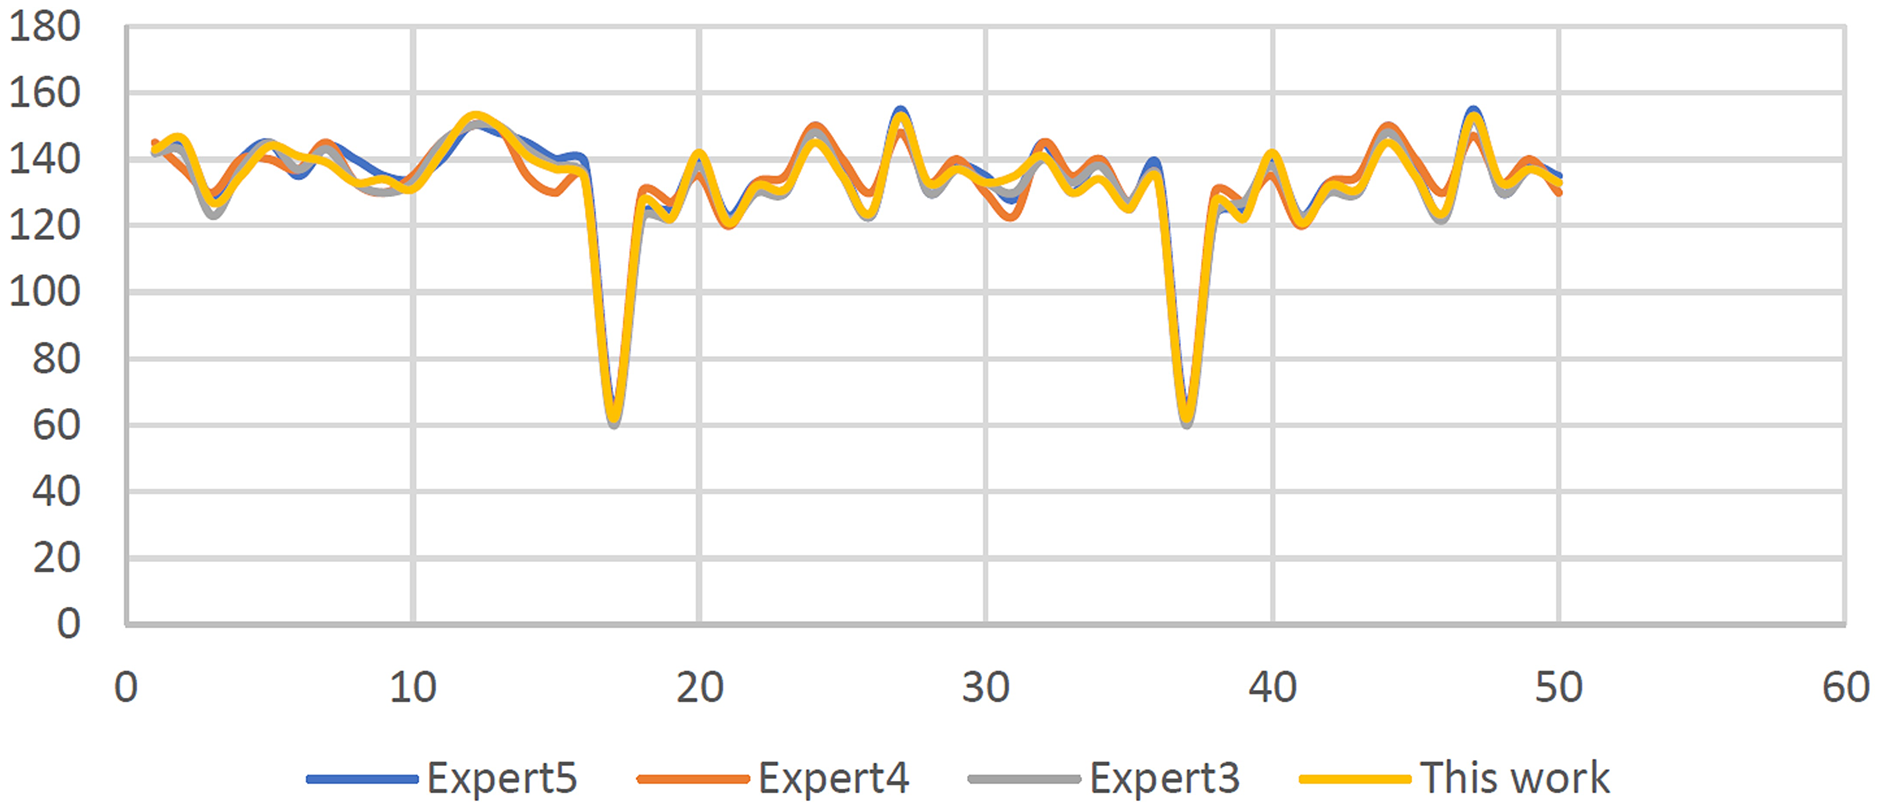
Furthermore, as shown in Fig. 25, the results attained are for the baseline of the 50 CTG signals that are categorized as in the reassuring state (RCOG 2003) except for five signals specifically S57, S59, S62, S73, and S81 that were considered to be non-reassuring. In addition, signal S75 is considered in the abnormal category. Next, the third dataset namely the clinical signals were then used to evaluate the developed algorithm, and like before, the identical sample signals were sent to the trio of experts, namely experts 3, 4, and 5. The determination of the baseline of the FHR samples estimations was also required of the obstetricians. Moreover, upon a comparison of both results using the computational method and the expert panels’ estimation results, the predicted results of the experts were all within (+/−4) b.p.m. and found to be almost identical to the outcome results.
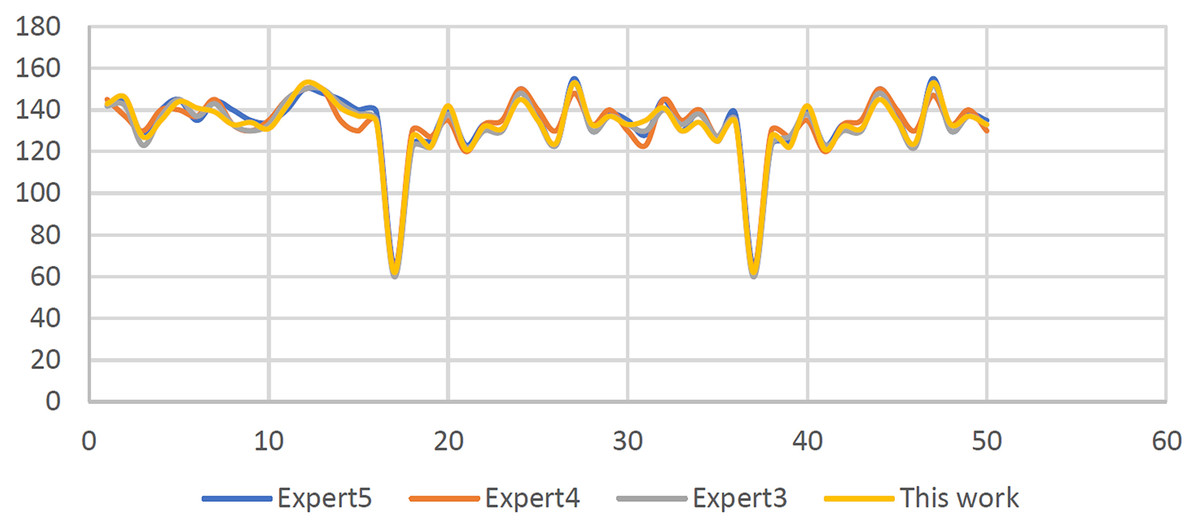
Figure 25: Baseline FHR outcomes for clinical CTG signals are computerized and visually estimated.
Results of variability estimation
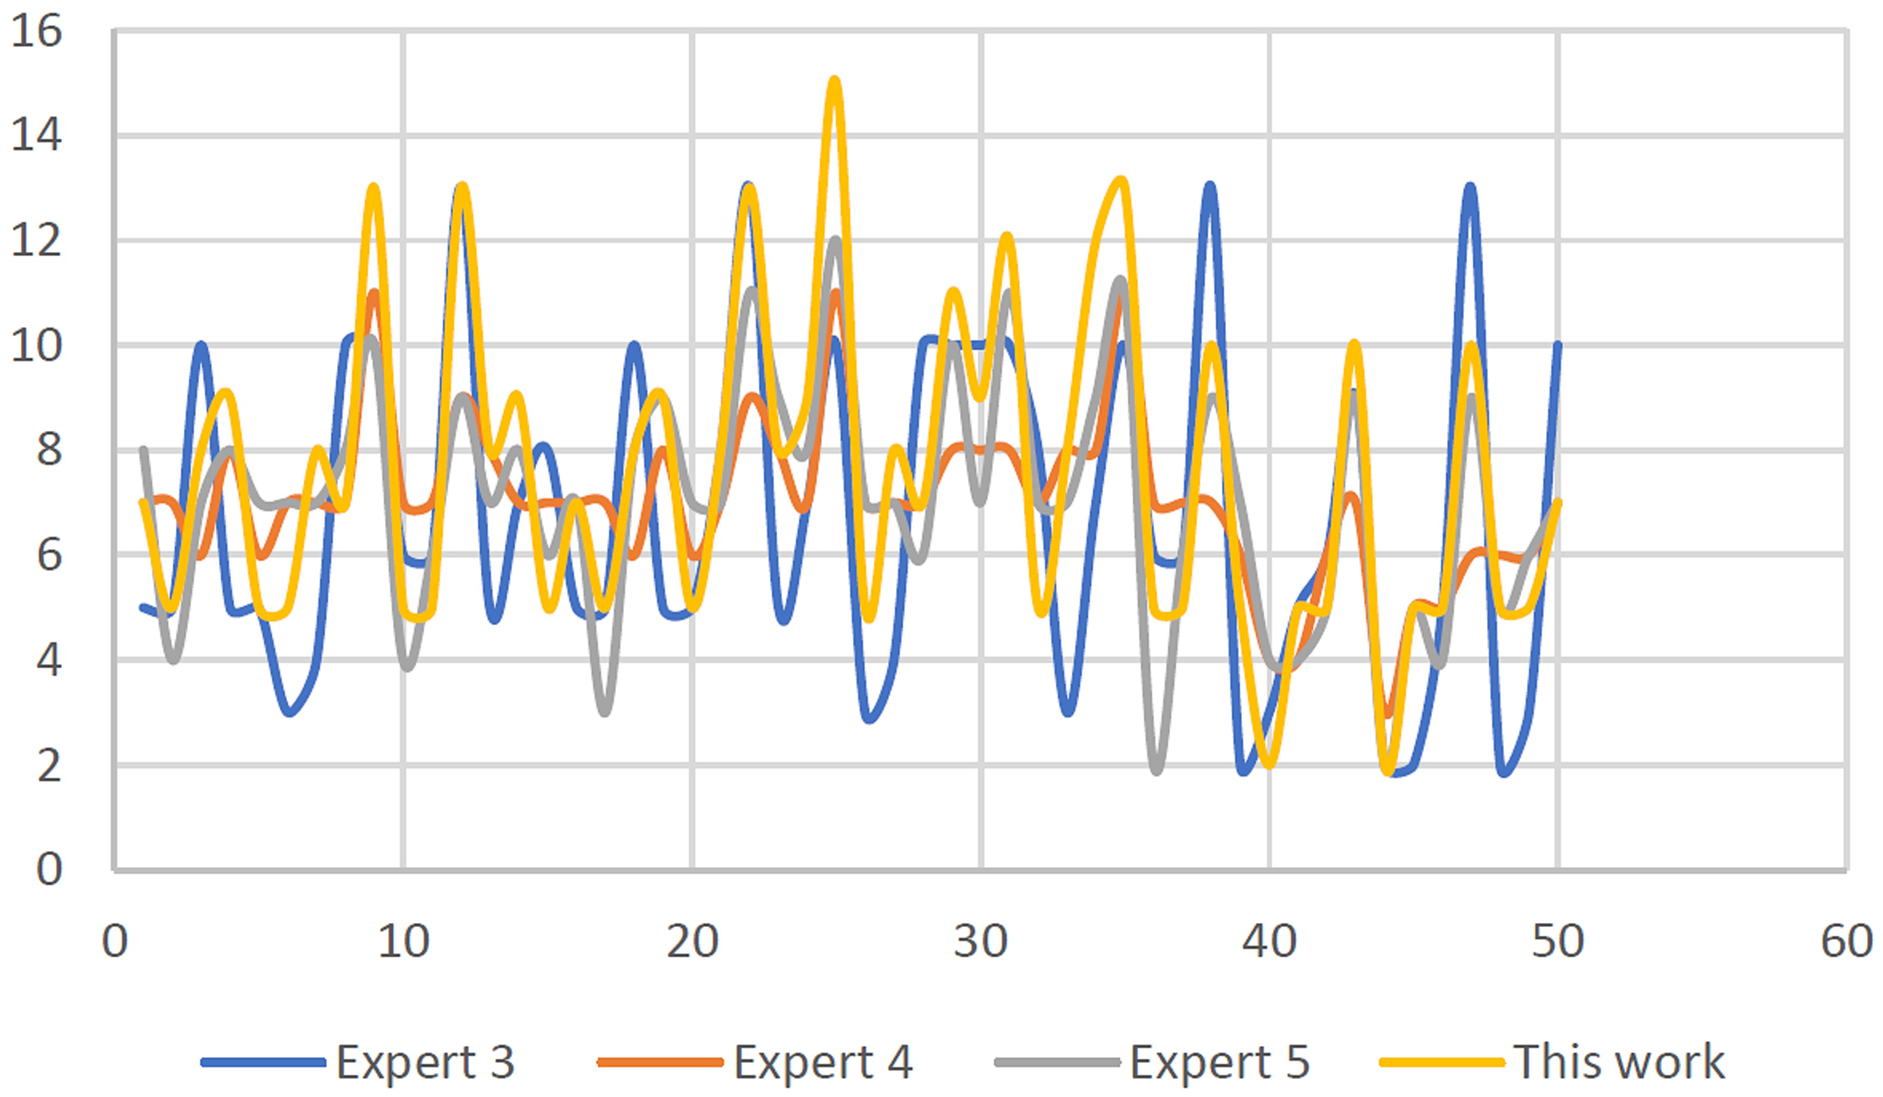
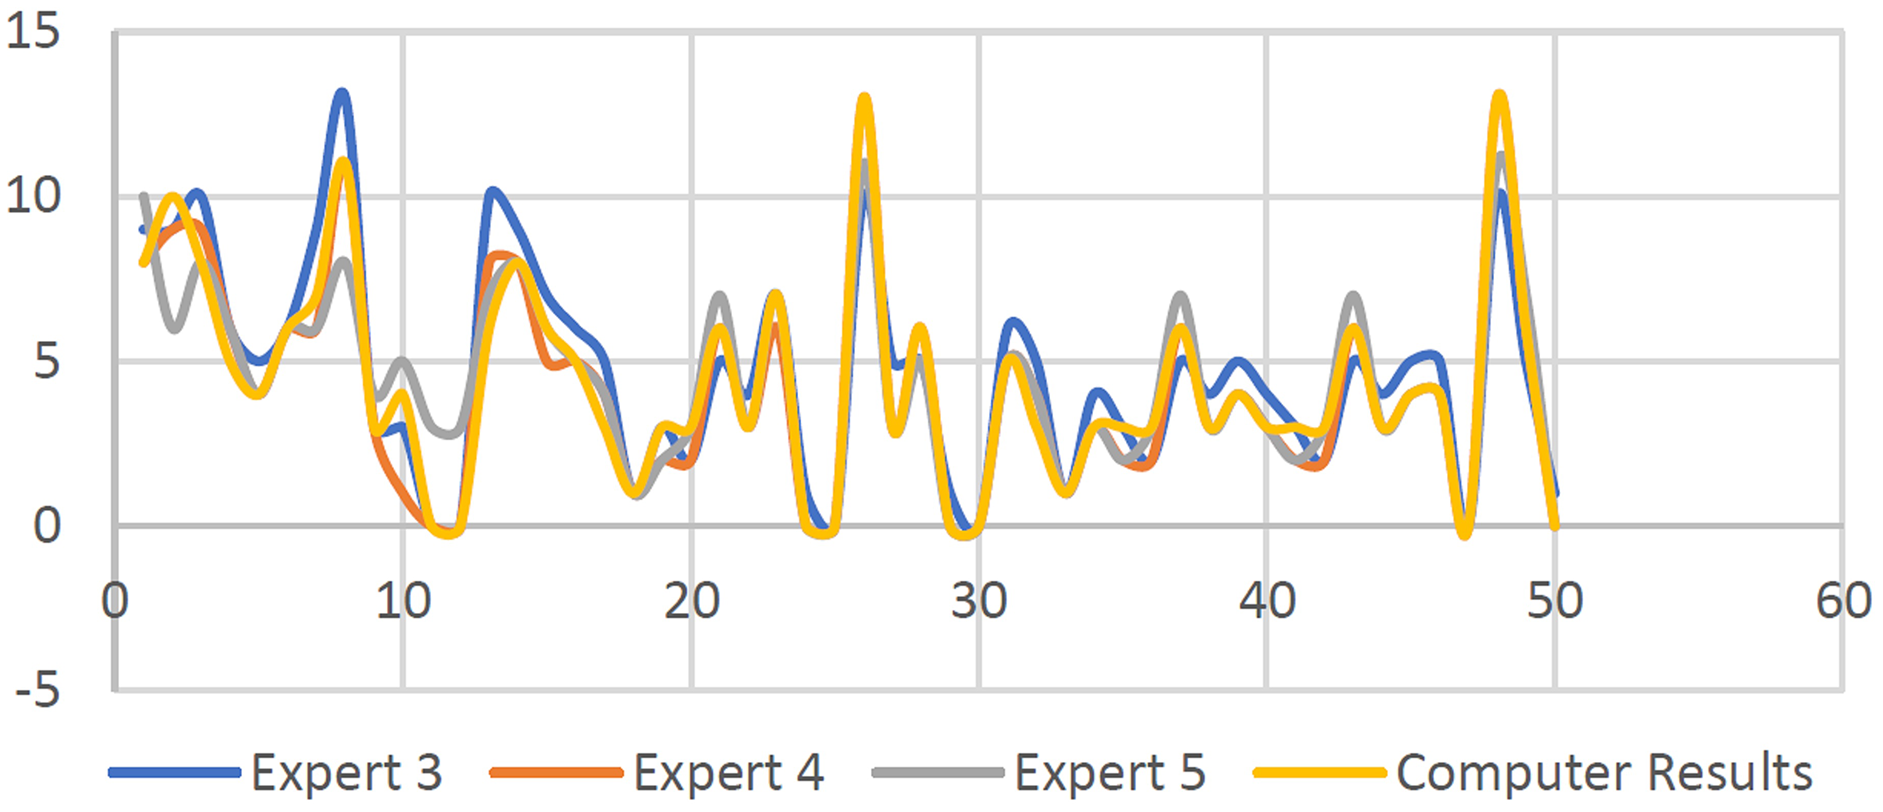
In this section, the results interpreted by the three expert panels based on their skilled visual interpretation are compared with the results attained using the proposed algorithms with two sets of CTG data specifically S51–S100, which acted as the first set of data, and is further depicted in Fig. 26.
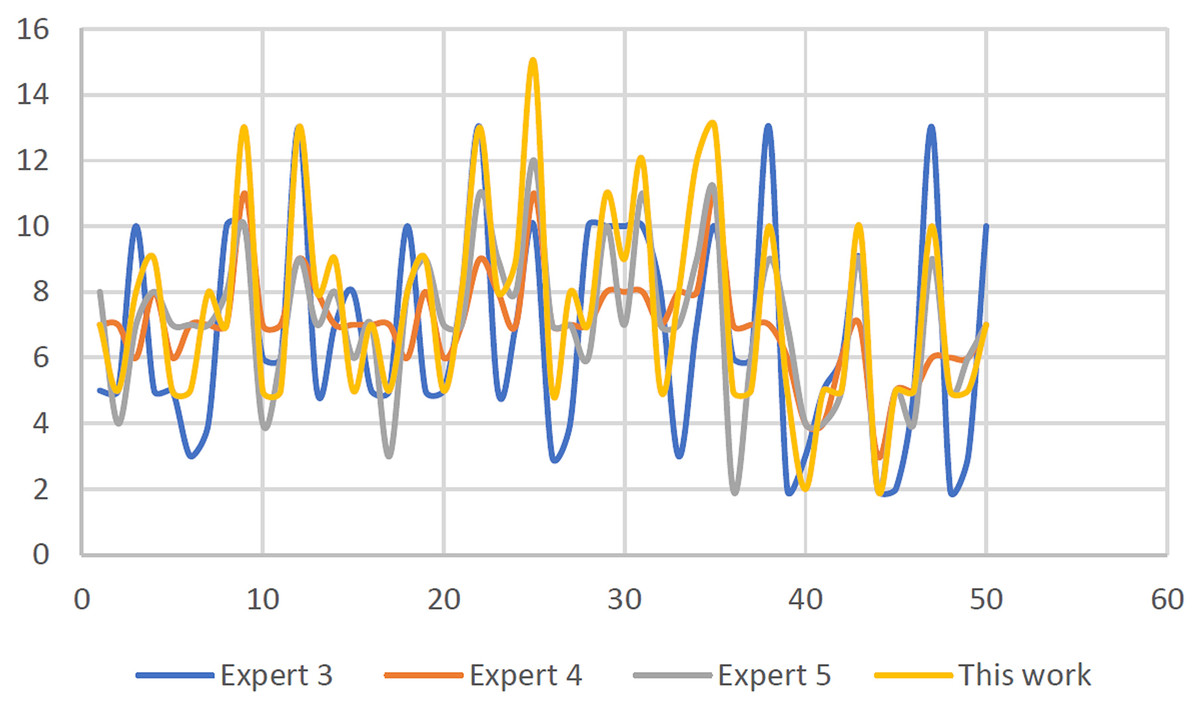
Figure 26: FHR baseline variability effects for semi-synthetic CTG signals: computerized and visual estimation.
Except for signal S25, which showed a discrepancy between the expert panels’ results, the obtained outcomes are between (+/−5) b.p.m. and mirrored the estimated interpretation results given by the panel of experts. This is due to the dissimilarity amongst guidelines made by each infirmary.
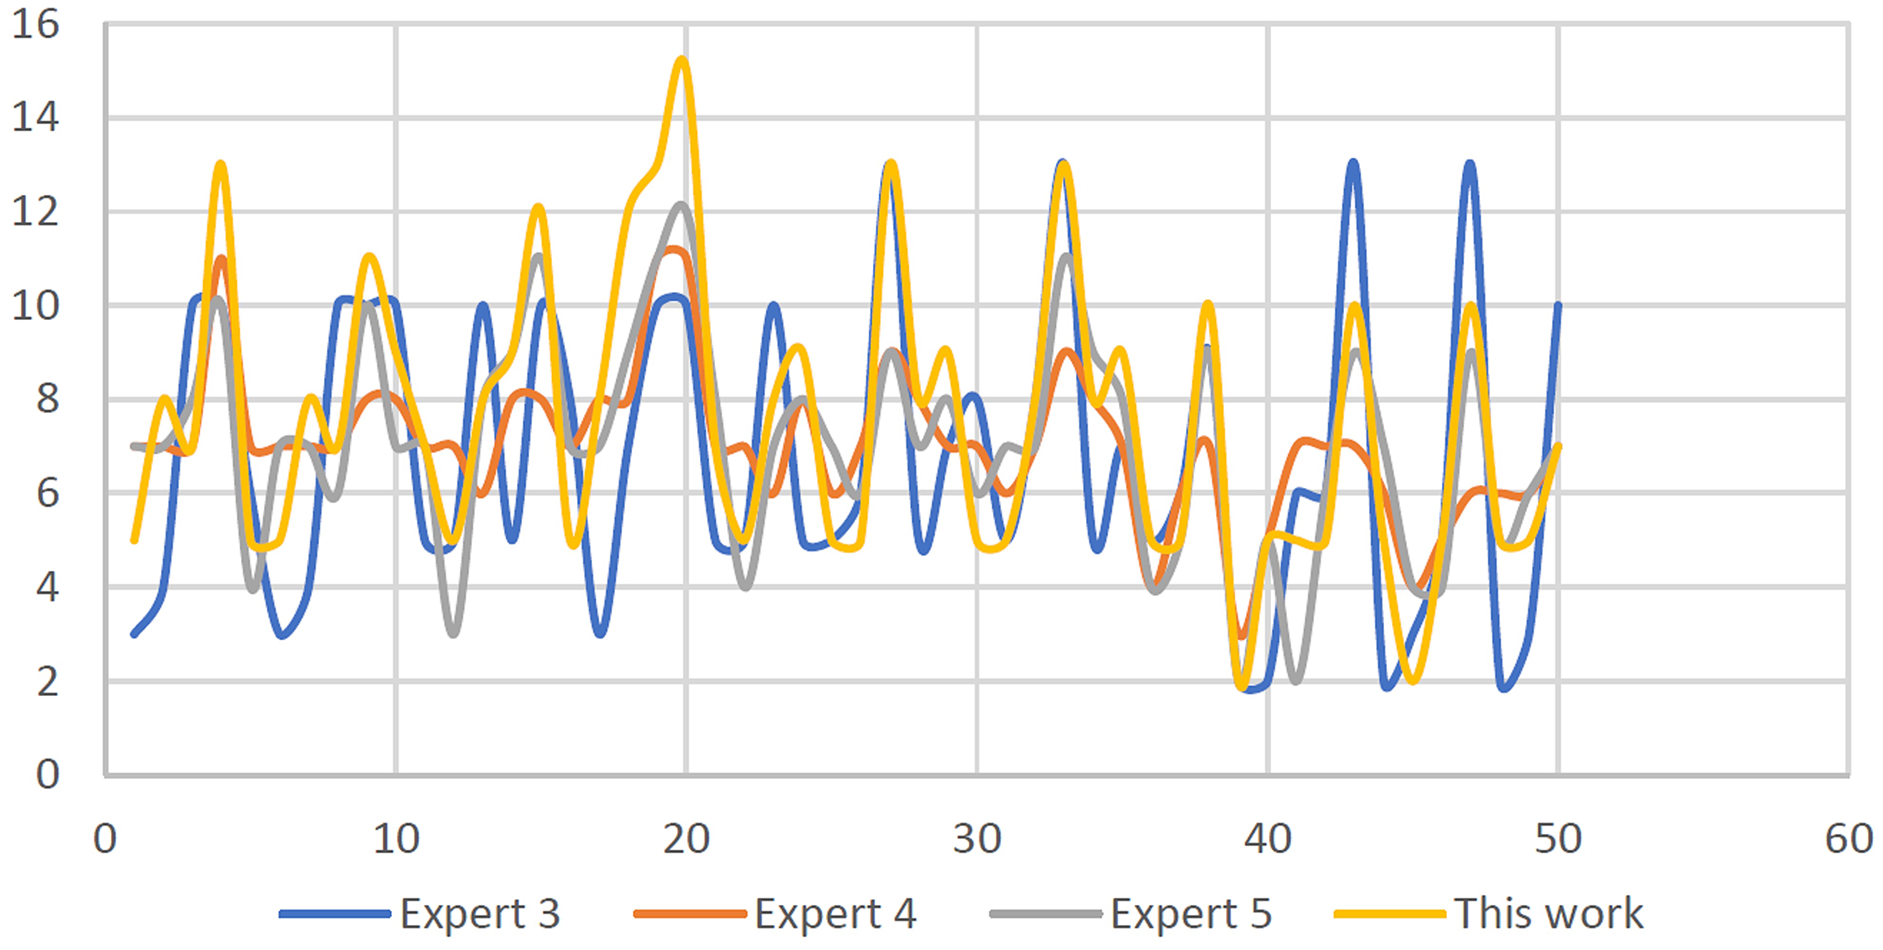
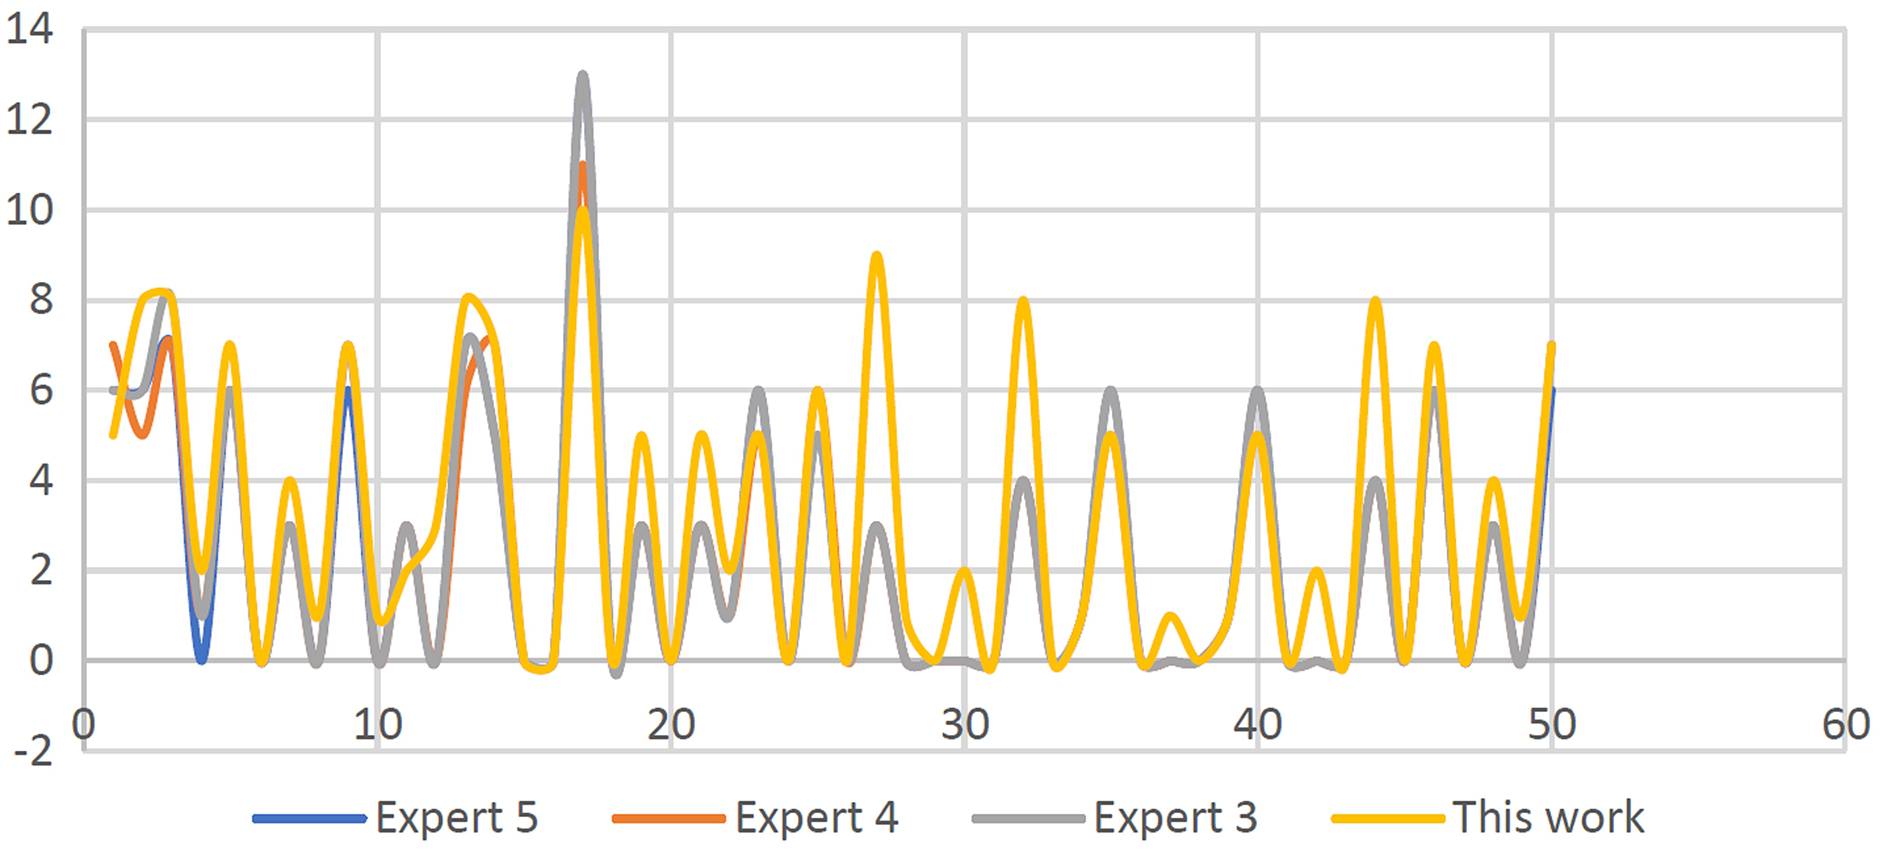
Referring to Fig. 27, except for four signals namely S17, S20, S26, and S32 categorized as non-reassuring signals, other results demonstrated that all 30 CTG signals can be categorized as reassuring upon comparing with baseline variability for all S101–S150, labeled as the third set tested. Furthermore, the output findings are within (+/−5) b.p.m., the variance, and results that are close to the expert panel estimations, except for the interpretations of the outcomes by the second expert, which provides a greater spectrum of variability assessment. The S37, S40, S41, S43, S45, S47, S49, S50, S51, S53, S59, S61, S63, S65, S66, and S68 signals are all noted as non-reassuring, the rest of the signals are in the reassuring category. Note that the difference between each expert panel estimation result is due to the difference in the infirmaries system guidelines.
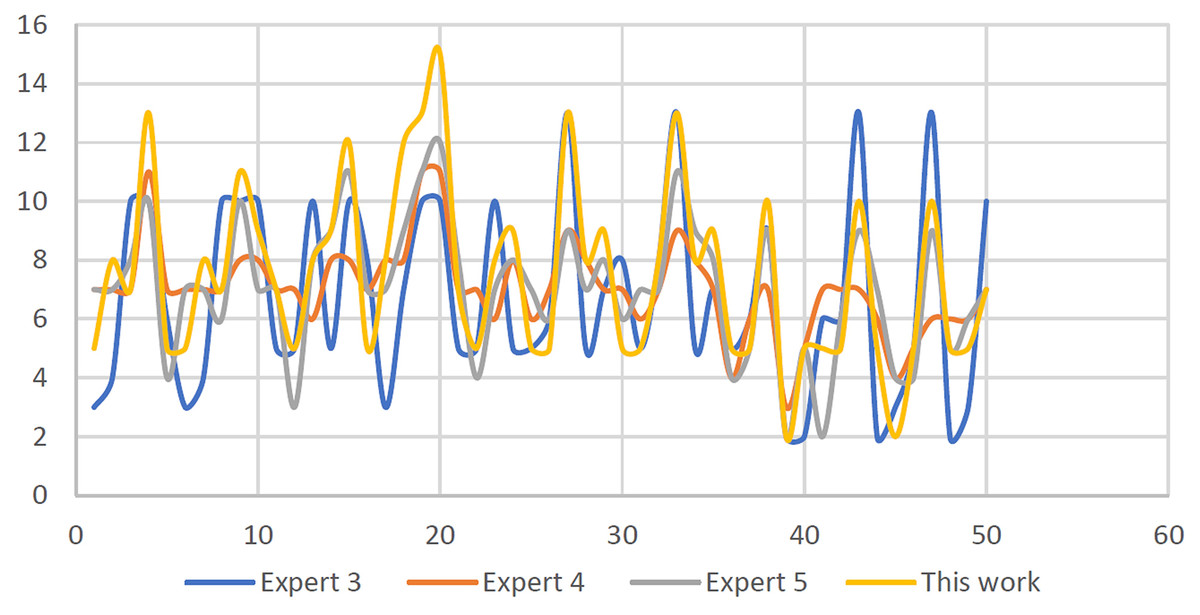
Figure 27: FHR baseline variability outcomes for clinical CTG signals: computerized and visual estimation.
Results of acceleration identification
As discussed earlier, this section will elaborate on the results attained based on the detection of acceleration quantity using the proposed algorithms. Firstly, the total accelerations for every 30 min CTG pattern are computed using the proposed algorithm. As depicted in Fig. 28, (S51–S100) known as the synthetic signals are plotted as the output results. It is observed that the worst result is due to the difference of (+/−4) upon comparison with the results made by the expert panels. The frequency of accelerations is ignored, as the absence or presence of acceleration is the most significant factor in computing the acceleration using the proposed algorithm and according to RCOG guidelines.
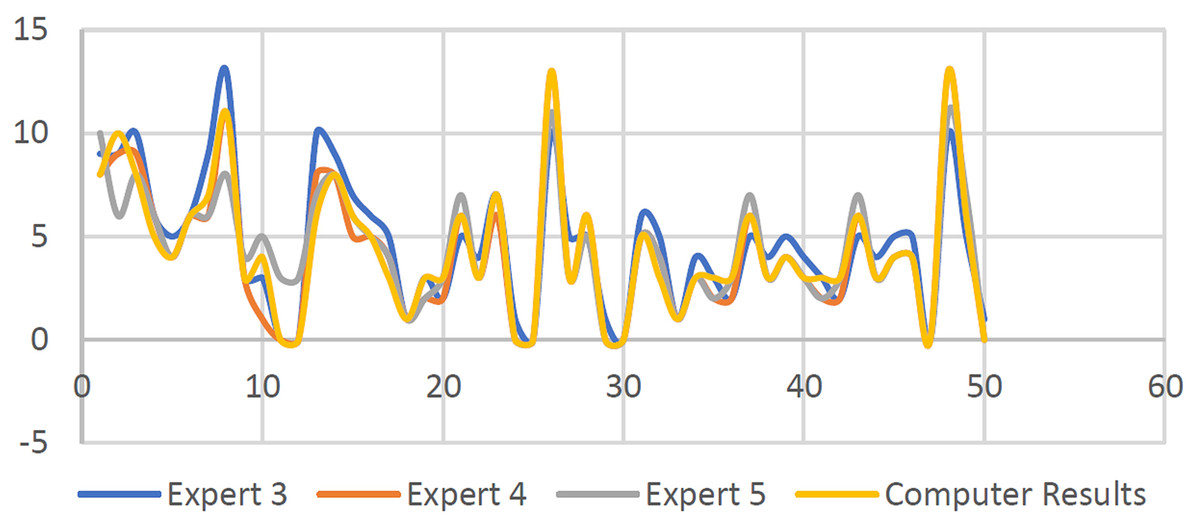
Figure 28: Number of accelerations for 50 semi-synthetic signals.
Furthermore, as illustrated in Fig. 29, the clinical signals (S101–S150) are employed in the algorithm for estimating the number of accelerations. In comparison to the visual results estimation made by the three experts, it was observed that the results attained showed that the worst difference was (+/−6). Overall, as illustrated in Figs. 28 and 29, the obtained output outcomes are close to the estimated findings provided by the three expert panels, especially the accelerations number with a difference in accelerations of (1 or 2 +/−). Due to disparities in expert experience and established rules, various exceptions occur in the worst circumstances.
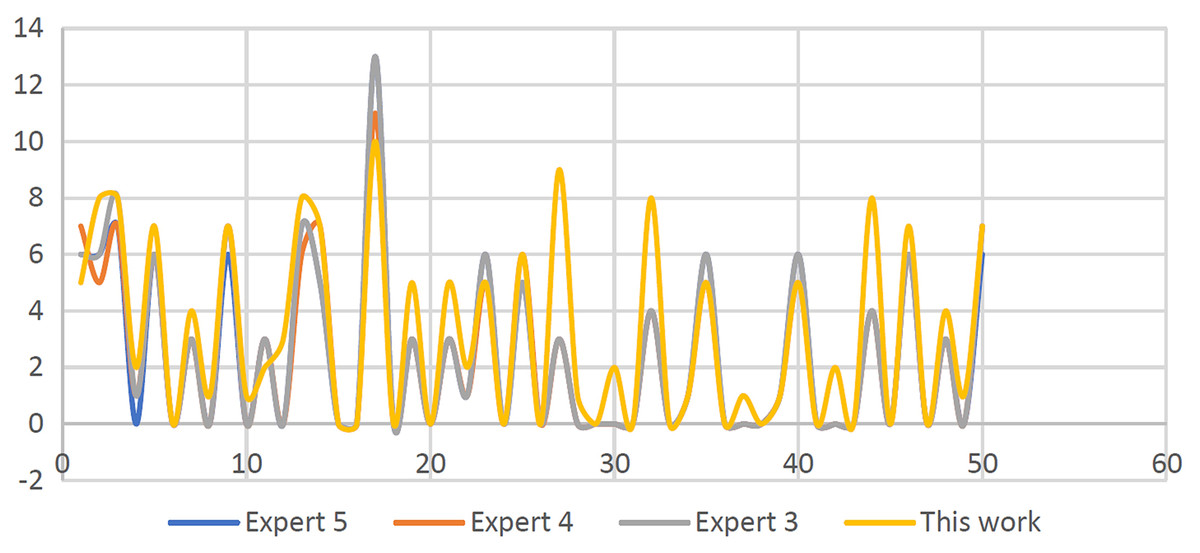
Figure 29: Number of acceleration results for 50 clinical signals.
Deceleration identification results
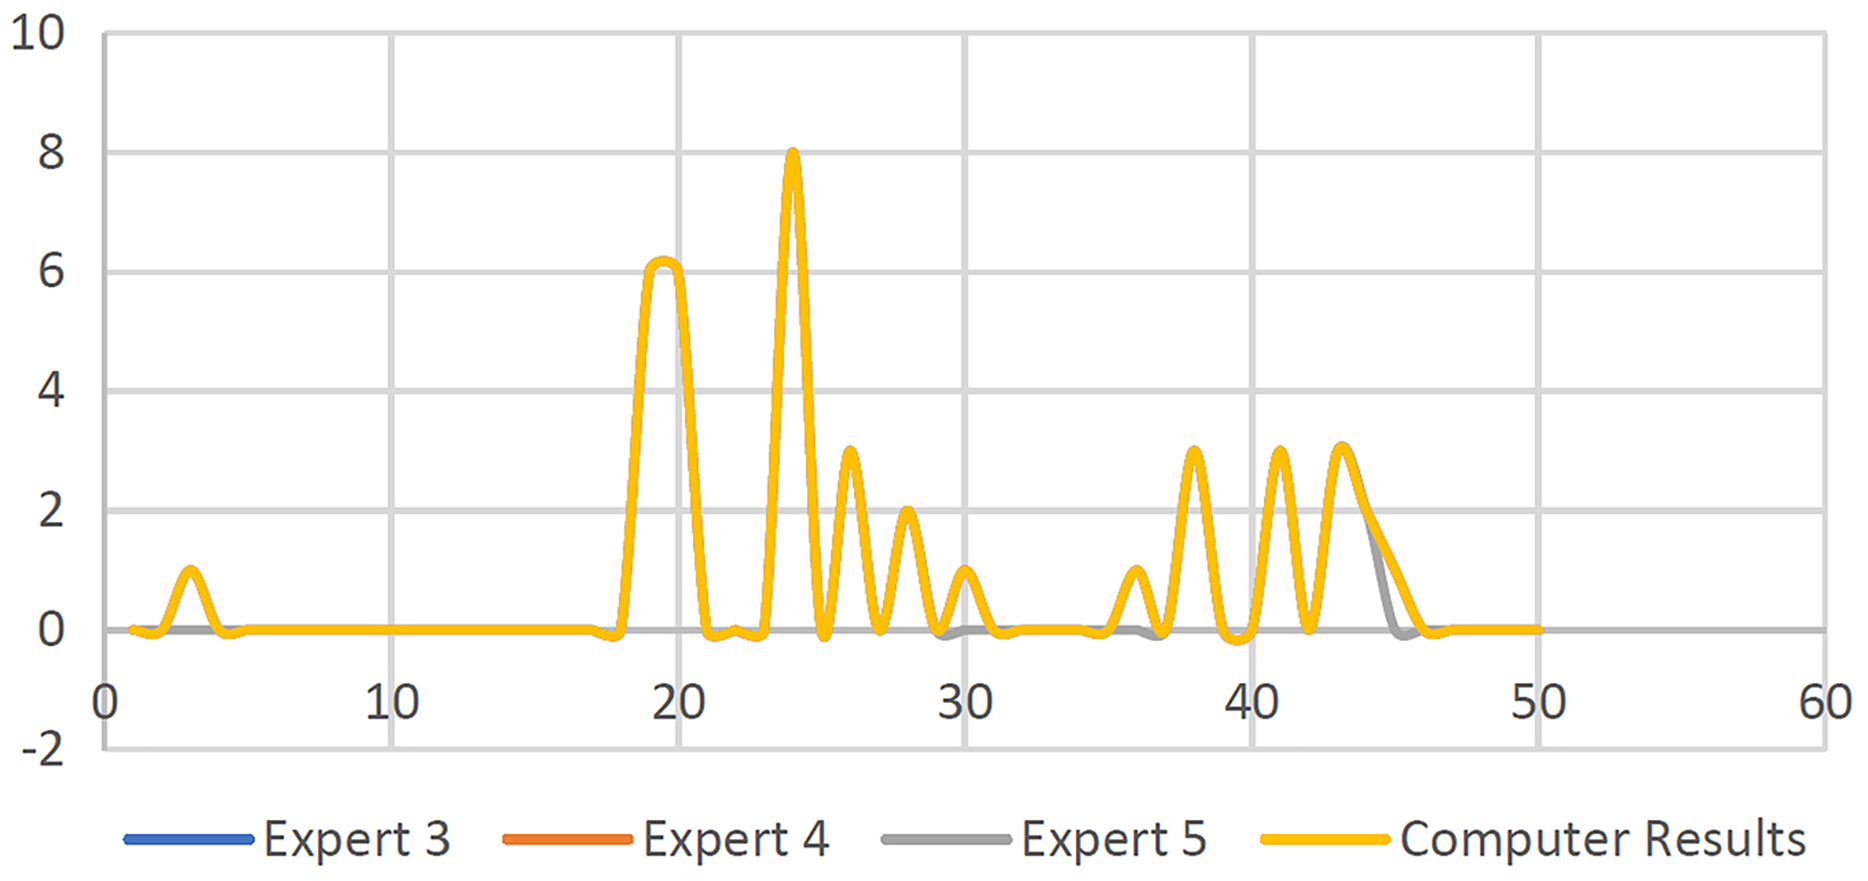
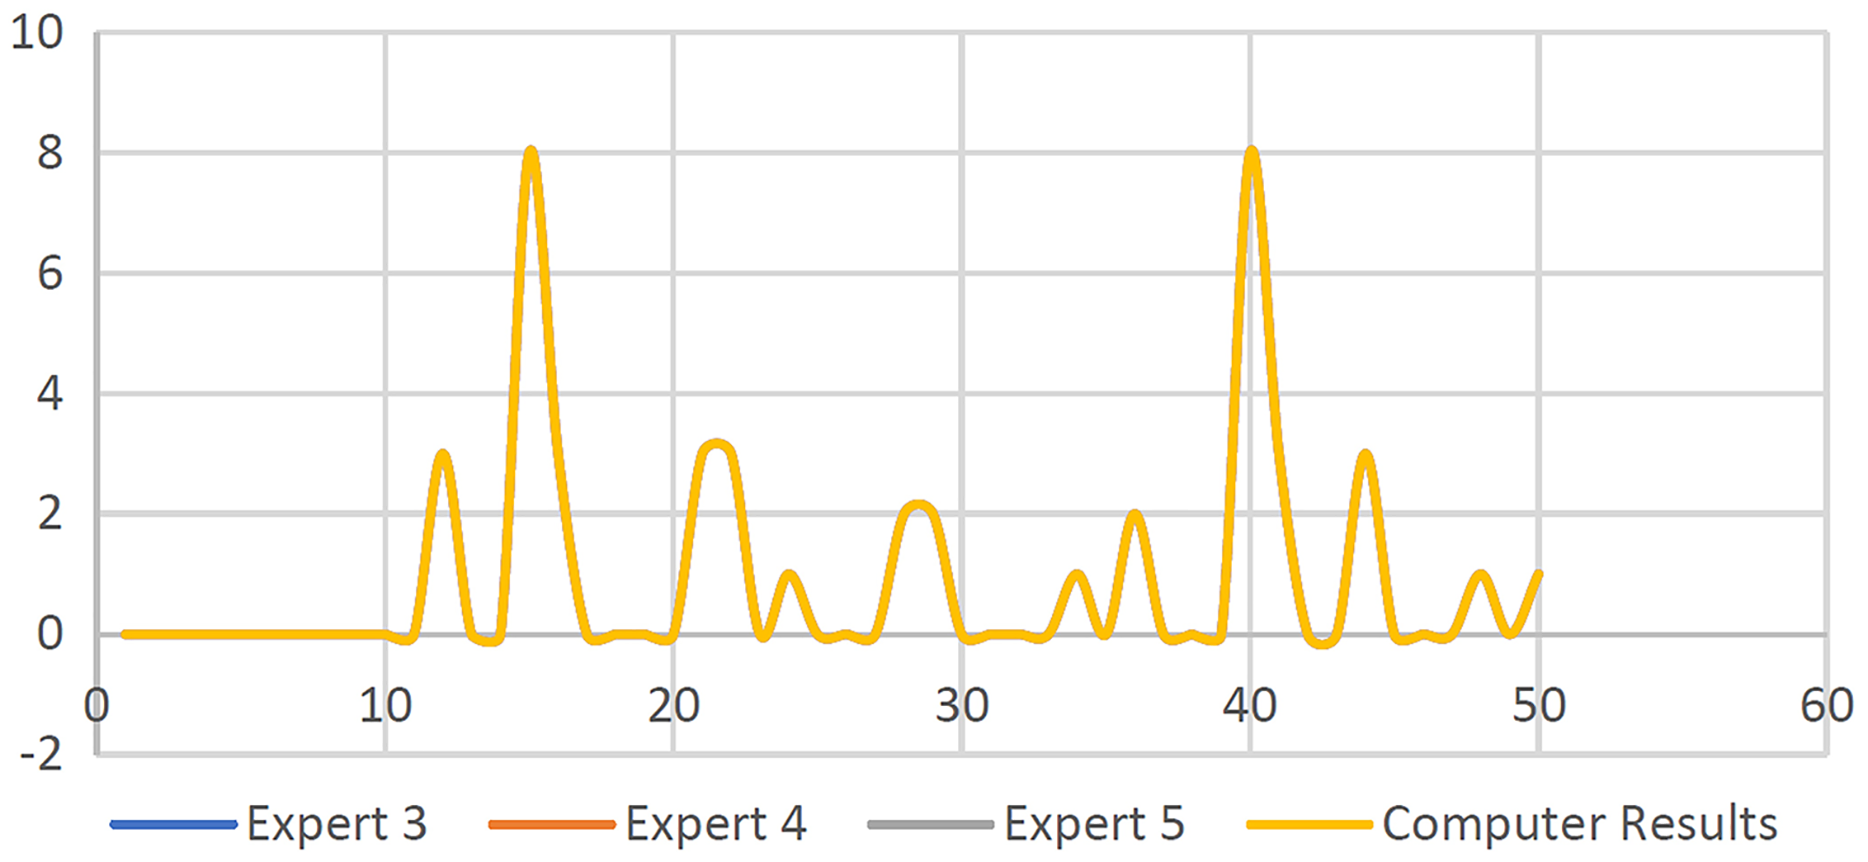
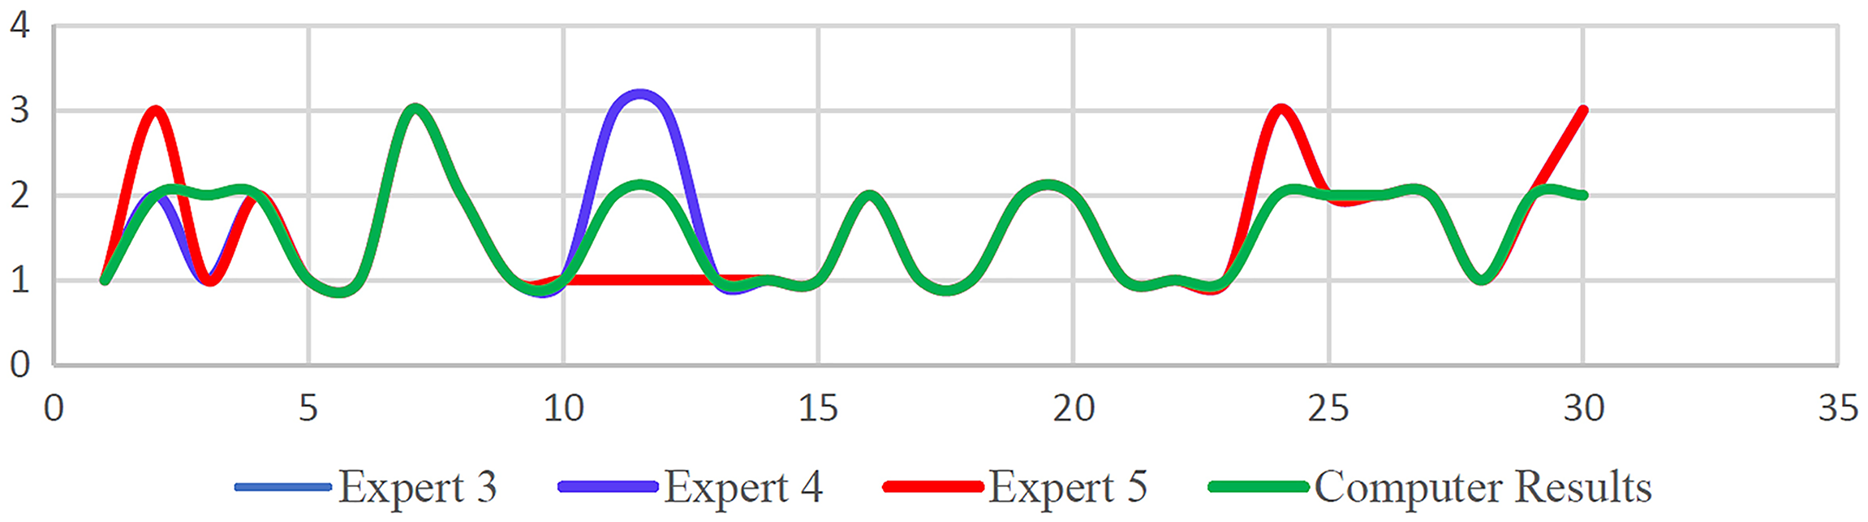
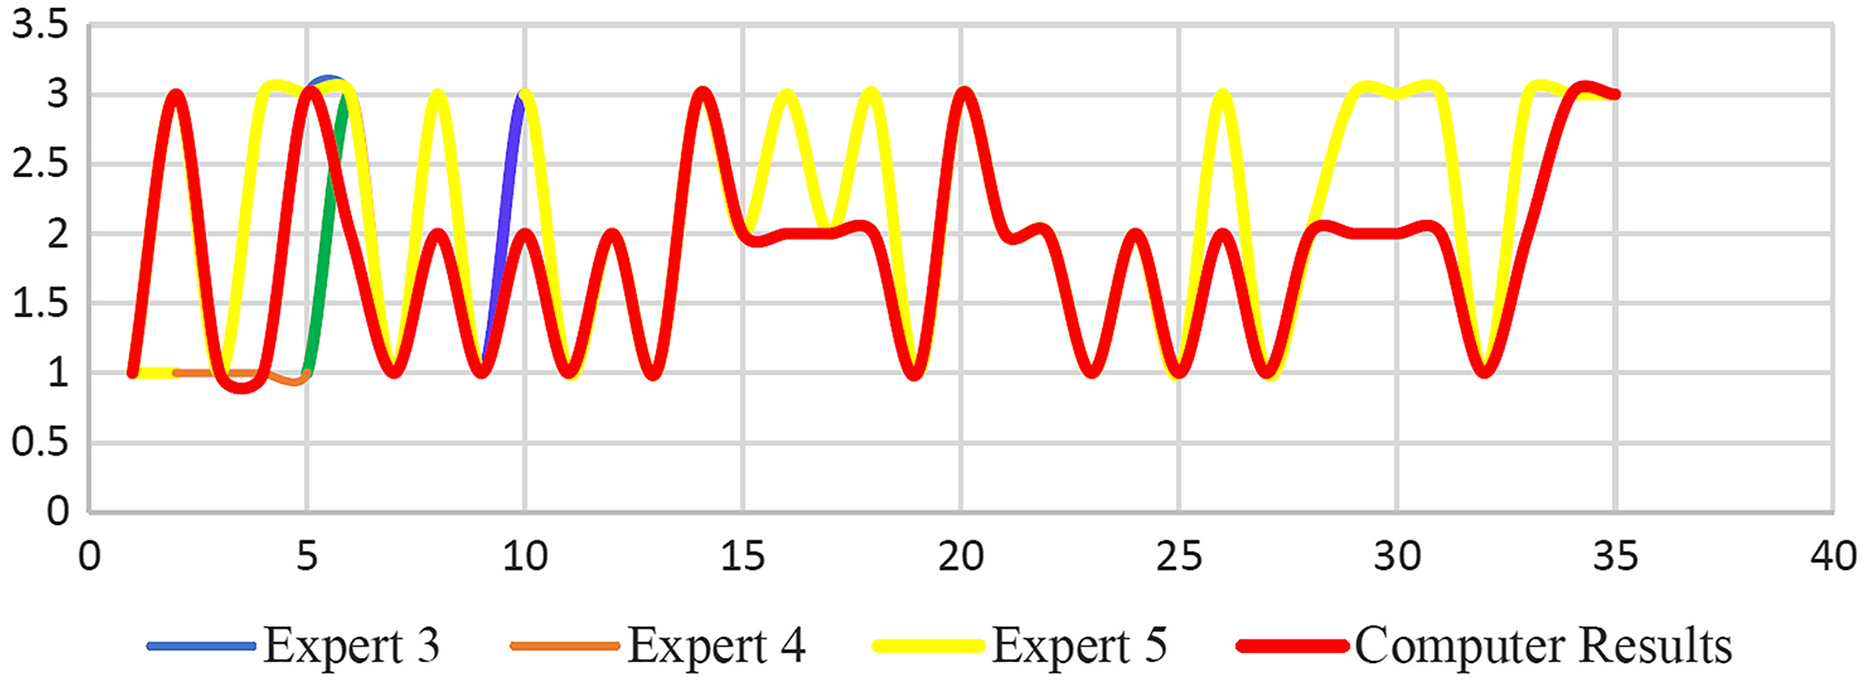
Additionally, in this section, the identification algorithm developed is evaluated using output results of decelerations that involved the total numbers and types. Here the proposed algorithms are used to compute the total number of decelerations based on every 30-min occurrence in the CTG pattern and further identified to be early (E) or late (L) decelerations category. The output findings for S50–S100 are shown in Fig. 30. The second set of data, S101–S150, is then utilized to estimate the number and kind of decelerations using the proposed algorithm, as shown in Fig. 31 Based on the findings obtained, as shown in Figs. 30 and 31, the entire output results are close to the value evaluated by the expert panels based on the kind of deceleration (Late or early) deceleration.
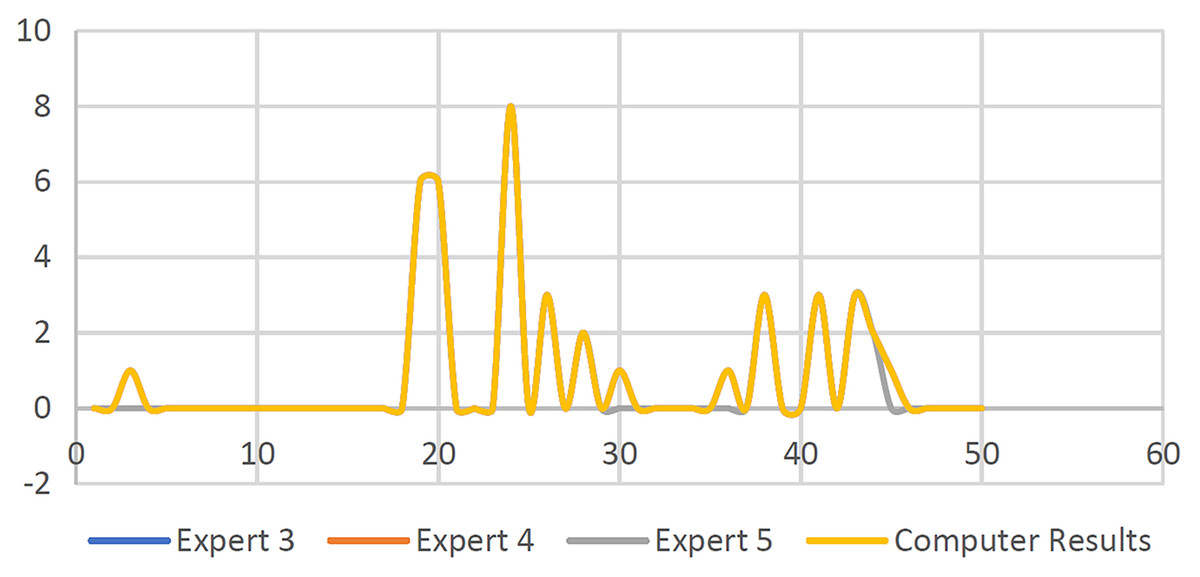
Figure 30: Number of decelerations for 50 synthetic signals.
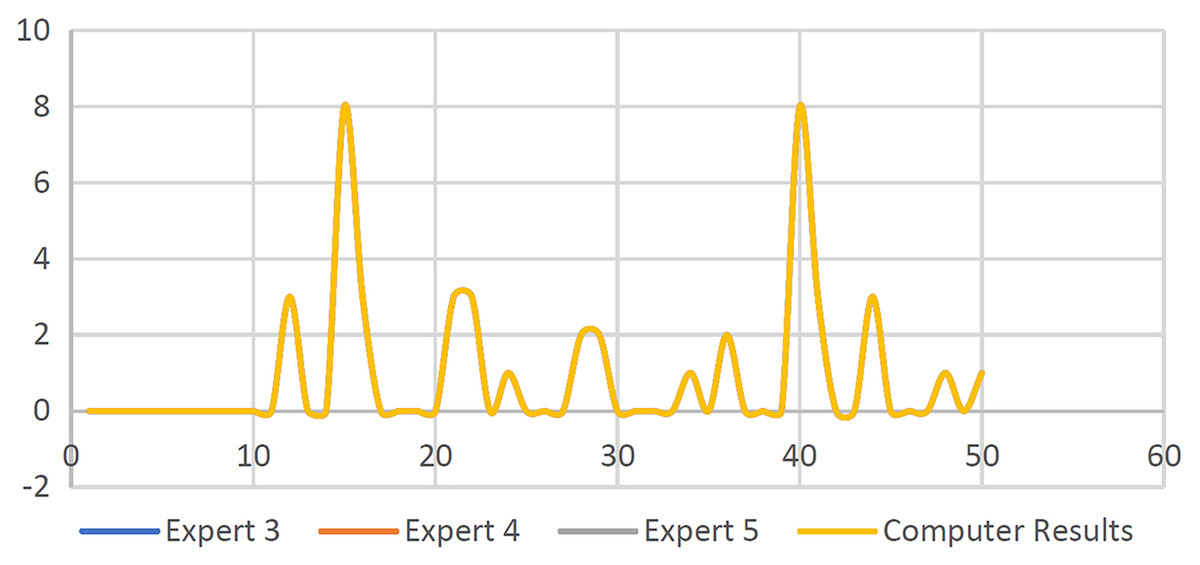
Figure 31: Number of clinical signal deceleration findings.
Results of the CTG classification
In this section, the fuzzy logic toolbox built-in MATLAB is employed for classification purposes. Figure 32 illustrates the results of classification using synthetic CTG signals specifically S50–S100 where (P) is for pathological, (N) for normal, and (S) is for suspicious or abnormal. As shown in Fig. 32, there was no substantial difference between the visual perception of experts and the algorithm classification results, according to the findings.
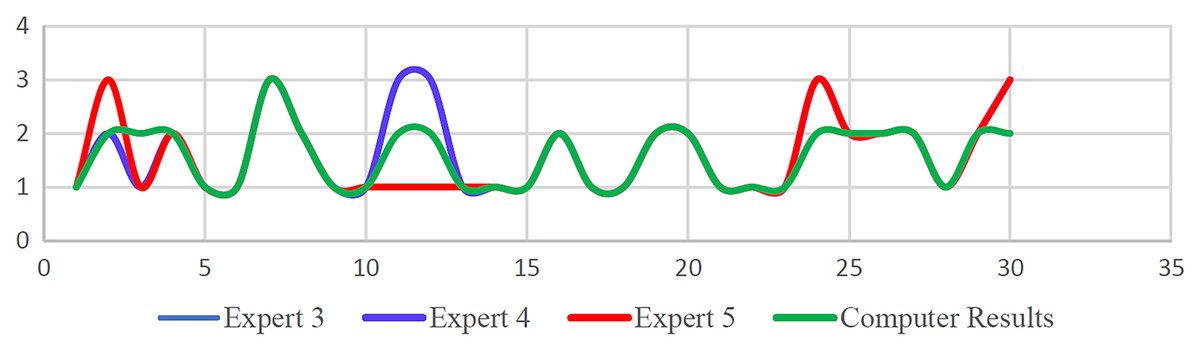
Figure 32: CTG classification findings using a rule-based method for 50 synthetic signals.
Furthermore, Fig. 32 shows the results based on 50 clinical signals vs three expert panels’ interpretations. Both Figs. 32 and 33 showed minimal differences for the CTG signal classification results upon the comparison of the computational results made by the proposed algorithm vs the expert panels’ interpretation results. Once again this is due to the difference in guidelines adopted by each infirmary and hospital.
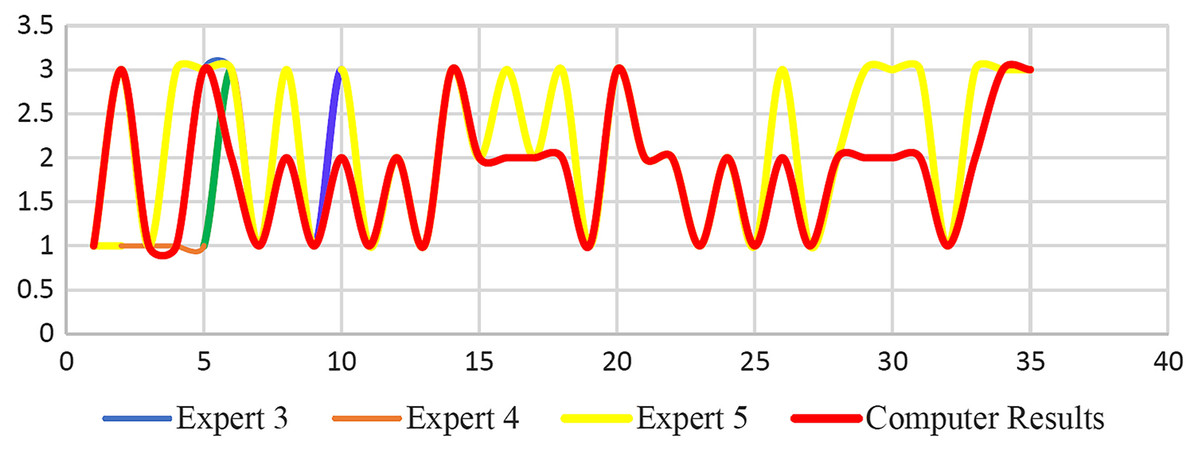
Figure 33: Fuzzy logic CTG classification findings for 50 clinical signals.
Statistical analysis of classified CTG data
Finally, the statistical analysis is used to validate the effectiveness of the proposed algorithm specifically the classification accuracy of the CTG signals vs the three expert panels’ estimation results using the Kappa score. Table 6 tabulated the results obtained that showed encouraging high kappa value based on the proposed algorithms and the expert panels’ visual interpretation results, in addition to the category of agreement.
Discussion
In this research, a method for automated FHR feature extraction using computers and CTG classification was used to imitate the assessments of obstetricians. FHR characteristics are retrieved using an algorithm designed under the RCOG principles. The application of the RCOG principles in the assessment of FHR characteristics resulted in a more systematic and structured method to CTG categorization. CTG classification is implemented using the statement of a rule in MATLAB source codes following the RCOG guideline. A MATLAB fuzzy logic tool was also used to implement the classification. Furthermore, the effectiveness of the developed algorithms is evaluated by comparing the results with those of experts’ visual interpretation which showed satisfactory levels of performance. Validation of the classification results obtained was carried out using statistical evaluation.
Conclusions
A new enhancement technique for CTG signals has been proposed along with several techniques of feature extraction as well as a classification approach for FHR signals. To begin, the morphological characteristics were retrieved and categorized according to the RCOG recommendations. RCOG guideline is used to ensure that the proposed classification of the CTG and the FHR features interpretation is done based on the baseline and acceptable and systematized approach. Next, the evaluation and validation in testing the effectiveness and robustness of the proposed algorithms developed in the MATLAB platform are done by comparing the results attained vs the expert panels’ visual interpretation results. The results attained were promising and showed that the proposed algorithm is indeed suitable and reliable. This is based on the output findings, which revealed that there is the absence of substantial difference between the suggested technique and the visual interpretation of expert panels. Concerning the synthetic CTG signals, it is observed that there are slight differences for the clinical CTG signals during the validation stage. Next, the newly proposed enhancement algorithms for the CTG signals were evaluated and validated as well to ensure that the developed algorithm could handle and compensate for the missing values, as well as remove or eliminate noise due to high frequency. The method’s efficacy is assessed using a comparative analysis of different signal enhancement approaches used in the past, as well as scores from three expert panels on the visual consistency of the resulting signals. Finally, is the feature extraction and classification methods proposed for the FHR signals that comprised of FHR feature extraction from the deconstructed FHR signals elements and the categorization through the utilization of the MATLAB platform’s built-in fuzzy logic toolbox. According to the accuracy performance attained, it is proven that the proposed method worked well based on the prediction that employed the visual classification results of the three expert panels, specifically by the obstetricians. This is further supported by the findings of the statistical analysis that confirmed the classification accuracy conducted by the three expert panels’ visual interpretation results along with the Kappa score of 0.926, 0.926, 0.671, and 0.688, 0.607 and 0.650, accordingly, for clinical and synthetic CTG signals. Even though the acquired findings proved the practicality of the created procedures, they require additional validation on a bigger set of data before they can be employed in everyday clinical practice.